Embed Size (px)
Citation preview

123
14th
Conf. Agric. Develop. Res., Fac. of Agric., Ain Shams Univ., March, 2019, Cairo, Egypt
Special Issue, 27(1), 123 - 134, 2019 Website: http://strategy-plan.asu.edu.eg/AUJASCI/
SOLAR HEATING SYSTEM USING PARABOLIC COLLECTOR FOR THER-MAL OPTIMUM CONDITIONS OF BIOGAS PRODUCTION IN WINTER
[12] Sara M. El-Husseini, Mostafa M.M., El-Gindy A.M. and Anwar A.A.
Agric. Engineering Dept., Fac. of Agric., Ain Shams Univ., P.O. Box 68, Hadyek Shoubra 11241, Cairo, Egypt
*Corresponding author: [email protected]
Received 19 February , 2019, Accepted 11 March, 2019
ABSTRACT
The aim of this study is to enhance the fermen-
tation temperature inside the digester by supplying
the required thermal energy to be within the de-
sired optimum range (mesophilic range) for biogas
production during winter “cold days”. Two 50 L
digesters were used in the experiment that was
conducted at Solar Energy Laboratory, Department
of Agricultural Engineering, Faculty of Agriculture,
Ain Shams University, Cairo. One is a treatment
digester and the other is a control digester. The
treatment digester is thermally enhanced by a par-
abolic trough collector, while the control digester
operated at the ambient temperature. The experi-
ment was conducted through December 2018 and
January 2019. The results show that the average
temperature in the control digester through the
experiment was 21.5°C, while in the treatment di-
gester it was 27.08°C. This means that the para-
bolic trough collector enhanced the fermentation
temperature in the treatment digester by 20.6%.
The total biogas yield of the control digester and
the treatment digester was 9684.7 mL/kg. T.S. and
24649.69 mL/kg. T.S. respectively. By comparing
both productivities, it was found that the productivi-
ty of the treatment digester was 2.5 times more
than the productivity of the control digester.
Keywords: Anaerobic digestion, Biogas productivi-
ty, Fermentation temperature, solar energy, para-
bolic trough, heat exchanger, solar tracking, con-
trol unit.
INTRODUCTION
Energy has a notable significance in our life.
Despite the technological advances, there are
some developing countries that still lack access to
a secure energy source. Around 3 billion people
from these countries still rely on conventional
means to fulfill their energy requirements for cook-
ing. Their basic energy needs are fulfilled by burn-
ing biomass resources such as firewood, crop res-
idues, and animal manure. Although this method
helps them to meet some of their energy demands,
burning biomass and similar practices cause seri-
ous environmental, social, economic and public
health issues. Thus, to secure their energy needs,
it is important to search for another clean, feasi-
ble, and renewable energy alternative (Surendra
et al 2014).
In spite of the fact that Egypt is on the top of
the non-OPEC nations in oil production in Africa
and comes in the third place in dry natural gas
production, Egypt imports oil products to meet the
growing oil demands (EIA, 2018). Many factors
had led to this growing energy demand such as
population growth, whereas Egypt is the third-
largest population in Africa (EIA, 2015). In 2016,
Egypt came in the first place in oil and natural gas
consumption in the continent. It consumed 22% of
oil and other liquids consumption and 37% of dry
natural gas consumption in Africa (EIA, 2018).
Searching for a sustainable energy alternative
has become a decisive issue. Among the different
renewable energy sources, biogas is a promising
alternative for fossil fuel. Anerobic digestion (AD)
process generates biogas (Fang, 2010). Also, AD
is used as an environmentally friendly technique to
manage organic wastes such as animal dung, crop
residues, sewage, food processing residues, and
others (Dong and Lu, 2013).
The AD process is influenced by different fac-
tors such as fermentation temperature, C/N ratio,
and pH value. The fermentation temperature af-

124
AUJAS, Ain Shams Univ., Cairo, Egypt, Special Issue, 27(1), 2019
Sara El-Husseini, Mostafa, El-Gindy and Anwar
fects both the produced biogas quality and quanti-
ty. Thus, it is a critical factor. Biogas can be pro-
duced within three wide temperature ranges: psy-
chrophilic (lower than 25°C), mesophilic (25°C –
45°C), and thermophilic (45°C – 70°C) (Seadi et al
2008). In Egypt, the ambient temperature in winter
months is usually between 10°C and 20°C
(weather.com), which is not suitable for biogas
production. Not only the low temperature degrees
lead to low biogas production rates, but also the
fluctuations in fermentation temperature that ex-
ceeds 2- 3°C per hour (Feng et al 2015). In order
to guarantee the steadiness of temperature, and
also achieve the desired optimal temperature, an
external heat source must be used (Alkhamis et
al 2000). The thermal energy can be obtained from
several sources such as boilers and electric heat-
ers. Also, some of the produced biogas can be
used to supply the digester with the required heat.
These methods can supply effectively the required
temperature, but due to the high ener-
gy consumption these methods are not economical
(Dong and Lu, 2013). Other alternatives such as
solar energy is relatively economical source for
heating purposes (Lu et al 2015) especially with
the abundance of solar radiation during the entire
year in Egypt. Thus, more researches are directed
to studying and evaluating the feasibility of using
solar energy as an aiding thermal energy source
inside the biogas digester.
In this study a parabolic trough collector is used
to enhance the fermentation temperature inside
the biogas digester to be within the required opti-
mum range (mesophilic range) in winter.
MATERIALS AND METHODS
The experiment was conducted at Solar Energy
Laboratory, Department of Agricultural Engineer-
ing, Faculty of Agriculture, Ain Shams University,
Egypt, which is located at latitude of 30° 06' N and
longitude of 31°14' E from December 2018 to Jan-
uary 2019.
A block diagram for the process is shown in
Fig. (1), it consists of three main components:
(1) digestion system, (2) parabolic trough collector
(PTC), and (3) sun tracking system.
Fig. 1. Block diagram for the system process
Fig. (1): Block diagram for the system process
Solar Parabolic trough collector
Water
tank
Heat
exchanger
(1)
(2)
Heat exchanger
Sun tracking system
Pump
(3)
Digester Biogas
Temperature
sensor
Temperature
controller
Mixer Timer

125
AUJAS, Ain Shams Univ., Cairo, Egypt, Special Issue, 27(1), 2019
Solar heating system using parabolic collector for thermal optimum conditions of biogas production in winter
1. The digestion system
1.1. Digesters
The digestion unit is the essential component
of biogas process. Two vertical polyethylene bar-
rels, each one of net volume 50 liters, were turned
into experimental biogas digesters. The first di-
gester is the treatment unit with effective volume of
40 liters. It is equipped with heat exchanger, me-
chanical stirring shaft, and a gas outlet was in-
stalled at the cap of the digester. The second di-
gester is the control unit. It is just equipped with
the gas outlet tube. The caps of both digesters
were sealed into the digesters by using thermal
silicon that acts as a gasket to prevent any fluid
leakage. Fig. (2) shows the dimensions and a pho-
tography picture for the treatment digester.
1.2. Feedstock
The used feedstock was cow manure. It is col-
lected from a farm in El-Kanater. The manure was
mixed with water in the ratio of 1:1 to obtain 10%
total solids (T.S.). The feedstock was added into
the digester at the beginning of the experiment in a
batch mode.
1.3. Agitation and Mixing
The agitation process is carried out by an elec-
trical motor. The motor specifications are as fol-
lows: model (Electric Motor Type: 4256R2), power
(12 Hp), AC (220 V), frequency (50 Hz), and rota-
tional speed (35 RPM).
The motor is installed on the top of the treat-
ment digester cap and connected with the stirring
shaft. The stirring shaft has three blades of length
100 mm that are uniformly distributed along the
shaft. The blades are soldered on the shaft with 45
° angle. The distance between the digester floor
and the stirring shaft is 20 mm. Grease was added
to fill the clearance between the stirring shaft and
the digester cap.
1.4. Heat exchanger
A copper serpentine is installed inside the di-
gester near its wall by clearance of 13.5 mm from
both sides. The number of coils is 9 with diameter
of 330 mm.
1.5. Thermal insulation
To minimize the thermal losses, a glass wool
with 2.5 mm is used to insulate the digester and
the pipes connecting the digester by the pump and
parabolic trough.
1.6. Gas collection and measurement system
The gas was measured on daily basis via the
displacement method at the ambient temperature
and atmospheric pressure. Two cylinders are used
as the gas collection unit. The first cylinder has a
diameter of 152.4 mm and length of 1500 mm and
closed with a cap from the bottom. It is filled with
water. The second cylinder is fitted in the first cyl-
inder. It has the diameter of 101.6 mm and length
of 1300 mm. It is closed with a cap from the up-
ward side and graduated to determine the volume
of the produced biogas. The digester is connected
to the second cylinder with an 8 mm flexible plastic
hose.
1.7. The heat balance of the treatment digester
The heat balance equation for the system (as-
suming the effluent heat and reaction heat to be
negligible (Yuan et al 2011)) can be calculated as
follows:
(1)
Where: heat load
: rate of heat transfer to manure
: rate of heat loss through digester walls,
floor, and top to the surrounding environment
1.7.1. The heat requirement for the manure: (2)
Where: : mass of the slurry
: the specific heat capacity and approximated
for water
: the temperature of the slurry
: the temperature of fermentation
1.7.2. The heat dissipated to the environment
(Yang and Tao, 1998):
a- From the wall of the digester:
Where: : overall heat transfer coefficient, (W m-2
K-1
);
: heat transfer coefficient between
manure and the inner wall of the digester, and the
outside convection heat transfer coefficient respec-
tively; (W m-2
k-1
),
: heat conductivity coefficients of the
digester and the insulation respectively; (W m-1
k-
1),

126
AUJAS, Ain Shams Univ., Cairo, Egypt, Special Issue, 27(1), 2019
Sara El-Husseini, Mostafa, El-Gindy and Anwar
Fig. 2. Treatment digester dimensions and photography picture
3
1
4
5
2
2
Treatment digester plane
Treatment digester elevation
Dim in mm

127
AUJAS, Ain Shams Univ., Cairo, Egypt, Special Issue, 27(1), 2019
Solar heating system using parabolic collector for thermal optimum conditions of biogas production in winter
: diameter of each layer; (m).
b- From the top of the digester:
c- From the bottom of the digester:
Where: : thicknesses of the digester and
insulation respectively; (m).
Where: : area of the top, sides, and bot-
tom of the digester; (m),
: ambient temperature; (K).
2. Parabolic trough collector (PTC)
The solar parabolic trough is the used solar
concentrator, which is illustrated in Fig. (3). It is
made of reflective stainless-steel sheet. It is 4710
mm long and 1.5 mm thick. An evacuated tube is
located at the focal line.
Fig. 3. Parabolic trough collector dimensions
2.1. Optical analysis of the parabolic trough
(Fig. 4)
The geometrical concentration ratio ( is
calculated as follows:
=
(6)
Where: Aa: aperture area, (m2);
Ar: receiver area, (m2);
: Parabola width, (m);
: absorber length, (m);
: the outer diameter of the evacuated tube,
(m);
the outer diameter of the serpentine, (m).
The focal length of the parabola is calculated
as follows:
Where: h is the depth of the parabola, (m).
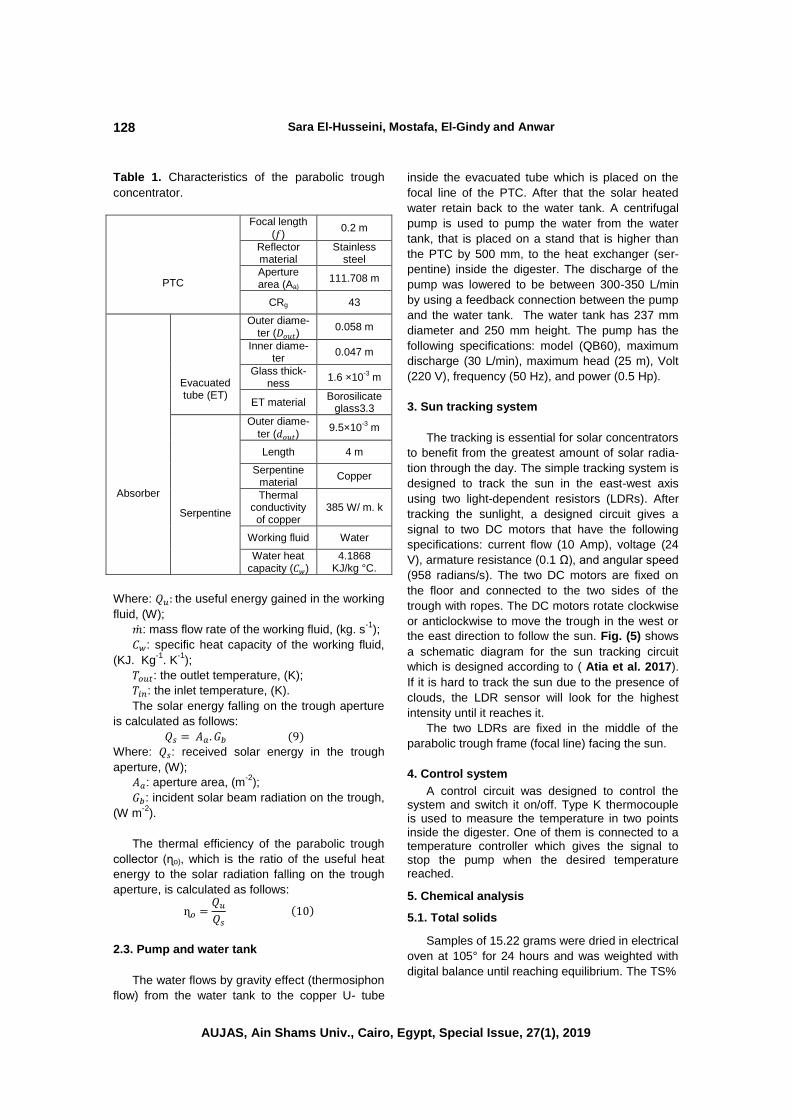
The characteristics of the parabolic trough con-
centrator are shown in Table (1).
Fig 4. Design parameters of parabolic trough col-lector (Al Qateimat, 2011).
2.2. Parabolic trough thermal efficiency (Kalo-
girou, 2004)
The useful energy is calculated as follows:
128
AUJAS, Ain Shams Univ., Cairo, Egypt, Special Issue, 27(1), 2019
Sara El-Husseini, Mostafa, El-Gindy and Anwar
Table 1. Characteristics of the parabolic trough
concentrator.
PTC
Focal length
( ) 0.2 m
Reflector material
Stainless steel
Aperture area (Aa)
111.708 m
CRg 43
Absorber
Evacuated tube (ET)
Outer diame-ter ( )
0.058 m
Inner diame-ter
0.047 m
Glass thick-ness
1.6 ×10⁻³ m
ET material Borosilicate
glass3.3
Serpentine
Outer diame-
ter ( ) 9.5×10
-3 m
Length 4 m
Serpentine material
Copper
Thermal conductivity of copper
385 W/ m. k
Working fluid Water
Water heat capacity ( )
4.1868 KJ/kg °C.
Where: the useful energy gained in the working
fluid, (W);
: mass flow rate of the working fluid, (kg. s-1
);
: specific heat capacity of the working fluid,
(KJ. Kg-1
. K-1
);
: the outlet temperature, (K);
: the inlet temperature, (K).
The solar energy falling on the trough aperture
is calculated as follows:
Where: : received solar energy in the trough
aperture, (W);
: aperture area, (m-2
);
: incident solar beam radiation on the trough,
(W m-2
).
The thermal efficiency of the parabolic trough
collector (ɳo), which is the ratio of the useful heat
energy to the solar radiation falling on the trough
aperture, is calculated as follows:
2.3. Pump and water tank
The water flows by gravity effect (thermosiphon
flow) from the water tank to the copper U- tube
inside the evacuated tube which is placed on the
focal line of the PTC. After that the solar heated
water retain back to the water tank. A centrifugal
pump is used to pump the water from the water
tank, that is placed on a stand that is higher than
the PTC by 500 mm, to the heat exchanger (ser-
pentine) inside the digester. The discharge of the
pump was lowered to be between 300-350 L/min
by using a feedback connection between the pump
and the water tank. The water tank has 237 mm
diameter and 250 mm height. The pump has the
following specifications: model (QB60), maximum
discharge (30 L/min), maximum head (25 m), Volt
(220 V), frequency (50 Hz), and power (0.5 Hp).
3. Sun tracking system
The tracking is essential for solar concentrators
to benefit from the greatest amount of solar radia-
tion through the day. The simple tracking system is
designed to track the sun in the east-west axis
using two light-dependent resistors (LDRs). After
tracking the sunlight, a designed circuit gives a
signal to two DC motors that have the following
specifications: current flow (10 Amp), voltage (24
V), armature resistance (0.1 Ω), and angular speed
(958 radians/s). The two DC motors are fixed on
the floor and connected to the two sides of the
trough with ropes. The DC motors rotate clockwise
or anticlockwise to move the trough in the west or
the east direction to follow the sun. Fig. (5) shows
a schematic diagram for the sun tracking circuit
which is designed according to ( Atia et al. 2017).
If it is hard to track the sun due to the presence of
clouds, the LDR sensor will look for the highest
intensity until it reaches it.
The two LDRs are fixed in the middle of the
parabolic trough frame (focal line) facing the sun.
4. Control system
A control circuit was designed to control the system and switch it on/off. Type K thermocouple is used to measure the temperature in two points inside the digester. One of them is connected to a temperature controller which gives the signal to stop the pump when the desired temperature reached.
5. Chemical analysis
5.1. Total solids
Samples of 15.22 grams were dried in electrical
oven at 105° for 24 hours and was weighted with
digital balance until reaching equilibrium. The TS%

129
AUJAS, Ain Shams Univ., Cairo, Egypt, Special Issue, 27(1), 2019
Solar heating system using parabolic collector for thermal optimum conditions of biogas production in winter
Fig. 5. Schematic of the electronic circuit of sun-tracking system
was calculated from the following formula (APHA,
1999):
Where: : fresh mass;(kg),
: mass of total solids; (kg).
5.2. Organic total solids
The dried samples that were used to determine
the total solids were dried one more time in a muf-
fle oven at 560° C and was calculated from the
following formula:
Where: Mash is the ash mass; (kg).
The following formula was used to calculate the
organic total solids in kilograms:
(13)
The characteristics of the cow manure is shown
in Table (2).
Table 2. Chemical analysis of cattle dung
Total solids TS% 14.3%
Organic total solids OTS% 13.9%
6. Animal wastes
The total feedstock that was fed into the di-
gester in batch form was 40 liters including water.
The formula used to calculate the amount of water
to be added so that to reach the desired TS% is:
(
)
Where:
Y: dilution volume, (liter);
X: amount of raw material added, (kg);
Ts1: total solid of raw material;
Ts2: total solid of fermentation material.
RESULTS AND DISCUSSION
This study was about utilizing solar energy in
providing biogas digester with the desired tem-
perature in the mesophilic range. The heat gained
from the PTC enhanced the performance of the
anaerobic bacteria. The used solar energy tech-
nique was a PTC with an evacuated tube. The
experiment included two digesters, the treatment
digester which was thermally enhanced by PTC,
and the control digester which was without any
thermal enhancement. The two digesters were
set-up in the same climatic conditions. The results
of biogas productivity for the two digesters were
compared.
The thermal performance
Fig. (6) illustrates the variation of the parame-
ters; solar radiation and absorber temperature as
function of time using sun- tracking mechanism.
The experiment started from 8 am till 4 pm. Aver-
age solar radiation ranged from 36.6W/m2 to 766.6
W/m2 through the day. The solar radiation reached
its peak at 12 pm. The temperature at the outlet of

130
AUJAS, Ain Shams Univ., Cairo, Egypt, Special Issue, 27(1), 2019
Sara El-Husseini, Mostafa, El-Gindy and Anwar
Fig. 6. The water temperature variation in the absorber.
the absorber increased due to the concentration of
solar radiation on the absorber. The variation in the
water temperature in the absorber reached its
peak from 10 am to 1 pm.
Fig. (7) shows the average hourly tempera-
tures during the experiment for both digesters. The
control digester is affected by ambient tempera-
ture, wind speed, and solar radiation. The treat-
ment digester is thermally insulated, and its tem-
perature is affected by the heat exchange process
between the water heated by PTC and manure.
The maximum average temperature reached in the
control digester was about 24.5°C from 1 pm until
2 pm, while the maximum average temperature
reached in the treatment digester was 32.2 °C at 1
pm. It’s obvious from the graph that the average
fermentation temperature of the control digester is
greatly affected by the average ambient tempera-
ture whereas the values for both of them are so
close.
The solar heating system increases the tem-
perature inside the digester by 20.6%. The tem-
perature starts to decrease in both digesters after
2 pm.
Fig. 7. Comparison of the average hourly temperatures between the control and treatment digesters
throughout the experiment

131
AUJAS, Ain Shams Univ., Cairo, Egypt, Special Issue, 27(1), 2019
Solar heating system using parabolic collector for thermal optimum conditions of biogas production in winter
Daily biogas production rate
The rate of biogas production for the treatment
digester and control digester is illustrated in Fig.
(8) throughout the experiment. Also, the graph
shows the effect of the fermentation temperature
on the biogas productivity. The average fermenta-
tion temperature in the treatment digester is higher
due to the supplied thermal energy from the PTC.
Through the productive days of the experiment the
average ambient temperature was about 21°C.
The first day for biogas collection started after
the six days of the experiment, whereas there
wasn’t any significant productivity in the first six
days. The biogas productivity increases with the
increase of the fermentation temperature. The
quantity of biogas produced from the treatment
digester is apparently greater than the control di-
gester, whereas the PTC could keep the fermenta-
tion temperature within the proper range most of
the time. Therefore, treatment process could be
performed more effectively. Also, it’s obvious from
the graph that the fermentation temperature im-
pacts the productivity greatly. The maximum
productivity for the control digester was 939.5 mL/
kg. T.S. and for the treatment digester was 1910.8
mL/ kg. T.S.
Accumulated productivity
Fig. (9) shows a comparison between the ac-
cumulative biogas production of both treatment
and control digesters. The accumulative productiv-
ity of the control digester was 9684.7 mL/ kg. T.S,
and the accumulative productivity of the treatment
digester was 24649.69 mL/ kg. T.S. This means
that the accumulative productivity of the treatment
digester is higher by about 2.5 times than that of
the control digester.
Thermal system performance
Fig. (10) shows the average overall thermal ef-
ficiency in the effective period from 8 am until 1 pm
for 15 days of the experiment. The average solar
radiation was 451.5 W/m2. The daily average use-
ful heat that was gained by the manure was 740.9
Wh.
Fig. 8. The relation between the biogas productivity of the control digester and the treatment digester and
the fermentation temperature of both digesters.

132
AUJAS, Ain Shams Univ., Cairo, Egypt, Special Issue, 27(1), 2019
Sara El-Husseini, Mostafa, El-Gindy and Anwar
Fig. 9. Quantities of accumulated biogas production for control and treatment digesters
Fig. 10. The system overall thermal efficiency
It is clear that the lowest thermal efficiency dur-
ing a day was 20.3 %, while the highest thermal
efficiency value was 43.3%.
CONCLUSION
Using solar energy collector of area 1.11708
m2 increased the fermentation temperature inside
the treatment digester through a heat transfer pro-
cess. This technique almost maintained the di-
gester fermentation temperature within the meso-
philic range and increased the temperature inside
the digester by 20.6%. Also, this technique in-
creased the biogas productivity, whereas the
treatment digester produced 24649.69 mL/ kg. T.S
which is 2.5 times higher more than the control
digester productivity which was 9684.7 mL/ kg.
T.S.
RECOMMENDATIONS
It can be recommended that:
1- Use another source for heat energy such
as; electrical heater to maintain the opti-
mum temperature continuously without fluc-
tuations in cloudy and partly cloudy days of
winter.

133
AUJAS, Ain Shams Univ., Cairo, Egypt, Special Issue, 27(1), 2019
Solar heating system using parabolic collector for thermal optimum conditions of biogas production in winter
2- Perform an economic analysis for the sys-
tem and compare it with the other alterna-
tives from the solar collectors.
REFERENCES
Alkhamis, T. M., El-Khazali R., Kablan M.M. and
Alhusein M.A. 2000. Heating of a biogas reac-
tor using a solar energy system with tempera-
ture control unit. Solar Energy, 69 (3), 239-
247.
Al Qteimat, A.M. 2011. Modeling and analysis of
the performance of a parabolic trough solar
concentrator, M.Sc. Thesis, Jordan Univ.,
Jordan, pp. 28-29.
APHA, 1999. Standard Methods for the Exami-
nation of Water and Wastewater. American
Public Health Association, American Water
Works Association, Water Environment Fed-
eration, Washington, D.C, USA, pp. 226-227
Atia, M.F., Mostafa M.M., El-Nono M.A. and Ab-
del-Salam M.F. 2017. Milk pasteurization using
solar concentrator with tracking device. Misr J.
Ag. Eng., 25 (4),1438-1453.
Dong, F. and Lu J. 2013. Using solar energy to
enhance biogas production from livestock
residue- A case study of the Tongren biogas
engineering pig farm in South China. Energy,
57, 759–765.
EIA, 2015. U.S. Energy Information
Administration. Country Analysis Brief:
Egypt, Washington, D.C, USA, pp. 1-10.
EIA, 2018. U.S. Energy Information Administration.
Country Analysis Brief: Egypt, Washington,
D.C, USA, 1 p.
Fang, C. 2010. Biogas production from food-
processing industrial wastes by anaerobic
digestion. Ph.D. Thesis, Dept. of Env. Eng.,
Tech. Univ. of Denmark, Kgs. Lyngby, Den-
mark 41 p.
Feng, R., Li J., Dong T. and Li X. 2015.
Performance of a novel household solar
heating thermostatic biogas system. Applied
Thermal Engineering, 96, 519-526.
Kalogirou, S.A. 2004. Solar thermal collectors and
applications, Progress in Energy and Com-
bustion Science, 30, 231-295.
Lu, Y., Tian Y., Lu H., Wu L. and Li X. 2015.
Study of solar heated biogas fermentation
system with a phase change thermal storage
device. Applied Thermal Engineering, 88,
418-424.
Seadi, T.A., Rutz D., Prassl H., Köttner M.,
Finsterwalder T., Volk S. and Janssen R.
2008. Biogas Handbook, 1st
Ed. Univ. of
Southern Denmark Esbjerg, Esbjerg,
Denemark, 23 p.
Surendra, K.C., Takara D., Hashimoto A. G. and
Khanal S.K. 2014. Biogas as a sustainable
energy source for developing countries:
Opportunities and challenges. Renewable and
Sustainable Energy Reviews, 31, 846–859.
Weather website: https://weather.com/ar-
EG/weather/monthly/l/EGXX0004:1:EG.
Yang, S.M. and Tao W.Q. 1998. Heat Transfer,
3rd
Ed., Higher Education Press, Beijing, Chi-
na pp. 207-212.
Yuan, S., Rui T. and Hong Y.X. 2011. Research
and analysis of solar heating biogas fermenta-
tion system. Procedia Environmental Sci-
ences, 11, 1386-1391.


لتنمية الزراعية،لبحوث االمؤتمر الرابع عشر
، القاهرة، مصر9102، مارس كلية الزراعة، جامعة عين شمس 9102، 011 - 091، مارسعدد خاص (،0) ددع (،92)جلدم
Website: http://strategy-plan.asu.edu.eg/AUJASCI/
134
]09[
*Corresponding author: [email protected]
Received 19 February, 2019, Accepted 11 March, 2019