Embed Size (px)
Citation preview
1
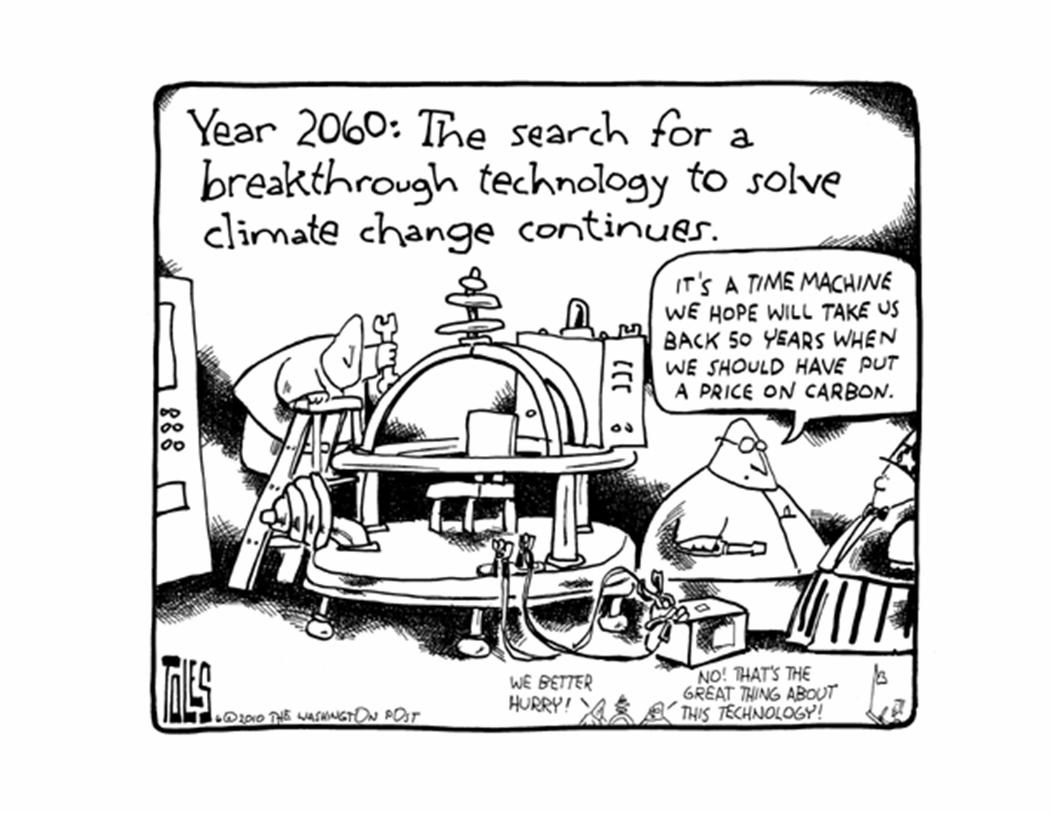
Solar geoengineering as a tool to manage climate risks
David Keith [email protected] • www.ucalgary.ca/~keith
Director, Energy and Environmental Systems GroupInstitute for Sustainable Energy, Environment and Economy
University of Calgary
31 January 2011Energy Seminar
Stanford University
2
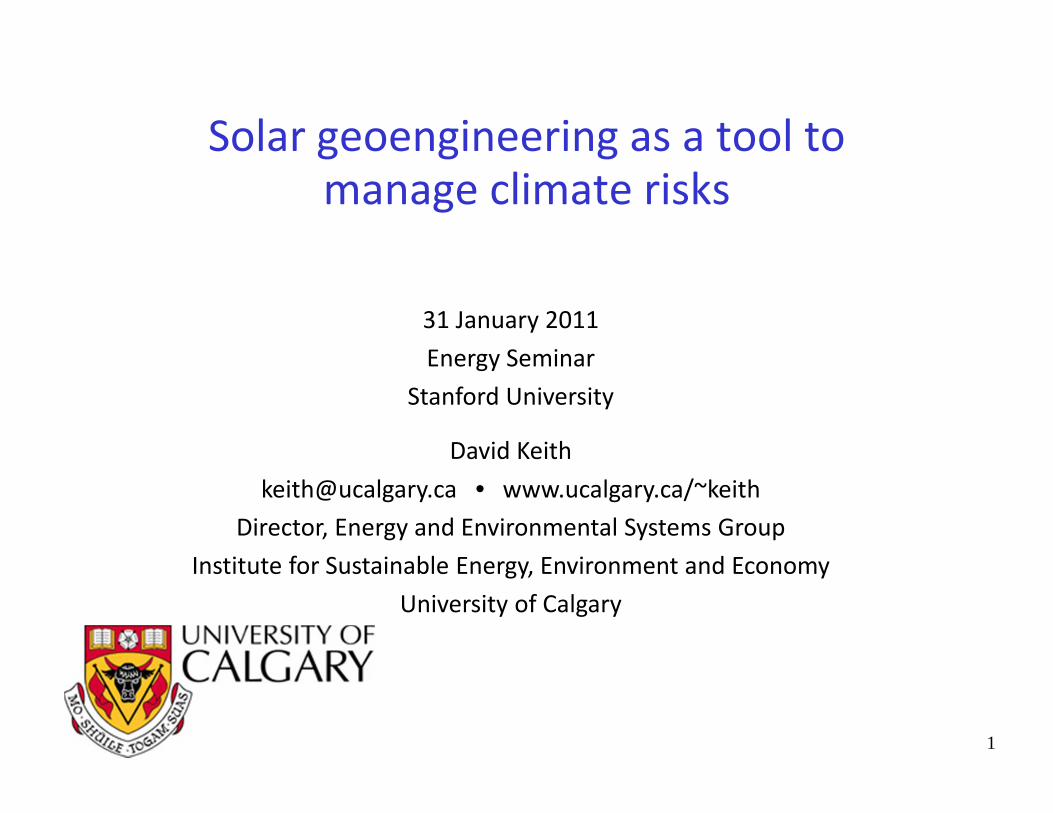
Geoengineering AdaptationMitigation
Human actions thatchange climate
ClimateSystem
Climate impact on human welfare
44
5
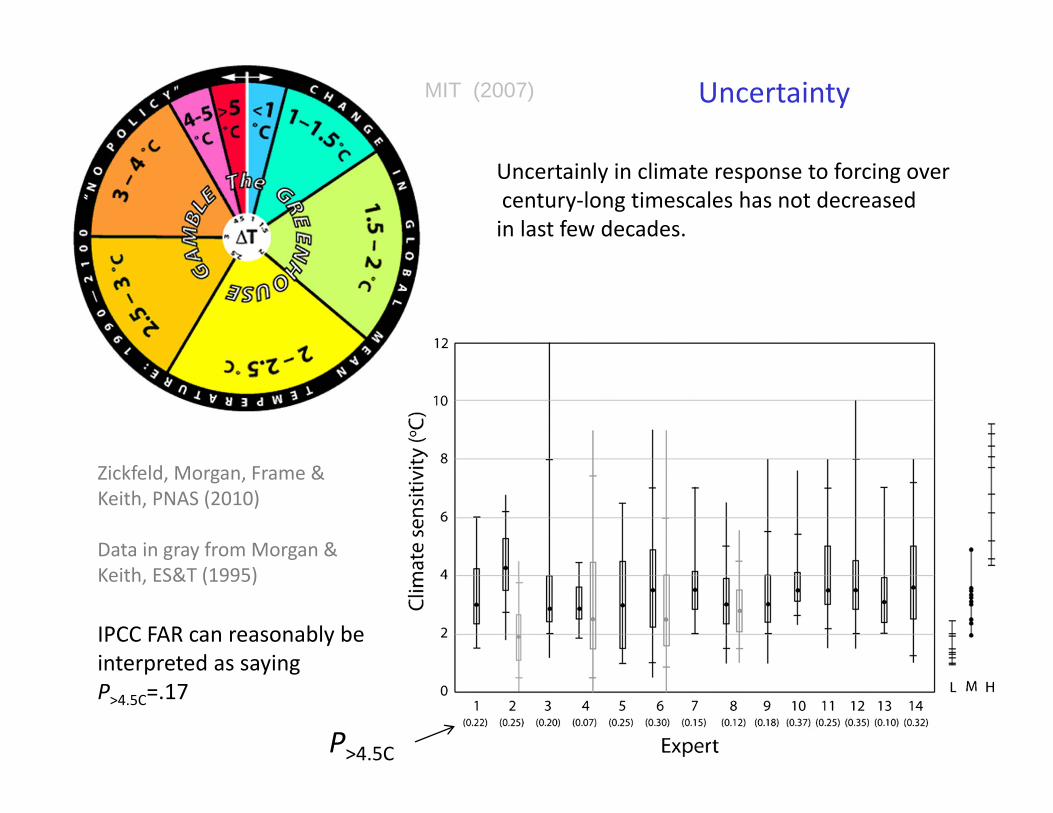
Zickfeld, Morgan, Frame & Keith, PNAS (2010)
Data in gray from Morgan & Keith, ES&T (1995)
MIT (2007) Uncertainty
P>4.5C
IPCC FAR can reasonably be interpreted as saying P>4.5C=.17
Uncertainly in climate response to forcing overcentury‐long timescales has not decreasedin last few decades.
6
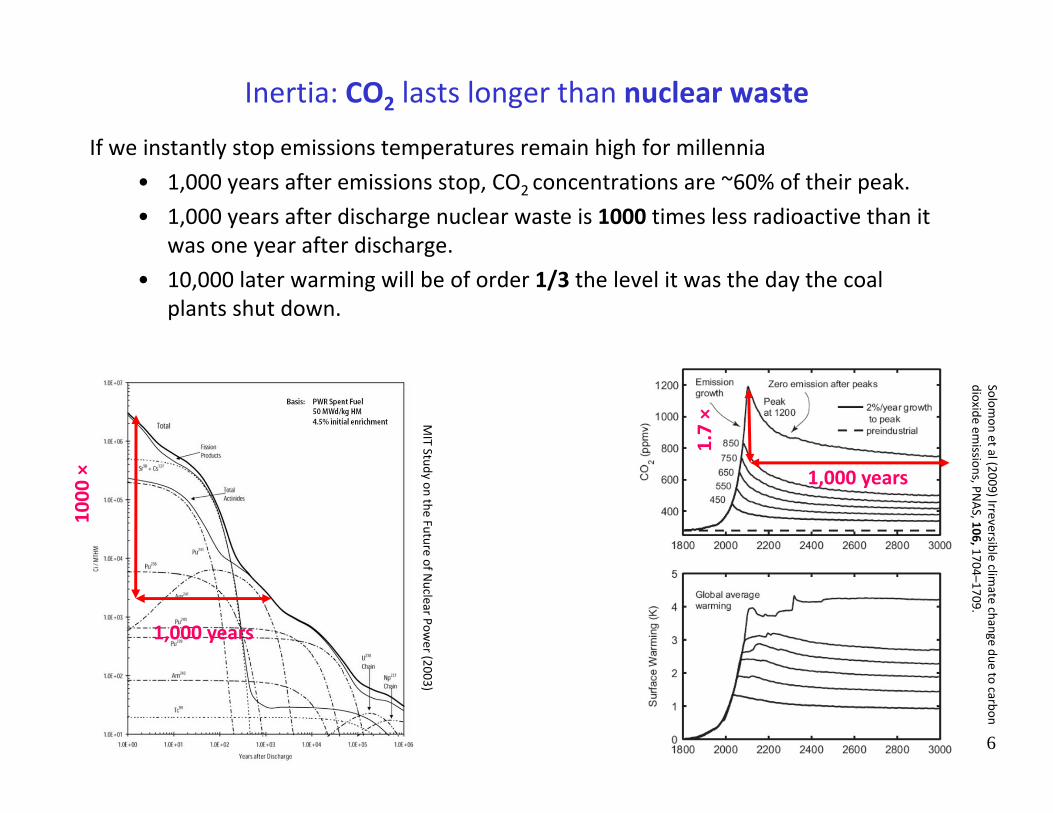
Inertia: CO2 lasts longer than nuclear wasteSolom
on et al (2009) Irreversible climate change due to carbon
dioxide emissions, PN
AS, 106,1704–1709.
If we instantly stop emissions temperatures remain high for millennia• 1,000 years after emissions stop, CO2 concentrations are ~60% of their peak.• 1,000 years after discharge nuclear waste is 1000 times less radioactive than it
was one year after discharge. • 10,000 later warming will be of order 1/3 the level it was the day the coal
plants shut down.
1000
×
MIT Study on the Future of N
uclear Power (2003)
1,000 years
1,000 years
1.7 ×
7
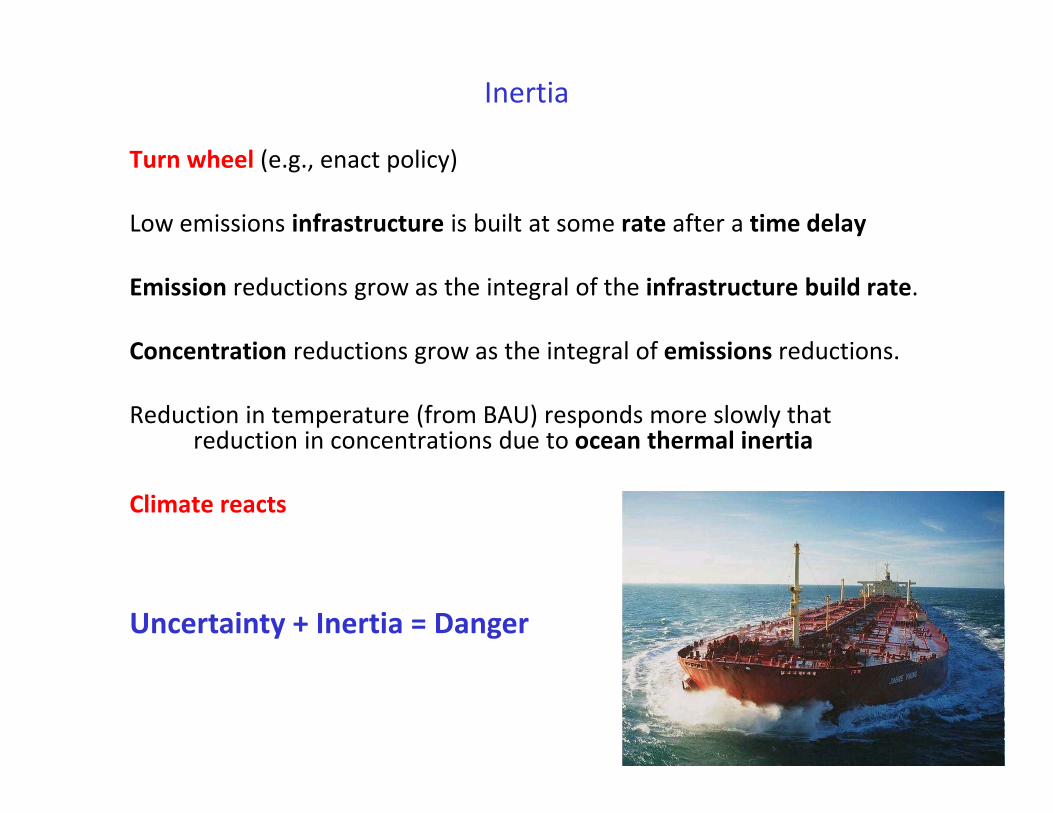
Inertia
Turn wheel (e.g., enact policy)
Low emissions infrastructure is built at some rate after a time delay
Emission reductions grow as the integral of the infrastructure build rate.
Concentration reductions grow as the integral of emissions reductions.
Reduction in temperature (from BAU) responds more slowly that reduction in concentrations due to ocean thermal inertia
Climate reacts
Uncertainty + Inertia = Danger
8
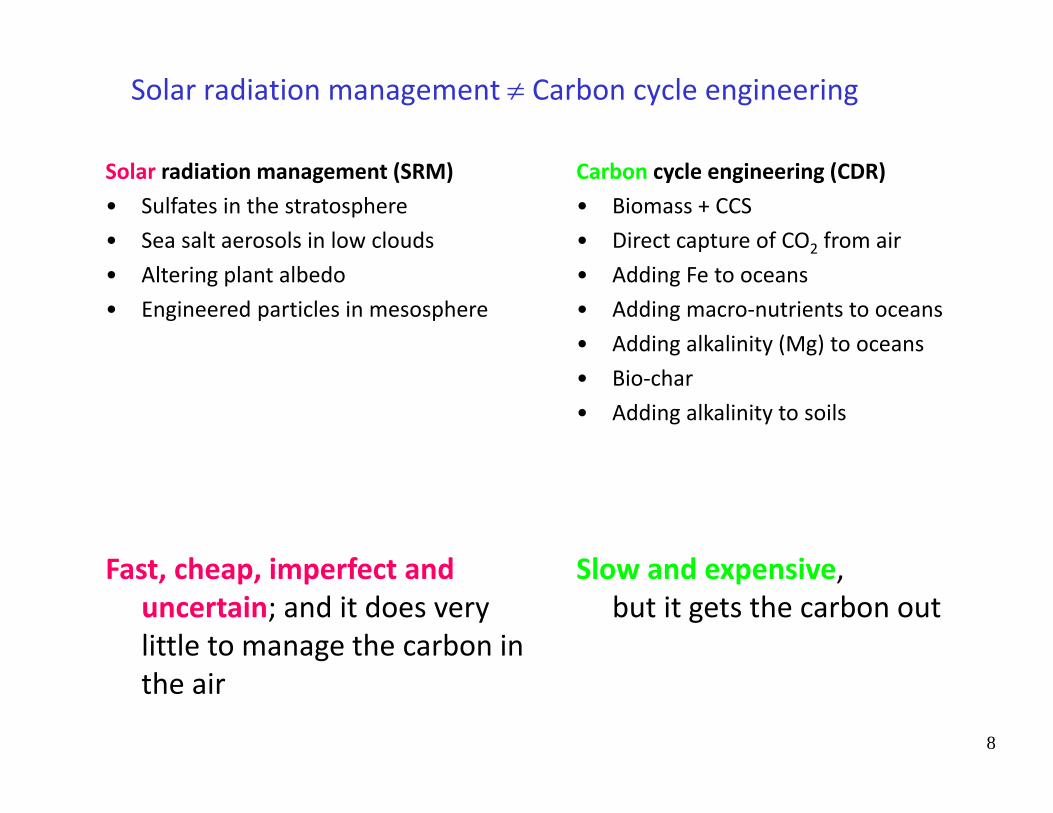
Solar radiation management Carbon cycle engineering
Carbon cycle engineering (CDR)• Biomass + CCS• Direct capture of CO2 from air• Adding Fe to oceans• Adding macro‐nutrients to oceans• Adding alkalinity (Mg) to oceans• Bio‐char• Adding alkalinity to soils
Slow and expensive, but it gets the carbon out
Solar radiation management (SRM)• Sulfates in the stratosphere• Sea salt aerosols in low clouds• Altering plant albedo• Engineered particles in mesosphere
Fast, cheap, imperfect and uncertain; and it does very little to manage the carbon in the air
9
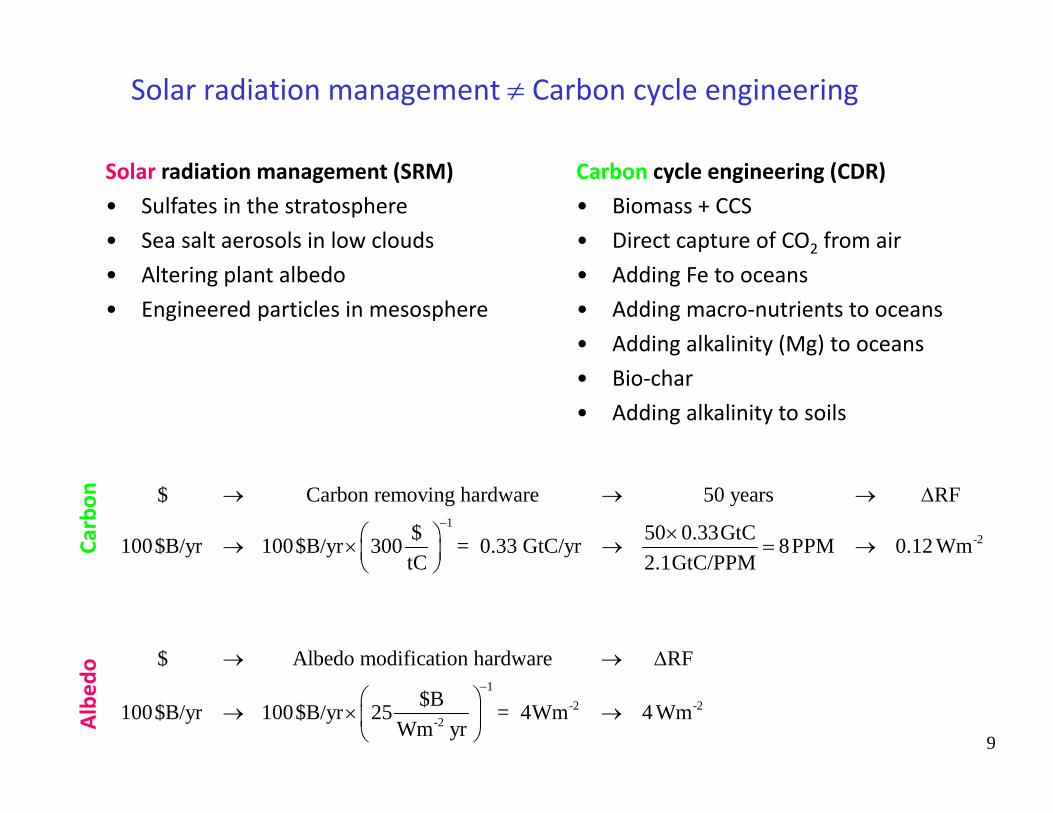
Solar radiation management Carbon cycle engineering
Carbon cycle engineering (CDR)• Biomass + CCS• Direct capture of CO2 from air• Adding Fe to oceans• Adding macro‐nutrients to oceans• Adding alkalinity (Mg) to oceans• Bio‐char• Adding alkalinity to soils
Solar radiation management (SRM)• Sulfates in the stratosphere• Sea salt aerosols in low clouds• Altering plant albedo• Engineered particles in mesosphere
1-2
1-2 -2
-2
$ Carbon removing hardware 50 years RF
$ 50 0.33GtC100$B/yr 100$B/yr 300 = 0.33 GtC/yr 8PPM 0.12 WmtC 2.1GtC/PPM
$ Albedo modification hardware RF
$B100$B/yr 100$B/yr 25 = 4Wm 4 WmWm yr
Carbon
Albe
do
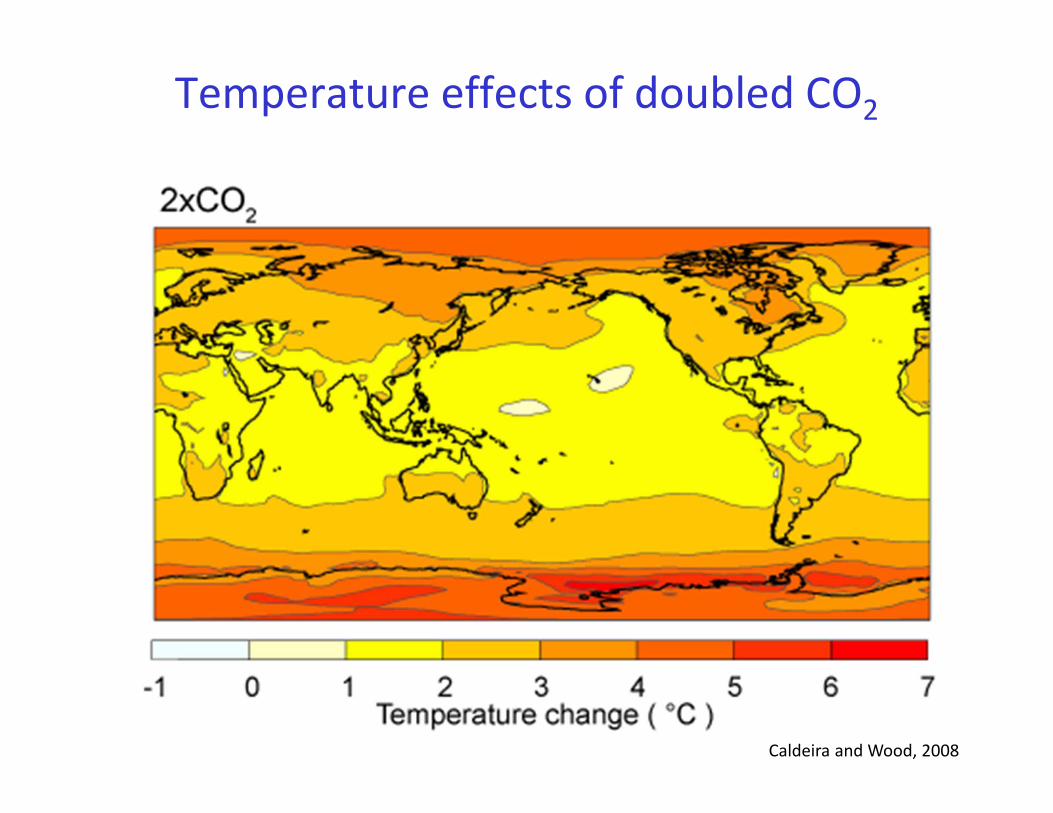
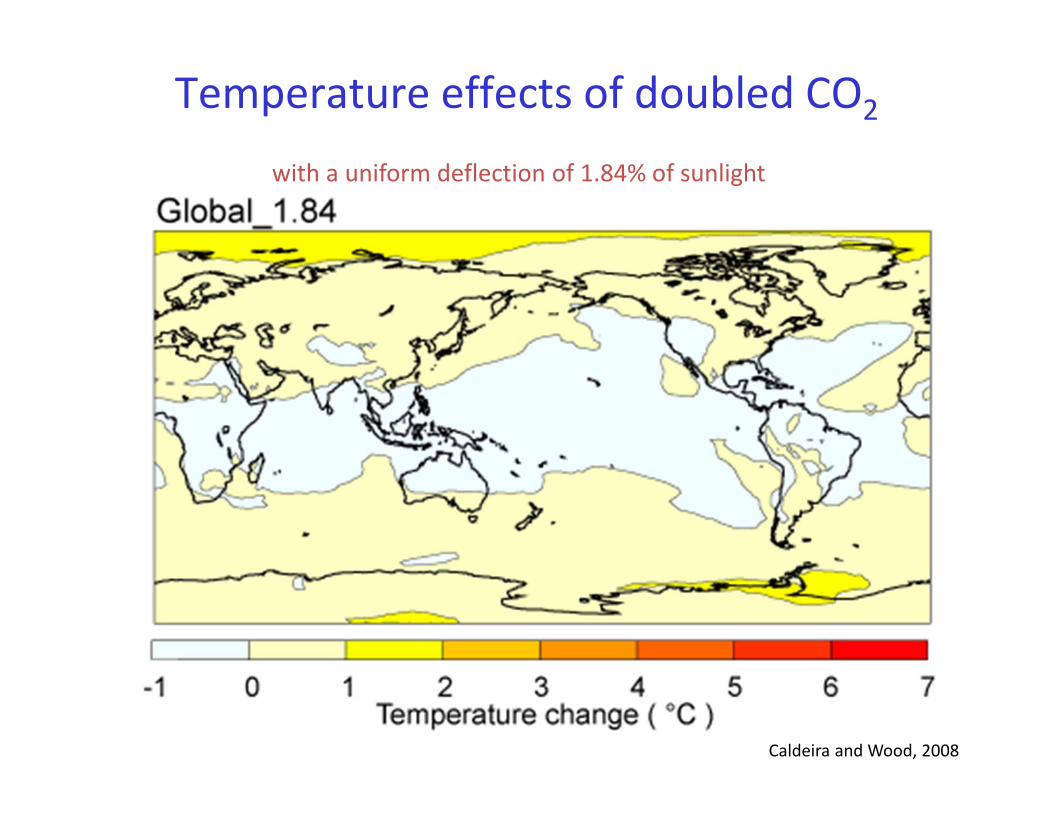
Temperature effects of doubled CO2
ΔTemperature Statistical significance
Caldeira and Wood, 2008
Temperature effects of doubled CO2
ΔTemperature Statistical significance
Caldeira and Wood, 2008
with a uniform deflection of 1.84% of sunlight

Temperature Precipitation
‐2 ‐1 0 1 2 3‐1 0 1 2 3 4
SRM
No SRM‐1 0 1 2 3 4
Alaska, NW CanadaE Canada etc.
Western N AmericaCentral N AmericaEastern N AmericaCentral America
AmazoniaSouthern S America
Northern EuropeS Europe, N Africa
SaharaWestern AfricaEastern Africa
Southern AfricaNorthern AsiaCentral Asia
Tibetan PlateauEastern Asia
Southern AsiaSoutheast Asia
Northern AustraliaSouthern Australia
‐2 ‐1 0 1 2 3
Imperfect
13
Engineering interlude
14
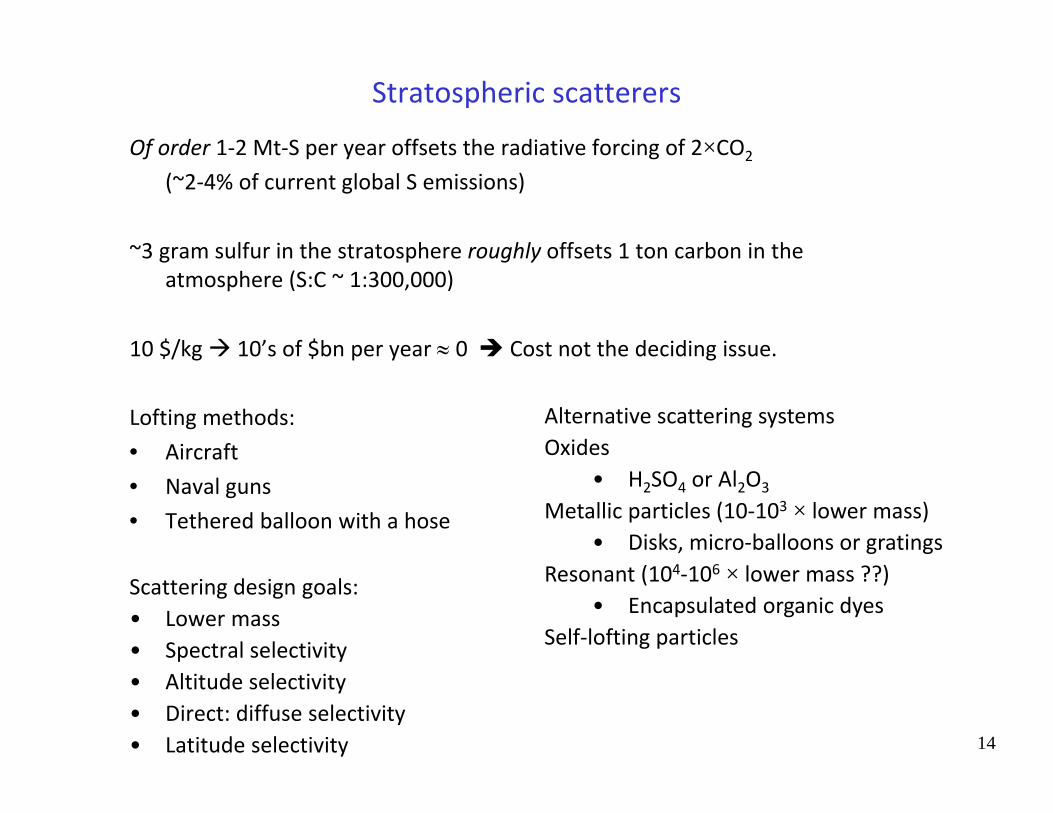
Stratospheric scatterers
Of order 1‐2 Mt‐S per year offsets the radiative forcing of 2×CO2
(~2‐4% of current global S emissions)
~3 gram sulfur in the stratosphere roughly offsets 1 ton carbon in the atmosphere (S:C ~ 1:300,000)
10 $/kg 10’s of $bn per year 0 Cost not the deciding issue.
Lofting methods:• Aircraft• Naval guns • Tethered balloon with a hose
Scattering design goals:• Lower mass• Spectral selectivity• Altitude selectivity• Direct: diffuse selectivity• Latitude selectivity
Alternative scattering systemsOxides
• H2SO4 or Al2O3
Metallic particles (10‐103 × lower mass)• Disks, micro‐balloons or gratings
Resonant (104‐106 × lower mass ??)• Encapsulated organic dyes
Self‐lofting particles
15
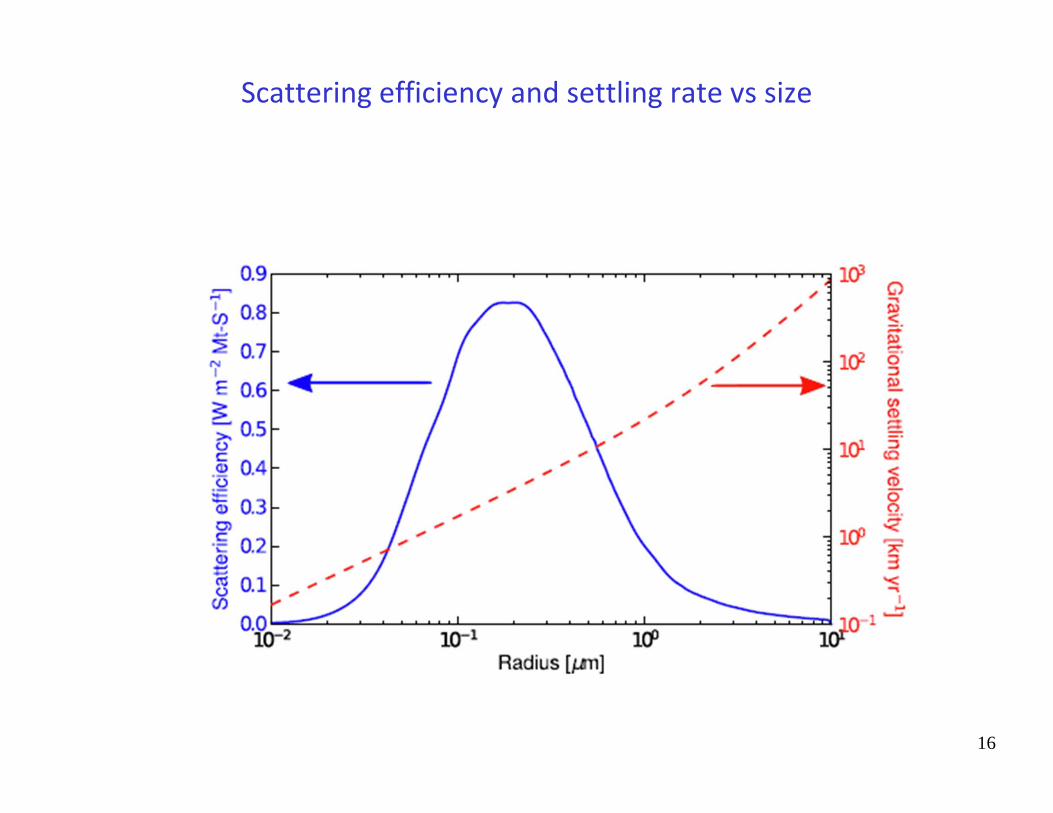
Scattering efficiency and settling rate vs size
16
17
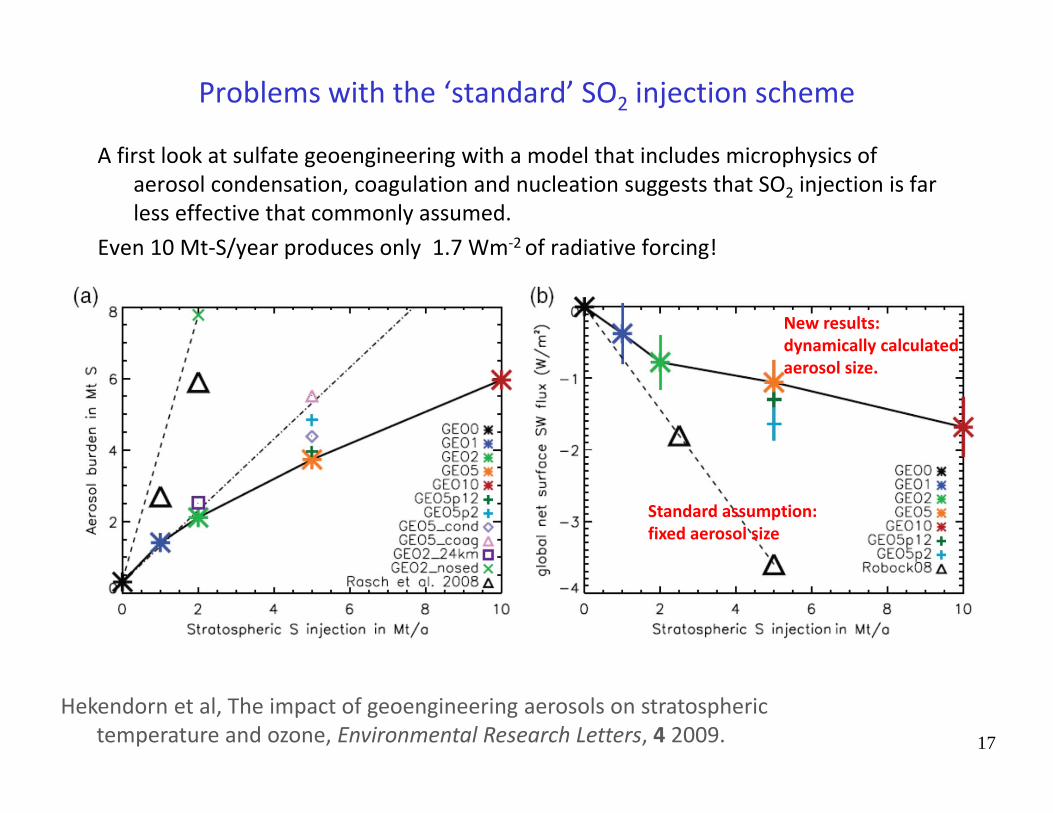
Problems with the ‘standard’ SO2 injection scheme
A first look at sulfate geoengineering with a model that includes microphysics of aerosol condensation, coagulation and nucleation suggests that SO2 injection is far less effective that commonly assumed.
Even 10 Mt‐S/year produces only 1.7 Wm‐2 of radiative forcing!
Hekendorn et al, The impact of geoengineering aerosols on stratospheric temperature and ozone, Environmental Research Letters, 4 2009.
Standard assumption:fixed aerosol size
New results: dynamically calculated aerosol size.
18
Four methods to disperse particles in the stratosphere
1. High vapor‐pressure gas• Process: In situ conversion to a low vapor pressure gas followed by
homogeneous nucleation and/or deposition on existing particles. • Almost all geoengineering studies to date have used this method where the
injected gas is either SO2 or H2S.
2. Low vapor‐pressure gas• Process: Release a low vapor pressure gas that rapidly condenses in aircraft
plume.• Many kinds of nano‐particles can be formed this way.
3. Liquid droplets by spraying• Process: disperse a liquid with an atomizing nozzle.
4. Solid particles• Process: disperse particles that are carried to the stratosphere as a solid powder
19
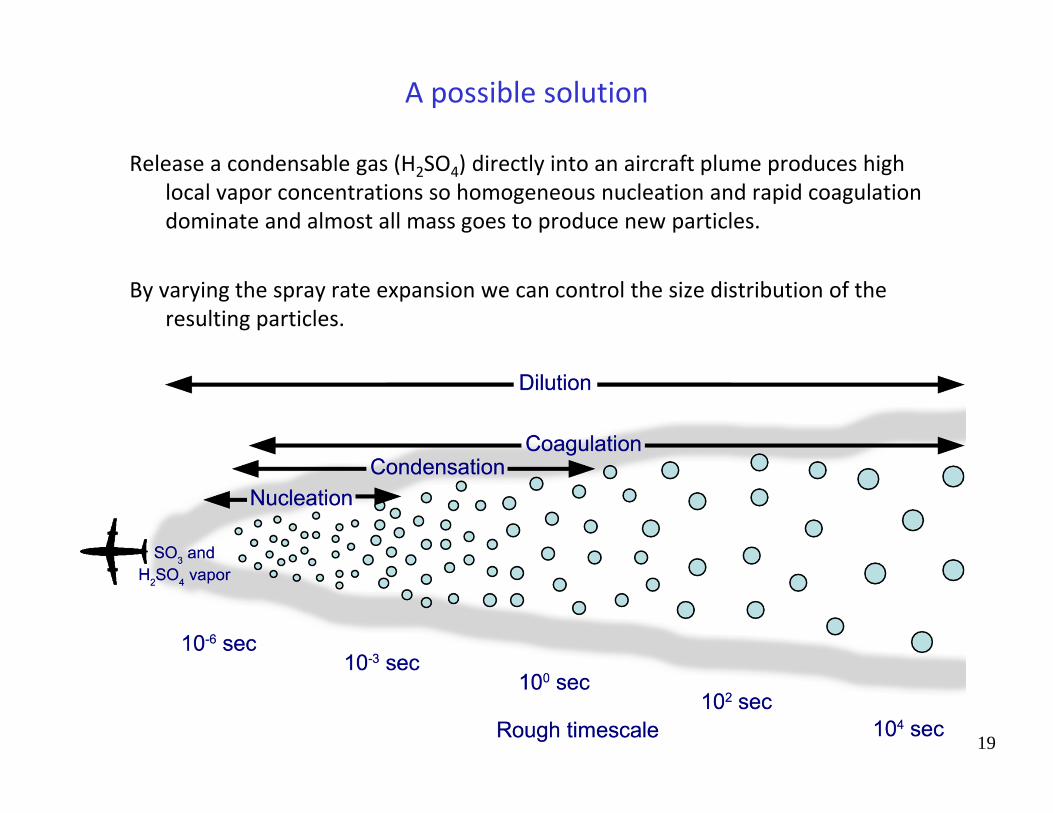
A possible solution
Release a condensable gas (H2SO4) directly into an aircraft plume produces high local vapor concentrations so homogeneous nucleation and rapid coagulation dominate and almost all mass goes to produce new particles.
By varying the spray rate expansion we can control the size distribution of the resulting particles.
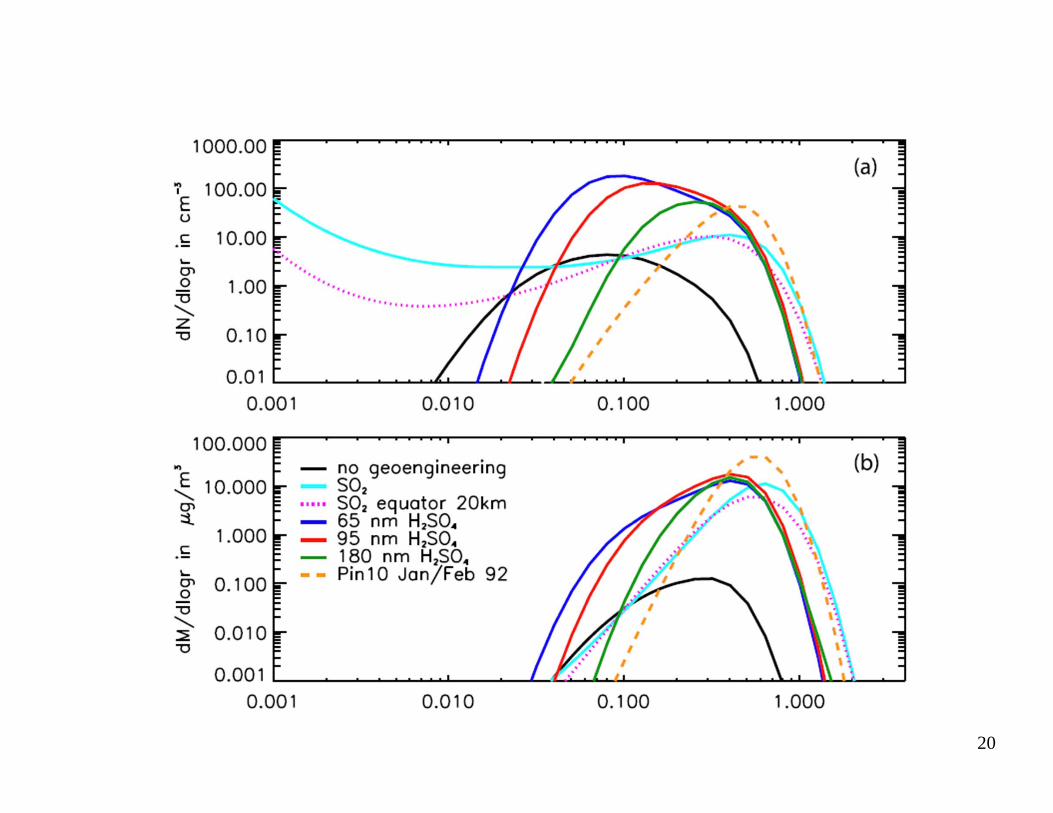
20
21
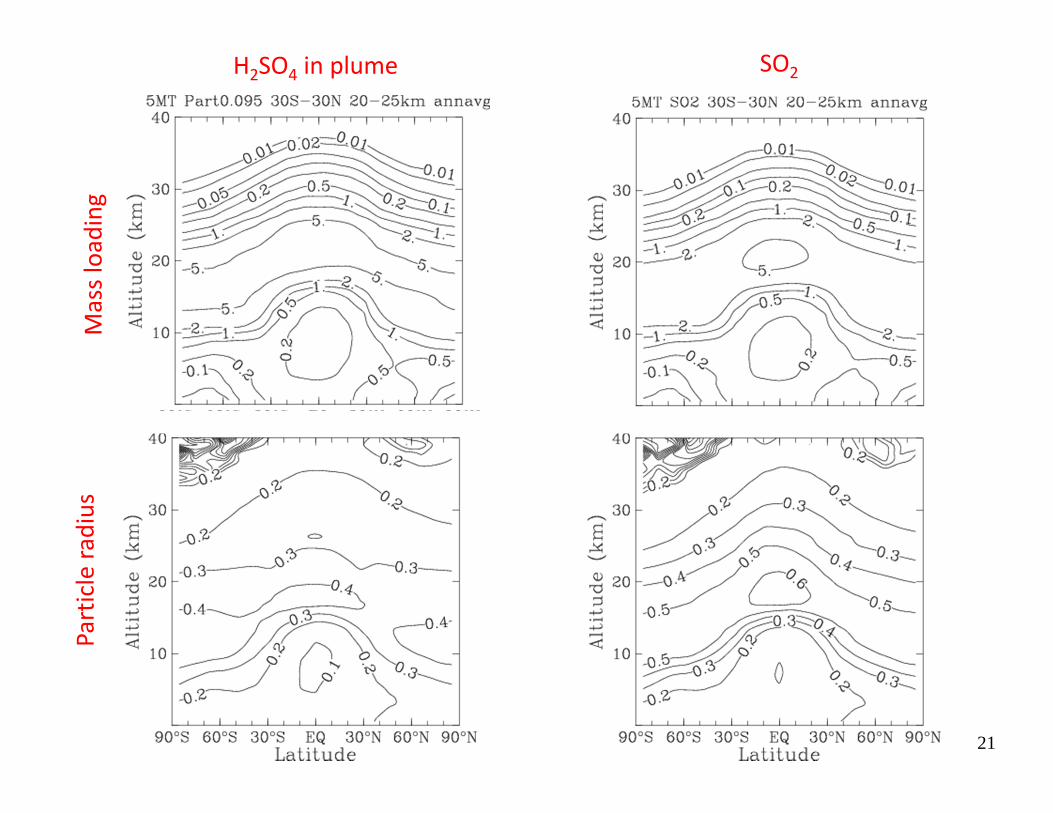
H2SO4 in plume SO2Mass loading
Particle ra
dius
22
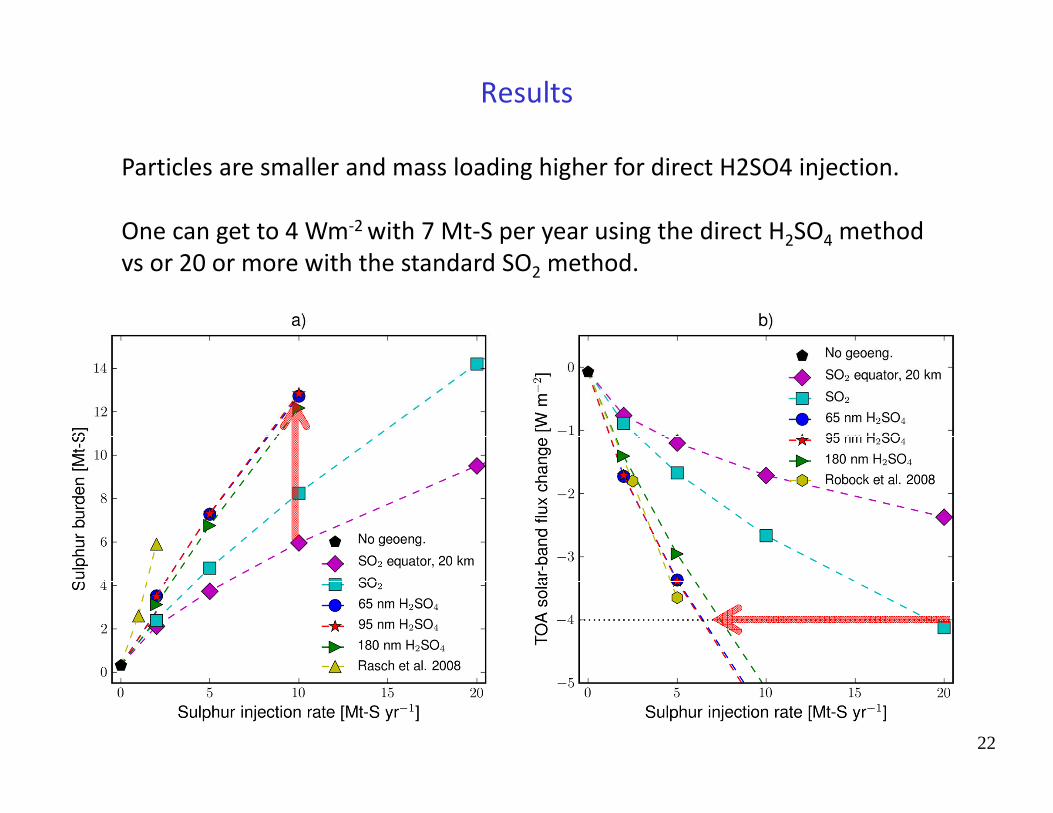
Results
Particles are smaller and mass loading higher for direct H2SO4 injection.
One can get to 4 Wm‐2 with 7 Mt‐S per year using the direct H2SO4 method vs or 20 or more with the standard SO2 method.
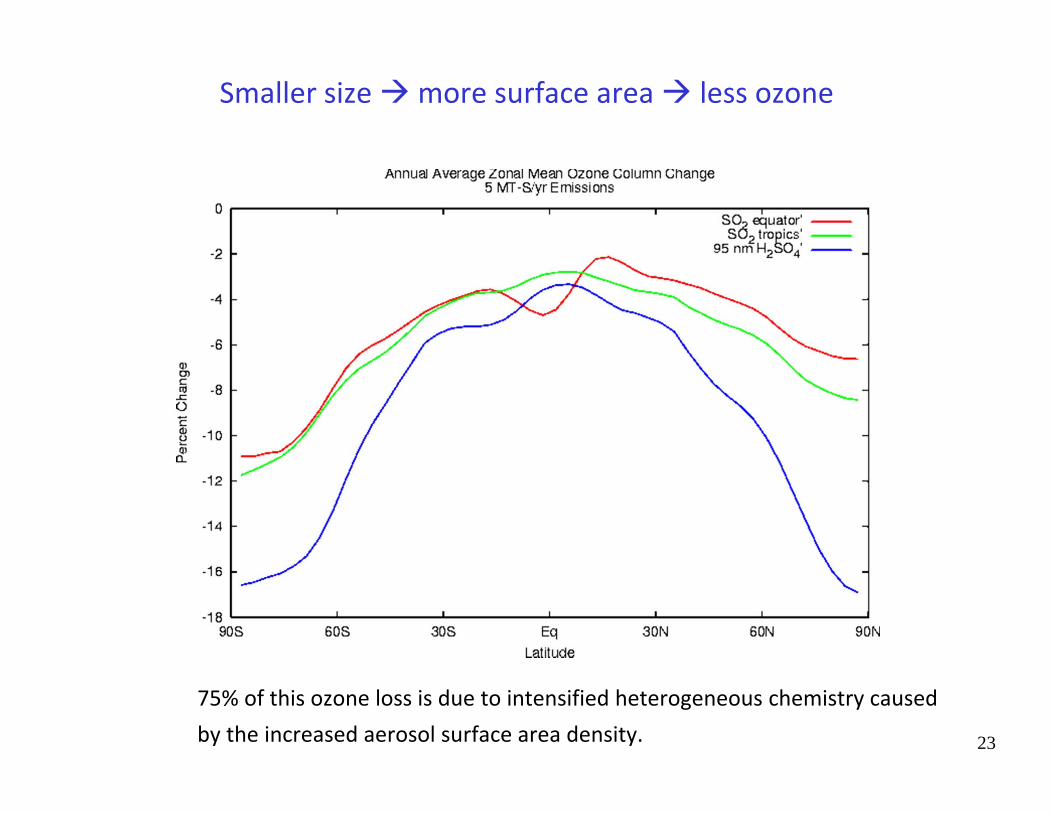
Smaller size more surface area less ozone
75% of this ozone loss is due to intensified heterogeneous chemistry caused by the increased aerosol surface area density. 23
24
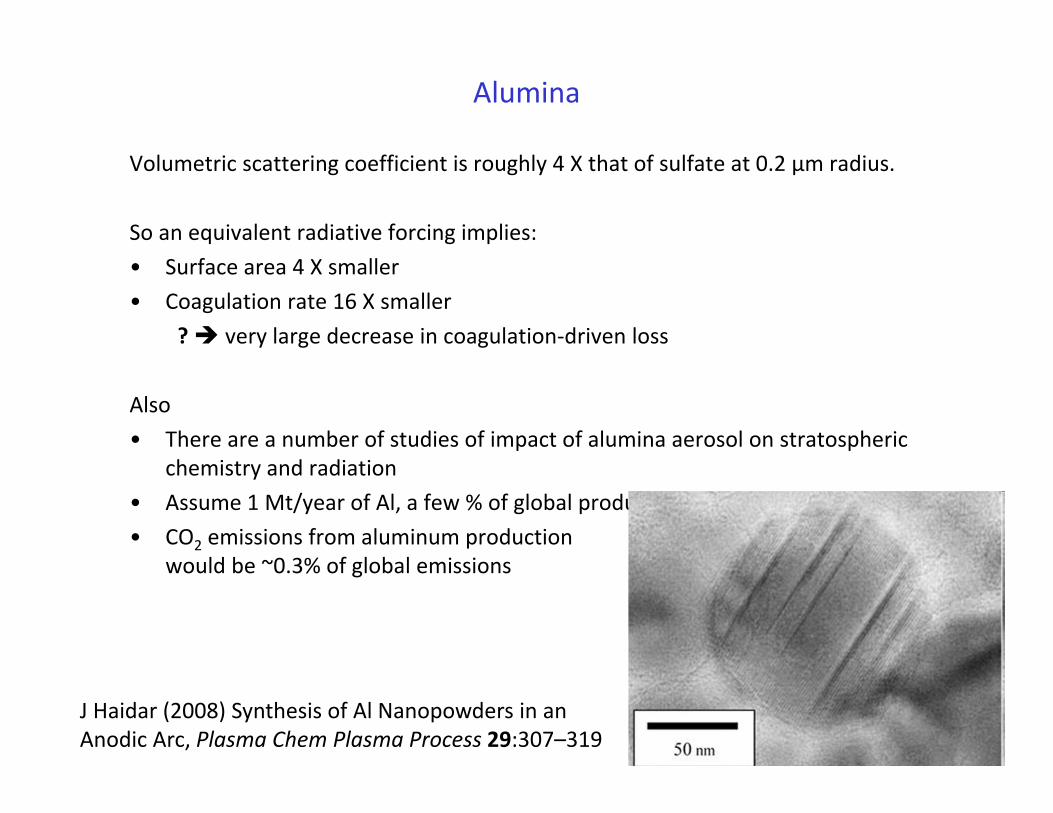
Alumina
Volumetric scattering coefficient is roughly 4 X that of sulfate at 0.2 µm radius.
So an equivalent radiative forcing implies:• Surface area 4 X smaller• Coagulation rate 16 X smaller
? very large decrease in coagulation‐driven loss
Also• There are a number of studies of impact of alumina aerosol on stratospheric
chemistry and radiation• Assume 1 Mt/year of Al, a few % of global production• CO2 emissions from aluminum production
would be ~0.3% of global emissions
J Haidar (2008) Synthesis of Al Nanopowders in anAnodic Arc, Plasma Chem Plasma Process 29:307–319
25
Closing thoughts on direct aerosol method
1. It much easier to think of a new method than it is to understand its effectiveness and environmental risks
2. There is a huge scope for new methods
3. The environmental hazards of SRM cannot be assessed without knowing the specific techniques that might be used.
4. It is impossible to identify and develop techniques without field testing; such process/microphysical tests can be done at the ton scale
5. These tests would say nothing (directly) about large‐scale atmospheric response
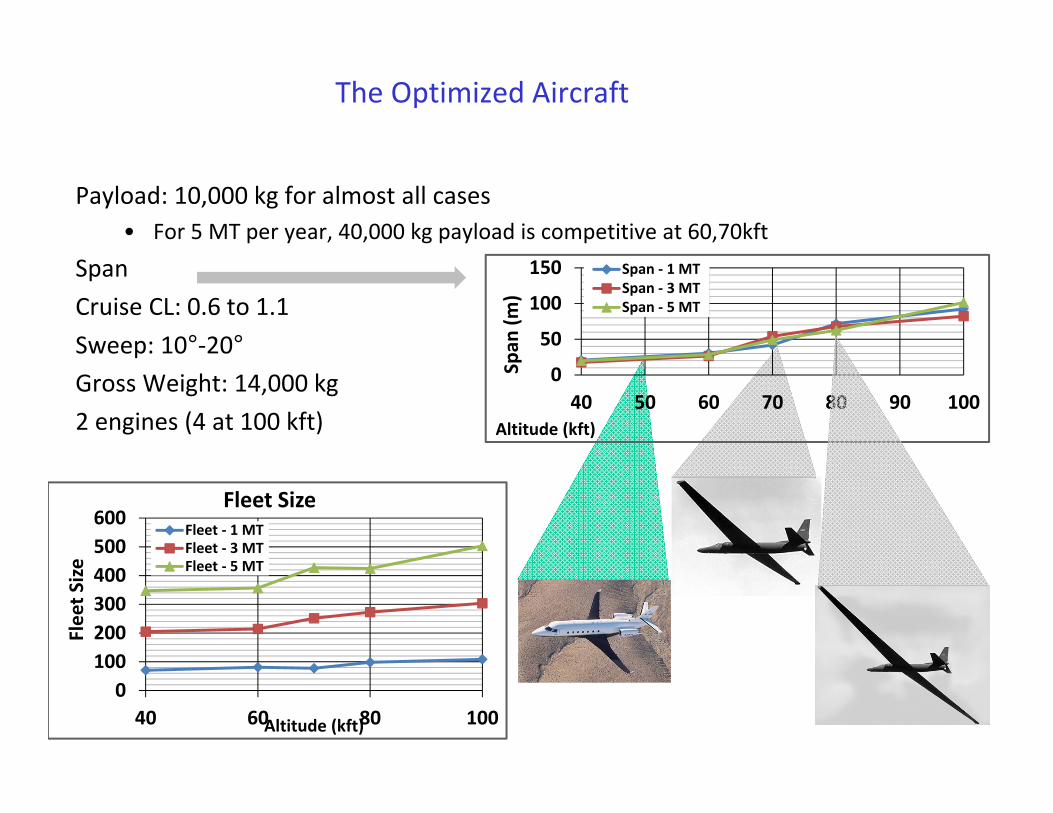
The Optimized Aircraft
Payload: 10,000 kg for almost all cases• For 5 MT per year, 40,000 kg payload is competitive at 60,70kft
SpanCruise CL: 0.6 to 1.1Sweep: 10°‐20°Gross Weight: 14,000 kg2 engines (4 at 100 kft)
0100200300400500600
40 60 80 100
Fleet S
ize
Altitude (kft)
Fleet SizeFleet ‐ 1 MTFleet ‐ 3 MTFleet ‐ 5 MT
0
50
100
150
40 50 60 70 80 90 100
Span
(m)
Altitude (kft)
Span ‐ 1 MTSpan ‐ 3 MTSpan ‐ 5 MT
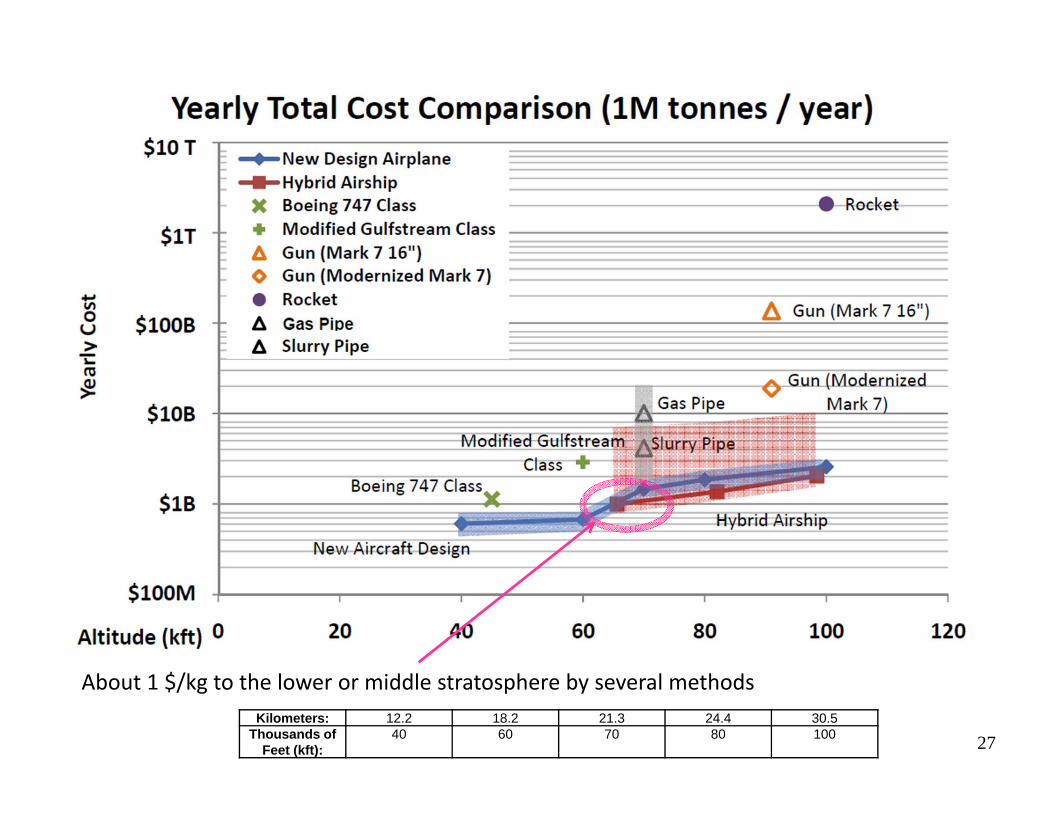
27
About 1 $/kg to the lower or middle stratosphere by several methodsKilometers: 12.2 18.2 21.3 24.4 30.5
Thousands of Feet (kft):
40 60 70 80 100
28
Photophoretic Levitation
2929
30
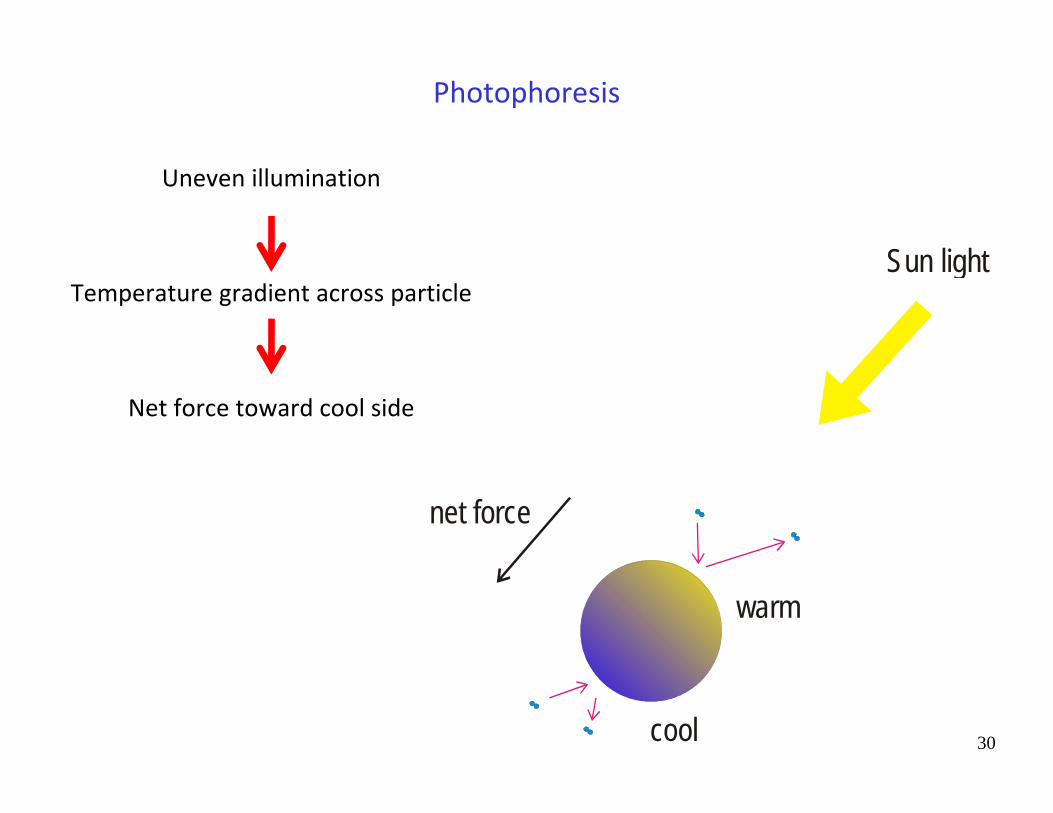
Photophoresis
Uneven illumination
Temperature gradient across particle
Net force toward cool side
warm
cool
Sun light
net force
31
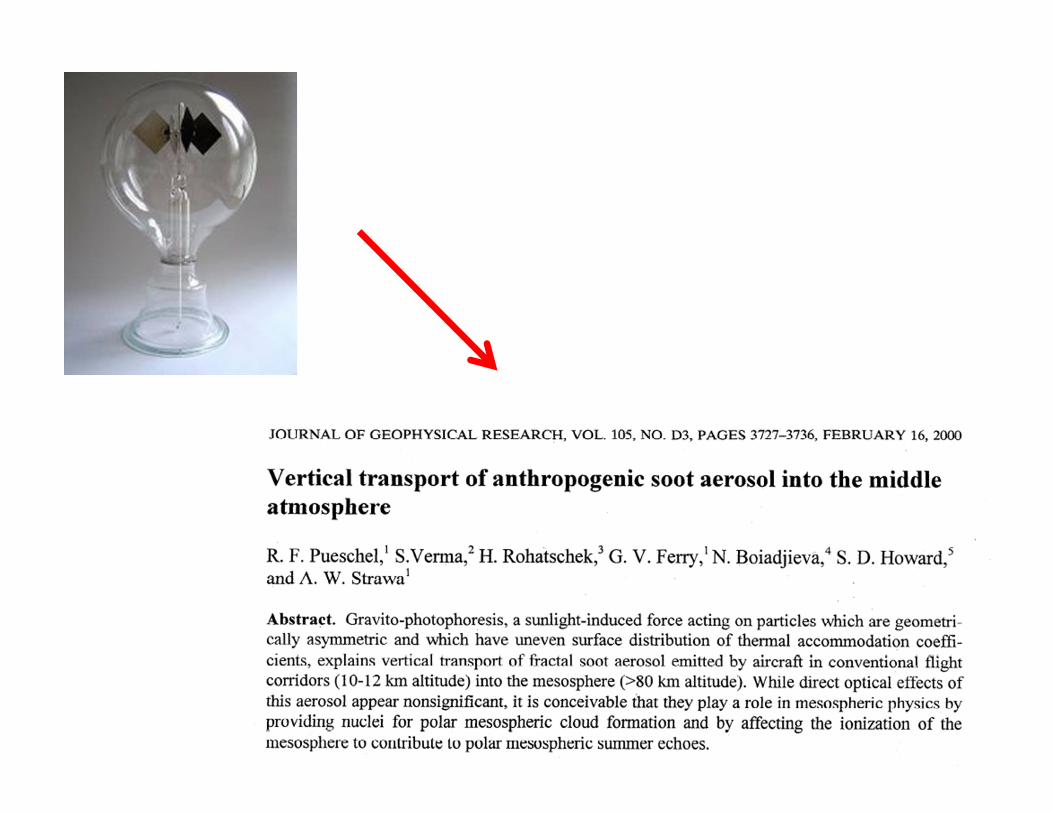
Gravito‐Photophoresis
Radiative heating (or cooling)
Accommodation coefficient asymmetry
Body‐fixed force
=0.7
=0.9net force
Sun light
32
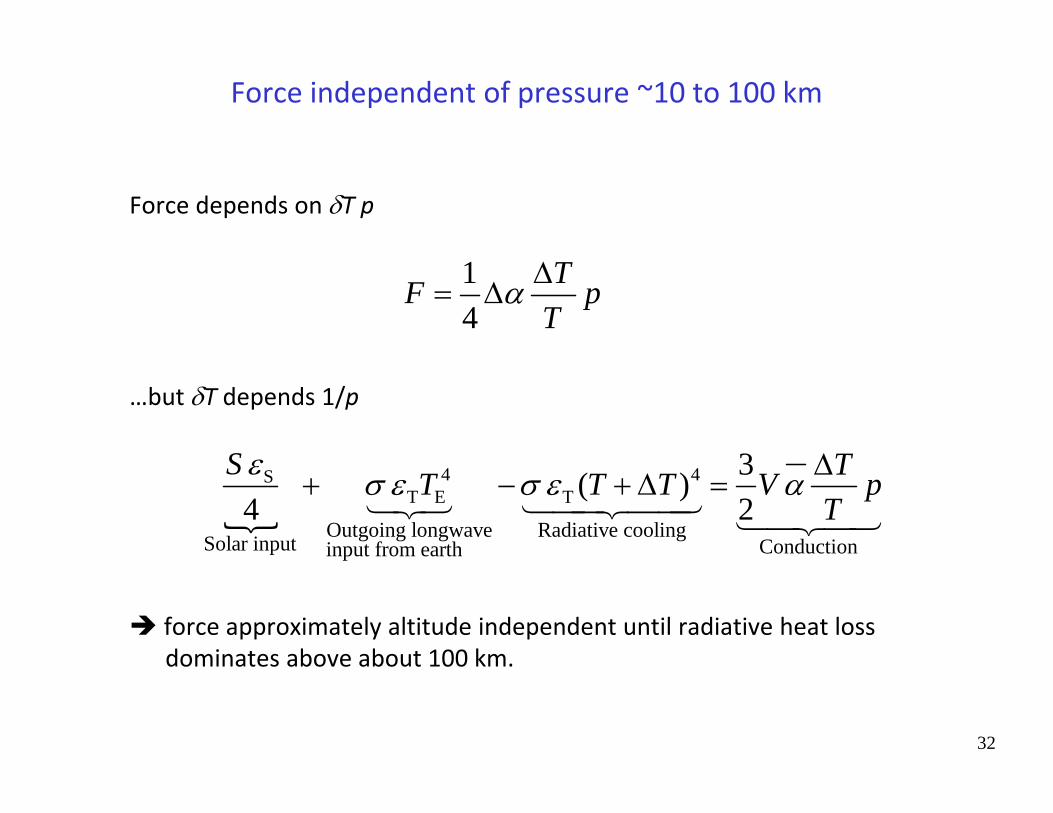
Force independent of pressure ~10 to 100 km
Force depends on T p
…but T depends 1/p
force approximately altitude independent until radiative heat loss dominates above about 100 km.
4 4ST E T
Outgoing longwave Radiative coolingSolar input Conductioninput from earth
3( )4 2
S TT T T V pT
14
TF pT
33
Gravity is not the only way to break symmetry
Magnetic or electrostatic torques can greatly exceed gravitational torques for small particles in the upper atmosphere.
Consider the 1 m radius sphere in which the center of mass is displaced 0.1 m from the geometric center (Rohatschek example).
A similar magnetite sphere with magnetization of 105 J T‐1 m‐3 would feel magnetic torques that exceeded gravitational torque by a factor of ~104 at the typical terrestrial magnetic field strength of 0.5×10‐4 T
Similarly, a sphere of barium titanate, a common ferroelectric, with residual charge of 2×10‐3 C m‐2 would experience a torque 103 times the gravitational torque in the typical atmospheric electric field of 100 V/m.
34
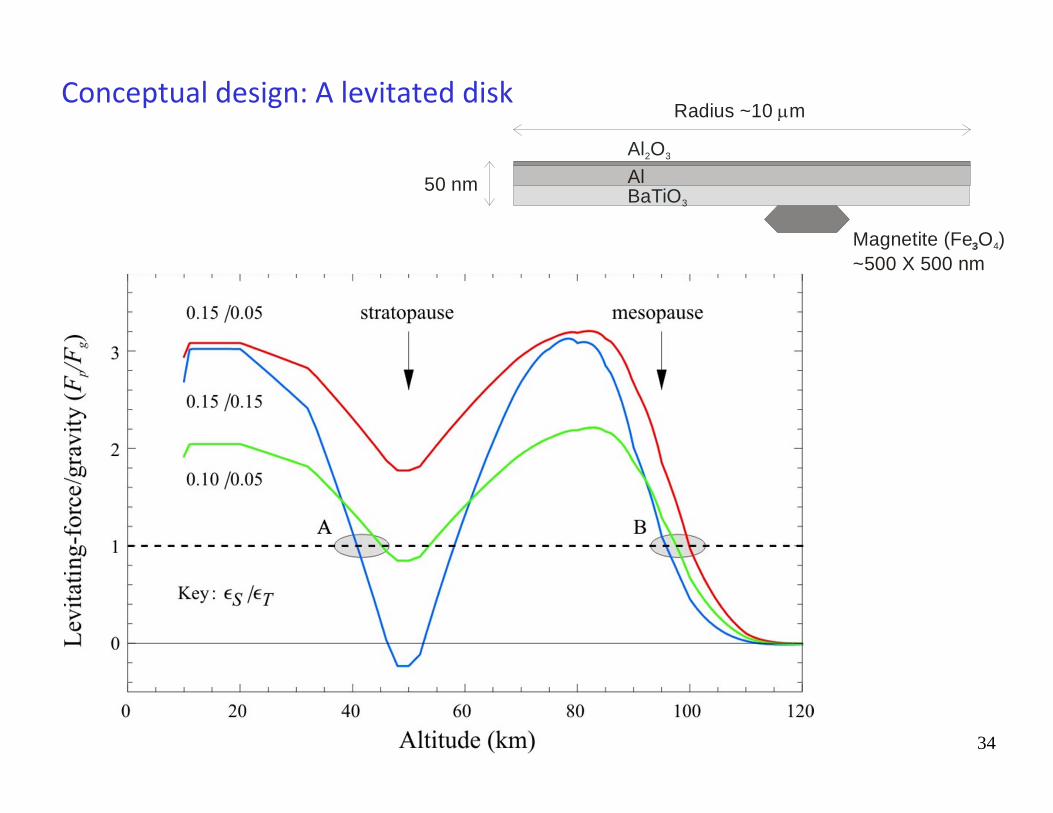
Conceptual design: A levitated diskRadius ~10 m
50 nm AlBaTiO3
Al O2 3
Magnetite (Fe O )3 4
~500 X 500 nm3
35
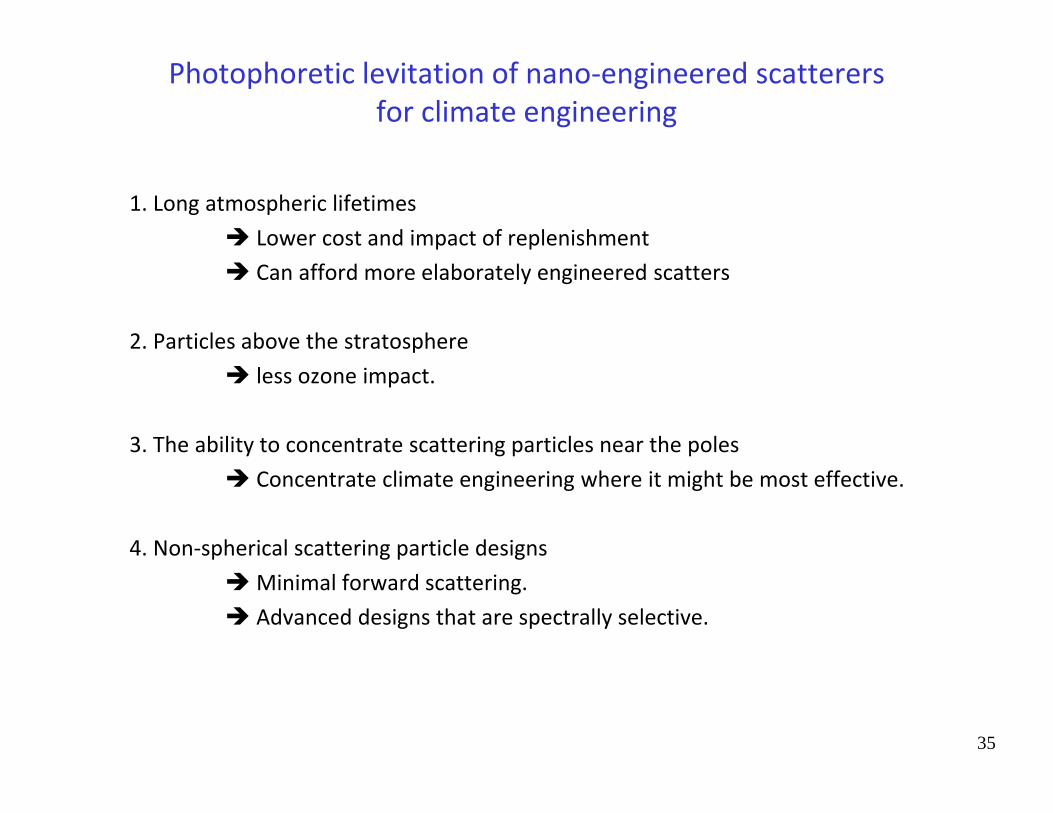
Photophoretic levitation of nano‐engineered scatterersfor climate engineering
1. Long atmospheric lifetimes Lower cost and impact of replenishment Can afford more elaborately engineered scatters
2. Particles above the stratosphere less ozone impact.
3. The ability to concentrate scattering particles near the poles Concentrate climate engineering where it might be most effective.
4. Non‐spherical scattering particle designs Minimal forward scattering. Advanced designs that are spectrally selective.
36
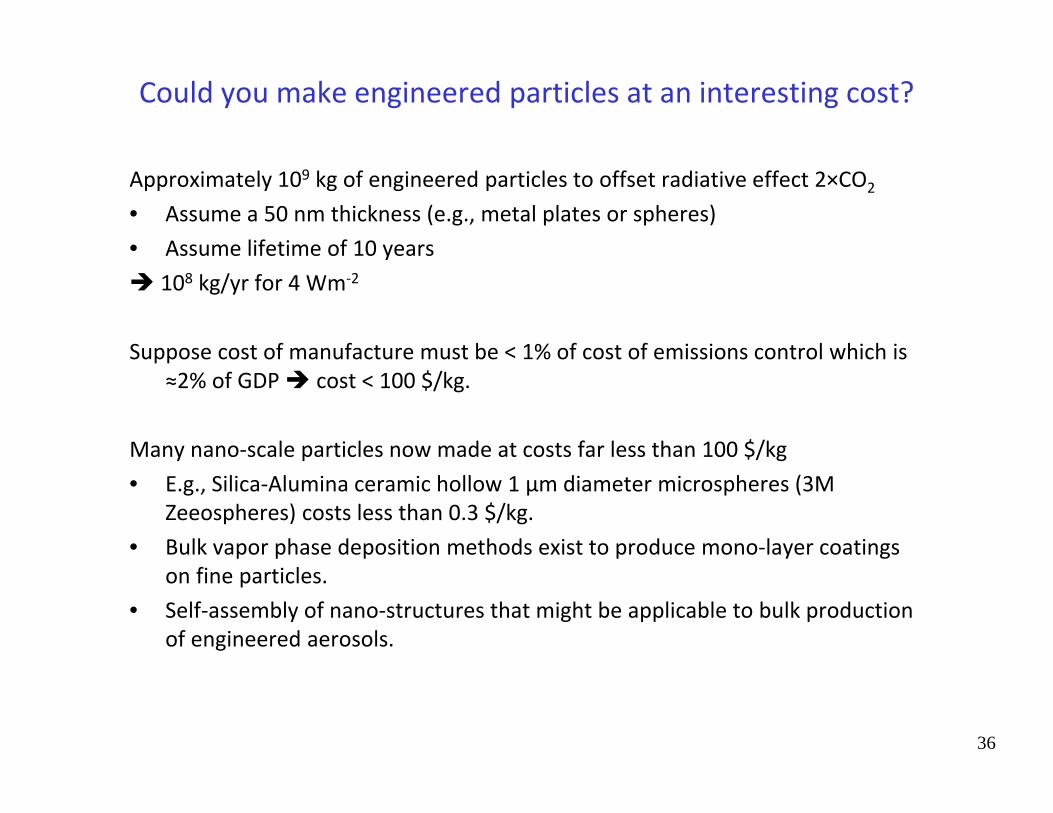
Could you make engineered particles at an interesting cost?
Approximately 109 kg of engineered particles to offset radiative effect 2×CO2
• Assume a 50 nm thickness (e.g., metal plates or spheres)• Assume lifetime of 10 years 108 kg/yr for 4 Wm‐2
Suppose cost of manufacture must be < 1% of cost of emissions control which is ≈2% of GDP cost < 100 $/kg.
Many nano‐scale particles now made at costs far less than 100 $/kg• E.g., Silica‐Alumina ceramic hollow 1 µm diameter microspheres (3M
Zeeospheres) costs less than 0.3 $/kg.• Bulk vapor phase deposition methods exist to produce mono‐layer coatings
on fine particles.• Self‐assembly of nano‐structures that might be applicable to bulk production
of engineered aerosols.
37
Detection and Attribution
38
What could be learned from sub‐scale deployment?
Stratospheric geoengineering cannot be tested in the atmosphere without full‐scale implementationRobock et al, A Test for Geoengineering, Science 327:530‐531 (2010)
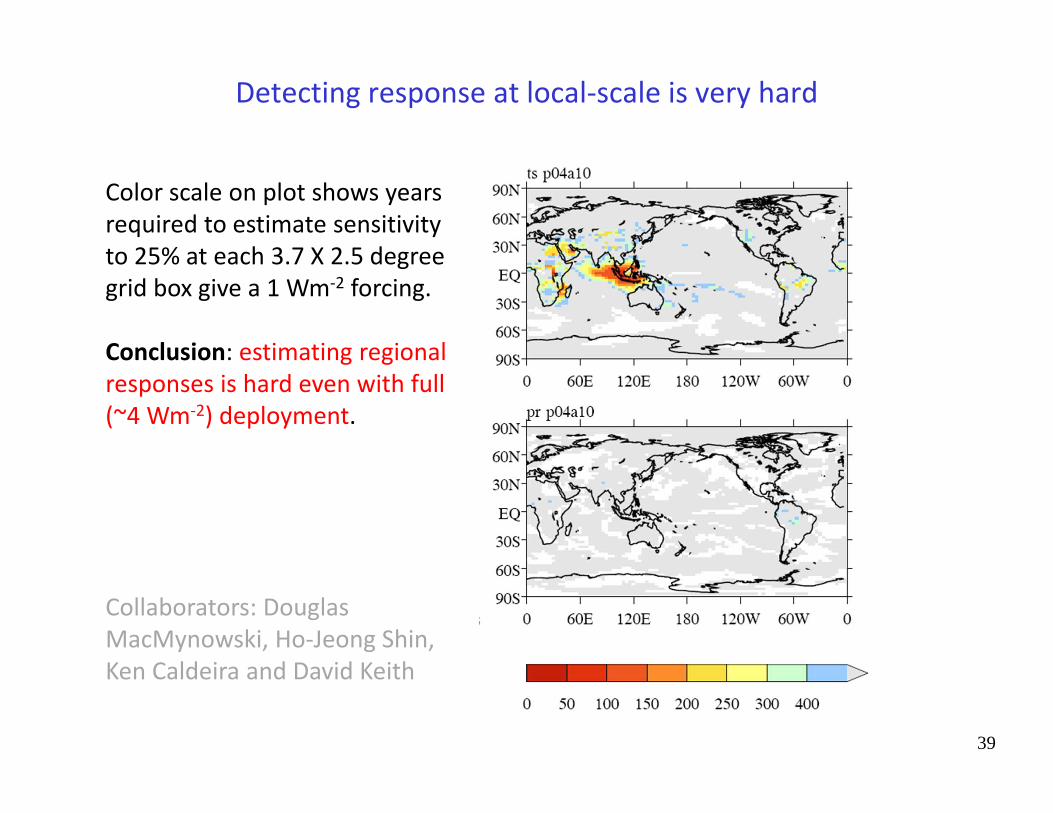
Detecting response at local‐scale is very hard
39
Color scale on plot shows years required to estimate sensitivity to 25% at each 3.7 X 2.5 degree grid box give a 1 Wm‐2 forcing.
Conclusion: estimating regional responses is hard even with full (~4 Wm‐2) deployment.
Collaborators: Douglas MacMynowski, Ho‐Jeong Shin, Ken Caldeira and David Keith
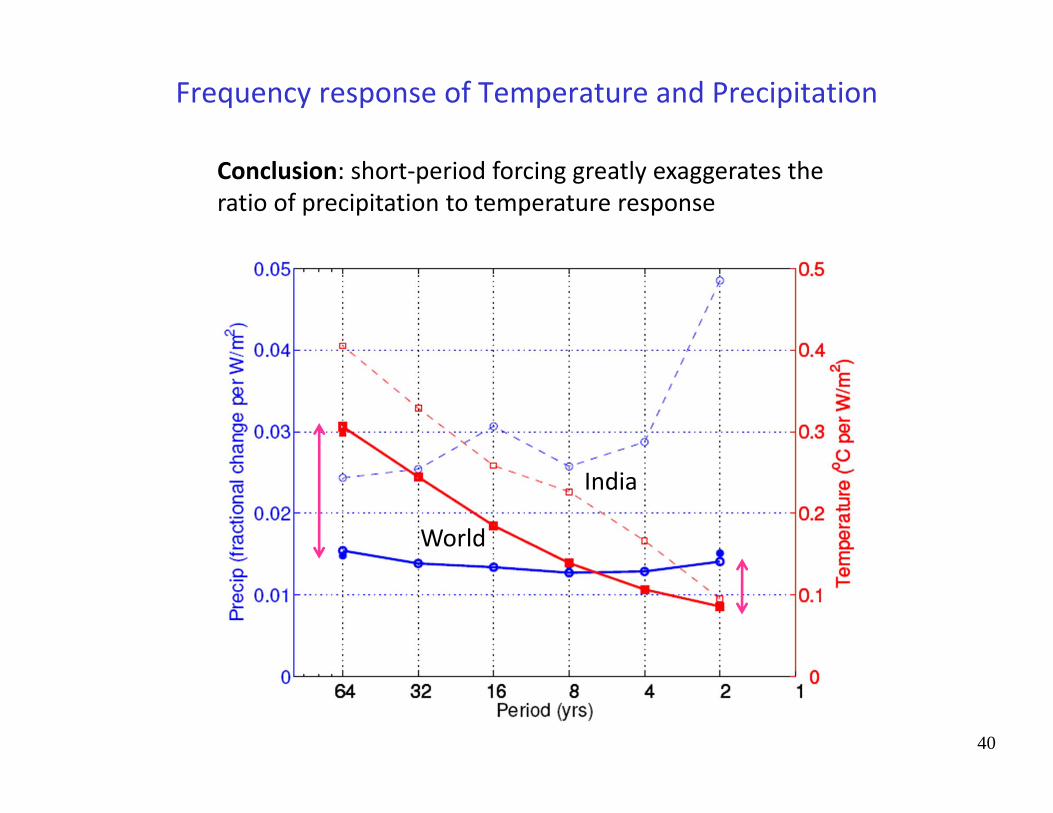
Frequency response of Temperature and Precipitation
40
India
World
Conclusion: short‐period forcing greatly exaggerates the ratio of precipitation to temperature response
41
What could be learned from sub‐scale deployment?
Stratospheric geoengineering cannot be tested in the atmosphere without full‐scale implementationRobock et al, A Test for Geoengineering, Science 327:530‐531 (2010)
This is a signal detection problem in the presence of noise. There is nothing magic about full scale implementation We could learn a lot about extreme responses from sub‐scale deployment.
E.g., Can detect response 1 to 0.5 sigma larger than expected in 25 years at 1/10 of full scale (0.4 Wm‐2)
Suggestion: disagreement on this point arises in part from differing assumptions not from disagreement about the science
We need a testable hypothesis

4242
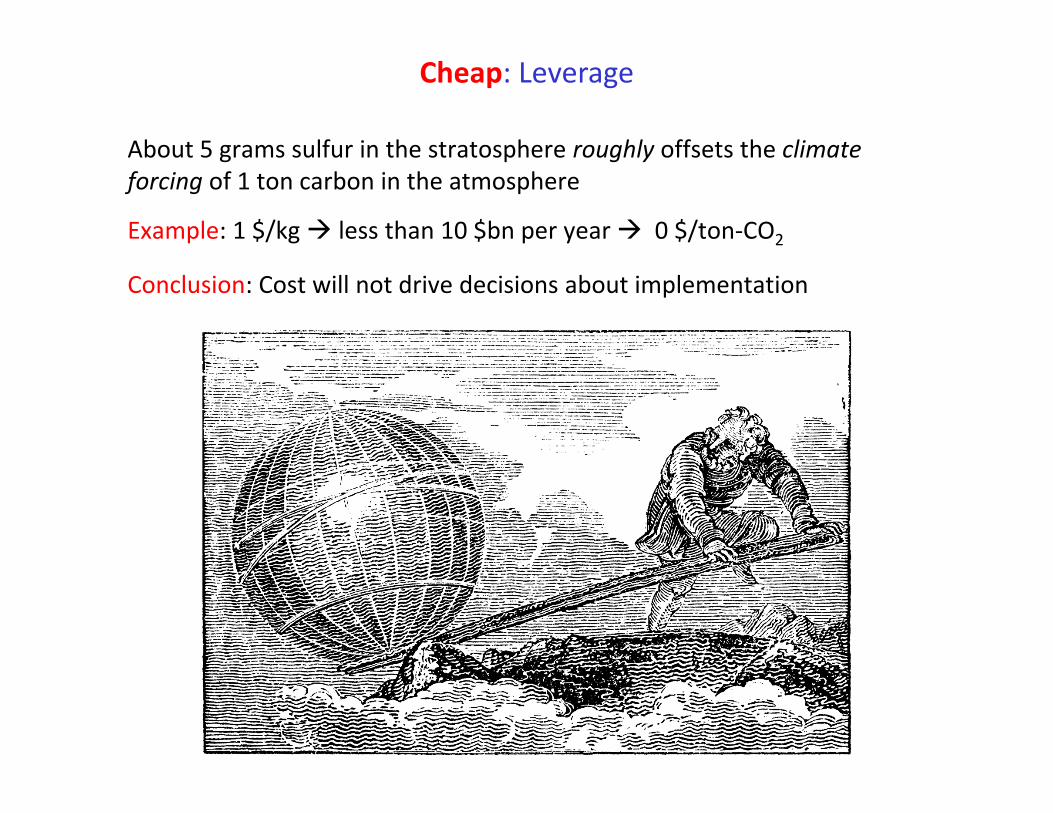
About 5 grams sulfur in the stratosphere roughly offsets the climate forcing of 1 ton carbon in the atmosphere
Example: 1 $/kg less than 10 $bn per year 0 $/ton‐CO2
Conclusion: Cost will not drive decisions about implementation
Cheap: Leverage
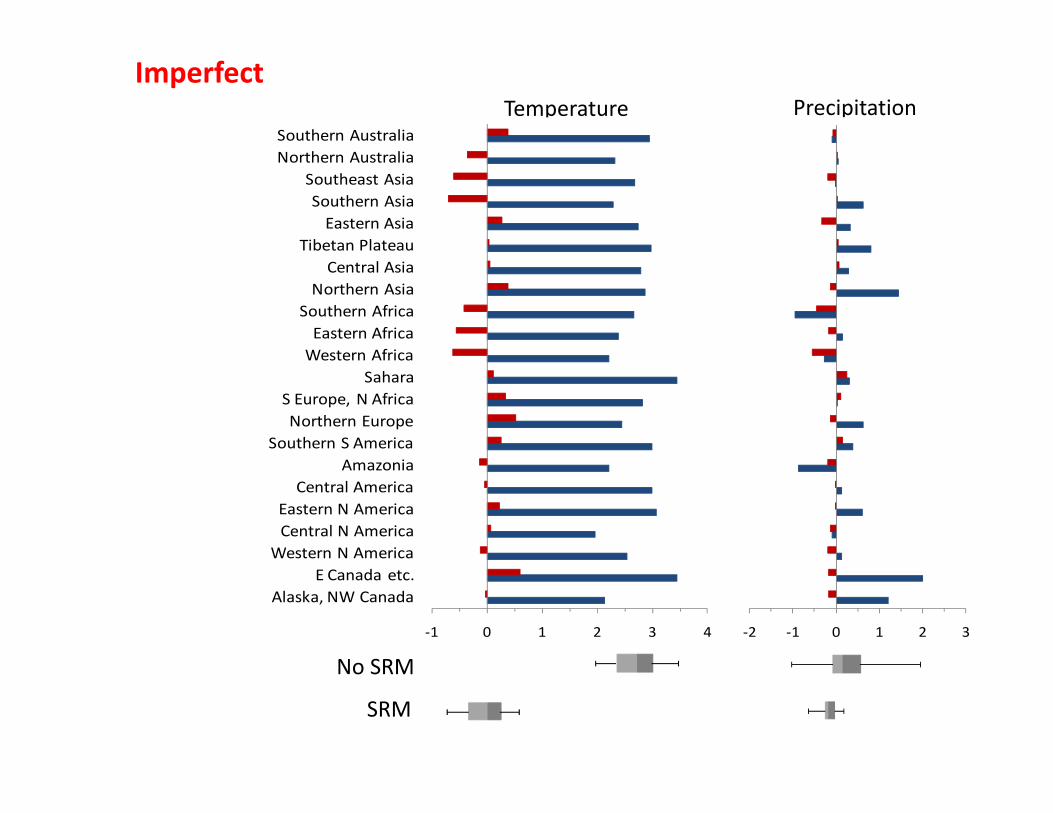
Temperature Precipitation
‐2 ‐1 0 1 2 3‐1 0 1 2 3 4
SRM
No SRM‐1 0 1 2 3 4
Alaska, NW CanadaE Canada etc.
Western N AmericaCentral N AmericaEastern N AmericaCentral America
AmazoniaSouthern S America
Northern EuropeS Europe, N Africa
SaharaWestern AfricaEastern Africa
Southern AfricaNorthern AsiaCentral Asia
Tibetan PlateauEastern Asia
Southern AsiaSoutheast Asia
Northern AustraliaSouthern Australia
‐2 ‐1 0 1 2 3
Imperfect
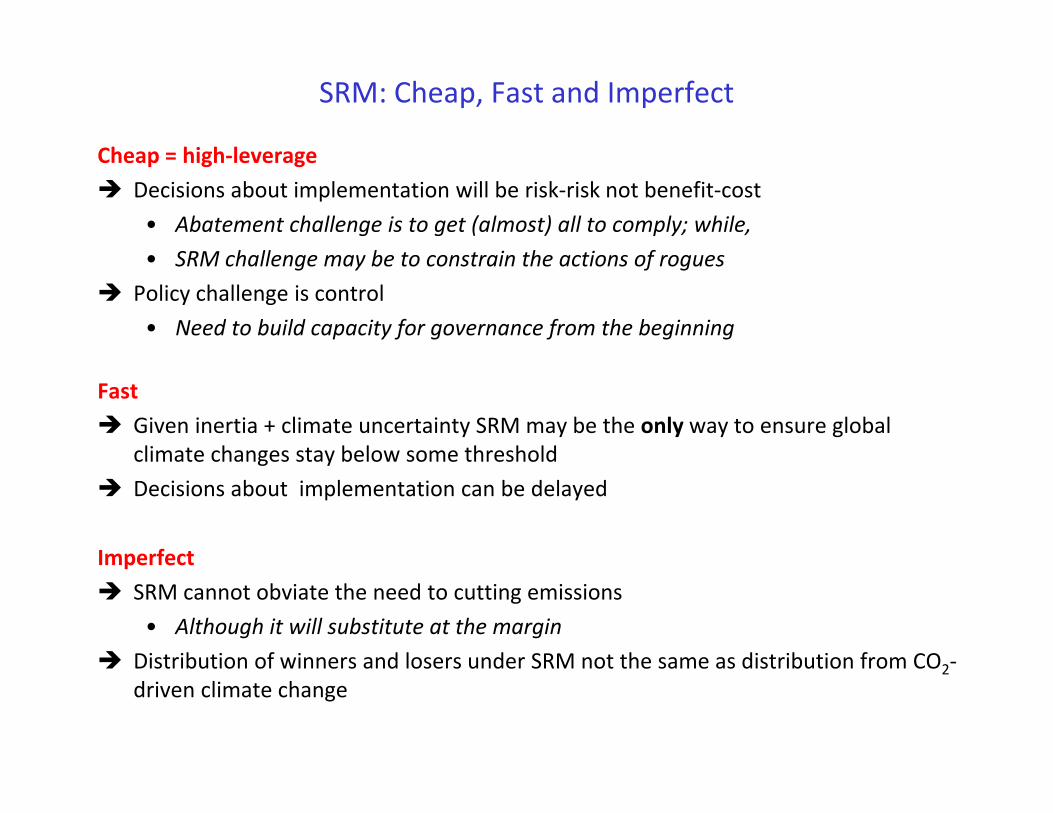
SRM: Cheap, Fast and Imperfect
Cheap = high‐leverage Decisions about implementation will be risk‐risk not benefit‐cost
• Abatement challenge is to get (almost) all to comply; while,• SRM challenge may be to constrain the actions of rogues
Policy challenge is control• Need to build capacity for governance from the beginning
Fast Given inertia + climate uncertainty SRM may be the only way to ensure global
climate changes stay below some threshold Decisions about implementation can be delayed
Imperfect SRM cannot obviate the need to cutting emissions
• Although it will substitute at the margin Distribution of winners and losers under SRM not the same as distribution from CO2‐
driven climate change
46
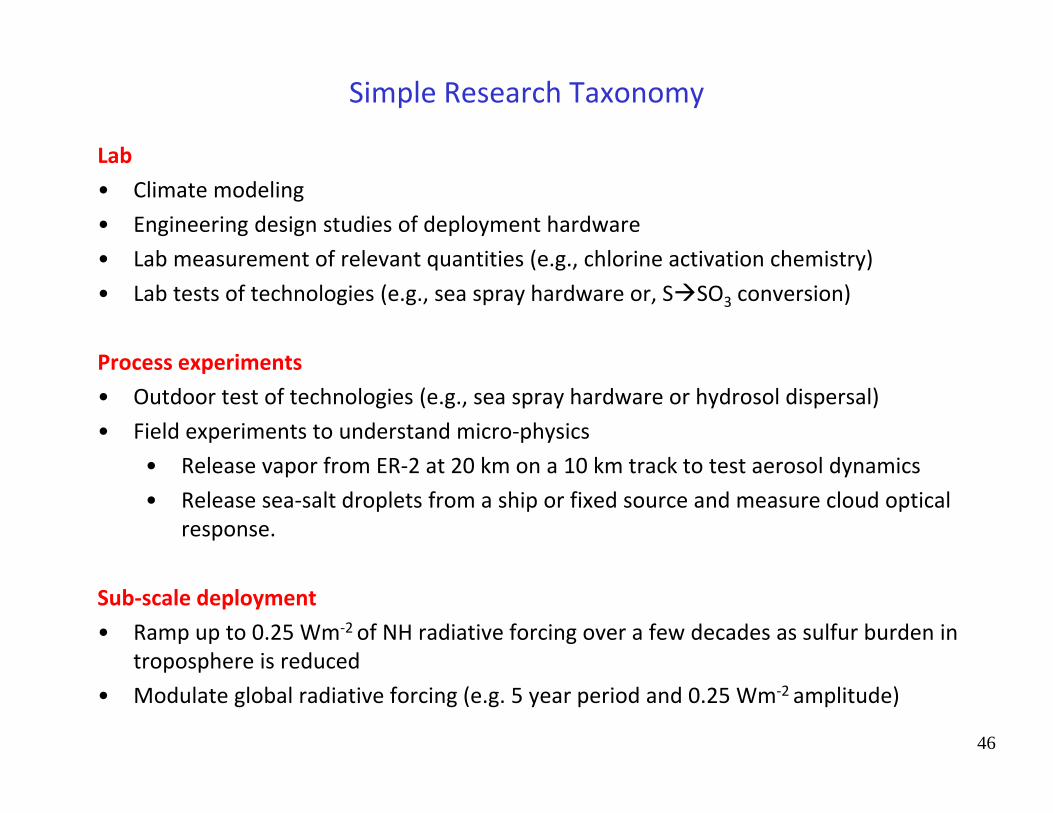
Simple Research Taxonomy
Lab• Climate modeling• Engineering design studies of deployment hardware• Lab measurement of relevant quantities (e.g., chlorine activation chemistry)• Lab tests of technologies (e.g., sea spray hardware or, SSO3 conversion)
Process experiments • Outdoor test of technologies (e.g., sea spray hardware or hydrosol dispersal)• Field experiments to understand micro‐physics
• Release vapor from ER‐2 at 20 km on a 10 km track to test aerosol dynamics• Release sea‐salt droplets from a ship or fixed source and measure cloud optical
response.
Sub‐scale deployment• Ramp up to 0.25 Wm‐2 of NH radiative forcing over a few decades as sulfur burden in
troposphere is reduced• Modulate global radiative forcing (e.g. 5 year period and 0.25 Wm‐2 amplitude)
47
48
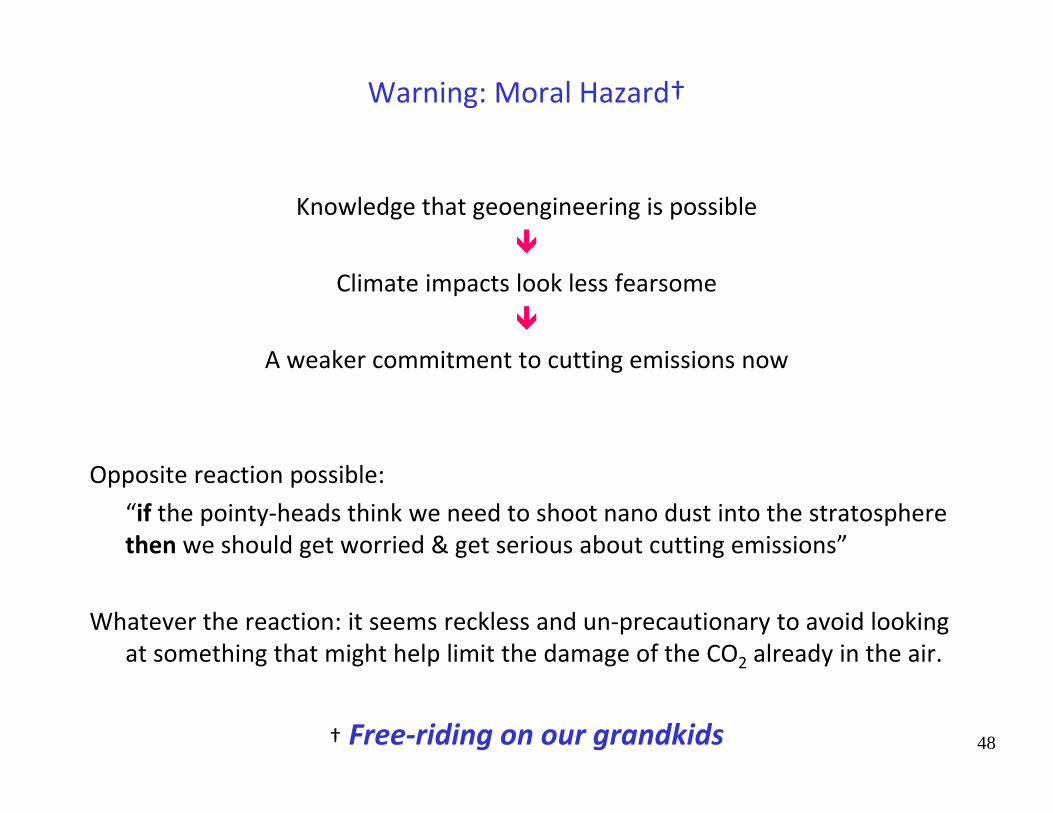
Warning: Moral Hazard†
Knowledge that geoengineering is possible
Climate impacts look less fearsome
A weaker commitment to cutting emissions now
Opposite reaction possible: “if the pointy‐heads think we need to shoot nano dust into the stratosphere then we should get worried & get serious about cutting emissions”
Whatever the reaction: it seems reckless and un‐precautionary to avoid looking at something that might help limit the damage of the CO2 already in the air.
† Free‐riding on our grandkids
4949
50
www.ucalgary.ca/~keith
Ken Caldeira and David W. Keith. (2010) The Need for Climate Engineering Research. Issues in Science and Technology. Fall: 57‐62
David W Keith, Edward Parson and Granger Morgan (2010) Research on global sun block needed now. Nature, 463: 426‐427.
David Keith. (2010). Photophoretic levitation of aerosols for geoengineering, PNAS
David Keith (2010). Engineering the Planet. Climate Change Science and Policy. S. Schneider and M. Mastrandrea eds.
Shepherd, J., K. Caldeira, J. Haigh, D. Keith, B. Launder, G. Mace, G. MacKerron, J. Pyle, S. Rayner, C. Redgwelland A. Watson (2009). Geoengineering the climate ‐ Science, governance and uncertainty. The Royal Society (UK).
David Keith. (2009). Why Capture CO2 From The Atmosphere? Science, 325: 1654‐1655.
J. J. Blackstock, D. S. Battisti, K. Caldeira, D. M. Eardley, J. I. Katz, D. W. Keith, A. A. N. Patrinos, D. P. Schrag, R. H. Socolow and S. E. Koonin, (2009) Climate Engineering Responses to Climate Emergencies Novim.
Juan B Moreno‐Cruz and David W Keith (under review). Climate Policy under Uncertainty: A Case for Geoengineering. Climatic Change
David Keith (2001). Geoengineering. Nature, 409: 420.
David Keith (2000). The Earth is Not Yet an Artifact. IEEE Technology and Society Magazine, 19: 25‐28.
David Keith (2000). Geoengineering the Climate: History and Prospect. Annual Review of Energy and the Environment, 25: 245‐284.
David Keith and Hadi Dowlatabadi (1992). A Serious Look at Geoengineering. Eos, Transactions American Geophysical Union, 73: 289‐293.