Embed Size (px)
Citation preview

Belmont Citizens Forum
September/October 2014 Preserving Belmont’s Small-Town Atmosphere Vol. 15, No. 5
Solar Electricity Pricing Plans DebatedBy Meg Muckenhoupt and Virginia Jordan
When a homeowner’s roof-top solar panels generate more electricity than needed, how much should Belmont Light pay for the excess energy fed back to the grid?
That question is roiling environmental circles in Belmont. Cutting the payback makes it less likely for people to install solar panels. But, are ratepayers subsidizing solar power, or vice versa, and if so, by how much? Concerned residents can comment at the Belmont Light public hearing on September 18, 2014, at the Town Hall Auditorium, 455 Concord Avenue.
BackgroundIn 2008, Massachusetts mandated that
utilities adopt new net metering incentives to encourage renewable energy installations. “Renewable energy” means solar, wind, or other non-fossil-fuel. “Installations” for Belmont means many small installations around town, mainly photovoltaic solar panels. “Net metering” means a utility agrees to buy back energy at the same retail rate at which it sells; this has been available to customers since the 1980s. The state imposed the requirement for all private-investor utilities, like NStar, though not for municipal utilities like Belmont Light. The industry sometimes refers to renewable energy as “emission free,” and for “many small installations” uses the term “distributed generation,” in contrast to centralized generation from a large coal-fired or nuclear power plant.
In 2011, Belmont Light (then called the Belmont Municipal Light Department) adopted a two-phase plan for buyback of emission-free, renewable distributed generation. Phase I was net metering and started in 2011. Phase II, a more complex arrangement, was proposed for 2012,
with an annual cap on solar buyback of 2% of total system sales.
Under Phase 1 net metering, to calculate the monthly bill, Belmont Light would measure the total amount of electricity a household uses and then subtract the electricity the household produces. If Mary and Bob Sunshine use 100-kilowatt hours (kWh) in a month and their photovoltaic solar panel system produced 75 kWh hours, they would be billed simply for 25 kWh. On the other hand, if their system produced 125 kWh, they would be billed nothing that month and credited 25 kWh against future use.
The retail cost of electricity to Belmont residents includes the wholesale cost plus overhead. Wholesale is what Belmont Light pays to energy providers; it appears on your electric bill as Generation Usage. Overhead includes maintenance of distribution lines and transformers within town; energy loss as electricity is transmitted from far-away power plants to Belmont; conservation programs; and administration. As of July, Generation Usage was approximately 48% of per-kWh charges, Distribution 36%, Transmission 14%, and Conservation 1%. (Two smaller monthly adjustments may be charges or credits. Administration costs are implicit, not a separate charge.)
If enough people used solar panels without paying toward overhead, Belmont Light could go bankrupt. That’s not likely now—the state recorded only 17 solar installations in Belmont last year among Belmont Light’s 11,274 customers—but enough solar buyback (like enough conservation) could bring financial strain.
Phase II implementation was postponed in 2012 because the necessary technology was not

2 www.belmontcitizensforum.org
Belmont Citizens Forum
OfficersGrant Monahon, PresidentJohn Dieckmann, Vice PresidentEvanthia Malliris, SecretaryRadha Iyengar, Treasurer
DirectorsSumner Brown David ChaseAnne-Marie Lambert Vince Stanton Jr.
NewsletterMeg Muckenhoupt, Editor, ProductionSusan Jones, PhotographySue Bass, Newsletter Committee, Director Emerita
Belmont Citizens Forum Inc. is a not-for-profit organization that strives to maintain the small-town atmosphere of Belmont, Massachusetts, by preserving its natural and historical resources, limiting traffic growth, and enhancing pedestrian safety. We do this by keeping residents informed about planning and zoning issues, by participating actively in public hearings, and by organizing forums. Our Newsletter is published six times a year, in January, March, May, July, September, and November. Published material represents the views of the authors and not necessarily those of the Belmont Citizens Forum.
Letters to the editor may be sent to P. O. Box 609, Belmont MA 02478 or to [email protected].
available. Since then, smart meters are installed in over 3,000 homes. (See “Smart Meters are Coming to Belmont”, Belmont Citizens Forum Newsletter, May/June 2013). As of the end of 2013, Belmont Light spent over $618,000 implementing smart meters and their secure private communications network.
In Phase II, customers delivering excess solar electricity back to the grid would be paid a wholesale price, rather than the current retail rate. For electricity consumed “behind the meter,” inside the solar panel owner’s home, Belmont Light would not charge anything, forgoing a share of overhead costs to maintain
the local power grid. Phase II also limits the solar production Belmont Light will pay for to 2% of the system’s annual kWh sales.
In January 2014, Belmont Light proposed moving to Phase II and a new Phase III policy. Phase III is not yet possible in Belmont. Once equipment is available, Phase III would continue to charge retail prices for electricity drawn from the grid and to pay wholesale prices for electricity released to the grid. However, Belmont Light would also charge for electricity consumed inside the home to cover overhead costs, to eliminate the subsidy to solar panel owners.
Belmont Light argues it is not economically sustainable to pay the retail price of electricity to households producing excess solar energy, and unfair while it pays other energy providers a wholesale rate.
The question remains: what is the right price for Belmont residents to pay for locally generated solar electricity?
RT-LMP, A Very Variable Wholesale RateBelmont Light proposes to use the real-time
locational marginal price (RT-LMP) to calculate Phase II wholesale energy pricing. This price fluctuates from day to day and from hour to hour, according to the demand for electricity, the cost of fuel for New England’s power plants, and the cost of starting up idled generators. For example, coal-powered plants are less efficient when they start up and shut down to meet spikes in demand, using more fuel and producing more pollution per hour than when they run continuously.
Our regional transmission system, the electrical grid, is run by ISO New England, an independent not-for-profit company. Their web site displays the real-time fluctuation in the price of electricity, www.iso-ne.com/isoexpress. For example, on the afternoon of July 3, a muggy day with a high temperature of 91 degrees, the hourly RT-LMP peaked between 4 and 5 PM at $363 per megawatt, or 36 cents per kilowatt. Earlier that same day, between 4 and 5 AM, the RT-LMP was only $27 per megawatt, or under 3 cents per kilowatt, and returned to that level or below for all of the following day, a factor of 10 less. Two weeks later on July 17, a merely warm day with a high temperature of 81 degrees,

September/October 2014 3
the RT-LMP ranged from about $15 to $34 per megawatt. On January 3, a bitterly cold day with a high of just 12 degrees, rates ranged from $125 to $250 per megawatt. Solar panel owners would be paid a lot more money under Phase II for their electricity on a day like July 3 than July 17.
Economics and ValuesDoes the RT-LMP accurately reflect the value
of solar energy to the town and to the future?Belmont Light asserts that under Phase I,
solar panel owners received a “cross-subsidy,” a subsidy paid for by other customers who do not have solar panels. Belmont Light calculates that cross-subsidy for solar panel owners at an average of $679 a year apiece—60% more than the $422 a year cross-subsidy Belmont Light offers to low-income residents. Of its $21 million in revenue last year, Belmont Light spent about $10,200 to encourage residents to generate solar
electricity and $198,458 to subsidize low-income residents.
Those numbers don’t include either the 9kW solar installation at Habitat or the Belmont Hill School’s 185kW solar installation, which has more than twice the capacity of the 15 residential installations combined. Habitat sells excess electricity back to Belmont at the same net metering rate as residential customers. The Belmont Hill School does not feed any excess electricity back into the town grid, and thus is not part of Belmont Light’s net metering according to Bill Mahoney, director of communication at the Belmont Hill School.
A major objection to the new policy is that Phase II pricing will make solar panels unaffordable to homeowners. The town will lose the benefit of locally generated, clean electricity. Solar panels don’t pollute the air with particulate matter, they don’t rely on oil or coal shipped
Cost of electricity in dollars per megawatt, across 24 hours on three dates in 2014:January 3 (gray), July 3 (black), and July 17 (dotted).
MEG
Mu
Ck
ENh
Ou
PT/I
SO N
EW E
NG
LAN
D

4 www.belmontcitizensforum.org
from distant areas, and virtually no solar-generated electricity is lost in the form of heat from transmission lines.
Belmont Light representatives argue that solar isn’t available during many peak periods and that it’s a more expensive way to reduce carbon consumption and pollution than buying electricity via Belmont Light’s Green Choice program, which gets electricity from wind farms in Maine. Ashley Brown, chair of the Belmont Light Advisory Board, said wind makes up about 3% of Belmont’s electricity purchases. Belmont Light currently charges an additional $.06 per kilowatt hour for its Green Choice program.
Case Study: how Much Solar CostsAlix Van Geel, a Belmont resident and
advocate for retaining Phase I prices, installed a photovoltaic solar panel array in 2011. Her array is rated as 5 kilowatts, meaning that under perfectly sunny conditions it could generate 5 kWh per hour. It cost $26,250 to install, or $5.25 per watt, and was eligible for a federal tax credit of 30% and a state tax credit of $1,000, for a net outlay of $17,375. She expects it to last 25 years. For the past three years, her array has produced 935 kWh total over the three winter months
December through February (about 10kWh per day), and 2,057 kWh (about 22 kWh per day) in the summer months June through August.
Van Geel’s installation is typical: the 15 residential solar installations in Belmont are rated at 4.76 kWh on average and cost an average of $27,000 to install.
Belmont Light estimates that the average solar customer generates about 6,400 kWh annually, or 85% of their electricity consumption, and under Phase I net metering receives $1,147 in reduced electricity costs a year.
Under Phase I, Van Geel can expect to recoup her installation costs in a little over 15 years. Under Phase II, it would take close to 23 years to make back the money she spent on panels—close to the expected life span of her installation. That difference in payback would be likely to discourage new solar panel installations.
What is the Value of Solar Electricity?The main debate about Phase II and Phase
III is price. Belmont Light’s policy makers think that Belmont pays too much money for solar electricity; solar panel owners think that reducing their compensation is bad public policy.
Belmont Light’s summary of residentail solar net metering Phases I-III.
BEL
MO
NT
LIG
hT

September/October 2014 5
Fairness“We need to get prices in place in ways that
protect other ratepayers,” who are now paying 59% of the distribution costs of solar, Brown said. Solar advocates respond that Belmont Light neglects the benefits of solar. Homeowners, not Belmont Light, pay to install panels, saving the department from purchasing new generating capacity. Solar panels also save the cost of transmitting energy from Maine along electrical lines that lose energy to heat. That’s about two to three cents per kilowatt, according to Mark Sandeen, chair of Lexington Global Action Coalition and founder of RePower Partners solar energy firm.
Solar installations also increase the reliability of the local grid, reduce demand, and reduce pollution-related deaths. MIT studies peg the health benefits of solar power at two and a half cents per kWh because of reduced deaths and disability from asthma, emphysema, heart disease, and other ills, Sandeen said.
In addition, paying the average retail price for solar power costs less than peak RT-LMP prices for power on the open market, Sandeen said, which can reach $0.26 or more.
Carbon ReductionBrown criticized locally generated solar energy
as a wasteful way to reduce carbon. He said it costs 18 cents per kWh, when New England wind farms produce energy for 8 cents per kWh. “If the main objective is to reduce carbon, it’s grossly inefficient,” said Brown. “The subsidy is not an incentive to be more efficient [in reducing carbon.]”
But should Belmont residents have to choose between two sources of non-polluting energy? Both are important in a larger context. Noting that the town’s climate action plan, adopted in 2009 by Town Meeting and the Board of Selectmen, aimed to cut Belmont’s carbon emissions by 80% by 2050, Sustainable Belmont’s Energy Working Group called pitting Green Choice energy against local solar power a “false choice.”
Is it possible to attain Belmont’s 2050 goal with Green Choice energy alone? If not, what alternatives does Belmont have, and how much money will the town and Belmont Light make available to pursue them?
The majority of New England’s electricity (52%) is generated via natural gas, a potent
hourly peak electricity demand in New England. Source: ISO New England 2013 Regional Electricity Outlook, p. 18.
ISO
NEW
EN
GLA
ND
6 www.belmontcitizensforum.org
source of climate-warming greenhouse gases. According to a comment letter submitted to Belmont Light by the Sierra Club, “In contrast [to solar energy], up to 25% of each cubic foot of natural gas (methane) leaks into the air between wellhead and combustion. And each methane molecule is at least 70 times more potent as a global warming greenhouse gas than carbon dioxide.”
“The real value of solar,” said Sandeen, “is clean air, clean water, and a cooler climate. We ought to take that into account.”
Solar Timing: A Matter of ChoiceThe timing of solar energy doesn’t fit
Belmont’s energy use, Brown said. In New England, solar energy generation peaks at midday, about noon to 2 PM, while peak demand is between 2 and 5 PM, when Belmont residents come home and turn on their lights and air conditioning. “Our primitive solar technology does not match New England peaks,” Brown said.
In addition, solar panels, like wind, do not have consistent generating capacity. If it’s cloudy or raining, they won’t produce electricity—and if it’s sunny, most solar panel owners have no way of storing their electricity for darker times. “How do you value that?” Brown asked. “They [solar panel owners] want treatment that no other generator gets. Why should ratepayers pay for capacity when they don’t get capacity?”
Sandeen said the same is true of Green Choice Energy. Wind farms’ capacity shifts with the breeze and the season. New England wind farms, on land and offshore, produce about 50% less electricity during the summer than in winter: they are unreliable for powering air conditioners. New England winds start building in the early evening, growing to a peak just as most Belmont residents are heading to bed.
If it’s important to produce more solar energy later in the day, Sandeen observed, solar panels could be aimed to face west, not south, and tilted to capture more late-afternoon sun. It might not produce as much energy as the typical installation, but it could produce more energy at late-day peaks.
Who is Subsidizing Whom? Brown criticized the solar industry for relying
on taxpayer subsidies and observed that solar customers tend to be more affluent and use more energy than Belmont Light’s other customers. “Socially, it’s very regressive” to offer solar subsidies, Brown said.
Sustainable Belmont’s Energy Working Group counters that Belmont Light’s offer to pay RT-LMP values the contributions of solar panels to reducing capacity, transmission, and distribution costs at zero and sets up a cross-subsidy from solar panel owners to the rest of Belmont. The Sierra Club did not mince words about Phase II: “In other words, Belmont Light is proposing to permit it in effect to ‘take’ the privately paid for solar system (paid for by the homeowner) and to run it as if it built it itself without having paid for it.”
Some solar advocates disputed that there is a subsidy at all. Van Geel said a 2012 study found that when solar pricing took account of factors including fuel cost savings, security enhancement value, fuel price hedge value, environmental value, and economic development value, the total net value of locally
More Information
Belmont Light has posted its documents from the June 19, 2014 meeting on the Phase II tariff at the bottom of its web site’s “Leadership” page.
You can find Belmont Light’s memo, summary tables, and list of questions distributed to the public at www.belmontlight.com/about-us/management.php?id=5
Sustainable Belmont’s collection of comment letters is available at on the group’s home page, www.sustainablebelmont.net.
Track real-time regional electrical prices at ISO New England’s web site, www.iso-ne.com/isoexpress/

September/October 2014 7
generated solar energy was $0.256 kWh to $0.318 kWh.
In any case, Belmont residents may want to subsidize solar panels. As Phil Thayer said in his comment letter, “But even if staff are right about the magnitude of the net metering cross-subsidy, doesn’t the Green Choice program experience indicate that some of Belmont’s customers are willing to pay at least $.06/kWh to subsidize green power?”
Solar + Storage Changes DebateIn a few years, Brown says, the terms of
the debate could change. Many analysts are predicting that systems combining solar electricity with storage batteries—“s+s”—will allow solar providers to provide energy at peak. “The economic and environmental aspects are perfectly aligned,” Brown said. That day may be near: plug-in electric cars like the Tesla could serve as storage batteries for solar electricity, and many analysts think that Tesla will improve its batteries over the next few years.
In the meantime, Brown decries Phase I’s adverse incentives. “If you have an absolute right to earn a profit on solar energy, you have a guaranteed inefficiency,” Brown said.
Alternatives to Net MeteringThe RT-LMP does not reflect the total cost
of generating electricity, solar or otherwise. Several alternatives to Phase II’s net metering for compensating solar panel owners have been proposed.
Sustainable Belmont’s Energy Working Group suggested that Belmont Light pay for solar power on the basis of the previous month’s average daily peak-hour wholesale price, as Groton and Concord’s municipal utilities do. The rate should be “appropriately adjusted to reflect Belmont Light’s long-term avoided costs and the energy’s environmental benefits (e.g., via avoidance of greenhouse gas emissions).” While less generous to solar, the Working Group said, that would “allow the economics of going solar to become sufficiently favorable that, in our view, the decision to go solar will remain financially viable in combination with the current additional incentives that are in place.”
Sixth Annual Belmont Serves Day:Making a Difference in Belmont
The sixth annual Belmont Serves Day will take place Monday, October 13 (Columbus Day) 8 AM–1 PM atSt. Joseph Parish hall, at the corner of Common Street and School Street. Volunteers may participate in one of several service projects including: Door-to-door food drive for the Belmont
Food PantryConservation land maintenance at Rock
MeadowClaypit Pond clean-up and improvementsConservation projects at Lone Tree hill
(former McLean property)
Most projects are suitable for a wide range of ages and skill levels. Community service hours can be earned by middle school and high school students. For more information, visit www.belmontrc.org/service.html
Roger Colton, chair of Belmont’s Energy Committee, suggested a tariff similar to what the city of Austin, Texas, uses for valuing its residents’ solar installations. Austin’s valuations include fuel price, hedge value, transmission and distribution capacity savings, and environmental benefits.
Van Geel’s comment letter proposed a different approach. Belmont Light could begin to install solar panels on properties around town—including rental and low-income properties—to gain more local benefits of solar energy, and share them with ratepayers who can’t afford the up-front costs of installing panels. Arizona Public Services utility has done just that.
“People ask, why are we making this complicated?” said Brown. “We’re not. It is complicated.”
Meg Muckenhoupt is Editor of the Belmont Citizens Forum Newsletter. Virginia Jordan is a Precinct 6 Town meeting member.
8 www.belmontcitizensforum.org
What’s the Safest Path Across Belmont Center?By Vincent Stanton Jr.
Town Meeting will vote on a roughly $2.6M re-design of Belmont Center this fall. One important question in danger of being ignored is: how should a future community path traverse the busy maze of streets around Belmont Center, and does the new design preserve the best options?
Community paths should provide connections with paths in adjacent communities, enhanced links to public transportation, and relatively flat terrain. For Belmont that means the eastern terminus of a path should be at Brighton Street, where the Fitchburg Cutoff path runs to Alewife Station, and the western terminus should be in the Waverley Square area to connect to the Massachusetts Central Rail Trail. That trail will start in Waltham (near Waverley Square) and extend, eventually, to Northampton, over 90 miles away; several segments of that trail have already been built.
Since Belmont Center is more or less between those two endpoints, and because it is located along the only level route through Belmont, it is inevitable that a path should pass through the Center. Four Belmont path studies conducted over the past 17 years have agreed on this point.
The most recent study of community path routes, completed by the Community Path Advisory Committee (CPAC) in June, initially considered four routes on the west side of Belmont Center (between the Clark Street bridge and Belmont Center Station), all of which parallel the Fitchburg Line and all but one of which terminate at the train station. CPAC also considered a dozen routes between Belmont Center and Brighton Street, all of which start in the vicinity of the Coldwell Banker building and connect to the Fitchburg Cutoff path. The question, then, was: how to get across Leonard Street from Belmont Station to Coldwell Banker?
Crossing Belmont Center on footThe simplest answer, and the CPAC
recommendation, is to cross Leonard Street via the railroad bridge (more on that route below). But is there really no alternative? To answer that
question it is instructive to review the current east-west crossing options for pedestrians. Consider, for example, pedestrians funneling toward Belmont Center and Concord Avenue from neighborhoods south of the Fitchburg Line and west of Common Street. They include high school students, commuters walking to the 74 bus line, and residents walking to or from Belmont Center, the post office, library, Underwood Pool or high school athletic facilities. Many of them walk down Royal Road or the west side of Common Street.
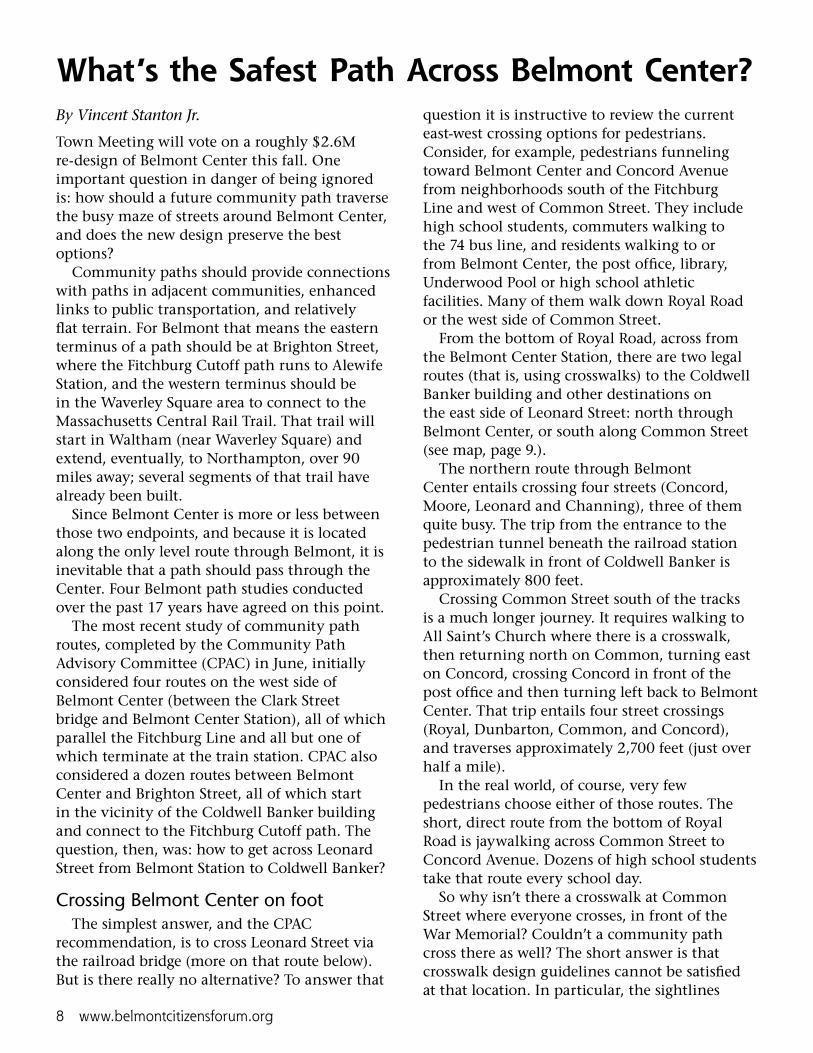
From the bottom of Royal Road, across from the Belmont Center Station, there are two legal routes (that is, using crosswalks) to the Coldwell Banker building and other destinations on the east side of Leonard Street: north through Belmont Center, or south along Common Street (see map, page 9.).
The northern route through Belmont Center entails crossing four streets (Concord, Moore, Leonard and Channing), three of them quite busy. The trip from the entrance to the pedestrian tunnel beneath the railroad station to the sidewalk in front of Coldwell Banker is approximately 800 feet.
Crossing Common Street south of the tracks is a much longer journey. It requires walking to All Saint’s Church where there is a crosswalk, then returning north on Common, turning east on Concord, crossing Concord in front of the post office and then turning left back to Belmont Center. That trip entails four street crossings (Royal, Dunbarton, Common, and Concord), and traverses approximately 2,700 feet (just over half a mile).
In the real world, of course, very few pedestrians choose either of those routes. The short, direct route from the bottom of Royal Road is jaywalking across Common Street to Concord Avenue. Dozens of high school students take that route every school day.
So why isn’t there a crosswalk at Common Street where everyone crosses, in front of the War Memorial? Couldn’t a community path cross there as well? The short answer is that crosswalk design guidelines cannot be satisfied at that location. In particular, the sightlines
September/October 2014 9
A map of current options for pedestrians crossing Belmont Center.
VIN
CEN
T ST
AN
TON
JR
.
recommended by the American Association of State Highway Transportation Officials (AASHTO) for non-signalized intersections, and by the Manual on Uniform Traffic Control Devices for signalized crosswalks, cannot be met because of the continuous curve of Common Street from the railroad bridge to the intersection with Dunbarton Road.
There are at least three other problems with a crosswalk in front of the War Memorial.
Common Street rises from the railroad bridge to the island, which would prevent drivers from seeing a crosswalk until they surmount the rise, and would also limit the visibility of pedestrians.
For vehicles traveling toward Belmont Center on Common Street, the wooden fence (six feet sic inches tall with seven feet four inch posts) on the east side of the street (along the Underwood Estates), further limits the vision of drivers,
particularly for pedestrians on the east side of Common Street.
The Concord-Common-Leonard intersection has been rated “level of service F” at rush hour by the town’s traffic consultants, meaning it does not function as an effective roadway at those times.
Traffic approaching Belmont Center on Common Street usually backs up to Royal Road at rush hour, and often to Dunbarton Road, while at the same time cars exiting the intersection on Common Street are frequently accelerating away from the traffic nightmare. The combination of slow or stopped cars in two lanes of Belmont Center-bound traffic, and rapidly moving cars in the opposite (southbound) lane is a particularly dangerous mix for pedestrians. Installing a crosswalk at the perimeter of a failing intersection, particularly
10 www.belmontcitizensforum.org
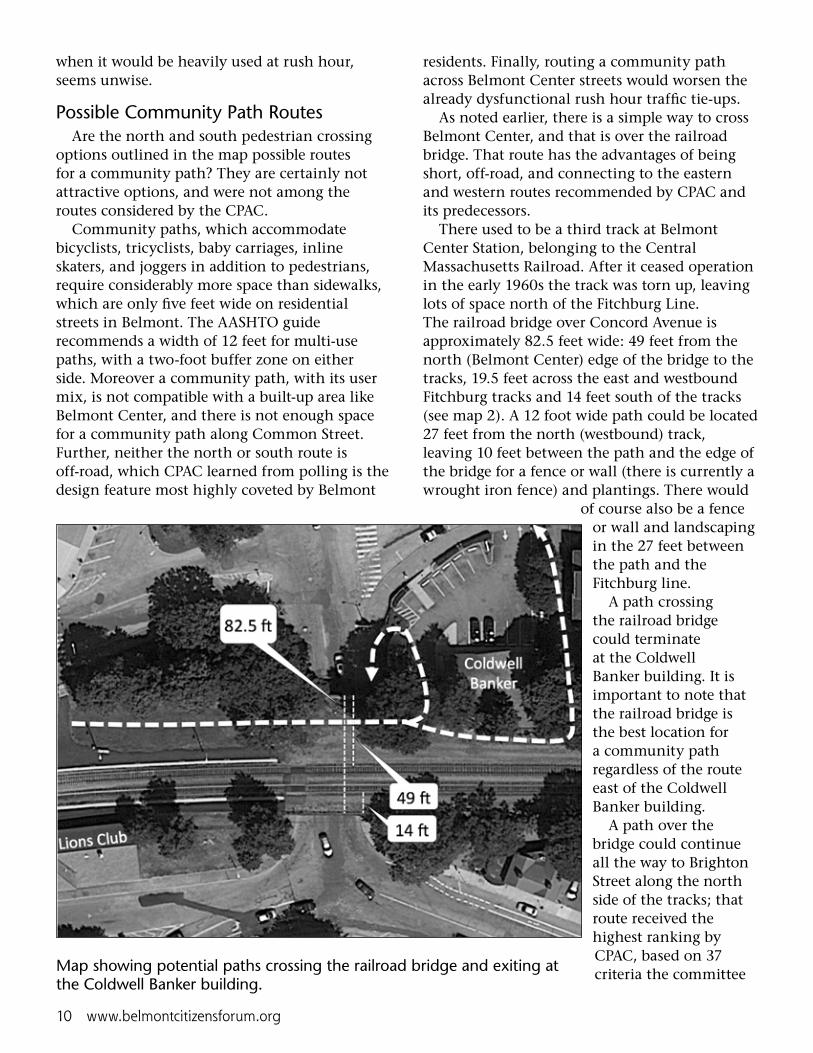
Map showing potential paths crossing the railroad bridge and exiting at the Coldwell Banker building.
when it would be heavily used at rush hour, seems unwise.
Possible Community Path Routes Are the north and south pedestrian crossing
options outlined in the map possible routes for a community path? They are certainly not attractive options, and were not among the routes considered by the CPAC.
Community paths, which accommodate bicyclists, tricyclists, baby carriages, inline skaters, and joggers in addition to pedestrians, require considerably more space than sidewalks, which are only five feet wide on residential streets in Belmont. The AASHTO guide recommends a width of 12 feet for multi-use paths, with a two-foot buffer zone on either side. Moreover a community path, with its user mix, is not compatible with a built-up area like Belmont Center, and there is not enough space for a community path along Common Street. Further, neither the north or south route is off-road, which CPAC learned from polling is the design feature most highly coveted by Belmont
residents. Finally, routing a community path across Belmont Center streets would worsen the already dysfunctional rush hour traffic tie-ups.
As noted earlier, there is a simple way to cross Belmont Center, and that is over the railroad bridge. That route has the advantages of being short, off-road, and connecting to the eastern and western routes recommended by CPAC and its predecessors.
There used to be a third track at Belmont Center Station, belonging to the Central Massachusetts Railroad. After it ceased operation in the early 1960s the track was torn up, leaving lots of space north of the Fitchburg Line. The railroad bridge over Concord Avenue is approximately 82.5 feet wide: 49 feet from the north (Belmont Center) edge of the bridge to the tracks, 19.5 feet across the east and westbound Fitchburg tracks and 14 feet south of the tracks (see map 2). A 12 foot wide path could be located 27 feet from the north (westbound) track, leaving 10 feet between the path and the edge of the bridge for a fence or wall (there is currently a wrought iron fence) and plantings. There would
of course also be a fence or wall and landscaping in the 27 feet between the path and the Fitchburg line.
A path crossing the railroad bridge could terminate at the Coldwell Banker building. It is important to note that the railroad bridge is the best location for a community path regardless of the route east of the Coldwell Banker building.
A path over the bridge could continue all the way to Brighton Street along the north side of the tracks; that route received the highest ranking by CPAC, based on 37 criteria the committee
September/October 2014 11
Correction
Several house prices were missing from the map accompanying the article “Do homebuyers Value Recreational Paths?,” Belmont Citizens Forum Newsletter, July/August 2014. The Belmont Citizens Forum regrets the error. A corrected version of the map appears on the forum’s web site, www.belmontcitizensforum.org.
Readers may also be interested to know that in August, Coldwell Banker realty wrote in the description for 59 Channing Road: “Your commute will love it. This super Belmont Center Condo offers quick access to inbound public transportation as well as easy connection to Rte. 2 and points West, North or South. Close to walking trails and bike paths, Alewife and harvard Sq., this is a great place to start your trip to wherever...”
developed for evaluating possible routes (see CPAC website for details). However, there is strong opposition to that route from some Channing Road residents. A route on the north side of the tracks could alternatively extend from Belmont Center to Alexander Avenue Extension, passing under the tracks to the south at that point via an underpass recommended by CPAC, the 2012 Metropolitan Area Planning Council study, the 2010 Belmont Comprehensive Plan and several other studies. Another option CPAC recommended for further study is a route on the south side of the Fitchburg Line. Although the space is quite narrow, particularly at the bridge, that route would be relatively non-controversial.
Another route option considered by CPAC involves connecting a path on the north side of the tracks and Channing Road just east of the Colswell Banker building (see map p. 10) via an easement. Alternatively, it might be possible to connect on the west side of the building, however the steep grade would require a long ramp. That connection to Channing Road would be a valuable path feature regardless of the route to Brighton Street: it would reduce the amount of pedestrian and bike traffic crossing Leonard Street because there would be access to the path from both sides of Belmont Center, and path users could easily access businesses on the east side of Belmont Center.
Effect of Belmont Center RedesignThe Belmont Center redesign that will be
considered at Town Meeting this fall will narrow Leonard Street, partly by adding five- foot-wide bicycle lanes in either direction, and partly by widening the sidewalks. Traffic will be channeled into a single, narrower travel lane in both directions. New sidewalk curb extensions will enhance crosswalk safety. The intersection of Channing Road with Claflin and Cross Streets will be redesigned along similar lines with curb extensions narrowing the crossing distance for pedestrians. The new bicycle lanes on Leonard will allow riders to connect to the community path from east of Belmont Center.
The small park in front of Belmont Savings Bank will be expanded by eliminating the Leonard Street offshoot that passes in front of the bank. Concord Avenue would be widened
near the intersection with Leonard Street, partly to create new on-street parking, and partly to enable a new set of crosswalks at the intersection of Concord and Leonard, including a new crosswalk across Leonard approximately 60 feet from the bridge. This new crosswalk, together with another new crosswalk across Concord Avenue on the other side of the bridge (in front of the hair salon and florist) will considerably simplify the pedestrian journey across Belmont Center, albeit at some cost to traffic flow. However, these crosswalks have not been designed as a community path route, and they would not make an appealing path.
The current version of the plan does not alter the area around the pedestrian underpass or Belmont Light building. That is the best location for a future spur connecting the community path to Concord Avenue and businesses on the west side of Leonard Street.
Vincent Stanton Jr. is a director of the Belmont Citizens Forum. he was a member of the Community Path Advisory Committee. however, the views in this article are his own.

12 www.belmontcitizensforum.org
Selectmen Discuss Underpass with MBTAby Vincent Stanton, Jr.
The Belmont Selectmen are talking to the MBTA about modifying the ongoing Fitchburg Line Improvement Project to preserve flexibility to construct an underpass beneath the tracks at Alexander Avenue Extension. An underpass would connect the Winnbrook neighborhood with the Belmont High School campus, Underwood Pool, and the library. It would also provide a direct route from the Winnbrook neighborhood to the Chenery Middle School.
A pedestrian underpass at Alexander Avenue Extension has been considered at least since 1982. Town Meeting appointed an Underpass Study Committee that year following the death of a Belmont High School student walking on the tracks. The Belmont Planning Board’s “Comprehensive Plan for Belmont,” adopted by the Belmont Selectmen in 2010, recommended an underpass at Alexander Avenue as a high priority action item to “keep Belmont a walkable community” and to “enhance connections through open space, pedestrian and bicycle infrastructure.”
In June 2014, the Belmont Community Path Advisory Committee recommended an underpass beneath the Fitchburg Line to “safely link the Winn Brook neighborhood to Belmont High School,” to provide access to a future community path (regardless of its location), and “to address the major and ongoing safety hazard of high school and middle school students crossing the tracks to walk to school.”
The MBTA is in the midst of a $277 million upgrade of the Fitchburg Line, the longest, slowest part of its network, with the worst on-time performance. The improvement plan includes two new stations, repair or replacement of seven bridges, extensive regrading of track to smooth the ride and allow trains to travel up to 79 mph, and a complete replacement of the current signal and switching system between Cambridge and Acton. Construction began in January 2012 and is scheduled to finish by December 2015. The Fitchburg Line will shut down on all weekends from July through November 2014, and from April through November 2015.
The MBTA plan also calls for a new crossover between Brighton Street and Belmont Center, a system of connecting track and switches that will allow trains to cross between east and westbound tracks. As originally designed the crossover spanned the area where Alexander Avenue Extension intersects the Fitchburg Line. Construction in that location would make it complicated, if not impossible, to construct an underpass.
MBTA DiscussionsSelectman Chair Andrès
Rojas has been leading discussions with the MBTA. According to Rojas, the MBTA has indicated that it is willing to have its A community path underpass.
FWh
A.G
OV

September/October 2014 13
engineers explore the feasibility of shifting the location of the track crossover to avoid the Alexander Avenue Extension area and to work with Belmont as it continues to investigate the feasibility and costs of an underpass.
An underpass would certainly solve a longstanding problem for the MBTA. Trains can often be heard blaring warning signals at children crossing the tracks at Alexander Avenue. The 1982 Underpass Study Committee counted an average of 77 students crossing the tracks every morning between 7:15 and 7:45 AM. Little has changed since then.
Funding PossibilitiesWhile the debt-burdened MBTA can offer
cooperation, it is not in any position to fund an underpass. However, state or federal funds may be available for an underpass if it is part of a regional transportation or recreation project.
In October 2012 Massachusetts Department of Transportation Secretary Richard Davey announced a statewide “mode shift” goal of tripling the share of travel in Massachusetts by walking, bicycling, and mass transit. A Belmont path connected to the existing Fitchburg Cutoff path to Alewife Station would likely accomplish all three goals.
Much of the funding for the program is federal money earmarked for alternative transportation and disbursed by regional Metropolitan Planning Organizations (MPOs; Belmont is covered by the Boston MPO). Projects recently funded via the MPO include $23.4 million for a 7.5 mile extension of the Bruce Freeman Rail Trail between Framingham and Lowell, including $6.4 million for a bridge that will take the trail over Route 2.
Federal funds will also pay half the cost of a $39 million multi-modal path that will parallel the Green Line Extension from Lowell Street in Somerville to Lechmere Station in Cambridge, a distance of 1.9 miles. When complete that path, together with the Fitchburg Cutoff path, the Linear path and the Somerville Community Path, will provide a continuous off-road route from the Belmont border to Lechmere, with an extension to North Station likely in the future.
The Massachusetts Division of Conservation and Recreation (DCR) also provides funding for trail design and construction as well as land acquisition or easements, albeit on a much smaller budget. The DCR has been actively working to advance the Wayside Trail, which will run from Belmont’s border with Waltham to Berlin along the former right of way of the Massachusetts Central Railroad.
Another approach to state funding would be to ask Belmont’s state senator and representative to earmark money in a transportation funding bill. However, the secretary of transportation is not obliged to spend earmarked funds on targeted projects. Again, a regional project would enjoy a much better chance of success.
Feasibility StudyThe feasibility and cost of an underpass are
currently unknown. However, there are other underpasses beneath the Fitchburg Line, for example, at Yerxa Road in Cambridge. Bigger underpasses than Belmont would need have been built for less that $2 million. For example, a 160-foot pedestrian and bicycle tunnel was constructed beneath five tracks at a commuter rail station in suburban Minneapolis for $1.6 million in 2011. Construction was completed during a continuous 30-hour work window using the open-cut method. (See “How Could Belmont Build a Pedestrian Tunnel?” Belmont Citizens Forum Newsletter, March, 2013, for other underpass construction projects.)
The next step would be a feasibility study. Rojas was uncertain whether the underpass feasibility study would be eligible and qualify for a Community Preservation Act (CPA) grant this year. An application by the Community Path Advisory Committee (CPAC) for feasibility study funds in 2013 was turned down, in part because CPAC was a temporary committee. Rojas cautioned that while talks with the MBTA are ongoing, there is no guarantee of a successful outcome. The Board of Selectmen want to clearly understand the full scope of the underpass proposal before proceeding.
Vincent Stanton Jr. is a Director of the Belmont Citizens Forum.

14 www.belmontcitizensforum.org
Belmont Center gets a major facelift once or twice a century. The last major change dates to 1907, when the railroad bridge was built and Concord Avenue was altered. Belmont should aspire to a 2014 redesign that will hold its appeal until the 22nd century.
Brian Burke, the Belmont Center landlord who redeveloped the former fire station, has proposed a more ambitious concept for the park in front of Belmont Savings Bank. Burke would create a larger park by eliminating the three parking spaces in the current plan (replacing them with new spots along Leonard and Moore), and by closing one end of Moore Street so the park could extend to the north corner of Moore and Leonard. The new landscaping would create a central open space surrounded by trees. At the center of the park would be a
statue or fountain.
Burke, on his own initiative, contacted the Japanese Consulate in Boston about the Japanese government contributing a fountain or statue for the park. The idea behind asking was that Masako Owada, crown princess of Japan, lived in Belmont in the early 1980s when her father worked at the Japanese consulate in Boston. The consulate was unable to provide a formal response, but Burke said they were receptive and suggested he submit a formal request when the plan was further developed.
Burke’s imaginative idea should challenge Belmont citizens to consider whether we have been ambitious enough in re-conceiving the Center.—Vincent Stanton Jr.
Alternative Belmont Center Design
BRI
AN
Bu
RkE/
VIN
CEN
T ST
AN
TON
JR
.
Brian Burke’s proposed Belmont Center redesign. The white dotted line outlines the current park.
September/October 2014 15
Uplands Area Transformed Over Centuries By Anne-Marie Lambert
This article is the first in a series of articles about the history of the Belmont Uplands.
The renowned ornithologist William Brewster, author of The Birds of the Cambridge Region of Massachusetts, probably first saw the wetlands of Cambridge and Belmont when he was a nine-year-old child in 1859. This was the year Belmont was founded. Brewster’s “Great Swamp” took millennia to form, but only a century or two to be all but destroyed by human activity.
Geology The underlying bedrock of the region formed
about 600 million years ago, as part of the continent known as Avalonia. The Atlantic Ocean emerged between what are now the continents of North America and Africa about 200 million years ago, after which millions of years of marine sediment eventually resulted in today’s layer of clay soil atop the bedrock. As the ocean subsided, it was contained by the high ground of Arlington Heights, Belmont Hill, and other parts of the geologic formation known as the Boston Escarpment. A deep channel formed and ran from the Mystic Lakes, through Spy Pond, Perch Pond, and Fresh Pond, draining local tides and groundwater all the way to the Charles River.
About 50,000 years ago, the Laurentide Glaciers came through, depositing large moraines of gravel which rerouted surface waters towards the Mystic River. Silt and clay filled the underground valley, but ground water continued draining through the underground channel towards the Charles River. The melting ice of the glaciers formed the kettle ponds now known as Fresh Pond, Little Pond, and Spy Pond, and large mammals roamed the area: a mastodon tusk dated as 42,000 years old was fished out of Spy Pond in 1959.
The Pequossettes Slowly, a deep layer of nutrient-rich peat
formed beneath a marsh, feeding the lowest layer of the food chain in this area. Ocean tides caused fresh and salt water to rise and fall all the
way from the Mystic River to the three kettle ponds. When the Pequossette tribe arrived, they paddled their canoes on the brooks that formed through the marsh, following the river herring up the “miss-tuk” river tributaries during warmer weather. They also traveled on the old Little River (behind today’s buildings on Acorn Park Drive), and built fish weirs on the narrow channel between Little Pond and Spy Pond.
Colonists With the arrival of English settlers in the
1600s, a more permanent fish weir, a bridge, and “Weir Lane” (today’s Lake Street) were built. One of the first Colonial appointments was a “fish officer” to enforce rules about when landowners were allowed to extract the plentiful alewife fish.
Apart from supporting a cart path through the high ground in the middle of the swampy marsh, through the 1600s and 1700s the land around the Belmont Uplands was considered a “Turkey Swamp,” unfit for farming, and difficult to navigate except when it was frozen enough to support a sled. Later, in the 1700s, the Belmont Uplands portion of a large land grant owned by the Amos Hill family became known as “Williams Island.” The waters surrounding this neglected mound in the middle of the Great Marsh were tidal and flowed across a large enough area to wash away increasing pollution from horse manure, tanneries, and slaughterhouses.
Ice and Brick Industry The advent of the ice industry in 1805 was
the beginning of the end of the Great Marsh. In 1854, Henry David Thoreau wrote about the destruction of natural beauty by the most visible aspects of the ice industry, as did Henry James a half-century later. Horse-drawn plows, fire-prone ice houses, and industrial-scale ice operations removed 10,000 tons of ice from Walden Pond the winter of 1846. At the same time, huge clay pits with collapsing walls were dug by the brick industry, which used mules and then specialty machinery to haul out the high-quality clay.
An even bigger factor in the destruction of the Great Marsh was also driven by the profitable ice

16 www.belmontcitizensforum.org
industry: the railroad. Ever since the Fitchburg Line opened in 1843 to transport ice from Fresh Pond, the flow of the marsh water from one side of the railroad embankment to the other has been limited to a few brooks, ditches, and conduits. The addition of “ice tracks” as railroad spurs further constrained the flow of marsh waters, as did a series of dams and tidal gates on Alewife Brook and other tributaries.
Yet the ice industry itself needed the marsh waters to flow because the key insulation for ice houses was hay, and hay meadows required a functioning irrigation system. Until about 1880, the farmers who profited from selling hay would dredge irrigation ditches annually. These ditches allowed water to flow through the marsh more easily. When electric refrigeration destroyed the ice industry, dredging became uneconomical, and the flowing waters of the marsh came to a mosquito-breeding standstill as the irrigation channels became overgrown. The last of the ice houses closed in the late 1800s.
Population Pressure To compound these problems, concerns about
supplying fresh water to the growing population of Cambridge motivated the first of several critical marsh-destroying actions. In 1875, the Broadway tidal gates were installed at one end of Alewife Brook to prevent pollution and salt water from reaching Fresh Pond. At the same time, the flow of water between Alewife Brook and Fresh Pond was permanently blocked at the other end of the brook, making Fresh Pond an isolated reservoir.
Simultaneously, Belmont and Cambridge battled in the courts about whether a newly permitted slaughterhouse was polluting the Belmont side of Fresh Pond. In 1880, the mayor of Cambridge won his “Petition for Annexation of a Part of Belmont”, after Belmont had only existed for 21 years. From about 1880–1900, Cambridge increased its fresh water supply by building a fresh water aqueduct and conduit along the new border on a right-of-way through the marsh from Little Pond to the part of Fresh Pond still known as “Black’s Nook.”
The 1901 map of the area surrounding Fresh Pond which accompanied William Lyman underwood’s report, “On the Drainage, Reclamation, and Sanitary Improvement of Certain Marsh Lands in the Immediate Vicinity of Boston.” The small tufts of grass indicate marshy land.
W.L
. uN
DER
WO
OD

September/October 2014 17
Growing Pollution Concern about
how to handle sewage from Cambridge’s growing led to a second marsh-killing action. A Combined Sewer Overflow (CSO) system designed to send sewage into Alewife Brook during big rain storms was completed in 1896. In 1899, the Broadway tidal gates which restricted the flow of Alewife Brook were mysteriously destroyed, but the Great Marsh continued to stink. With the marsh’s flow blocked by railroad embankments, with dams and tidal gates upstream and downstream, and with pollution coming in ever more concentrated form from the CSOs, industrial scale slaughterhouses, and tanneries, Brewster’s idyllic “Maple Swamp” (today’s Fresh Pond shopping center), “Wooded Island” (Danehy Park), “Heronry of Night Herons” (close to today’s T station) and “Robin Roost” (near the Belmont Uplands) were in jeopardy.
MalariaHumans were also in danger. In the 1901
map which accompanies “On the Drainage, Reclamation, and Sanitary Improvement of Certain Marsh Lands in The Immediate Vicinity of Boston,” we see how the stage was set for a 1903 malaria epidemic. The result of years of careful study of local hydrology and of mosquito-born disease by biologist and Belmont Board of Health Director William Lyman Underwood, this remarkable piece includes photos from before and after dredging parts
Illustration from underwood’s 1901 report. The caption reads, “Looking east along the south bank of Wellington Brook, in Belmont, about a quarter of a mile above the point where it passes under Concord Avenue...”
of Wellington Brook in an attempt to improve flow through the marshes. Photographs show the many challenges keeping Wellington Brook moving under a bridge on Hittinger Street near today’s Belmont High School, under today’s Brighton Street (then Wellington Street), as the brook crosses under the Fitchburg railroad tracks by Blair Pond, and as it enters the old Little River.
It is startling to see birds-eye views across 65 acres of marshland where there are now industrial buildings and residential developments. Where Brewster saw a beautiful Maple Swamp, Underwood saw opportunity to create more useful agricultural land.
Anne-Marie Lambert is a Director of the Belmont Citizens Forum.
W.L
. uN
DER
WO
OD

18 www.belmontcitizensforum.org
By Adam Rahbee
The Thomas Clark House was demolished on August 21, 2014. After years of struggle to preserve this historic structure, including a 2011 move from its historic location on Common Street to Concord Avenue, options ran out.
The Thomas Clark House’s unique charm and character stemmed not only from its age but also from the series of alterations made to it which largely predated 1850. It was built around 1760 in a saltbox configuration with a small ell to house farm laborers at Clark’s “Mount Pleasant” farm. Thomas Clark himself was a Minuteman who served in the battles at Lexington and Bunker Hill. His home was closer to Pleasant Street at that time. His homestead burned a few years after he died in the 1790s. At that point his family moved into the farm house on Common Street which we called the “Thomas Clark House.”
Thomas Clark House, 1760-2014
The ell of the house was expanded around 1800, providing two new large kitchen hearths and two beehive bake ovens. The old kitchen was converted to a parlor. This old kitchen’s massive early style firebox still lay hidden in the walls in modern times, though the bake oven had been removed in the expansion.
Around 1840 a farm outbuilding known as the “carriage house” with its shed opening to the rear was moved and joined to the house to provide more space. It is not known where the shed was located but the ruins of a stone foundation still lay less than a hundred feet away before the house was moved in 2012. Over the generations, the sloping saltbox roof of the 1760 wing was interrupted to add bathroom space and closets, giving an appearance almost identical to Lexington’s Monroe Tavern.
Preservationists who inspected the house were surprised by the level of preservation in
SuSA
N J
ON
ES
The Thomas Clark house in 2011, prior to its move from 59 Common Street to Concord Avenue.

September/October 2014 19
the house as it stood. After seven generations of ownership by the Clark family, the Underwood family purchased the house in 1906, and converted a room above the shed to living space and added a greenhouse. The house was sold to the Sifneos family in the 1950s. The Sifneos family converted the shed into a den, added more connections between the 1760 and 1840 wings, uncovered some earlier details in the Georgian parlors, and re-created some paneling. One front bedroom retained its simple 1760s wide pine paneling, while the other had Georgian raised paneling and details throughout. The floor and wall panels were up to 22 inches wide.
The house had a great variety of doors from different eras, with assorted styles of paneling and hardware often in the same room, the earliest doors having height extensions on top and bottom to make them taller. The elegant shape of the massive central brickwork, including two bake ovens which exhausted through their associated fireplaces, could be seen
through various crude hinged openings and a trap door from the second floor. These openings would have served to circulate more heat into the house in the winter. The four downstairs fireboxes and two bake ovens were all connected by brick up to waist height.
The house’s separation from its historical location was unfortunate, but its supporters were certain that it would ultimately be preserved. Its eventual destruction after much effort had been expended has been a great frustration to many of us in the town and beyond. Let us hope that the many factors which played a role in this house’s sad demise will not repeat themselves. We, the citizens of Belmont, may be able to repair the negative image our town has projected as a result of the demolition if we take steps to ensure that our historical treasuresare protected in the future.
Adam Rahbee is a local resident and administrator of the Save the Thomas Clark house Facebook group.
The scene on August 21.
SuSA
N J
ON
ES

20 www.belmontcitizensforum.org
Belmont Embraces Safe Routes to SchoolsBy Meg Muckenhoupt
Hundreds of Belmont’s children and teens walk or bike to school each day, getting exercise and keeping the air cleaner than if they rode in cars, but often, their routes aren’t as safe as they could be. Parents and staff at four of Belmont’s schools are working with a town-wide Safe Routes to Schools commmunity task force, a working group that also includes representatives of the Belmont Police Department, the Traffic Advisory Committee, the health department, the planning office, and the Massachusetts Department of Transportation’s Safe Routes to Schools program.
The goal is to help more kids walk to school and to identify and eliminate hazards on popular walking routes. In the process, the Safe Routes to School groups are making walking safer for Belmont residents of all ages—from their siblings on strollers to their grandparents. “The more we can make routes to school better and safer, the more walking routes we have for the whole town,” said Harriet Wong, a Burbank Safe Routes to School organizer.
The schools share common approaches. Children at Burbank and Wellington can earn prizes (pencils, stickers, and the like) for walking to school. To make it easier for students to cross busy streets and find their friends on the way to school, Burbank and Wellington parents also run “walking school buses,” where two parents–one at the front, one at the back—will walk a standard route with the kids. Children join the “bus” at organized stops, much like a motorized school bus, and the parents ensure that every child in the “bus” crosses busy streets safely. “It made it more fun and celebratory to walk,” said Harriet Wong, a Burbank Safe Routes to School organizer.
Belmont’ elementary schools and the Chenery Middle School also submitted grant applications to the Massachusetts Department of Transportation for infrastructure assessments to evaluate the built environment for walking including sidewalks, curbs, and roads. Belmont High School is not eligible for these funds.
Here is a sample of the schools’ successes and challenges in making walking to school safer and more fun.
BurbankSince the Burbank School does not have a bus
program, a high proportion of Burbank students have always walked to school. Burbank’s Safe Routes to School program managed to increase the number of students walking to school from 52% to 66% last spring.
Two programs encouraged kids’ walking last spring, and will continue this school year: “Walking Wednesdays” when children were given prizes for walking, and walking school bus routes. Wong cites the Dalton Road route where
A snowy sidewalk and plowed parking lot near the Wellington School, December 2013.
SAR
Ah
GRI
FFIT
h

September/October 2014 21
it intersects with School and Washington streets as particularly dangerous crossings where walking school buses made children safer.
Burbank also conducted a walkability assessment last April (the results are being processed.) “Our main concern is the traffic speed on School Street,” Wong said. Drivers leaving the Wellington School on School Street speed up, unaware that the Burbank School is close by.
WellingtonWellington School parents also run walking
school buses. However, Wellington students face large obstacles to walking: cars on the sidewalk. About 350 feet of sidewalk along the Saint Joseph Parish parking lot on School Street has been paved with blacktop, and looks like an extension of the lot. Drivers commonly park there. Although the town installed several “no parking” signs on the sidewalk last spring, it is still frequently blocked. “It’s not safe. It’s not fair. Kids have a right to walk on the sidewalk,”
said Sarah Griffith, Wellington Safe Routes to School volunteer.
Griffith praised the Belmont police for responding rapidly to calls about the cars, but deplored the fact that the police have to come at all. The town has no budget for repaving the area to look more like a sidewalk, Griffith said, and paint would also be costly, as it would have to be reapplied yearly.
Once a Wellington students reach a crosswalk that doesn’t double as a parking lot, they may find it hard to leave. Common Street and Goden Street both have stretches longer than .3 miles without
crosswalks. “When kids see their friends, they run across the street,” Griffith
said. “More crosswalks would be better.”
ButlerThe Butler School surveyed parents about
transportation last June as part of its grant application to the Massachusetts Department of Transportation for a walking infrastructure assessment. Two-thirds of respondents said that their children would walk to school more frequently if the sidewalks were improved, and said the biggest obstacles to walking to school were dangerous street crossings (76%), sidewalks that go unplowed in winter (50%), and sidewalks which are blocked by cars or don’t have a clear edge at the road (38%).
Half of Butler’s students live on the north side of Trapelo Road, and must cross that street to reach the school. Kate Bowen, Butler parent and Safe Routes to School volunteer, wrote, “Trapelo, as surveyed in 2005, sees approximately 15,000 cars per day with the majority traveling during peak commuting hours, which coincide with
Parking on the sidewalk front of the “Do not park onn sidewalk”sign near the Wellington School.
SAR
Ah
GRI
FFIT
h

22 www.belmontcitizensforum.org
school commuting hours. Retaining and supporting the recently created crossing guard position on Trapelo Road at Hawthorne is key to the continued safety and participating of families walking to school, as well as supporting the snow removal bylaw.”
The school has discussed developing safer routes for students who cross Trapelo Road to steer them towards the crossing guard, incentive programs like Walking Wednesdays, and walking school buses.
CheneryChenery Middle School is centrally located
in high-traffic streets. “Walking and/or biking can often get students to school much faster than the car,” explains Safe Routes to Schools committee member Amanda Mujica. “Because of traffic congestion, numerous one-way streets and
limited parking around the school driving can often be a slow, idling process.”
Chenery joined the Safe Routes to School community task force last spring, and is working to identify safe walking and bike routes to Chenery and ways to improve them, i.e., better-marked bike lanes, repainted crosswalks, support of a dedicated bike path, and sidewalk improvements. Committee member Sarah Wang said, “We began our efforts last year by holding a Walk to School Day in conjunction with the student council sponsored annual Pedometer Challenge, and the SRTS committee plans to expand on that great event again this year.”
International Walk to School Day is Wednesday, October 14.
Meg Muckenhoupt is Editor of the Belmont Citizens Forum Newsletter.
Environmental Events
Francis Cabot Lowell Wednesday, September 17, 7:30 PM The Belmont Historical Society will open its fall season with an illustrated lecture on “Francis Cabot Lowell: The Man Who Launched America’s Industrial Revolution.” After Lowell toured Great Britain and saw the industrial revolution using waterpower, he returned to Boston and brought the industrial revolution to Waltham, powered by the waters of the Charles River. Free. www.belmonthistoricalsociety.org. Assembly Room, Belmont Public Library, 336 Concord Avenue, Belmont.
Solar Panel Public Hearing Thursday, September 18, 7 PM The Belmont Municipal Light Advisory Board will hold a public hearing on to hear comments on the proposed changes to solar panel net metering to Phase II and Phase III. www.belmont-ma.gov. Belmont Town Hall Auditorium, 455 Concord Avenue, Belmont.
Fresh Pond History Walkabout Saturday, September 20, 1-3 PM Learn about Fresh Pond’s past while walking through the recently restored Northeast Sector and
beyond to Black’s Nook. www.friendsoffreshpond.org. Ranger Station, Fresh Pond Reservation, 250 Fresh Pond Parkway, Cambridge.
Sustainable Belmont Meeting Wednesday, October 1, 7-9 PM All Sustainable Belmont meetings are open to the public. Active members will share progress on various initiatives, discussion and planning will ensue. Attend, share your expertise, volunteer your time, relay your experience around sustainable activities in Belmont. www.sustainablebelmont.net. Flett Room, Belmont Public Library, 336 Concord Avenue, Belmont.
Western Greenway 5K Run/Walk Sunday, October 5, noon-1 PM Help the Waltham Land Trust raise money to build the Western Greenway Trail by participating in this Race for Open Space fundraiser. The course this year will follow last year’s route through Beaver Brook North Reservation in North Waltham and Rock Meadow in Belmont. Sign up to be a race participant, sponsor or volunteer by emailing Sonja at [email protected] or by visiting the Race Around Waltham (RAW) series website at rawseries.weebly.com/wg-5k.html. Elsie Turner Field, 421 Trapelo Road, Waltham

September/October 2014 23
Thank you for your continued support.Your contribution makes a difference!
Each Newsletter issue costs about $4,000 to publish. Thank you for your support.
____$50 ____$100 ____$150 ____$250
Thank you!
Name ______________________________
Address ____________________________
____________________________________
____________________________________
Phone ______________________________
E-mail ______________________________
Make checks payable to: Belmont Citizens Forum
Mail to: PO Box 609, Belmont, MA 02478
Give securely online: www.belmontcitizensforum.org
Make your donation go farther with matching funds.
Does your employer have a matching gift program?
Yes, my employer matches charitable giving. Please contact me for details.
BCF depends on volunteers.
Join us in helping to maintain Belmont’s small-town atmosphere.
____ Writing or editing for the Newsletter ____ Community path work ____ Newsletter mailings ____ Event organizing
Contact us: [email protected].
The Belmont Citizens Forum is a nonprofit 501(c)(3) organization. Your donation is deductible from federal taxes to the full extent provided by law.
6th Annual Belmont Serves Day— Making a Difference in Belmont Monday October 13, 8AM-1 PM Participate in service projects including conservation land clean-ups and door-to-door food drive for the Belmont Food Pantry. All ages and skills welcome. Community service hours can be earned by middle school and high school students. http://www.belmontrc.org/service.html. Saint Joseph Parish Hall, corner of Common Street and School Street, Belmont.
Little River History Nature Walk Sunday, October 19, 2-4 PM Come join a beautiful Fall nature walk along Little River in Cambridge and Belmont, and learn about geology, Native American history, and farming. Cosponsored by Belmont Citizens Forum, Friends of Alewife Reservation, Mystic River Watershed Association, and the Coalition to Preserve the Belmont Uplands. Parking lot at 15 Acorn Park Drive, Cambridge.

Nonprofit Org.uS Postage PAID
Boston MAPermit No. 56393
Belmont Citizens ForumP.O. Box 609Belmont MA 02478
Address Service Requested
24 www.belmontcitizensforum.org Preserving Belmont’s Small-Town Atmosphere
Solar Electricity Pricing Debated . . 1
A Path Across Belmont Center? . . . 8
Selectmen Discuss Underpass . . . . 12
Alternative Center Design . . . . 14
Uplands Transformed Over Time . . 15
Thomas Clark House, 1760-2014 . . 18
Belmont’s Safe Routes to Schools . . . 20
Environmental Events . . . . . 22
September/October 2014