Embed Size (px)
Citation preview
42 renewable energy focus May/June 2010
Feature article
The solar photovoltaic (PV) industry suff ered a major blow last year when the
Spanish market collapsed, but despite this loss the market performed much
better than expected. Shipments to the fi rst point of sale, including installers,
system integrators, distributors and other technology manufacturers, grew by
44% to 7.9 GW. This was a signifi cant rise from 5.5 GW in 2008.
The year began with practically non-existent sales from manufacturers
as the industry worked off more than 1.2 GW of demand-side inventory.
By the middle of the second quarter, however, the inventory had
been completed and demand in Germany, France, Italy and the Czech
Republic took off .
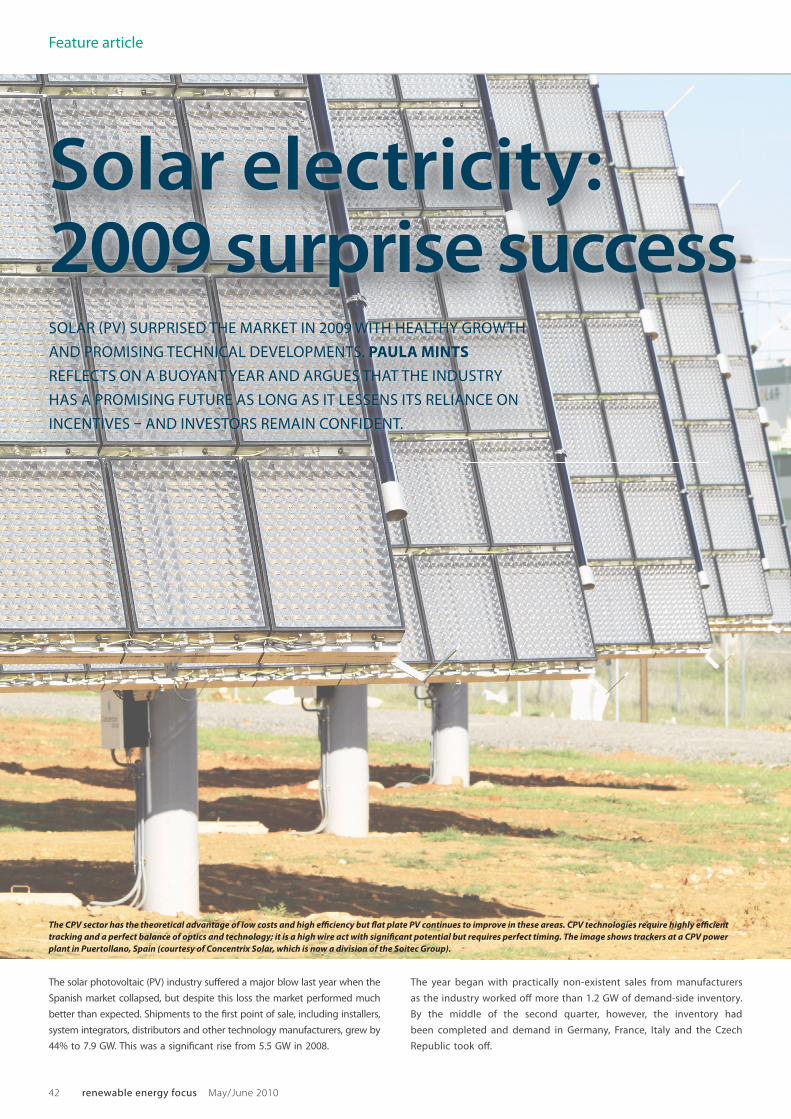
The CPV sector has the theoretical advantage of low costs and high effi ciency but fl at plate PV continues to improve in these areas. CPV technologies require highly effi cient
tracking and a perfect balance of optics and technology; it is a high wire act with signifi cant potential but requires perfect timing. The image shows trackers at a CPV power
plant in Puertollano, Spain (courtesy of Concentrix Solar, which is now a division of the Soitec Group).
Solar electricity: 2009 surprise successSOLAR PV SURPRISED THE MARKET IN 2009 WITH HEALTHY GROWTH
AND PROMISING TECHNICAL DEVELOPMENTS. PAULA MINTS
REFLECTS ON A BUOYANT YEAR AND ARGUES THAT THE INDUSTRY
HAS A PROMISING FUTURE AS LONG AS IT LESSENS ITS RELIANCE ON
INCENTIVES AND INVESTORS REMAIN CONFIDENT.
renewable energy focus May/June 2010 43
Solar electricity/market
25000
20000
15000
10000
5000
02008 2009 2009 2009 2009 2009 200920202020202020 22222200000000009090909 2202020202009999090909 99999992020202009090909090909 0909090909090920202020202020
02000202020202020000000008080808080808 22022020202020200000000222222222 202020202020200009090900909090909092008 2009 2009 2009 2009 2009 2009 2009
Dem
and side
inventory into 2009Shipm
ents
Production
Announced productionInstallations
(ind 2008 inventory)Com
mercial capacity
Announced capacity D
emand side
inventory (or, extra
product) into 2009
MWp
Figure 1: 2009 PV Industry Metrics.
8000
6000
5000
4000
3000
2000
1000
0
7000
2004 2005 2006 2007 2008 2009
MWp
Figure 2: PV Industry Growth, 2004 – 2009.
Shipments do not equate exactly to installations but last year’s
installation fi gures are impressive: Germany totalled around 3.8 GW, Italy
around 1 GW and the Czech Republic close to 500 MW. When Japan’s
new feed-In tariff (FiT) began in November, demand in that country
grew close to 500 MWp. As a result, the 2009 market for PV technologies
came as an overall relief to the global PV industry.
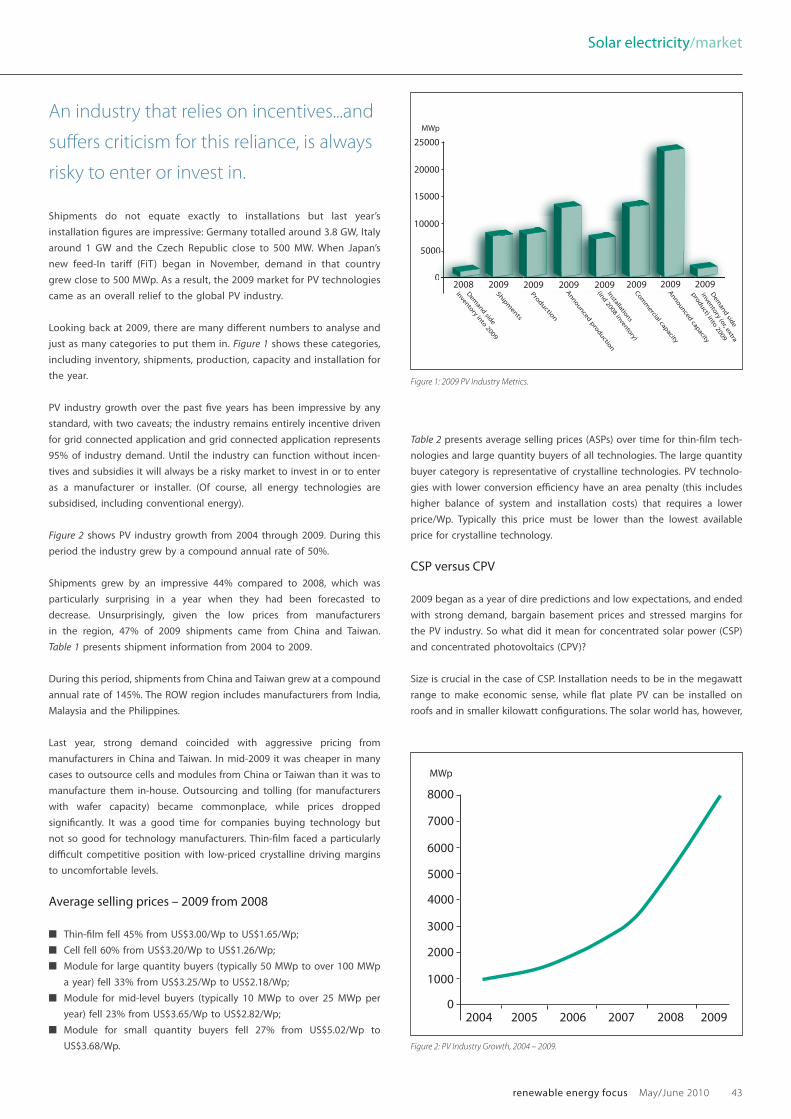
Looking back at 2009, there are many diff erent numbers to analyse and
just as many categories to put them in. Figure 1 shows these categories,
including inventory, shipments, production, capacity and installation for
the year.
PV industry growth over the past fi ve years has been impressive by any
standard, with two caveats; the industry remains entirely incentive driven
for grid connected application and grid connected application represents
95% of industry demand. Until the industry can function without incen-
tives and subsidies it will always be a risky market to invest in or to enter
as a manufacturer or installer. (Of course, all energy technologies are
subsidised, including conventional energy).
Figure 2 shows PV industry growth from 2004 through 2009. During this
period the industry grew by a compound annual rate of 50%.
Shipments grew by an impressive 44% compared to 2008, which was
particularly surprising in a year when they had been forecasted to
decrease. Unsurprisingly, given the low prices from manufacturers
in the region, 47% of 2009 shipments came from China and Taiwan.
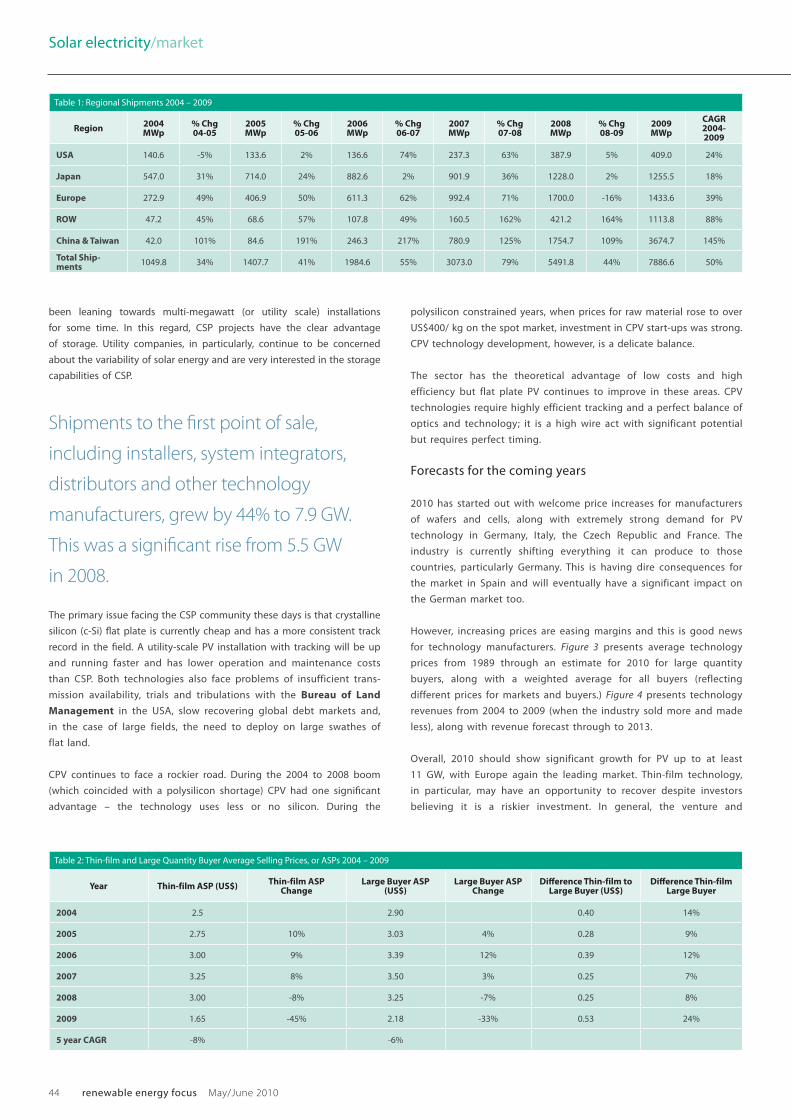
Table 1 presents shipment information from 2004 to 2009.
During this period, shipments from China and Taiwan grew at a compound
annual rate of 145%. The ROW region includes manufacturers from India,
Malaysia and the Philippines.
Last year, strong demand coincided with aggressive pricing from
manufacturers in China and Taiwan. In mid-2009 it was cheaper in many
cases to outsource cells and modules from China or Taiwan than it was to
manufacture them in-house. Outsourcing and tolling (for manufacturers
with wafer capacity) became commonplace, while prices dropped
signifi cantly. It was a good time for companies buying technology but
not so good for technology manufacturers. Thin-fi lm faced a particularly
diffi cult competitive position with low-priced crystalline driving margins
to uncomfortable levels.
Average selling prices – 2009 from 2008
■ Thin-fi lm fell 45% from US$3.00/Wp to US$1.65/Wp;
■ Cell fell 60% from US$3.20/Wp to US$1.26/Wp;
■ Module for large quantity buyers (typically 50 MWp to over 100 MWp
a year) fell 33% from US$3.25/Wp to US$2.18/Wp;
■ Module for mid-level buyers (typically 10 MWp to over 25 MWp per
year) fell 23% from US$3.65/Wp to US$2.82/Wp;
■ Module for small quantity buyers fell 27% from US$5.02/Wp to
US$3.68/Wp.
Table 2 presents average selling prices (ASPs) over time for thin-fi lm tech-
nologies and large quantity buyers of all technologies. The large quantity
buyer category is representative of crystalline technologies. PV technolo-
gies with lower conversion effi ciency have an area penalty (this includes
higher balance of system and installation costs) that requires a lower
price/Wp. Typically this price must be lower than the lowest available
price for crystalline technology.
CSP versus CPV
2009 began as a year of dire predictions and low expectations, and ended
with strong demand, bargain basement prices and stressed margins for
the PV industry. So what did it mean for concentrated solar power (CSP)
and concentrated photovoltaics (CPV)?
Size is crucial in the case of CSP. Installation needs to be in the megawatt
range to make economic sense, while fl at plate PV can be installed on
roofs and in smaller kilowatt confi gurations. The solar world has, however,
An industry that relies on incentives...and
suff ers criticism for this reliance, is always
risky to enter or invest in.
44 renewable energy focus May/June 2010
Solar electricity/market
been leaning towards multi-megawatt (or utility scale) installations
for some time. In this regard, CSP projects have the clear advantage
of storage. Utility companies, in particularly, continue to be concerned
about the variability of solar energy and are very interested in the storage
capabilities of CSP.
The primary issue facing the CSP community these days is that crystalline
silicon (c-Si) flat plate is currently cheap and has a more consistent track
record in the field. A utility-scale PV installation with tracking will be up
and running faster and has lower operation and maintenance costs
than CSP. Both technologies also face problems of insufficient trans-
mission availability, trials and tribulations with the Bureau of Land
Management in the USA, slow recovering global debt markets and,
in the case of large fields, the need to deploy on large swathes of
flat land.
CPV continues to face a rockier road. During the 2004 to 2008 boom
(which coincided with a polysilicon shortage) CPV had one significant
advantage – the technology uses less or no silicon. During the
polysilicon constrained years, when prices for raw material rose to over
US$400/ kg on the spot market, investment in CPV start-ups was strong.
CPV technology development, however, is a delicate balance.
The sector has the theoretical advantage of low costs and high
efficiency but flat plate PV continues to improve in these areas. CPV
technologies require highly efficient tracking and a perfect balance of
optics and technology; it is a high wire act with significant potential
but requires perfect timing.
Forecasts for the coming years
2010 has started out with welcome price increases for manufacturers
of wafers and cells, along with extremely strong demand for PV
technology in Germany, Italy, the Czech Republic and France. The
industry is currently shifting everything it can produce to those
countries, particularly Germany. This is having dire consequences for
the market in Spain and will eventually have a significant impact on
the German market too.
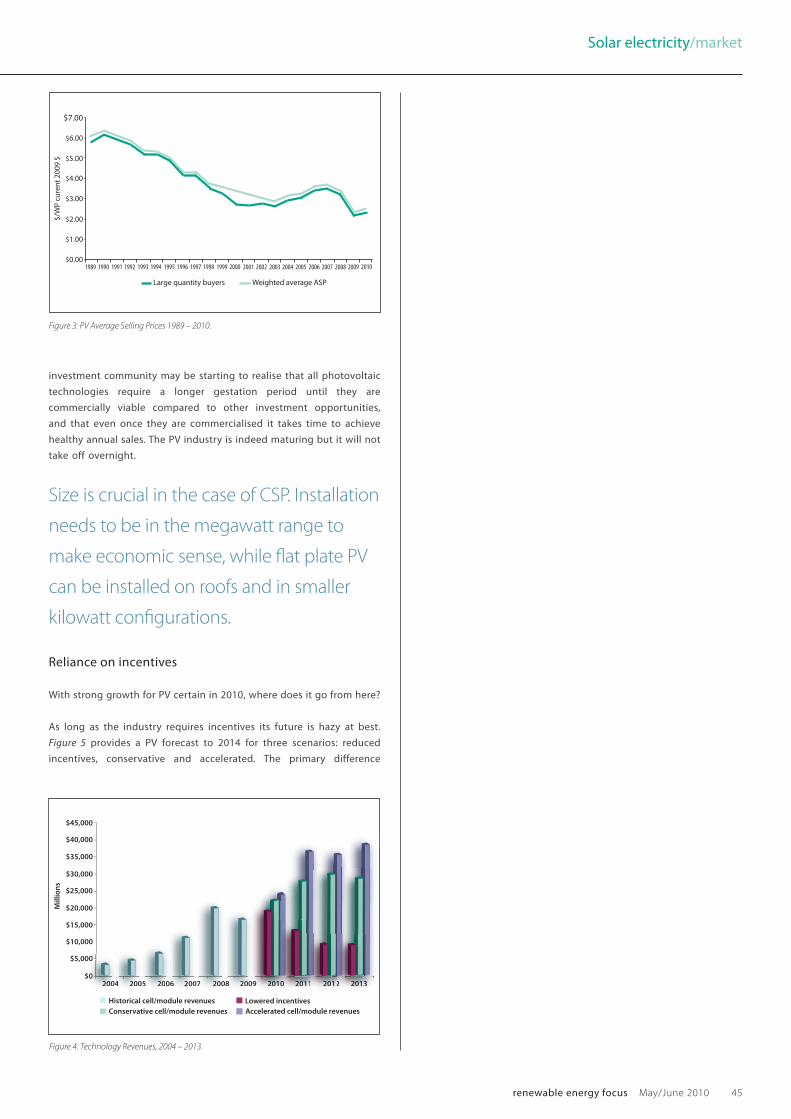
However, increasing prices are easing margins and this is good news
for technology manufacturers. Figure 3 presents average technology
prices from 1989 through an estimate for 2010 for large quantity
buyers, along with a weighted average for all buyers (reflecting
different prices for markets and buyers.) Figure 4 presents technology
revenues from 2004 to 2009 (when the industry sold more and made
less), along with revenue forecast through to 2013.
Overall, 2010 should show significant growth for PV up to at least
11 GW, with Europe again the leading market. Thin-film technology,
in particular, may have an opportunity to recover despite investors
believing it is a riskier investment. In general, the venture and
Table 1: Regional Shipments 2004 – 2009
Region2004 MWp
% Chg 04-05
2005 MWp
% Chg 05-06
2006 MWp
% Chg 06-07
2007 MWp
% Chg 07-08
2008 MWp
% Chg 08-09
2009 MWp
CAGR 2004-2009
USA 140.6 -5% 133.6 2% 136.6 74% 237.3 63% 387.9 5% 409.0 24%
Japan 547.0 31% 714.0 24% 882.6 2% 901.9 36% 1228.0 2% 1255.5 18%
Europe 272.9 49% 406.9 50% 611.3 62% 992.4 71% 1700.0 -16% 1433.6 39%
ROW 47.2 45% 68.6 57% 107.8 49% 160.5 162% 421.2 164% 1113.8 88%
China & Taiwan 42.0 101% 84.6 191% 246.3 217% 780.9 125% 1754.7 109% 3674.7 145%
Total Ship-ments
1049.8 34% 1407.7 41% 1984.6 55% 3073.0 79% 5491.8 44% 7886.6 50%
Table 2: Thin-film and Large Quantity Buyer Average Selling Prices, or ASPs 2004 – 2009
Year Thin-film ASP (US$)Thin-film ASP
ChangeLarge Buyer ASP
(US$)Large Buyer ASP
ChangeDifference Thin-film to
Large Buyer (US$)Difference Thin-film
Large Buyer
2004 2.5 2.90 0.40 14%
2005 2.75 10% 3.03 4% 0.28 9%
2006 3.00 9% 3.39 12% 0.39 12%
2007 3.25 8% 3.50 3% 0.25 7%
2008 3.00 -8% 3.25 -7% 0.25 8%
2009 1.65 -45% 2.18 -33% 0.53 24%
5 year CAGR -8% -6%
Shipments to the first point of sale,
including installers, system integrators,
distributors and other technology
manufacturers, grew by 44% to 7.9 GW.
This was a significant rise from 5.5 GW
in 2008.
renewable energy focus May/June 2010 45
Solar electricity/market
investment community may be starting to realise that all photovoltaic
technologies require a longer gestation period until they are
commercially viable compared to other investment opportunities,
and that even once they are commercialised it takes time to achieve
healthy annual sales. The PV industry is indeed maturing but it will not
take off overnight.
Reliance on incentives
With strong growth for PV certain in 2010, where does it go from here?
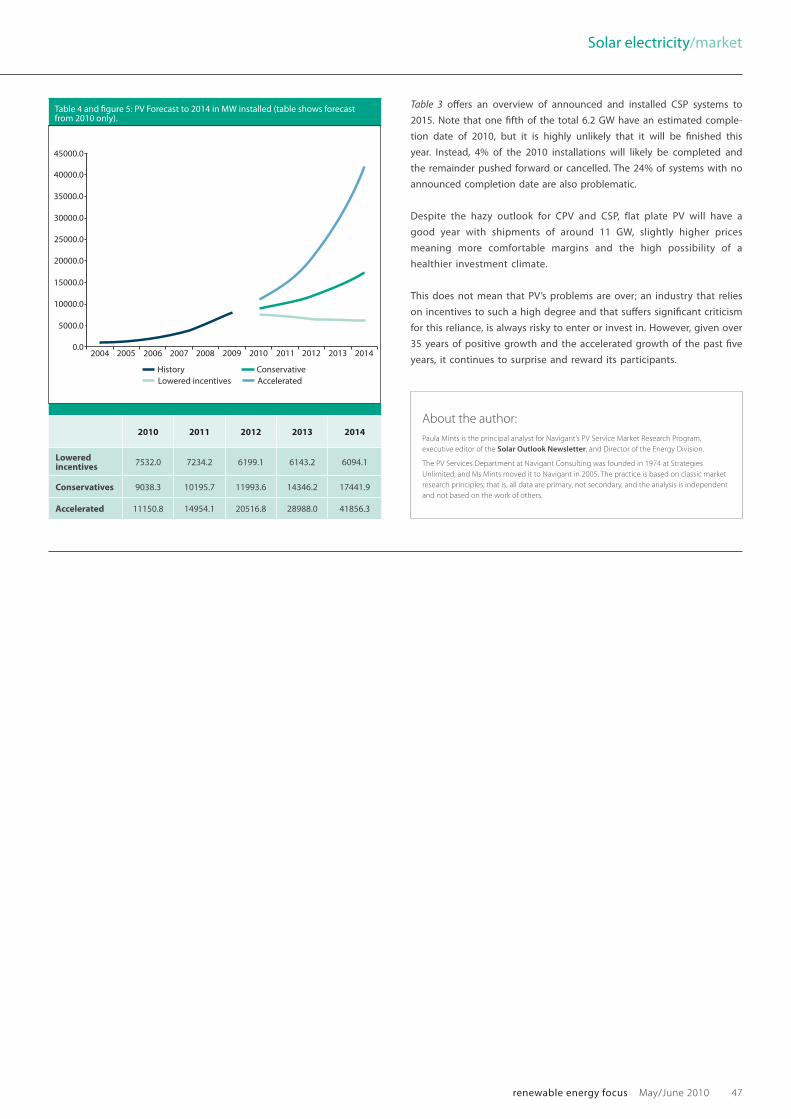
As long as the industry requires incentives its future is hazy at best.
Figure 5 provides a PV forecast to 2014 for three scenarios: reduced
incentives, conservative and accelerated. The primary difference
$45,000
$40,000
$35,000
$30,000
$25,000
$20,000
$15,000
$10,000
$5,000
$0
Historical cell/module revenuesConservative cell/module revenues Accelerated cell/module revenues
Lowered incentives
2004 2005 2006 2007 2008 2009 2010 2011 2012 2013
00
$022004 220004 5 22005 6 20006 7 220007 8 22008 33300999 2202202022200020220220 0000 2220222022002202022000000000011010110 111 2220200222002022020201111111 22020222202020202022011331131132222221121212
Mill
ion
s
Figure 4: Technology Revenues, 2004 – 2013.
$7.00
$6.00
$5.00
$4.00
$3.00
$2.00
$1.00
$0.001989 1990 1991 1992 1993 1994 1995 1996 1997 1998 1999 2000 2001 2002 2003 2004 2005 2006 2007 2008 2009 2010
Weighted average ASPLarge quantity buyers
$/W
P cu
rent
200
9 $
Figure 3: PV Average Selling Prices 1989 – 2010.
Size is crucial in the case of CSP. Installation
needs to be in the megawatt range to
make economic sense, while flat plate PV
can be installed on roofs and in smaller
kilowatt configurations.
46 renewable energy focus May/June 2010
Solar electricity/market
between conservative and accelerated forecasts is the availability of
incentivised markets. The accelerated forecast assumes continued
growth in markets such as Germany that, although they appear
saturated, continue to consume products.
Every indication coming from the German Government seemed to
show that significant changes to its FiT would have happened by
now, including an end to incentives for agricultural land. Although it
would seem a safe bet to assume that these changes will eventually
come about, there are no sure-fire certainties in solar. One thing is
for certain; if and when Germany and other countries alter their FiTs,
average technology prices will decrease and margins will once again
be compressed.
CSP installations (trough, power tower and dish) have a much longer
timeline than flat plate PV. In general, it is necessary to assume that it
will take two years from the start of construction. This long timeline is
problematic in terms of forecasting and CSP is unlikely to ever provide
a smooth trend line in this regard. Despite the hazy outlook for CPV
and CSP, flat plate PV will have
a good year with shipments of
around 11 GW, slightly higher
prices meaning more comfortable
margins and the high possibility of
a healthier investment climate.
Table 3: CSP Installation Estimations (MW)
2009 completed 121.0 2%
2010 estimated completion 1221.2 20%
2011 estimated completion 400.0 6%
2012 estimated completion 1150.0 19%
2013 estimated completion 962.0 16%
2014 estimated completion 280.0 5%
2015 estimated completion 500.0 8%
no date estimated completion 1493.6 24%
Totals 6190.1 99%
Completion Dates by Technology MWs % Total
Undecided 620.0 12%
Power Tower 177.1 3%
Dish/Linear Fresnel 578.3 11%
Trough 3959.4 74%
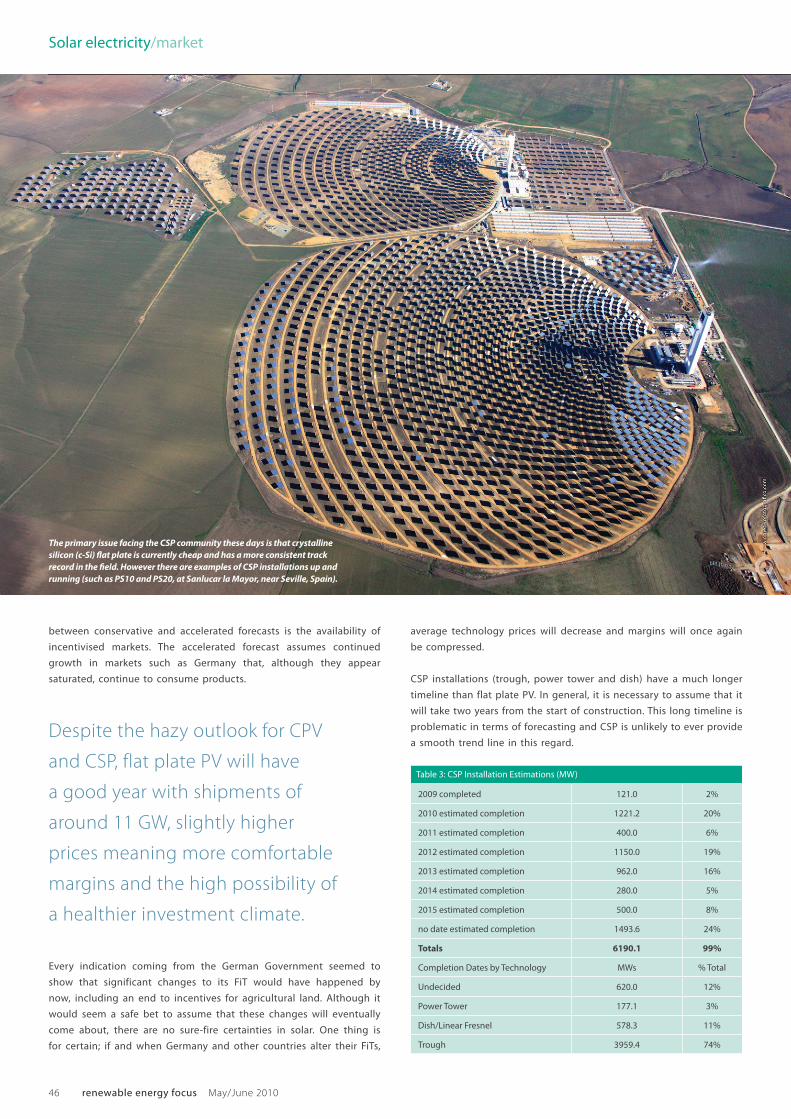
The primary issue facing the CSP community these days is that crystalline
silicon (c-Si) flat plate is currently cheap and has a more consistent track
record in the field. However there are examples of CSP installations up and
running (such as PS10 and PS20, at Sanlucar la Mayor, near Seville, Spain).
renewable energy focus May/June 2010 47
Solar electricity/market
Table 3 offers an overview of announced and installed CSP systems to
2015. Note that one fifth of the total 6.2 GW have an estimated comple-
tion date of 2010, but it is highly unlikely that it will be finished this
year. Instead, 4% of the 2010 installations will likely be completed and
the remainder pushed forward or cancelled. The 24% of systems with no
announced completion date are also problematic.
Despite the hazy outlook for CPV and CSP, flat plate PV will have a
good year with shipments of around 11 GW, slightly higher prices
meaning more comfortable margins and the high possibility of a
healthier investment climate.
This does not mean that PV’s problems are over; an industry that relies
on incentives to such a high degree and that suffers significant criticism
for this reliance, is always risky to enter or invest in. However, given over
35 years of positive growth and the accelerated growth of the past five
years, it continues to surprise and reward its participants.
About the author:
Paula Mints is the principal analyst for Navigant’s PV Service Market Research Program,
executive editor of the Solar Outlook Newsletter, and Director of the Energy Division.
The PV Services Department at Navigant Consulting was founded in 1974 at Strategies
Unlimited, and Ms Mints moved it to Navigant in 2005. The practice is based on classic market
research principles; that is, all data are primary, not secondary, and the analysis is independent
and not based on the work of others.
Table 4 and figure 5: PV Forecast to 2014 in MW installed (table shows forecast from 2010 only).
2010 2011 2012 2013 2014
Lowered incentives
7532.0 7234.2 6199.1 6143.2 6094.1
Conservatives 9038.3 10195.7 11993.6 14346.2 17441.9
Accelerated 11150.8 14954.1 20516.8 28988.0 41856.3
45000.0
40000.0
35000.0
30000.0
25000.0
20000.0
15000.0
10000.0
5000.0
0.02004 2005 2006 2007 2008 2009 2010 2011 2012 2013 2014
History ConservativeAcceleratedLowered incentives