Embed Size (px)
Citation preview
1SERIS is a research institute at the National University of Singapore (NUS). SERIS is supported by the National University of
Singapore (NUS), National Research Foundation Singapore (NRF) and the Singapore Economic Development Board (EDB).
Solar Economics Handbook of Singapore
Celine PATON, Congyi TAN, Dr. Thomas REINDL
Solar Energy Research Institute of Singapore (SERIS)
Singapore, 19 December 2019
2SERIS is a research institute at the National University of Singapore (NUS). SERIS is supported by the National University of
Singapore (NUS), National Research Foundation Singapore (NRF) and the Singapore Economic Development Board (EDB).
Disclaimer
Disclaimer, limitation of liability
This report represents the personal opinions of the members of the
evaluation team. The evaluation team members, the Solar Energy
Research Institute of Singapore (SERIS) and the National University
of Singapore (NUS), exclude any legal liability for any statement
made in the report. In no event shall the evaluation team members,
SERIS, and NUS of any tier be liable in contract, tort, strict liability,
warranty or otherwise, for any special, incidental or consequential
damages, such as, but not limited to, delay, disruption, loss of
product, loss of anticipated profits or revenue, loss of use of the
equipment or system, non-operation or increased expense of
operation of other equipment or systems, cost of capital, or cost of
purchase or replacement equipment systems or power.
3SERIS is a research institute at the National University of Singapore (NUS). SERIS is supported by the National University of
Singapore (NUS), National Research Foundation Singapore (NRF) and the Singapore Economic Development Board (EDB).
Overview
1. Global PV market
2. Singapore PV market
3. Singapore electricity market
a) Structure
b) Generation
c) Demand
d) Prices
4. PV adoption in Singapore
5. Future electricity price scenarios
6. Grid parity and economic viability analysis
4SERIS is a research institute at the National University of Singapore (NUS). SERIS is supported by the National University of
Singapore (NUS), National Research Foundation Singapore (NRF) and the Singapore Economic Development Board (EDB).
1. Global PV market
5SERIS is a research institute at the National University of Singapore (NUS). SERIS is supported by the National University of
Singapore (NUS), National Research Foundation Singapore (NRF) and the Singapore Economic Development Board (EDB).
15 23 4071
101138
177228
304
403
508
631
767
908
1,056
1,208
30 37 39 5176 99 105 122 136 141 148 151
0
100
200
300
400
500
600
700
800
900
1,000
1,100
1,200
1,300
Insta
lled
Cap
acity (
GW
p)
Cumulative Installed Capacity (GWp)
Annual Installed Capacity (GWp)
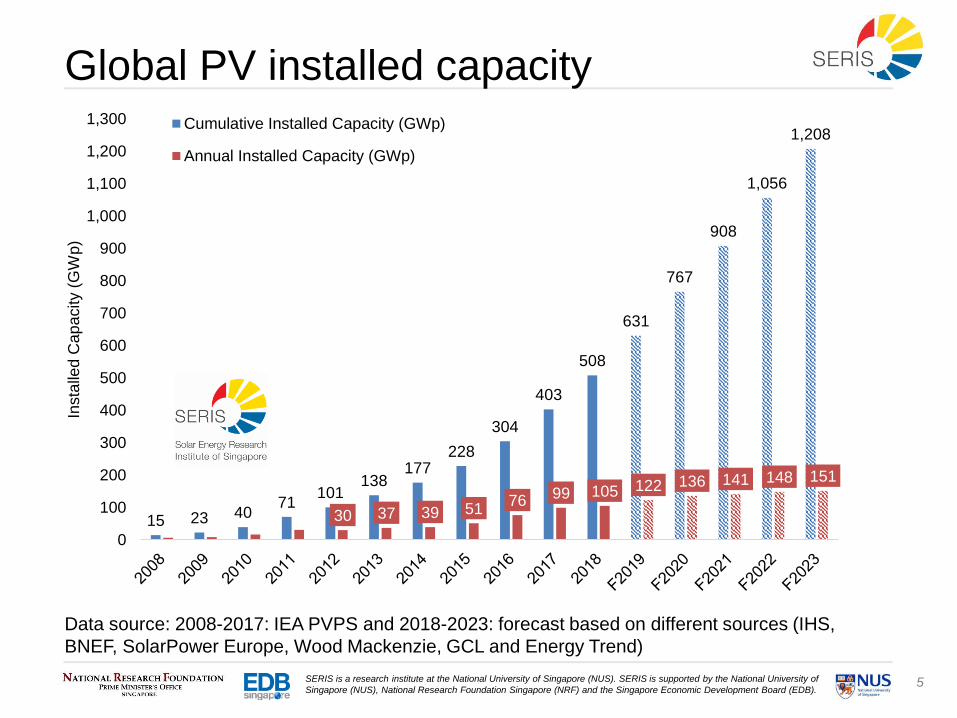
Global PV installed capacity
Data source: 2008-2017: IEA PVPS and 2018-2023: forecast based on different sources (IHS,
BNEF, SolarPower Europe, Wood Mackenzie, GCL and Energy Trend)
6SERIS is a research institute at the National University of Singapore (NUS). SERIS is supported by the National University of
Singapore (NUS), National Research Foundation Singapore (NRF) and the Singapore Economic Development Board (EDB).
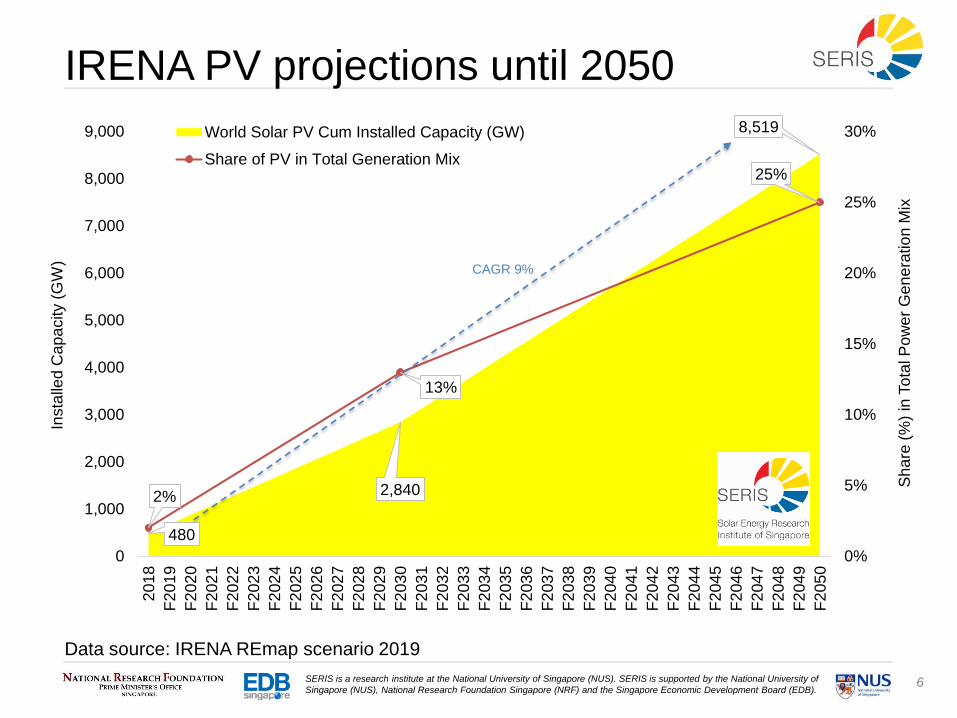
480
2,840
8,519
2%
13%
25%
0%
5%
10%
15%
20%
25%
30%
0
1,000
2,000
3,000
4,000
5,000
6,000
7,000
8,000
9,0002
01
8
F2
01
9
F2
02
0
F2
02
1
F2
02
2
F2
02
3
F2
02
4
F2
02
5
F2
02
6
F2
02
7
F2
02
8
F2
02
9
F2
03
0
F2
03
1
F2
03
2
F2
03
3
F2
03
4
F2
03
5
F2
03
6
F2
03
7
F2
03
8
F2
03
9
F2
04
0
F2
04
1
F2
04
2
F2
04
3
F2
04
4
F2
04
5
F2
04
6
F2
04
7
F2
04
8
F2
04
9
F2
05
0
Sh
are
(%
) in
To
tal P
ow
er
Ge
ne
ratio
n M
ix
Insta
lled
Cap
acity (
GW
)
World Solar PV Cum Installed Capacity (GW)
Share of PV in Total Generation Mix
IRENA PV projections until 2050
Data source: IRENA REmap scenario 2019
CAGR 9%
7SERIS is a research institute at the National University of Singapore (NUS). SERIS is supported by the National University of
Singapore (NUS), National Research Foundation Singapore (NRF) and the Singapore Economic Development Board (EDB).
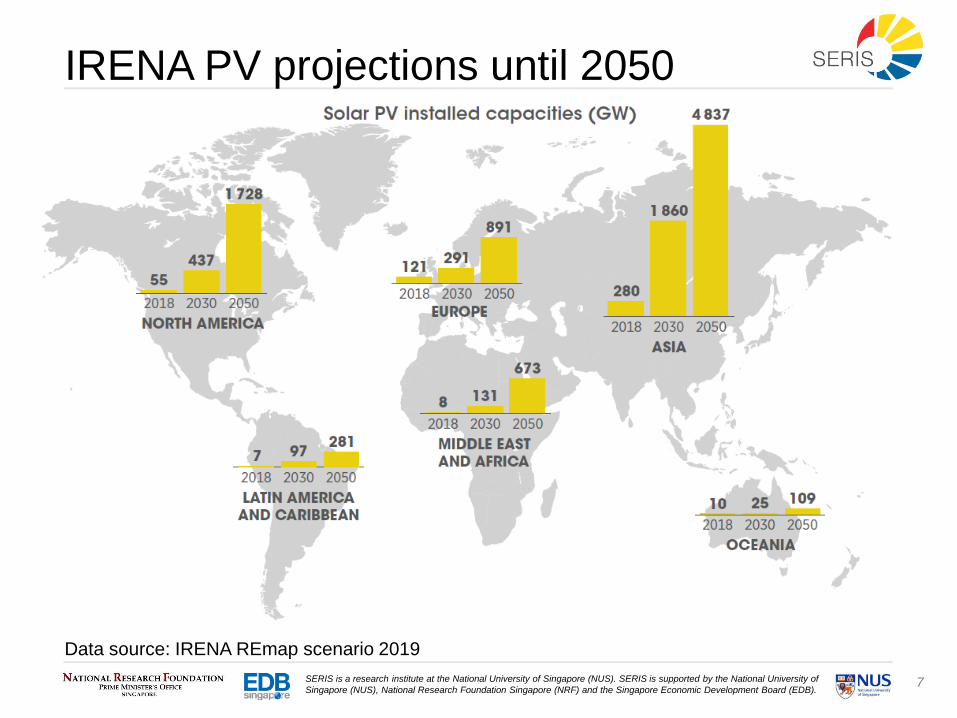
IRENA PV projections until 2050
Data source: IRENA REmap scenario 2019

8SERIS is a research institute at the National University of Singapore (NUS). SERIS is supported by the National University of
Singapore (NUS), National Research Foundation Singapore (NRF) and the Singapore Economic Development Board (EDB).
Data source: SERIS market research, ITRPV 10th edition (October 2019)
Historic global PV module pricesReducing trend of module prices with increasing installed capacity
0
100
200
300
400
500
600
0
2
4
6
8
10
12
14
16
18
20
198
01
98
11
98
21
98
31
98
41
98
51
98
61
98
71
98
81
98
91
99
01
99
11
99
21
99
31
99
41
99
51
99
61
99
71
99
81
99
92
00
02
00
12
00
22
00
32
00
42
00
52
00
62
00
72
00
82
00
92
01
02
01
12
01
22
01
32
01
42
01
52
01
62
01
72
01
8
Cu
m insta
lled
ca
pa
city (
GW
)
Mo
du
le p
rice
(U
SD
/Wp
)
Module price (22% learning rate)
Module price (ITRPV)
Cumulative installed capacity (GW)
9SERIS is a research institute at the National University of Singapore (NUS). SERIS is supported by the National University of
Singapore (NUS), National Research Foundation Singapore (NRF) and the Singapore Economic Development Board (EDB).
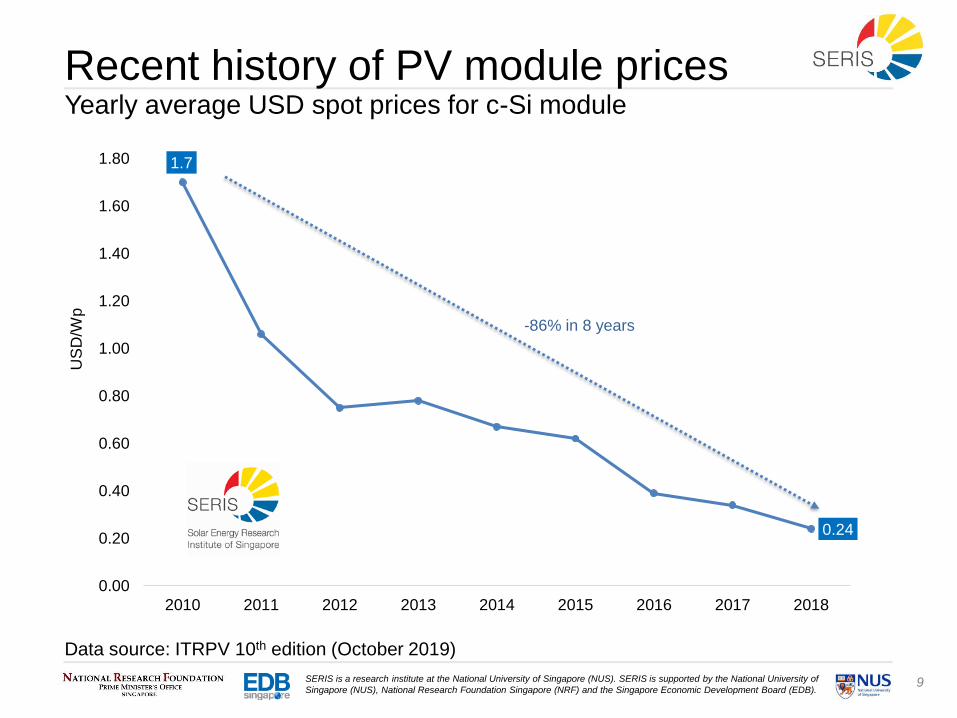
1.7
0.24
0.00
0.20
0.40
0.60
0.80
1.00
1.20
1.40
1.60
1.80
2010 2011 2012 2013 2014 2015 2016 2017 2018
US
D/W
pRecent history of PV module pricesYearly average USD spot prices for c-Si module
Data source: ITRPV 10th edition (October 2019)
-86% in 8 years
10SERIS is a research institute at the National University of Singapore (NUS). SERIS is supported by the National University of
Singapore (NUS), National Research Foundation Singapore (NRF) and the Singapore Economic Development Board (EDB).
0.10
0.15
0.20
0.25
0.30
0.35
0.40
0.45
4/1
/20
17
4/2
/20
17
4/3
/20
17
4/4
/20
17
4/5
/20
17
4/6
/20
17
4/7
/20
17
4/8
/20
17
4/9
/20
17
4/1
0/2
017
4/1
1/2
017
4/1
2/2
017
4/1
/20
18
4/2
/20
18
4/3
/20
18
4/4
/20
18
4/5
/20
18
4/6
/20
18
4/7
/20
18
4/8
/20
18
4/9
/20
18
4/1
0/2
018
4/1
1/2
018
4/1
2/2
018
4/1
/20
19
4/2
/20
19
4/3
/20
19
4/4
/20
19
4/5
/20
19
4/6
/20
19
4/7
/20
19
4/8
/20
19
4/9
/20
19
4/1
0/2
019
4/1
1/2
019
4/1
2/2
019
US
D/W
p
PVI Multi-Si
PVI Multi-Si High Eff / PERC
PVI Mono High Eff / PERC
PVI Thin-Film
ET 270-75W Multi-Si
ET 280-85W Multi-Si
ET 290-95W Mono-Si
ET 300-10W Mono-Si
ET 310W+ Mono-Si
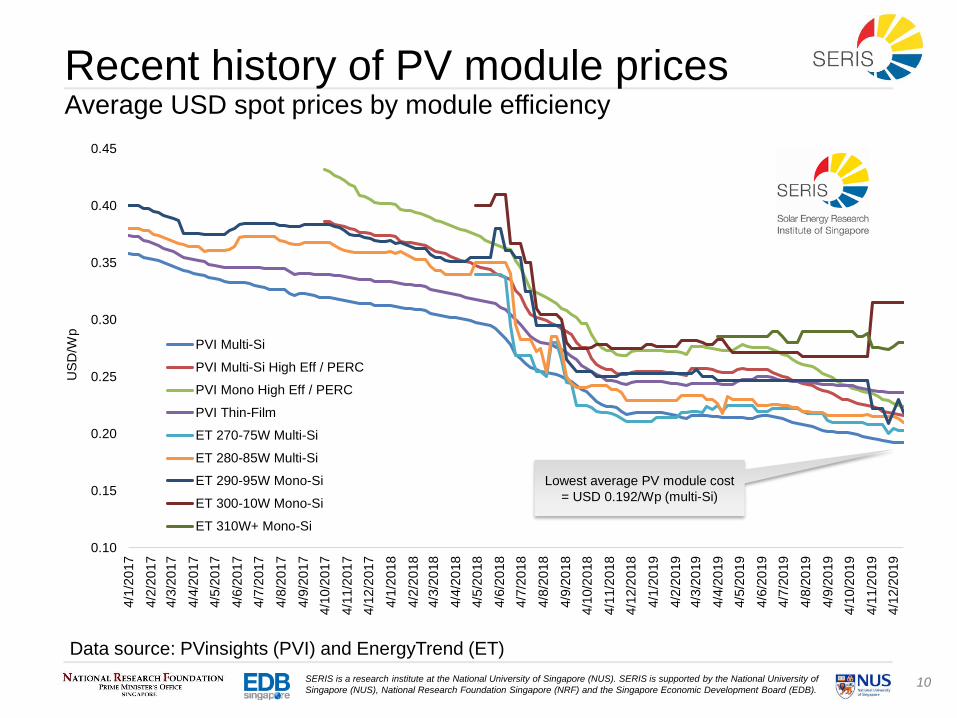
Recent history of PV module pricesAverage USD spot prices by module efficiency
Data source: PVinsights (PVI) and EnergyTrend (ET)
Lowest average PV module cost
= USD 0.192/Wp (multi-Si)
11SERIS is a research institute at the National University of Singapore (NUS). SERIS is supported by the National University of
Singapore (NUS), National Research Foundation Singapore (NRF) and the Singapore Economic Development Board (EDB).
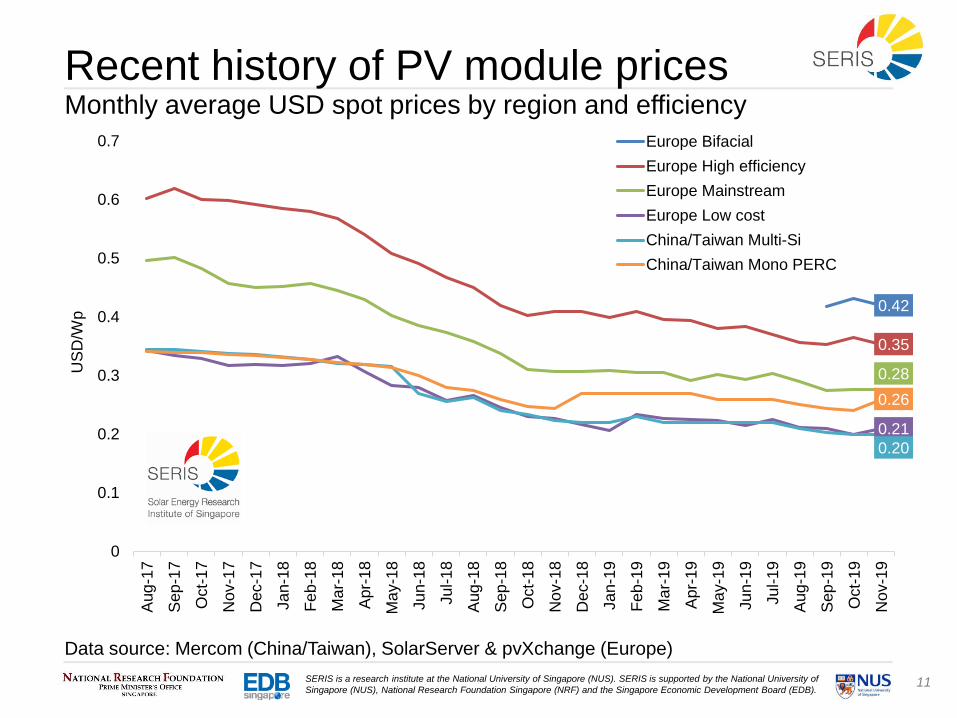
Recent history of PV module pricesMonthly average USD spot prices by region and efficiency
Data source: Mercom (China/Taiwan), SolarServer & pvXchange (Europe)
0.42
0.35
0.28
0.21
0.20
0.26
0
0.1
0.2
0.3
0.4
0.5
0.6
0.7A
ug
-17
Sep
-17
Oct-
17
Nov-1
7
Dec-1
7
Ja
n-1
8
Fe
b-1
8
Ma
r-18
Apr-
18
Ma
y-1
8
Ju
n-1
8
Ju
l-1
8
Aug
-18
Sep
-18
Oct-
18
Nov-1
8
Dec-1
8
Ja
n-1
9
Fe
b-1
9
Ma
r-19
Apr-
19
Ma
y-1
9
Ju
n-1
9
Ju
l-1
9
Aug
-19
Sep
-19
Oct-
19
Nov-1
9
US
D/W
p
Europe Bifacial
Europe High efficiency
Europe Mainstream
Europe Low cost
China/Taiwan Multi-Si
China/Taiwan Mono PERC
12SERIS is a research institute at the National University of Singapore (NUS). SERIS is supported by the National University of
Singapore (NUS), National Research Foundation Singapore (NRF) and the Singapore Economic Development Board (EDB).
2. Singapore PV market
13SERIS is a research institute at the National University of Singapore (NUS). SERIS is supported by the National University of
Singapore (NUS), National Research Foundation Singapore (NRF) and the Singapore Economic Development Board (EDB).
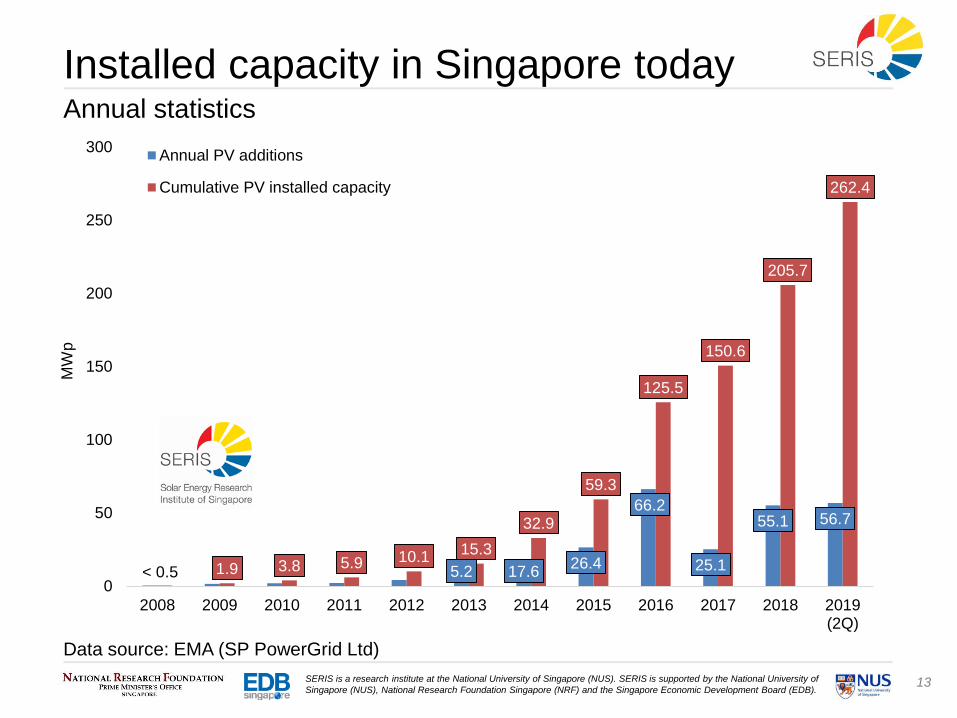
5.2 17.626.4
66.2
25.1
55.1 56.7
1.9 3.8 5.9 10.115.3
32.9
59.3
125.5
150.6
205.7
262.4
0
50
100
150
200
250
300
2008 2009 2010 2011 2012 2013 2014 2015 2016 2017 2018 2019(2Q)
MW
p
Annual PV additions
Cumulative PV installed capacity
Installed capacity in Singapore todayAnnual statistics
Data source: EMA (SP PowerGrid Ltd)
< 0.5
14SERIS is a research institute at the National University of Singapore (NUS). SERIS is supported by the National University of
Singapore (NUS), National Research Foundation Singapore (NRF) and the Singapore Economic Development Board (EDB).
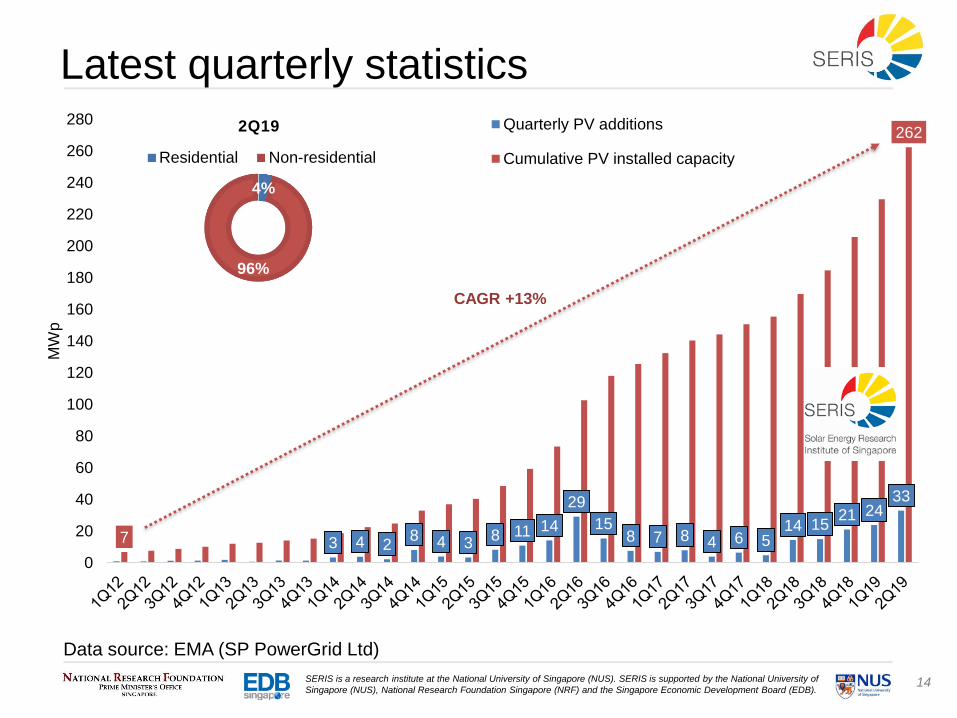
3 4 28 4 3
8 11 14
29
158 7 8 4 6 5
14 1521 24
33
7
262
0
20
40
60
80
100
120
140
160
180
200
220
240
260
280
MW
p
Quarterly PV additions
Cumulative PV installed capacity
Latest quarterly statistics
Data source: EMA (SP PowerGrid Ltd)
CAGR +13%
4%
96%
2Q19
Residential Non-residential
15SERIS is a research institute at the National University of Singapore (NUS). SERIS is supported by the National University of
Singapore (NUS), National Research Foundation Singapore (NRF) and the Singapore Economic Development Board (EDB).
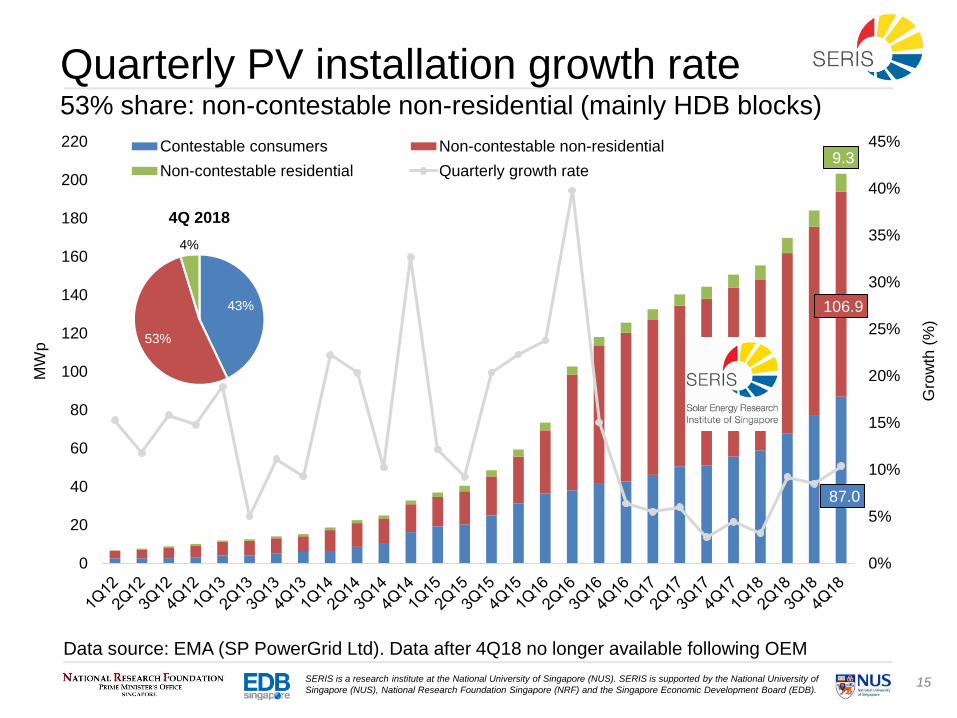
87.0
106.9
9.3
0%
5%
10%
15%
20%
25%
30%
35%
40%
45%
0
20
40
60
80
100
120
140
160
180
200
220
Gro
wth
(%
)
MW
p
Contestable consumers Non-contestable non-residential
Non-contestable residential Quarterly growth rate
Quarterly PV installation growth rate53% share: non-contestable non-residential (mainly HDB blocks)
Data source: EMA (SP PowerGrid Ltd). Data after 4Q18 no longer available following OEM
43%
53%
4%
4Q 2018
16SERIS is a research institute at the National University of Singapore (NUS). SERIS is supported by the National University of
Singapore (NUS), National Research Foundation Singapore (NRF) and the Singapore Economic Development Board (EDB).
0
20
40
60
80
100
120
140
160
180
200
220
240
260
2801
Q1
2
2Q
12
3Q
12
4Q
12
1Q
13
2Q
13
3Q
13
4Q
13
1Q
14
2Q
14
3Q
14
4Q
14
1Q
15
2Q
15
3Q
15
4Q
15
1Q
16
2Q
16
3Q
16
4Q
16
1Q
17
2Q
17
3Q
17
4Q
17
1Q
18
2Q
18
3Q
18
4Q
18
1Q
19
2Q
19
MW
p
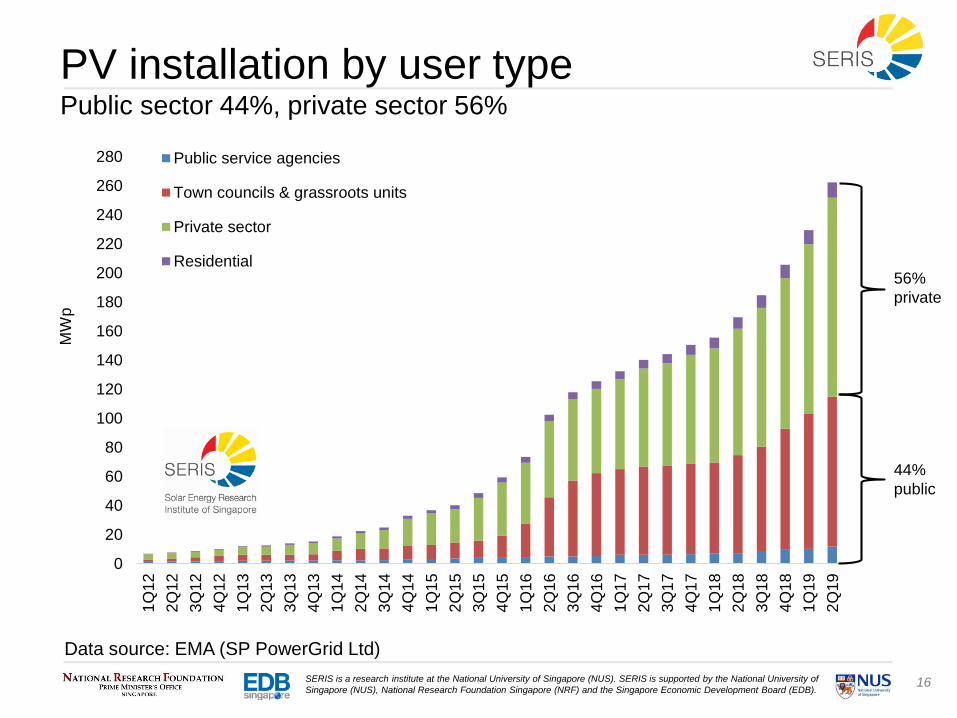
Public service agencies
Town councils & grassroots units
Private sector
Residential
PV installation by user typePublic sector 44%, private sector 56%
44%
public
56%
private
Data source: EMA (SP PowerGrid Ltd)

17SERIS is a research institute at the National University of Singapore (NUS). SERIS is supported by the National University of
Singapore (NUS), National Research Foundation Singapore (NRF) and the Singapore Economic Development Board (EDB).
Regional split within Singapore [MWac]
30.1 MWac
501 Systems
Residential: 1%
31.8 MWac
477 Systems
Residential: 5%
Data source: EMA & SPPG, 2Q2019
24.5 MWac
645 Systems
Residential: 15%
26.2 MWac
857 Systems
Residential: 8%
Total installed: 202 MWac
Total systems: 3,173
89.4 MWac
693 Systems
Residential: <1%
18SERIS is a research institute at the National University of Singapore (NUS). SERIS is supported by the National University of
Singapore (NUS), National Research Foundation Singapore (NRF) and the Singapore Economic Development Board (EDB).
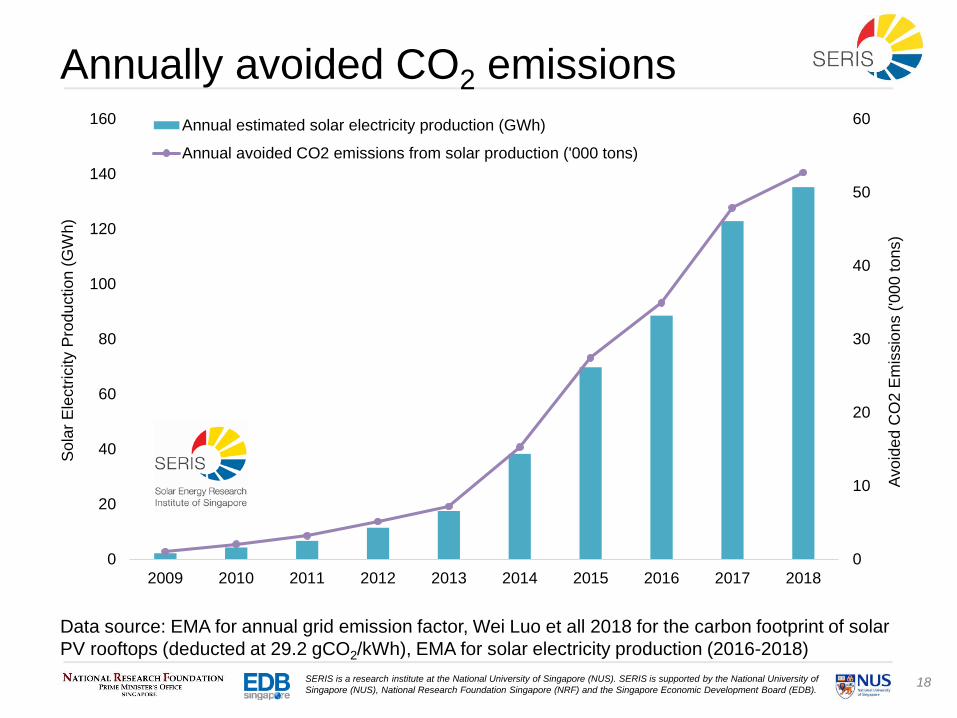
Annually avoided CO2 emissions
Data source: EMA, 1Q2015Data source: EMA for annual grid emission factor, Wei Luo et all 2018 for the carbon footprint of solar
PV rooftops (deducted at 29.2 gCO2/kWh), EMA for solar electricity production (2016-2018)
0
10
20
30
40
50
60
0
20
40
60
80
100
120
140
160
2009 2010 2011 2012 2013 2014 2015 2016 2017 2018
Avo
ide
d C
O2
Em
issio
ns (
'00
0 to
ns)
So
lar
Ele
ctr
icity P
rod
uctio
n (
GW
h)
Annual estimated solar electricity production (GWh)
Annual avoided CO2 emissions from solar production ('000 tons)
19SERIS is a research institute at the National University of Singapore (NUS). SERIS is supported by the National University of
Singapore (NUS), National Research Foundation Singapore (NRF) and the Singapore Economic Development Board (EDB).
0%
1%
2%
3%
4%
5%
6%
7%
8%
9%
10%
0
1
2
3
4
5
6
201
4
201
5
201
6
201
7
201
8
201
9
202
0
202
1
202
2
202
3
202
4
202
5
202
6
202
7
202
8
202
9
203
0
203
1
203
2
203
3
203
4
203
5
203
6
203
7
203
8
203
9
204
0
204
1
204
2
204
3
204
4
204
5
204
6
204
7
204
8
204
9
205
0
In %
ele
ctr
icity d
em
an
d
Insta
lled
ca
pa
city (
GW
p)
BAS Scenario (GWp)
ACC Scenario (GWp)
Actual capacity (GWp)
BAS Scenario (GWp)
ACC Scenario (GWp)
BAS Scenario (%)
ACC Scenario (%)
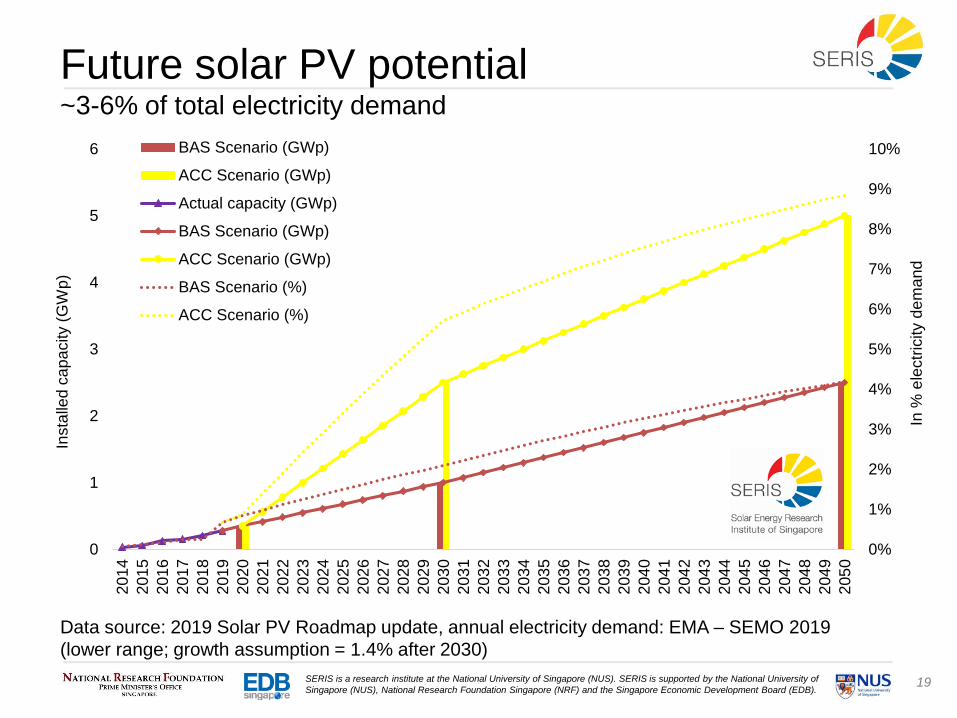
Future solar PV potential~3-6% of total electricity demand
Data source:Q2015Data source: 2019 Solar PV Roadmap update, annual electricity demand: EMA – SEMO 2019
(lower range; growth assumption = 1.4% after 2030)
20SERIS is a research institute at the National University of Singapore (NUS). SERIS is supported by the National University of
Singapore (NUS), National Research Foundation Singapore (NRF) and the Singapore Economic Development Board (EDB).
0.0%
0.5%
1.0%
1.5%
2.0%
2.5%
3.0%
3.5%
4.0%
4.5%
5.0%
0.0
0.5
1.0
1.5
2.0
2.5
3.0
3.5
201
8
201
9
202
0
202
1
202
2
202
3
202
4
202
5
202
6
202
7
202
8
202
9
203
0
203
1
203
2
203
3
203
4
203
5
203
6
203
7
203
8
203
9
204
0
204
1
204
2
204
3
204
4
204
5
204
6
204
7
204
8
204
9
205
0
In %
of to
tal a
nn
ua
l C
O2
em
issio
ns
An
nu
ally
avo
ide
d C
O2
em
issio
ns (
mill
ion
to
nn
es)
BAS Scenarios (MT)
ACC Scenarios (MT)
BAS Scenario (MT)
ACC Scenario (MT)
BAS Scenario (%)
ACC Scenario (%)
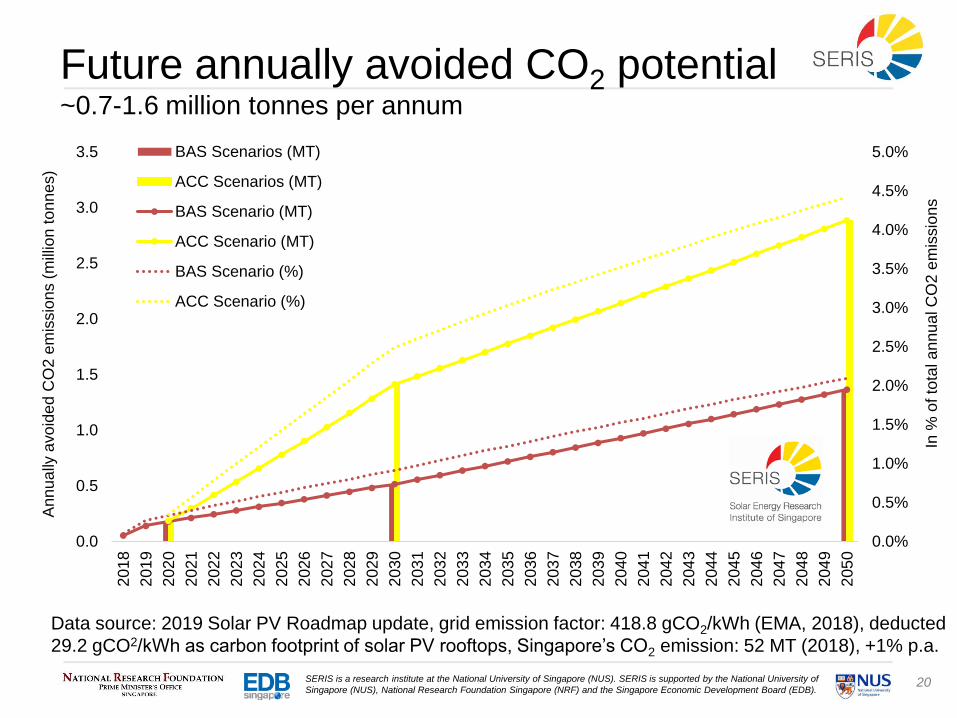
Future annually avoided CO2 potential~0.7-1.6 million tonnes per annum
Data source:Q2015Data source: 2019 Solar PV Roadmap update, grid emission factor: 418.8 gCO2/kWh (EMA, 2018), deducted
29.2 gCO2/kWh as carbon footprint of solar PV rooftops, Singapore’s CO2 emission: 52 MT (2018), +1% p.a.
21SERIS is a research institute at the National University of Singapore (NUS). SERIS is supported by the National University of
Singapore (NUS), National Research Foundation Singapore (NRF) and the Singapore Economic Development Board (EDB).
3a) Singapore electricity market: Structure
22SERIS is a research institute at the National University of Singapore (NUS). SERIS is supported by the National University of
Singapore (NUS), National Research Foundation Singapore (NRF) and the Singapore Economic Development Board (EDB).
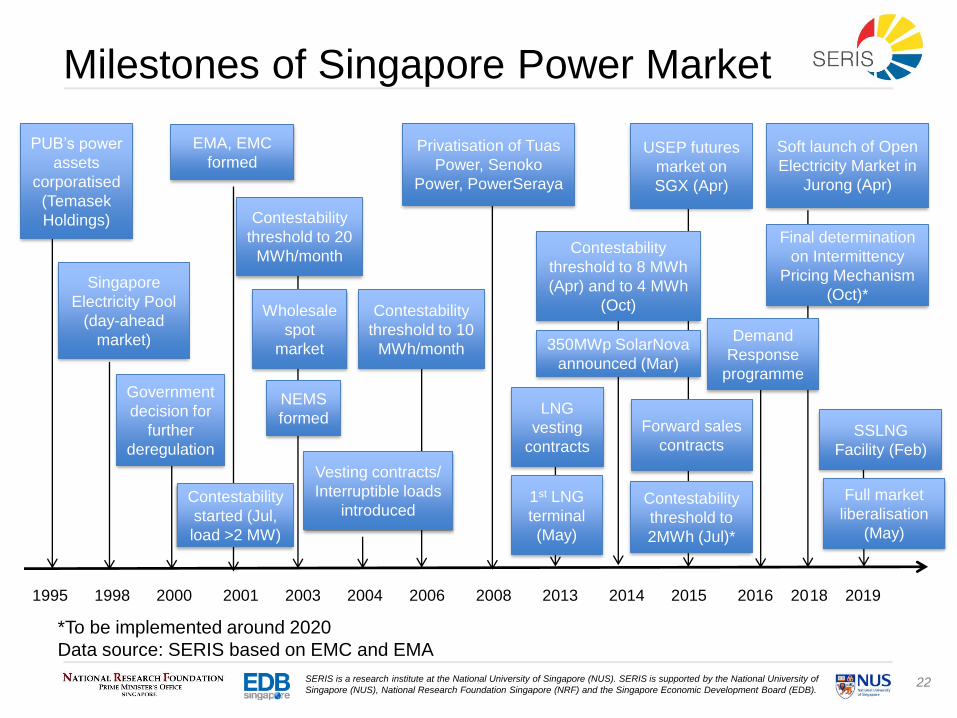
Milestones of Singapore Power Market
*To be implemented around 2020
Data source: SERIS based on EMC and EMA
PUB’s power
assets
corporatised
(Temasek
Holdings)
1995 1998 2000 2001 2003 2004 2006 2008 2013 2014 2015 2016 2018 2019
Singapore
Electricity Pool
(day-ahead
market)
Government
decision for
further
deregulation
Wholesale
spot
market
Vesting contracts/
Interruptible loads
introduced1st LNG
terminal
(May)
Privatisation of Tuas
Power, Senoko
Power, PowerSeraya
Contestability
threshold to
2MWh (Jul)*
USEP futures
market on
SGX (Apr)
EMA, EMC
formed
Contestability
started (Jul,
load >2 MW)
NEMS
formed
Contestability
threshold to 20
MWh/monthContestability
threshold to 8 MWh
(Apr) and to 4 MWh
(Oct)Contestability
threshold to 10
MWh/month 350MWp SolarNova
announced (Mar)
Forward sales
contracts
LNG
vesting
contracts
Full market
liberalisation
(May)
Soft launch of Open
Electricity Market in
Jurong (Apr)
SSLNG
Facility (Feb)
Final determination
on Intermittency
Pricing Mechanism
(Oct)*
Demand
Response
programme
23SERIS is a research institute at the National University of Singapore (NUS). SERIS is supported by the National University of
Singapore (NUS), National Research Foundation Singapore (NRF) and the Singapore Economic Development Board (EDB).
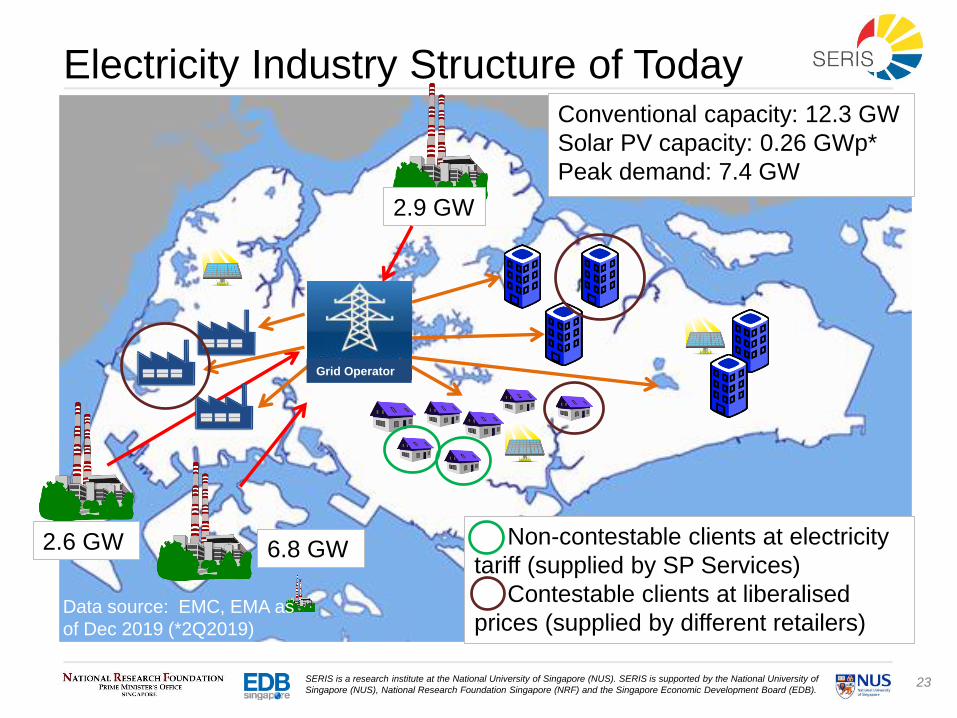
Electricity Industry Structure of Today
2.9 GW
2.6 GW 6.8 GW
Conventional capacity: 12.3 GW
Solar PV capacity: 0.26 GWp*
Peak demand: 7.4 GW
Grid Operator
Data source: EMC, EMA as
of Dec 2019 (*2Q2019)
Non-contestable clients at electricity
tariff (supplied by SP Services)
Contestable clients at liberalised
prices (supplied by different retailers)
24SERIS is a research institute at the National University of Singapore (NUS). SERIS is supported by the National University of
Singapore (NUS), National Research Foundation Singapore (NRF) and the Singapore Economic Development Board (EDB).
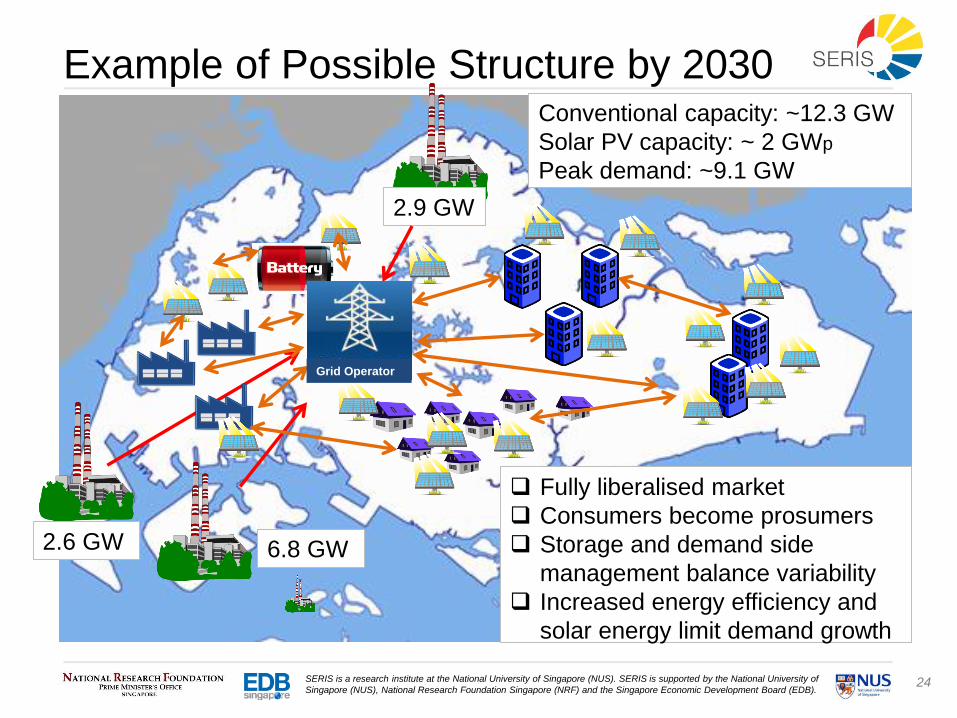
Example of Possible Structure by 2030
2.9 GW
2.6 GW 6.8 GW
Fully liberalised market
Consumers become prosumers
Storage and demand side
management balance variability
Increased energy efficiency and
solar energy limit demand growth
Conventional capacity: ~12.3 GW
Solar PV capacity: ~ 2 GWp
Peak demand: ~9.1 GW
Grid Operator
25SERIS is a research institute at the National University of Singapore (NUS). SERIS is supported by the National University of
Singapore (NUS), National Research Foundation Singapore (NRF) and the Singapore Economic Development Board (EDB).
3b) Singapore electricity market: Generation
26SERIS is a research institute at the National University of Singapore (NUS). SERIS is supported by the National University of
Singapore (NUS), National Research Foundation Singapore (NRF) and the Singapore Economic Development Board (EDB).
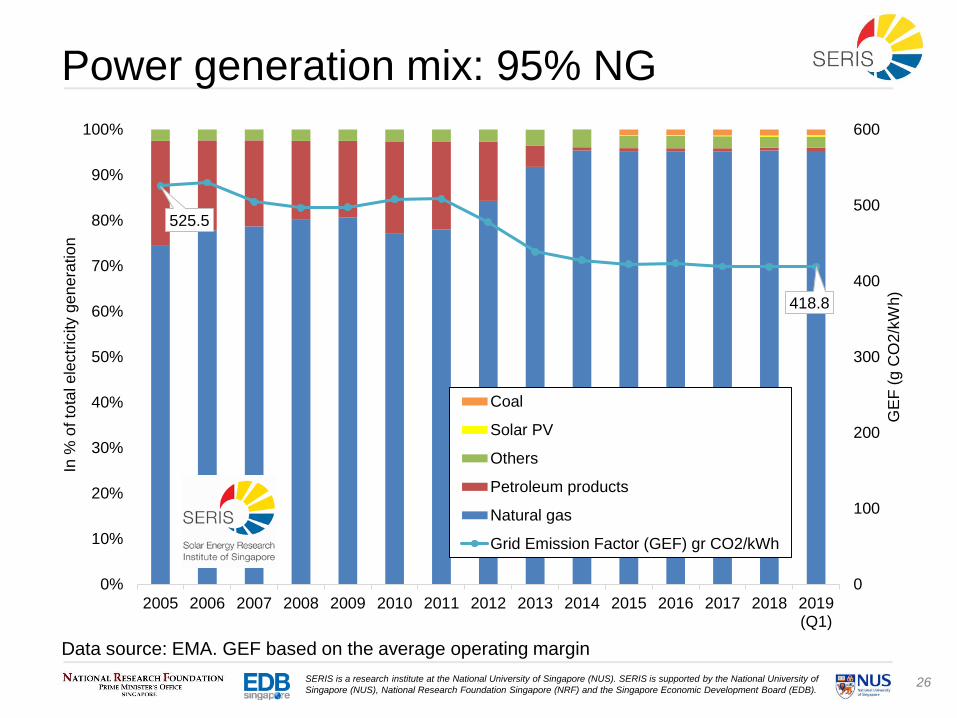
525.5
418.8
0
100
200
300
400
500
600
0%
10%
20%
30%
40%
50%
60%
70%
80%
90%
100%
2005 2006 2007 2008 2009 2010 2011 2012 2013 2014 2015 2016 2017 2018 2019(Q1)
GE
F (
g C
O2
/kW
h)
In %
of to
tal e
lectr
icity g
en
era
tio
n
Coal
Solar PV
Others
Petroleum products
Natural gas
Grid Emission Factor (GEF) gr CO2/kWh
Power generation mix: 95% NG
Data source: EMA. GEF based on the average operating margin
27SERIS is a research institute at the National University of Singapore (NUS). SERIS is supported by the National University of
Singapore (NUS), National Research Foundation Singapore (NRF) and the Singapore Economic Development Board (EDB).
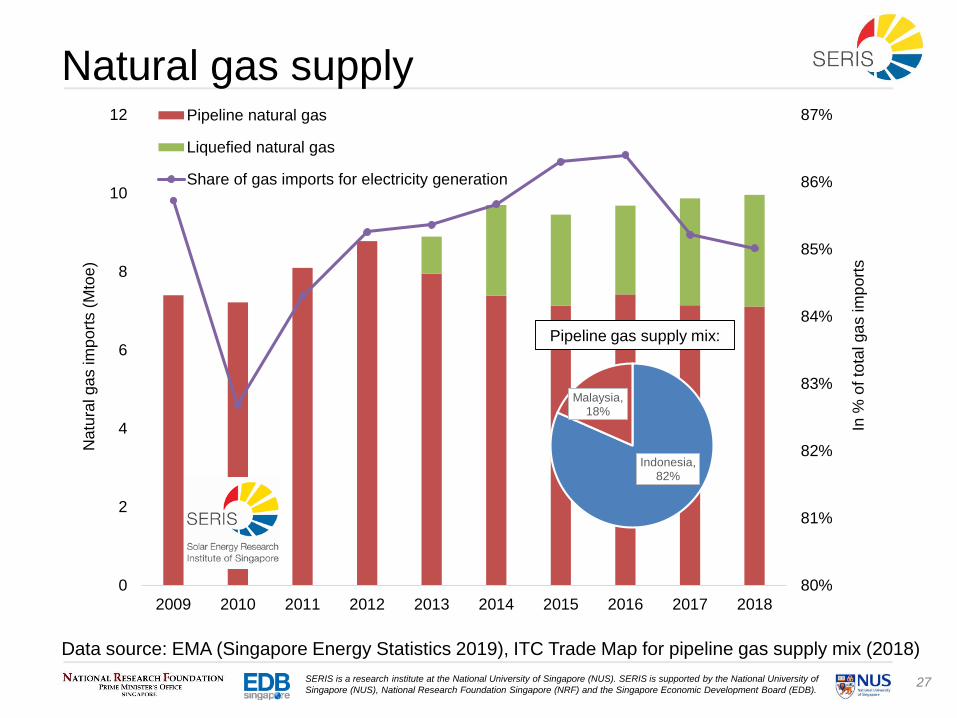
80%
81%
82%
83%
84%
85%
86%
87%
0
2
4
6
8
10
12
2009 2010 2011 2012 2013 2014 2015 2016 2017 2018
In %
of to
tal ga
s im
po
rts
Natu
ral ga
s im
po
rts (
Mto
e)
Pipeline natural gas
Liquefied natural gas
Share of gas imports for electricity generation
Natural gas supply
Data source: EMA (Singapore Energy Statistics 2019), ITC Trade Map for pipeline gas supply mix (2018)
Pipeline gas supply mix:
Indonesia, 82%
Malaysia, 18%
28SERIS is a research institute at the National University of Singapore (NUS). SERIS is supported by the National University of
Singapore (NUS), National Research Foundation Singapore (NRF) and the Singapore Economic Development Board (EDB).
0%
10%
20%
30%
40%
50%
60%
70%
80%
90%
100%
0%
10%
20%
30%
40%
50%
60%
70%
80%
90%
100%
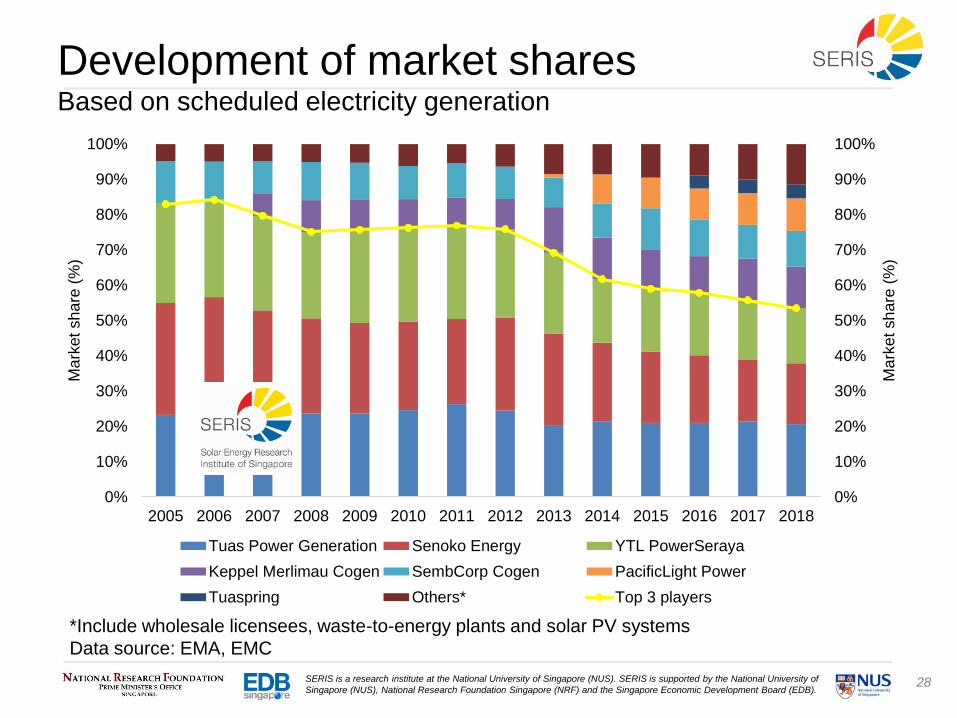
2005 2006 2007 2008 2009 2010 2011 2012 2013 2014 2015 2016 2017 2018
Ma
rket sh
are
(%
)
Ma
rket sh
are
(%
)
Tuas Power Generation Senoko Energy YTL PowerSeraya
Keppel Merlimau Cogen SembCorp Cogen PacificLight Power
Tuaspring Others* Top 3 players
Development of market sharesBased on scheduled electricity generation
*Include wholesale licensees, waste-to-energy plants and solar PV systems
Data source: EMA, EMC

29SERIS is a research institute at the National University of Singapore (NUS). SERIS is supported by the National University of
Singapore (NUS), National Research Foundation Singapore (NRF) and the Singapore Economic Development Board (EDB).
Market share of generation capacity
*SP Services and IGS owners are registering PV systems who chose EMC registration. As of 12 December
2019, registered IGS systems = 127 MWac. IGS = Intermittent Generation Sources
Data source: EMC. Total registered capacity of 12,440 MW as of 12 December 2019
22.6%
20.5%
19.3%
10.5%
9.6%
6.4%3.2%
4.8%
2.1%
1.0%
0.1%
Senoko Energy
Tuas Power Generation
YTL PowerSeraya
Keppel Merlimau Cogen
Sembcorp Cogen
PacificLight Power
Tuaspring
Embedded generators
Waste incineration
SP Services/IGS*
30SERIS is a research institute at the National University of Singapore (NUS). SERIS is supported by the National University of
Singapore (NUS), National Research Foundation Singapore (NRF) and the Singapore Economic Development Board (EDB).
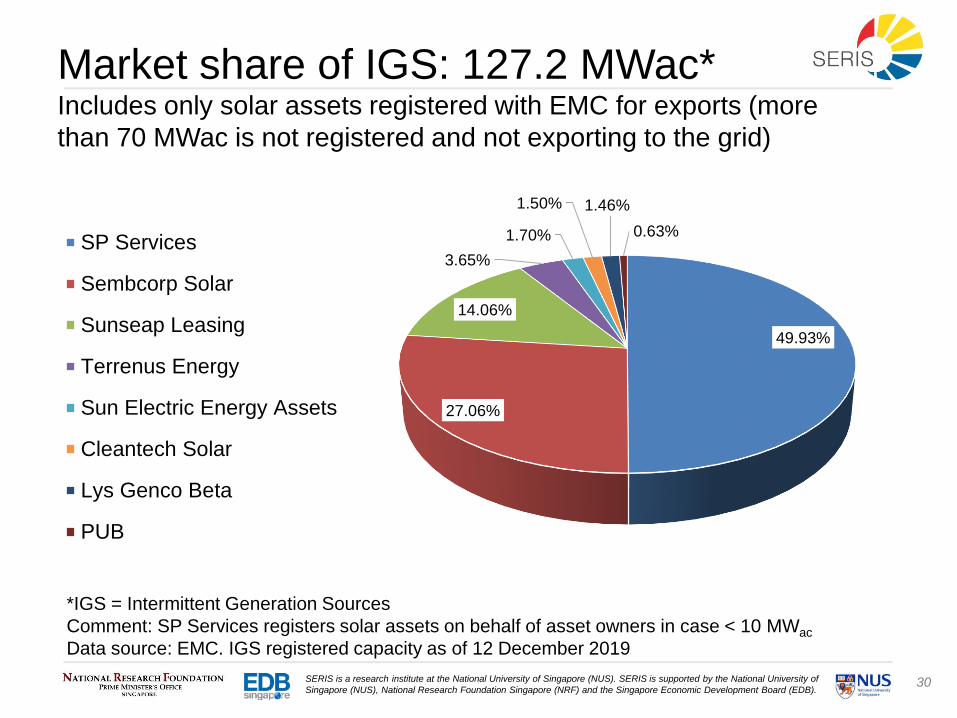
Market share of IGS: 127.2 MWac*Includes only solar assets registered with EMC for exports (more
than 70 MWac is not registered and not exporting to the grid)
*IGS = Intermittent Generation Sources
Comment: SP Services registers solar assets on behalf of asset owners in case < 10 MWac
Data source: EMC. IGS registered capacity as of 12 December 2019
49.93%
27.06%
14.06%
3.65%
1.70%
1.50% 1.46%
0.63%SP Services
Sembcorp Solar
Sunseap Leasing
Terrenus Energy
Sun Electric Energy Assets
Cleantech Solar
Lys Genco Beta
PUB
31SERIS is a research institute at the National University of Singapore (NUS). SERIS is supported by the National University of
Singapore (NUS), National Research Foundation Singapore (NRF) and the Singapore Economic Development Board (EDB).
0%
10%
20%
30%
40%
50%
60%
70%
80%
90%
100%
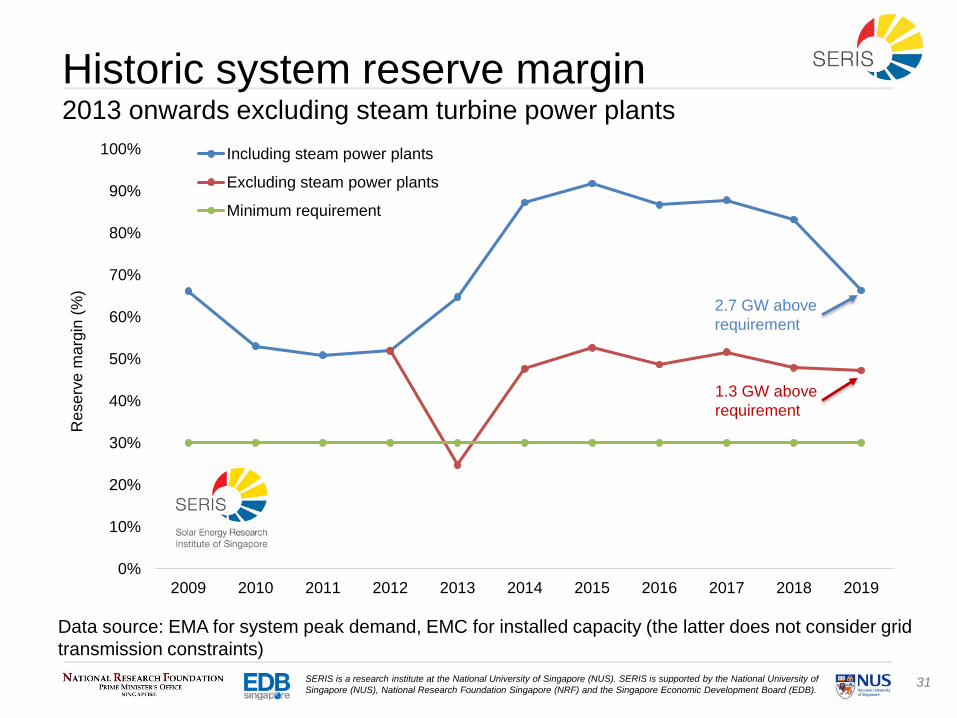
2009 2010 2011 2012 2013 2014 2015 2016 2017 2018 2019
Rese
rve
ma
rgin
(%
)
Including steam power plants
Excluding steam power plants
Minimum requirement
Historic system reserve margin2013 onwards excluding steam turbine power plants
Data source: EMA for system peak demand, EMC for installed capacity (the latter does not consider grid
transmission constraints)
2.7 GW above
requirement
1.3 GW above
requirement
32SERIS is a research institute at the National University of Singapore (NUS). SERIS is supported by the National University of
Singapore (NUS), National Research Foundation Singapore (NRF) and the Singapore Economic Development Board (EDB).
0%
10%
20%
30%
40%
50%
60%
70%
80%
90%
100%
In %
of to
tal ca
pa
city
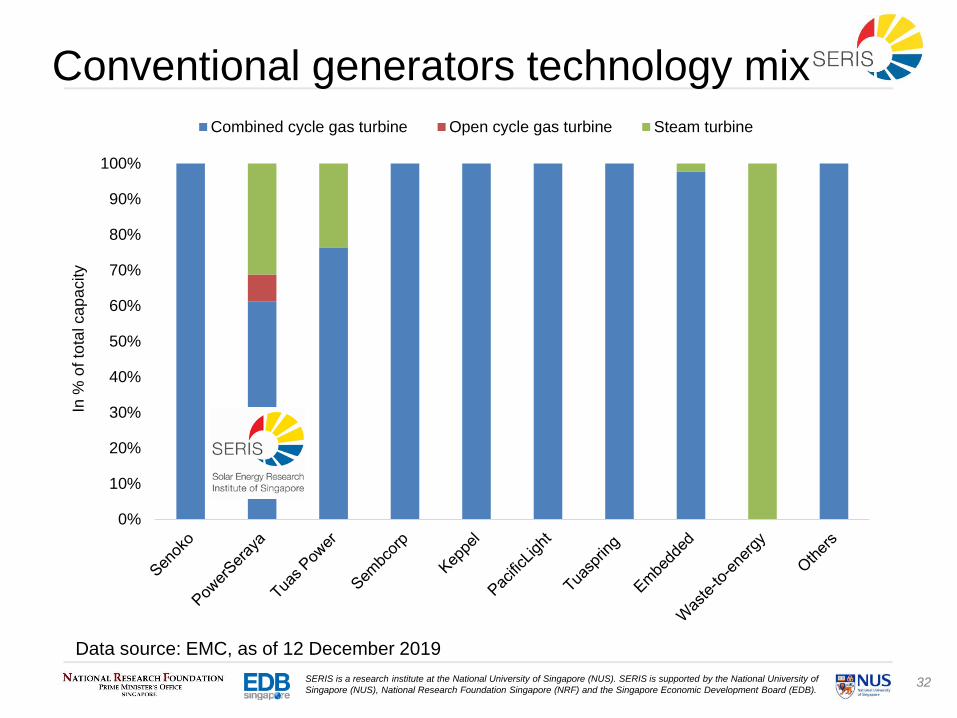
Combined cycle gas turbine Open cycle gas turbine Steam turbine
Conventional generators technology mix
Data source: EMC, as of 12 December 2019
33SERIS is a research institute at the National University of Singapore (NUS). SERIS is supported by the National University of
Singapore (NUS), National Research Foundation Singapore (NRF) and the Singapore Economic Development Board (EDB).
0%
10%
20%
30%
40%
50%
60%
70%
80%
90%
100%
2009 2010 2011 2012 2013 2014 2015 2016 2017 2018
Cap
acity u
tilis
atio
n (
%)
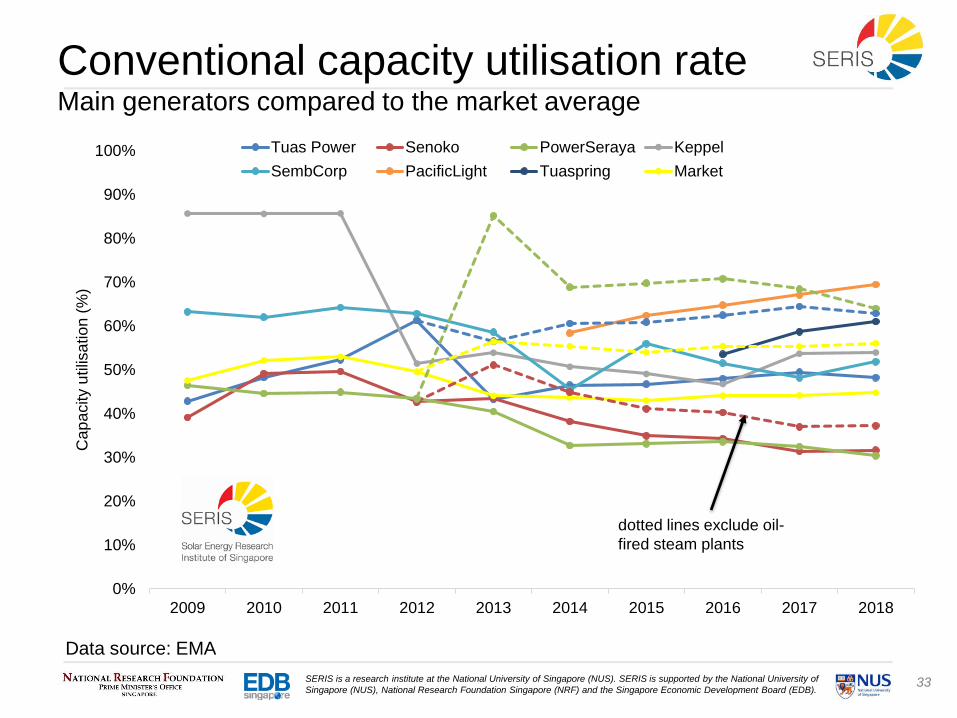
Tuas Power Senoko PowerSeraya Keppel
SembCorp PacificLight Tuaspring Market
Conventional capacity utilisation rateMain generators compared to the market average
Data source: EMA
dotted lines exclude oil-
fired steam plants

34SERIS is a research institute at the National University of Singapore (NUS). SERIS is supported by the National University of
Singapore (NUS), National Research Foundation Singapore (NRF) and the Singapore Economic Development Board (EDB).
3c) Singapore electricity market: Demand
35SERIS is a research institute at the National University of Singapore (NUS). SERIS is supported by the National University of
Singapore (NUS), National Research Foundation Singapore (NRF) and the Singapore Economic Development Board (EDB).
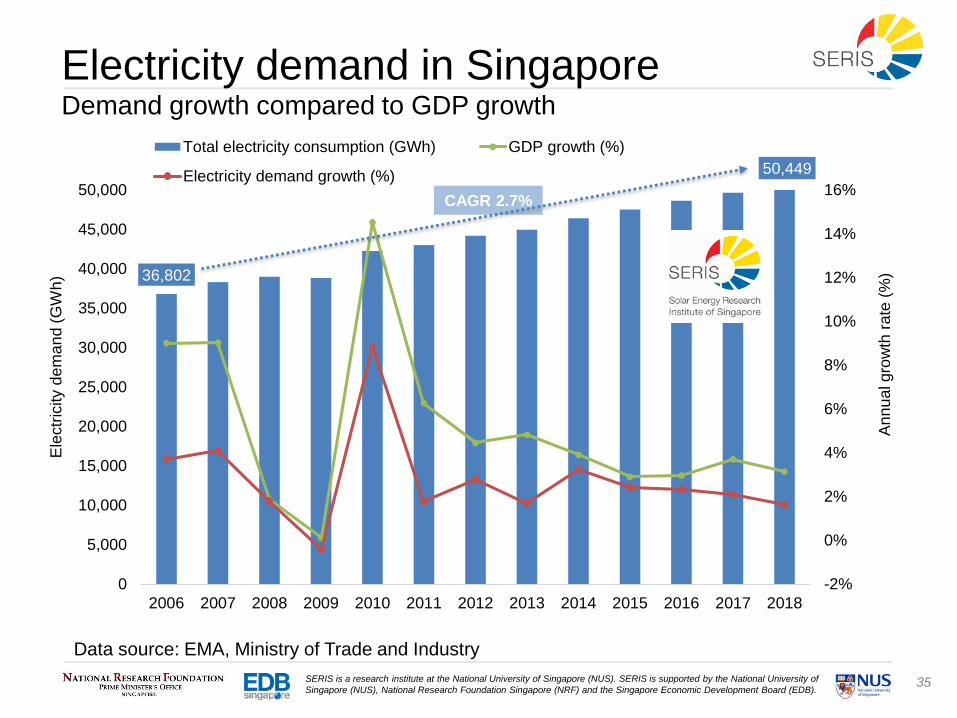
36,802
50,449
-2%
0%
2%
4%
6%
8%
10%
12%
14%
16%
0
5,000
10,000
15,000
20,000
25,000
30,000
35,000
40,000
45,000
50,000
2006 2007 2008 2009 2010 2011 2012 2013 2014 2015 2016 2017 2018
An
nu
al gro
wth
rate
(%
)
Ele
ctr
icity d
em
an
d (
GW
h)
Total electricity consumption (GWh) GDP growth (%)
Electricity demand growth (%)
Electricity demand in SingaporeDemand growth compared to GDP growth
Data source: EMA, Ministry of Trade and Industry
CAGR 2.7%
36SERIS is a research institute at the National University of Singapore (NUS). SERIS is supported by the National University of
Singapore (NUS), National Research Foundation Singapore (NRF) and the Singapore Economic Development Board (EDB).
7,200
7,400
7,600
7,800
8,000
8,200
8,400
8,600
8,800
9,000
9,200
0
5,000
10,000
15,000
20,000
25,000
30,000
35,000
40,000
45,000
50,000
2006 2007 2008 2009 2010 2011 2012 2013 2014 2015 2016 2017 2018
Pe
r ca
pita
(kW
h/y
ea
r)
Ele
ctr
icity d
em
an
d (
GW
h)
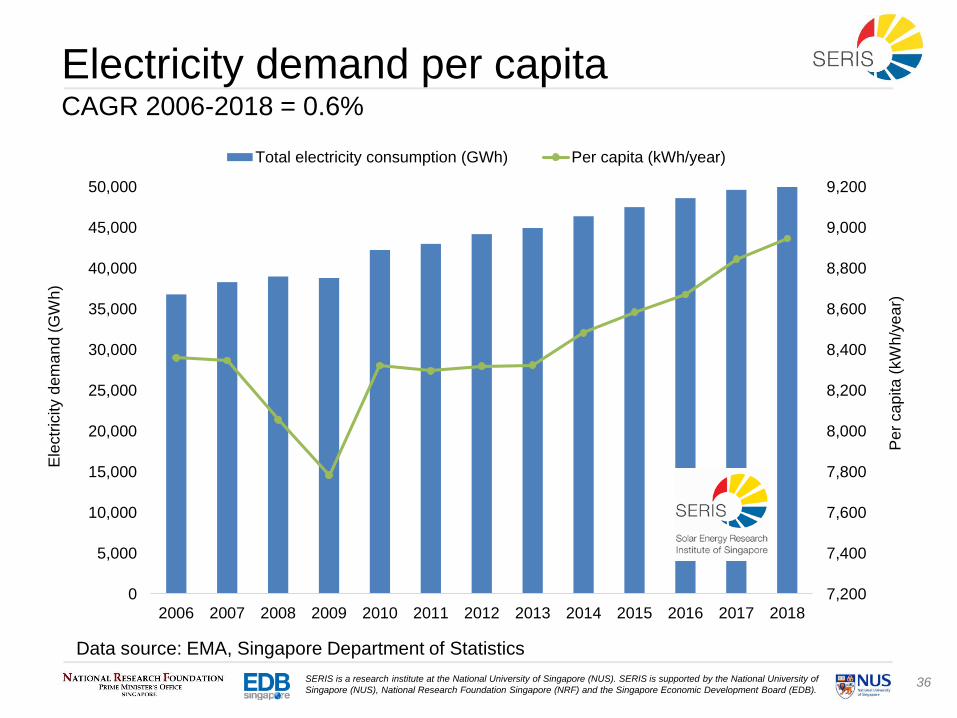
Total electricity consumption (GWh) Per capita (kWh/year)
Electricity demand per capitaCAGR 2006-2018 = 0.6%
Data source: EMA, Singapore Department of Statistics
37SERIS is a research institute at the National University of Singapore (NUS). SERIS is supported by the National University of
Singapore (NUS), National Research Foundation Singapore (NRF) and the Singapore Economic Development Board (EDB).
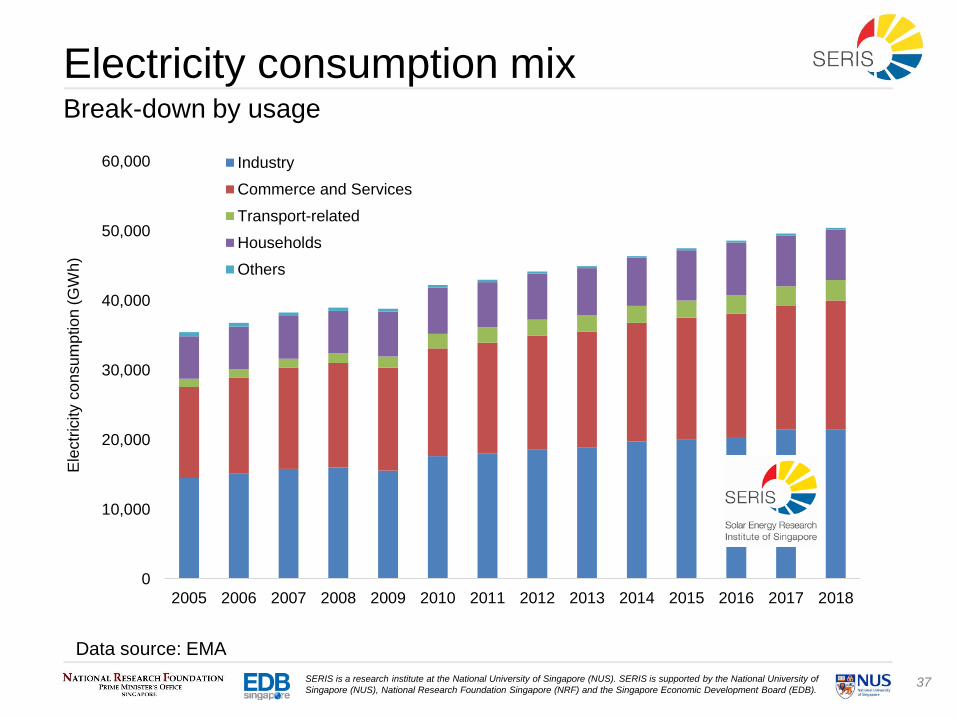
0
10,000
20,000
30,000
40,000
50,000
60,000
2005 2006 2007 2008 2009 2010 2011 2012 2013 2014 2015 2016 2017 2018
Ele
ctr
icity c
on
su
mp
tio
n (
GW
h)
Industry
Commerce and Services
Transport-related
Households
Others
Electricity consumption mixBreak-down by usage
Data source: EMA
38SERIS is a research institute at the National University of Singapore (NUS). SERIS is supported by the National University of
Singapore (NUS), National Research Foundation Singapore (NRF) and the Singapore Economic Development Board (EDB).
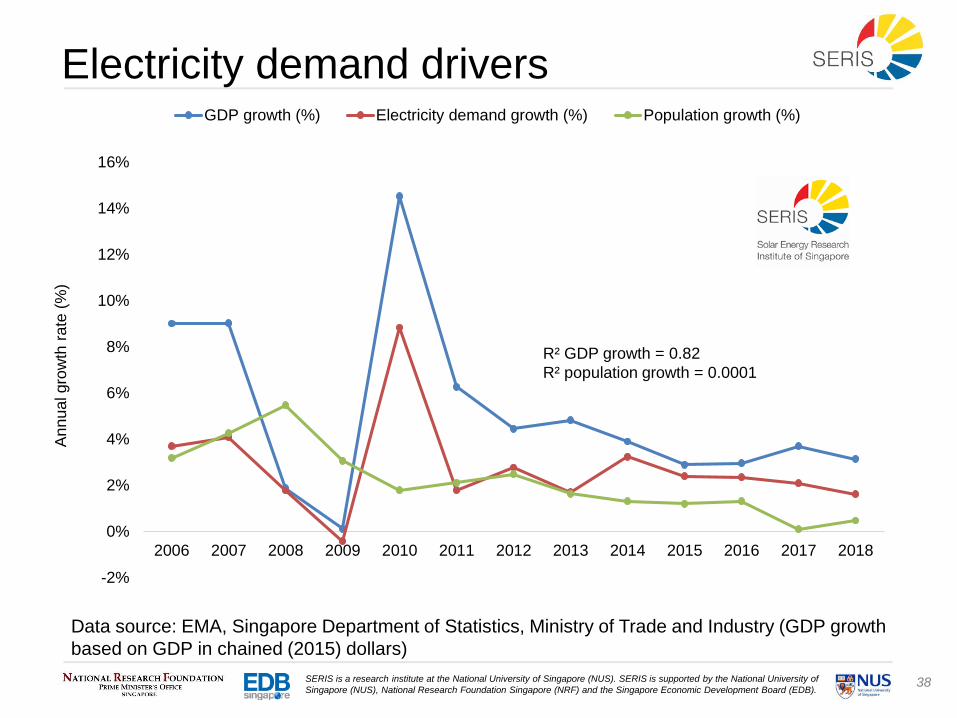
-2%
0%
2%
4%
6%
8%
10%
12%
14%
16%
2006 2007 2008 2009 2010 2011 2012 2013 2014 2015 2016 2017 2018
An
nu
al gro
wth
rate
(%
)
GDP growth (%) Electricity demand growth (%) Population growth (%)
Electricity demand drivers
Data source: EMA, Singapore Department of Statistics, Ministry of Trade and Industry (GDP growth
based on GDP in chained (2015) dollars)
R² GDP growth = 0.82
R² population growth = 0.0001
39SERIS is a research institute at the National University of Singapore (NUS). SERIS is supported by the National University of
Singapore (NUS), National Research Foundation Singapore (NRF) and the Singapore Economic Development Board (EDB).
4,500
5,000
5,500
6,000
6,500
7,000
7,500
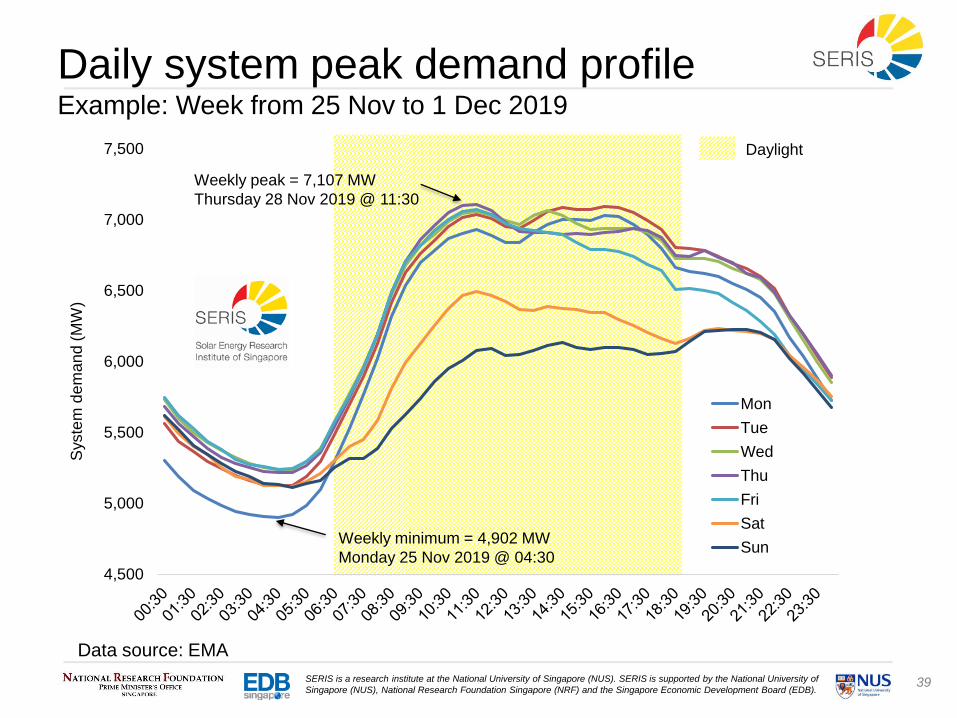
Syste
m d
em
an
d (
MW
)
Mon
Tue
Wed
Thu
Fri
Sat
Sun
Daily system peak demand profileExample: Week from 25 Nov to 1 Dec 2019
Data source: EMA
Daylight
Weekly peak = 7,107 MW
Thursday 28 Nov 2019 @ 11:30
Weekly minimum = 4,902 MW
Monday 25 Nov 2019 @ 04:30

40SERIS is a research institute at the National University of Singapore (NUS). SERIS is supported by the National University of
Singapore (NUS), National Research Foundation Singapore (NRF) and the Singapore Economic Development Board (EDB).
Historic system peak demand profileNo significant change of daily demand pattern over past eight years
Data source: EMA. Average daily profile for the month of June, excludes weekends/public holidays, the
annual peak happened in different months for 2012 (May), 2016 (August) and 2019 (May)
4,000
4,500
5,000
5,500
6,000
6,500
7,000
7,500
Syste
m p
ea
k d
em
an
d (
MW
)
June 2012
June 2013
June 2014
June 2015
June 2016
June 2017
June 2018
June 2019
Daylight
41SERIS is a research institute at the National University of Singapore (NUS). SERIS is supported by the National University of
Singapore (NUS), National Research Foundation Singapore (NRF) and the Singapore Economic Development Board (EDB).
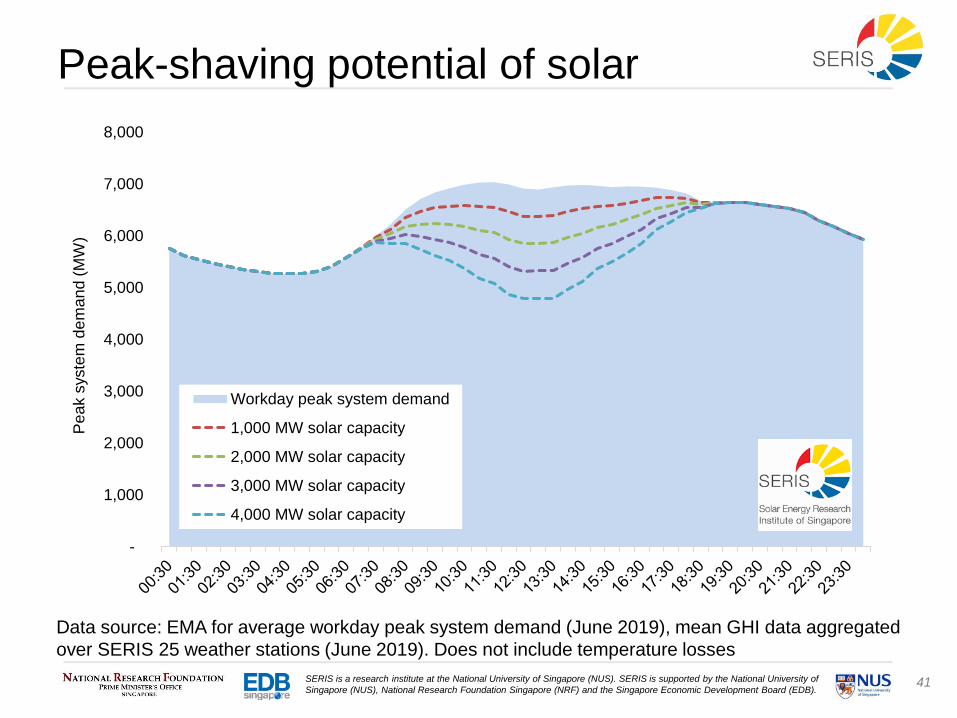
-
1,000
2,000
3,000
4,000
5,000
6,000
7,000
8,000
Pe
ak s
yste
m d
em
an
d (
MW
)
Workday peak system demand
1,000 MW solar capacity
2,000 MW solar capacity
3,000 MW solar capacity
4,000 MW solar capacity
Peak-shaving potential of solar
Data source: EMA for average workday peak system demand (June 2019), mean GHI data aggregated
over SERIS 25 weather stations (June 2019). Does not include temperature losses
42SERIS is a research institute at the National University of Singapore (NUS). SERIS is supported by the National University of
Singapore (NUS), National Research Foundation Singapore (NRF) and the Singapore Economic Development Board (EDB).
0
1,000
2,000
3,000
4,000
5,000
6,000
7,000
8,000
0
20
40
60
80
100
120
140
160
180
Ave
rage
de
ma
nd
(M
W)
Ave
rage
US
EP
(S
GD
/MW
h)
Average USEP WD
Average USEP WE & PH
Average Demand WD
Average Demand WE & PH
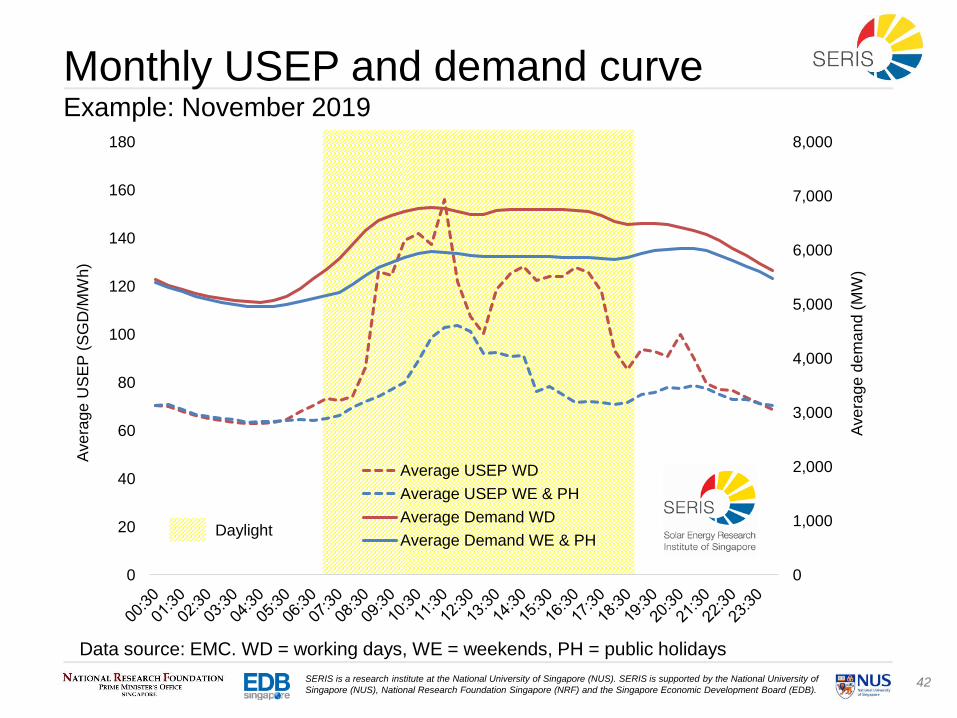
Monthly USEP and demand curveExample: November 2019
Data source: EMC. WD = working days, WE = weekends, PH = public holidays
Daylight
43SERIS is a research institute at the National University of Singapore (NUS). SERIS is supported by the National University of
Singapore (NUS), National Research Foundation Singapore (NRF) and the Singapore Economic Development Board (EDB).
0
50
100
150
200
250
300
350
Ave
rage
mo
nth
ly U
SE
P w
ork
ing d
ays (
SG
D/M
Wh)
June 2012
June 2013
June 2014
June 2015
June 2016
June 2017
June 2018
June 2019
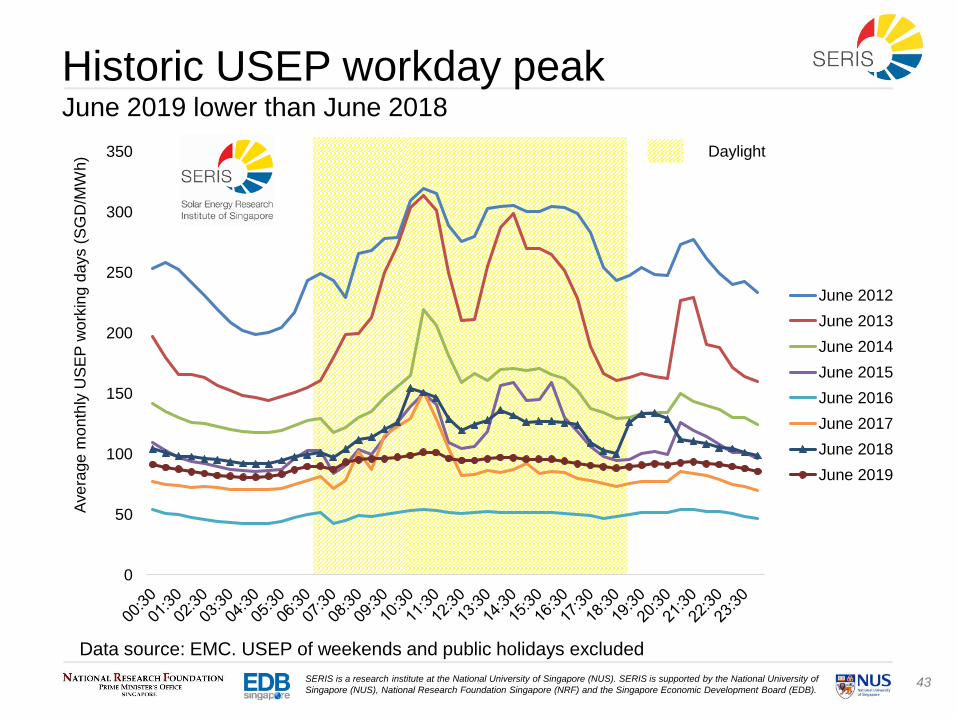
Historic USEP workday peakJune 2019 lower than June 2018
Data source: EMC. USEP of weekends and public holidays excluded
Daylight
44SERIS is a research institute at the National University of Singapore (NUS). SERIS is supported by the National University of
Singapore (NUS), National Research Foundation Singapore (NRF) and the Singapore Economic Development Board (EDB).
-2%
0%
2%
4%
6%
8%
10%
0
1,000
2,000
3,000
4,000
5,000
6,000
7,000
8,000
2009 2010 2011 2012 2013 2014 2015 2016 2017 2018 2019*
An
nu
al gro
wth
(%
)
Pe
ak s
yste
m d
em
an
d (
MW
)
Peak system demand
Peak system demand growth
Electricity consumption growth
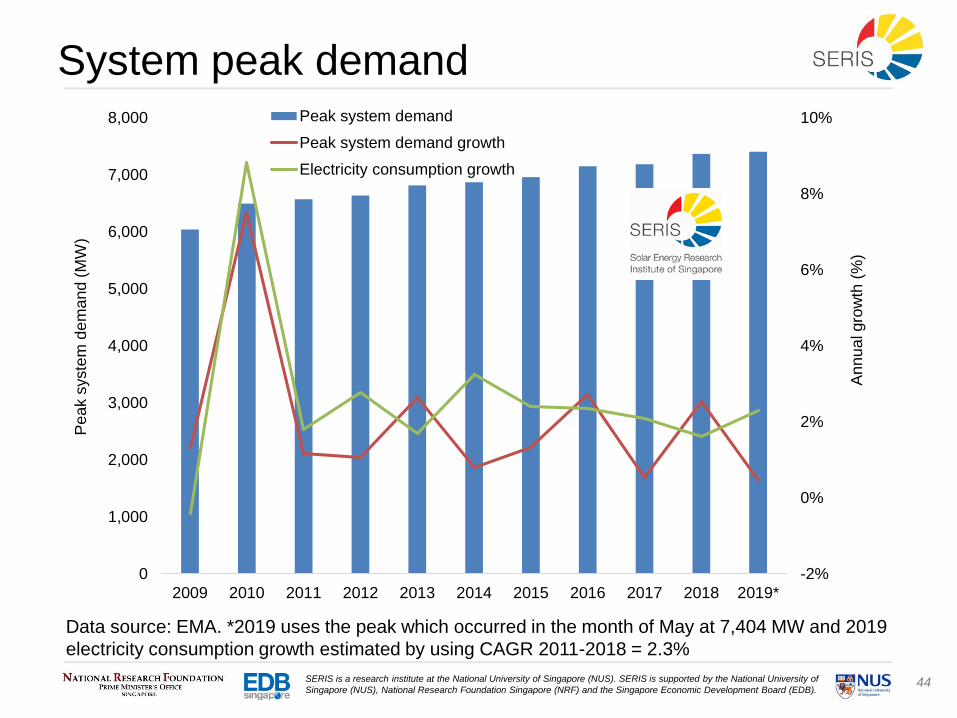
System peak demand
Data source: EMA. *2019 uses the peak which occurred in the month of May at 7,404 MW and 2019
electricity consumption growth estimated by using CAGR 2011-2018 = 2.3%
45SERIS is a research institute at the National University of Singapore (NUS). SERIS is supported by the National University of
Singapore (NUS), National Research Foundation Singapore (NRF) and the Singapore Economic Development Board (EDB).
0%
10%
20%
30%
40%
50%
60%
70%
80%
0%
5%
10%
15%
20%
25%
30%
35%
40%
45%
2005 2006 2007 2008 2009 2010 2011 2012 2013 2014 2015 2016 2017 2018
Ma
rke
t sh
are
of
top
3 d
om
ina
nt re
taile
rs (
%)
Ind
ivid
ua
l m
ark
et sh
are
(%
)
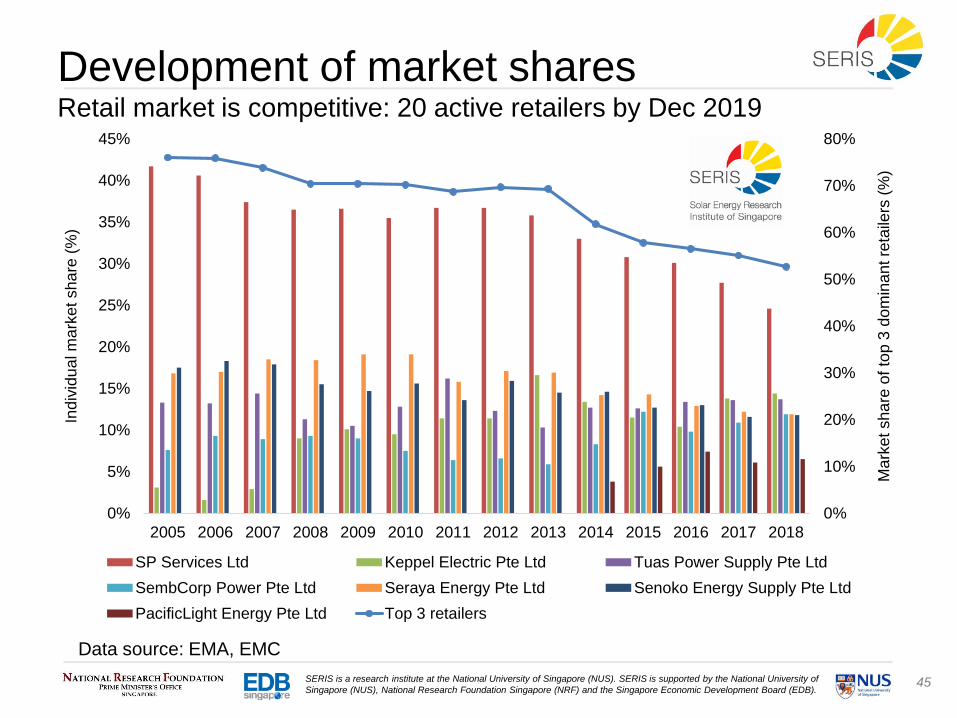
SP Services Ltd Keppel Electric Pte Ltd Tuas Power Supply Pte Ltd
SembCorp Power Pte Ltd Seraya Energy Pte Ltd Senoko Energy Supply Pte Ltd
PacificLight Energy Pte Ltd Top 3 retailers
Development of market sharesRetail market is competitive: 20 active retailers by Dec 2019
Data source: EMA, EMC
46SERIS is a research institute at the National University of Singapore (NUS). SERIS is supported by the National University of
Singapore (NUS), National Research Foundation Singapore (NRF) and the Singapore Economic Development Board (EDB).
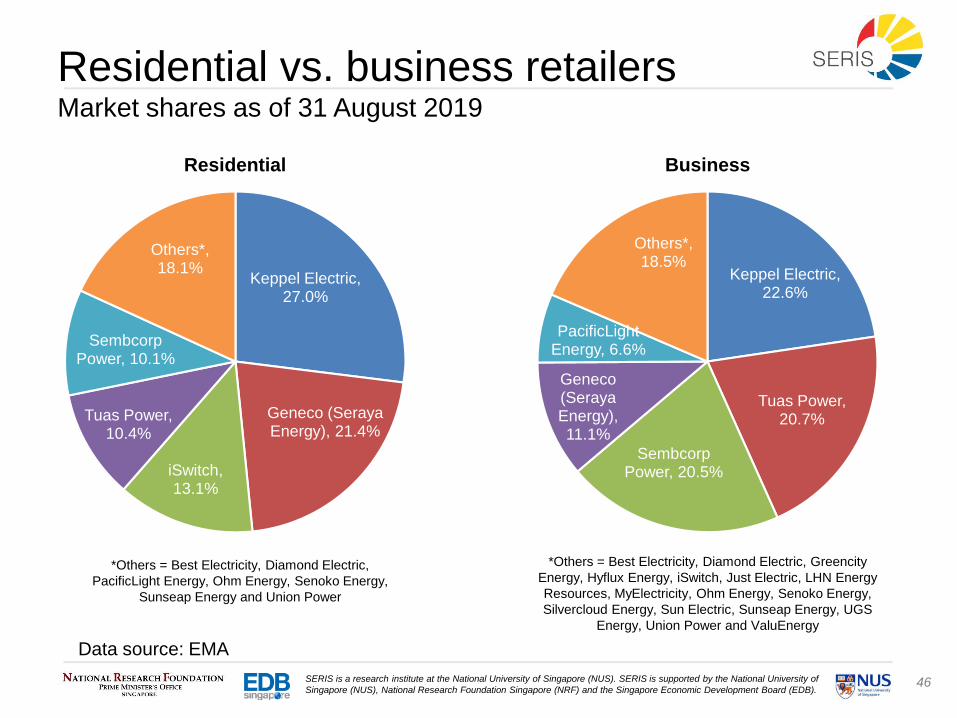
Residential vs. business retailersMarket shares as of 31 August 2019
Data source: EMA
Keppel Electric, 27.0%
Geneco (Seraya Energy), 21.4%
iSwitch, 13.1%
Tuas Power, 10.4%
Sembcorp Power, 10.1%
Others*, 18.1%
Residential
Keppel Electric, 22.6%
Tuas Power, 20.7%
Sembcorp Power, 20.5%
Geneco (Seraya Energy), 11.1%
PacificLight Energy, 6.6%
Others*, 18.5%
Business
*Others = Best Electricity, Diamond Electric,
PacificLight Energy, Ohm Energy, Senoko Energy,
Sunseap Energy and Union Power
*Others = Best Electricity, Diamond Electric, Greencity
Energy, Hyflux Energy, iSwitch, Just Electric, LHN Energy
Resources, MyElectricity, Ohm Energy, Senoko Energy,
Silvercloud Energy, Sun Electric, Sunseap Energy, UGS
Energy, Union Power and ValuEnergy
47SERIS is a research institute at the National University of Singapore (NUS). SERIS is supported by the National University of
Singapore (NUS), National Research Foundation Singapore (NRF) and the Singapore Economic Development Board (EDB).
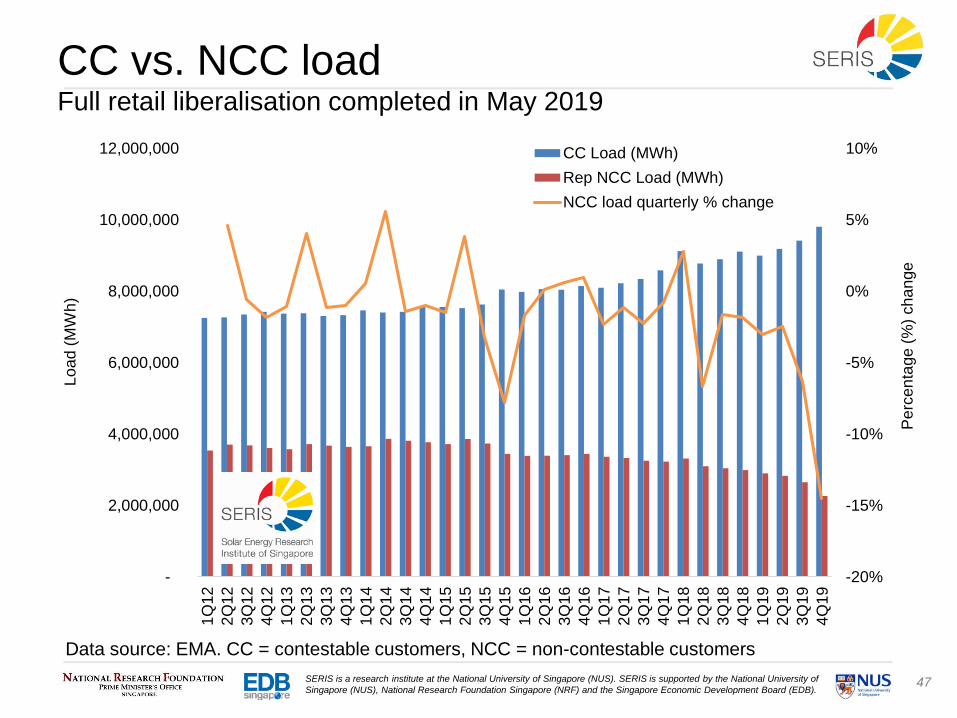
CC vs. NCC loadFull retail liberalisation completed in May 2019
Data source: EMA. CC = contestable customers, NCC = non-contestable customers
-20%
-15%
-10%
-5%
0%
5%
10%
-
2,000,000
4,000,000
6,000,000
8,000,000
10,000,000
12,000,000
1Q
12
2Q
12
3Q
12
4Q
12
1Q
13
2Q
13
3Q
13
4Q
13
1Q
14
2Q
14
3Q
14
4Q
14
1Q
15
2Q
15
3Q
15
4Q
15
1Q
16
2Q
16
3Q
16
4Q
16
1Q
17
2Q
17
3Q
17
4Q
17
1Q
18
2Q
18
3Q
18
4Q
18
1Q
19
2Q
19
3Q
19
4Q
19
Pe
rcen
tage
(%
) ch
an
ge
Lo
ad
(M
Wh
)
CC Load (MWh)
Rep NCC Load (MWh)
NCC load quarterly % change
48SERIS is a research institute at the National University of Singapore (NUS). SERIS is supported by the National University of
Singapore (NUS), National Research Foundation Singapore (NRF) and the Singapore Economic Development Board (EDB).
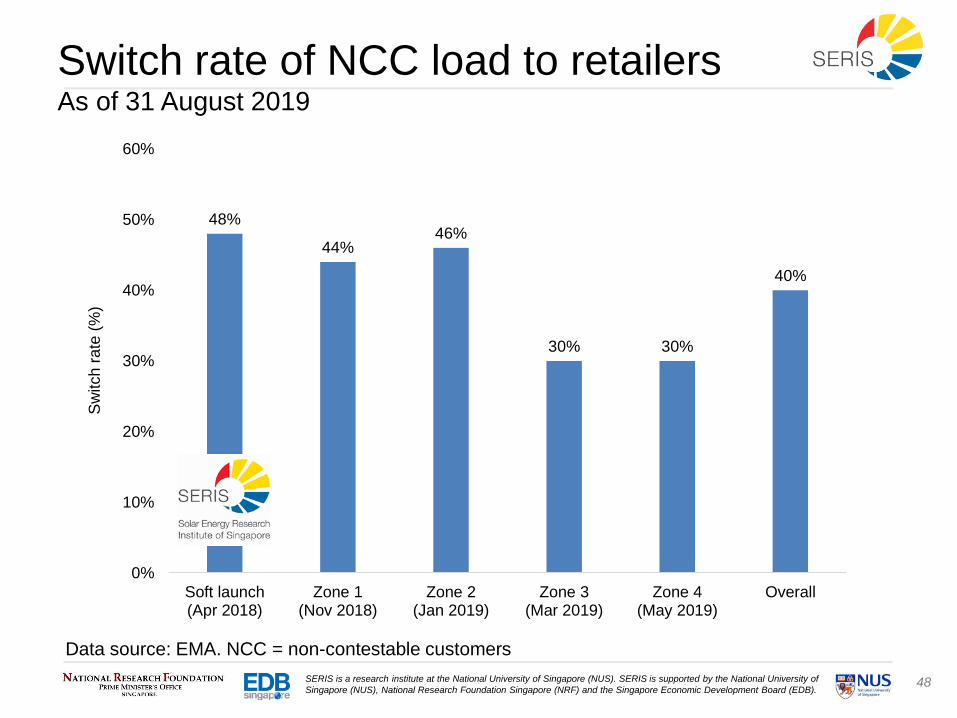
48%
44%46%
30% 30%
40%
0%
10%
20%
30%
40%
50%
60%
Soft launch(Apr 2018)
Zone 1(Nov 2018)
Zone 2(Jan 2019)
Zone 3(Mar 2019)
Zone 4(May 2019)
Overall
Sw
itch
ra
te (
%)
Switch rate of NCC load to retailersAs of 31 August 2019
Data source: EMA. NCC = non-contestable customers
49SERIS is a research institute at the National University of Singapore (NUS). SERIS is supported by the National University of
Singapore (NUS), National Research Foundation Singapore (NRF) and the Singapore Economic Development Board (EDB).
3d) Singapore electricity market: Prices
50SERIS is a research institute at the National University of Singapore (NUS). SERIS is supported by the National University of
Singapore (NUS), National Research Foundation Singapore (NRF) and the Singapore Economic Development Board (EDB).
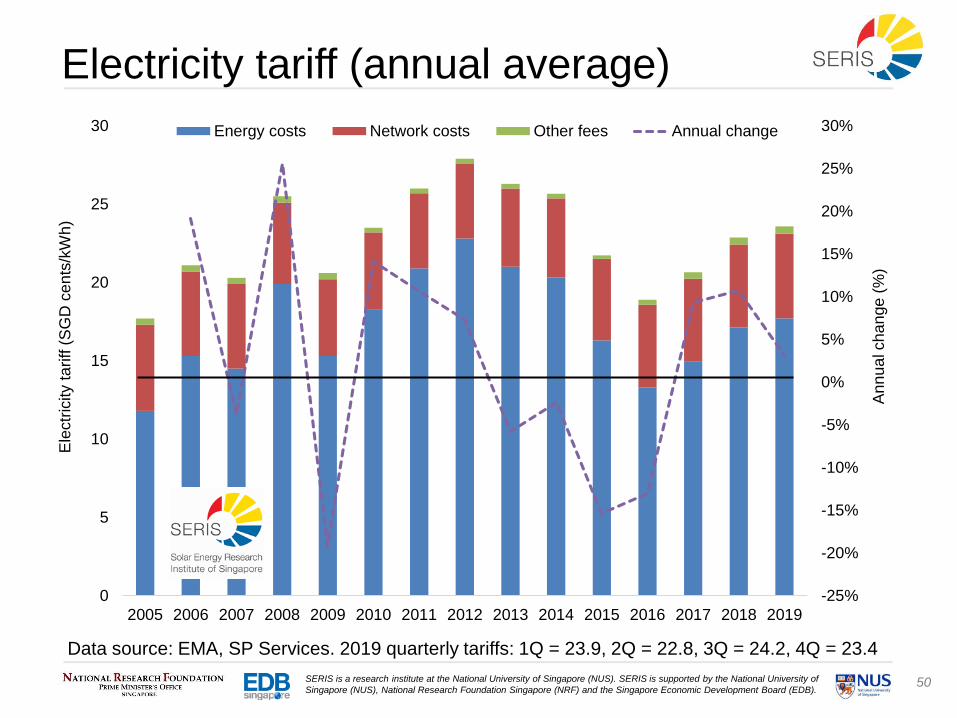
Electricity tariff (annual average)
Data source: EMA, SP Services. 2019 quarterly tariffs: 1Q = 23.9, 2Q = 22.8, 3Q = 24.2, 4Q = 23.4
-25%
-20%
-15%
-10%
-5%
0%
5%
10%
15%
20%
25%
30%
0
5
10
15
20
25
30
2005 2006 2007 2008 2009 2010 2011 2012 2013 2014 2015 2016 2017 2018 2019
An
nu
al ch
an
ge
(%
)
Ele
ctr
icity t
ariff
(S
GD
ce
nts
/kW
h)
Energy costs Network costs Other fees Annual change

51SERIS is a research institute at the National University of Singapore (NUS). SERIS is supported by the National University of
Singapore (NUS), National Research Foundation Singapore (NRF) and the Singapore Economic Development Board (EDB).
Vesting contractsA unique feature of the Singaporean power market
Implemented in Jan-2004 as a regulatory instrument to mitigate
market power by the generation companies (gencos)*
Commits gencos to sell a specified quantity (i.e. the Vesting Contract
Level, VCL) for a specified price (i.e. the Vesting Price, VP)
A 10-year LNG vesting scheme was introduced in May-13 to
encourage the uptake of regasified LNG whereas eligible gencos
receive the LNG vesting price for a specified LNG vesting quantity
Vesting prices (one for piped gas and one for regasified LNG gas)
are based on a regulatory review done every 24 months and are
updated quarterly based on fuel cost and cost inflation changes
Vesting prices mirror the long run marginal cost (LRMC, i.e. variable
and fixed operating cost including reasonable return to investors) of
the most efficiency power plant in Singapore (currently combined
cycle gas turbines, CCGTs)
*Mandatory for Senoko Energy, PowerSeraya, Tuas Power, SembCorp, Keppel and PacificLight
Data source: EMA
52SERIS is a research institute at the National University of Singapore (NUS). SERIS is supported by the National University of
Singapore (NUS), National Research Foundation Singapore (NRF) and the Singapore Economic Development Board (EDB).
0%
10%
20%
30%
40%
50%
60%
70%
2004 2005 2006 2007 2008 2009 2010 2011 2012 2013 2014 2015 2016 2017 2018 2019
Ve
stin
g c
on
tra
ct le
ve
l (%
)
Minimum rollback schedule (established prior 2004) Actual level
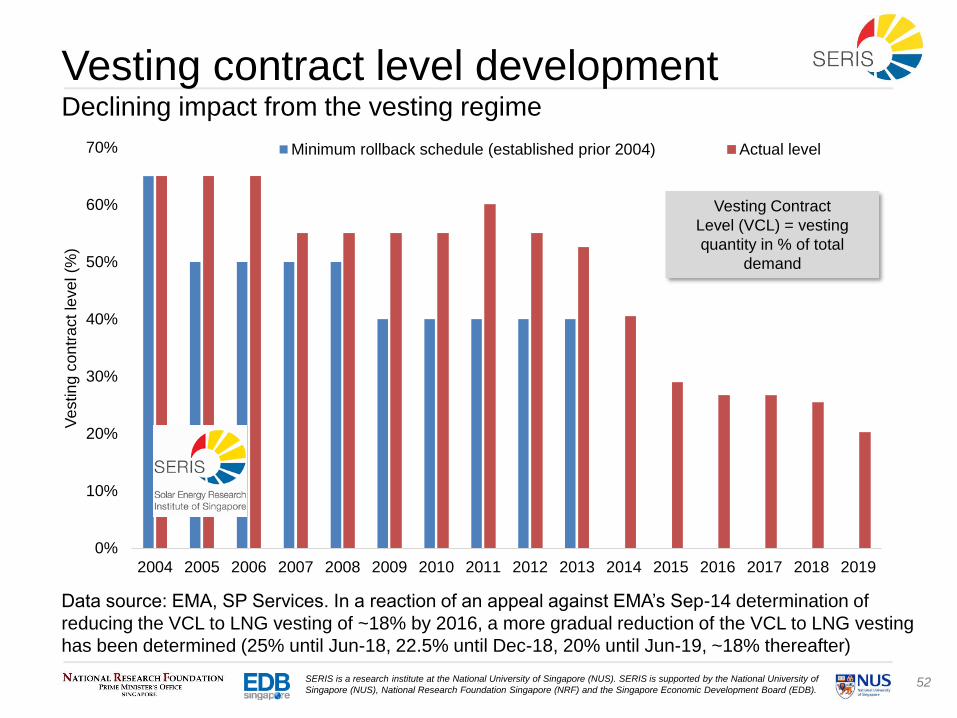
Vesting contract level developmentDeclining impact from the vesting regime
Data source: EMA, SP Services. In a reaction of an appeal against EMA’s Sep-14 determination of
reducing the VCL to LNG vesting of ~18% by 2016, a more gradual reduction of the VCL to LNG vesting
has been determined (25% until Jun-18, 22.5% until Dec-18, 20% until Jun-19, ~18% thereafter)
Vesting Contract
Level (VCL) = vesting
quantity in % of total
demand
53SERIS is a research institute at the National University of Singapore (NUS). SERIS is supported by the National University of
Singapore (NUS), National Research Foundation Singapore (NRF) and the Singapore Economic Development Board (EDB).
0
20
40
60
80
100
120
140
160
180
0
2
4
6
8
10
12
14
1Q
12
2Q
12
3Q
12
4Q
12
1Q
13
2Q
13
3Q
13
4Q
13
1Q
14
2Q
14
3Q
14
4Q
14
1Q
15
2Q
15
3Q
15
4Q
15
1Q
16
2Q
16
3Q
16
4Q
16
1Q
17
2Q
17
3Q
17
4Q
17
1Q
18
2Q
18
3Q
18
4Q
18
1Q
19
2Q
19
3Q
19
4Q
19
Ve
stin
g c
on
tra
ct le
ve
l (%
)
Ve
stin
g q
ua
ntity
, d
em
an
d (
TW
h)
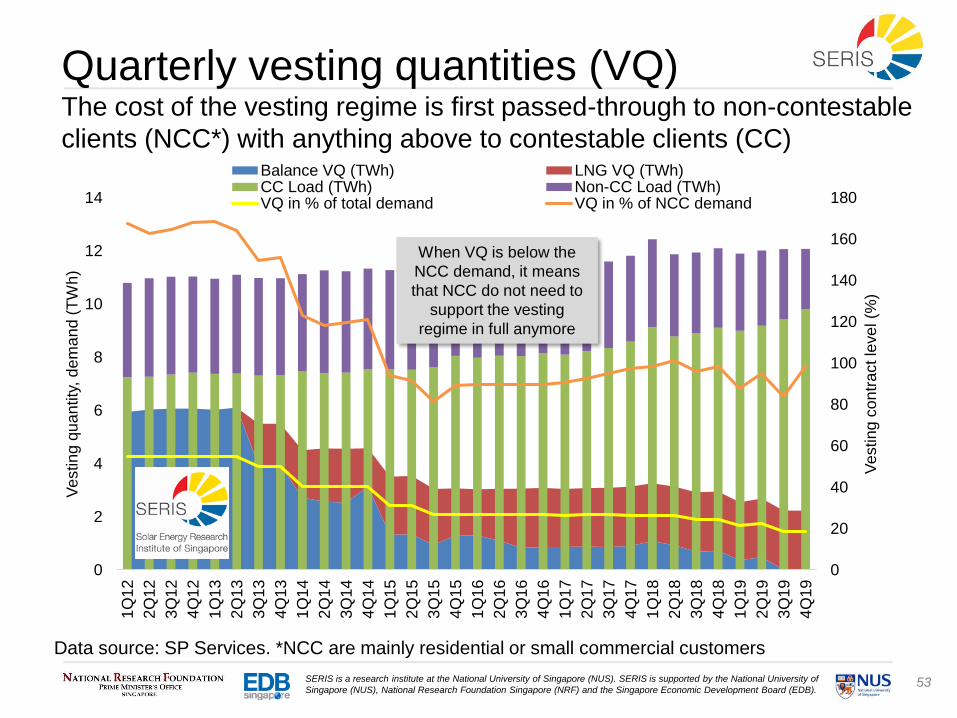
Balance VQ (TWh) LNG VQ (TWh)CC Load (TWh) Non-CC Load (TWh)VQ in % of total demand VQ in % of NCC demand
Quarterly vesting quantities (VQ)The cost of the vesting regime is first passed-through to non-contestable
clients (NCC*) with anything above to contestable clients (CC)
Data source: SP Services. *NCC are mainly residential or small commercial customers
When VQ is below the
NCC demand, it means
that NCC do not need to
support the vesting
regime in full anymore
54SERIS is a research institute at the National University of Singapore (NUS). SERIS is supported by the National University of
Singapore (NUS), National Research Foundation Singapore (NRF) and the Singapore Economic Development Board (EDB).
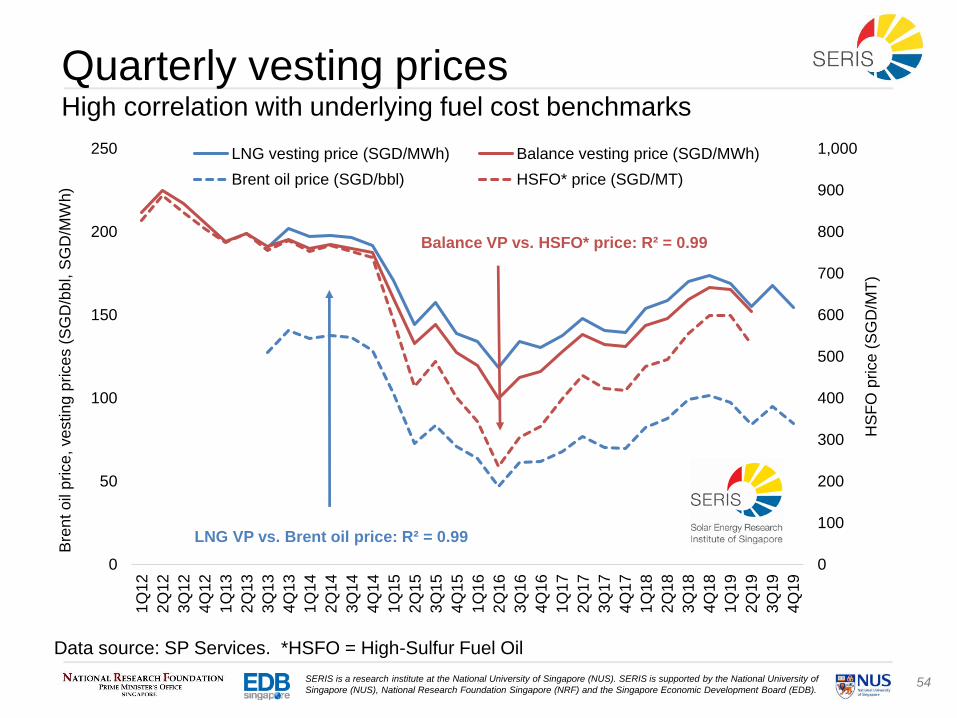
Quarterly vesting pricesHigh correlation with underlying fuel cost benchmarks
Data source: SP Services. *HSFO = High-Sulfur Fuel Oil
0
100
200
300
400
500
600
700
800
900
1,000
0
50
100
150
200
2501
Q1
2
2Q
12
3Q
12
4Q
12
1Q
13
2Q
13
3Q
13
4Q
13
1Q
14
2Q
14
3Q
14
4Q
14
1Q
15
2Q
15
3Q
15
4Q
15
1Q
16
2Q
16
3Q
16
4Q
16
1Q
17
2Q
17
3Q
17
4Q
17
1Q
18
2Q
18
3Q
18
4Q
18
1Q
19
2Q
19
3Q
19
4Q
19
HS
FO
price
(S
GD
/MT
)
Bre
nt o
il p
rice
, ve
stin
g p
rice
s (
SG
D/b
bl, S
GD
/MW
h)
LNG vesting price (SGD/MWh) Balance vesting price (SGD/MWh)
Brent oil price (SGD/bbl) HSFO* price (SGD/MT)
Balance VP vs. HSFO* price: R² = 0.99
LNG VP vs. Brent oil price: R² = 0.99
55SERIS is a research institute at the National University of Singapore (NUS). SERIS is supported by the National University of
Singapore (NUS), National Research Foundation Singapore (NRF) and the Singapore Economic Development Board (EDB).
0
20
40
60
80
100
120
0
5
10
15
20
25
30
2005 2006 2007 2008 2009 2010 2011 2012 2013 2014 2015 2016 2017 2018 2019*
Bre
nt o
il p
rice
(U
SD
/bb
l)
Ele
ctr
icity p
rice
s (
SG
D c
en
ts/k
Wh
)
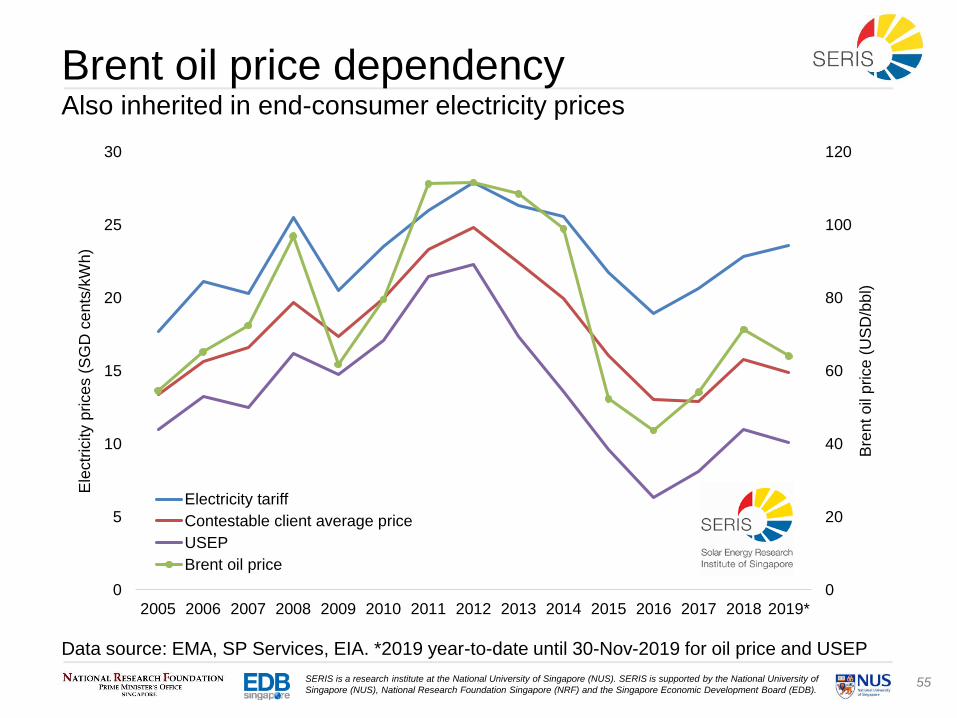
Electricity tariff
Contestable client average price
USEP
Brent oil price
Brent oil price dependency Also inherited in end-consumer electricity prices
Data source: EMA, SP Services, EIA. *2019 year-to-date until 30-Nov-2019 for oil price and USEP
56SERIS is a research institute at the National University of Singapore (NUS). SERIS is supported by the National University of
Singapore (NUS), National Research Foundation Singapore (NRF) and the Singapore Economic Development Board (EDB).
0
100
200
300
400
500
600
700
800
0
5
10
15
20
25
30
35
1Q
09
2Q
09
3Q
09
4Q
09
1Q
10
2Q
10
3Q
10
4Q
10
1Q
11
2Q
11
3Q
11
4Q
11
1Q
12
2Q
12
3Q
12
4Q
12
1Q
13
2Q
13
3Q
13
4Q
13
1Q
14
2Q
14
3Q
14
4Q
14
1Q
15
2Q
15
3Q
15
4Q
15
1Q
16
2Q
16
3Q
16
4Q
16
1Q
17
2Q
17
3Q
17
4Q
17
1Q
18
2Q
18
3Q
18
4Q
18
1Q
19
2Q
19
3Q
19
4Q
19
Fu
el o
il p
rice
s (
US
D/M
T)
Ele
ctr
icity p
rice
s (
SG
D c
en
ts/k
Wh
)
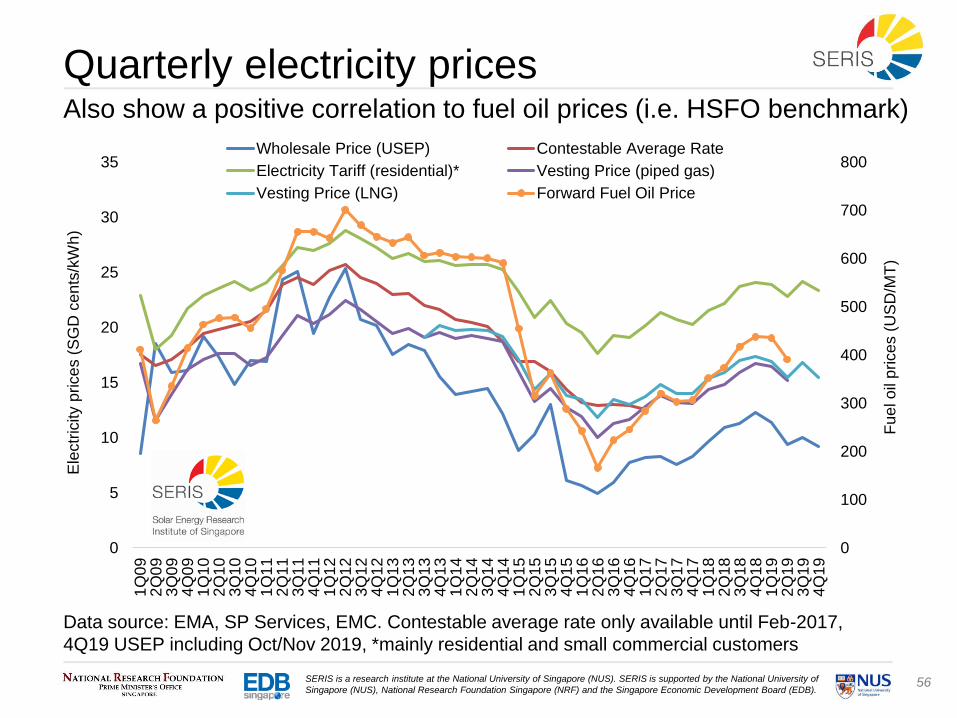
Wholesale Price (USEP) Contestable Average Rate
Electricity Tariff (residential)* Vesting Price (piped gas)
Vesting Price (LNG) Forward Fuel Oil Price
Quarterly electricity pricesAlso show a positive correlation to fuel oil prices (i.e. HSFO benchmark)
Data source: EMA, SP Services, EMC. Contestable average rate only available until Feb-2017,
4Q19 USEP including Oct/Nov 2019, *mainly residential and small commercial customers
57SERIS is a research institute at the National University of Singapore (NUS). SERIS is supported by the National University of
Singapore (NUS), National Research Foundation Singapore (NRF) and the Singapore Economic Development Board (EDB).
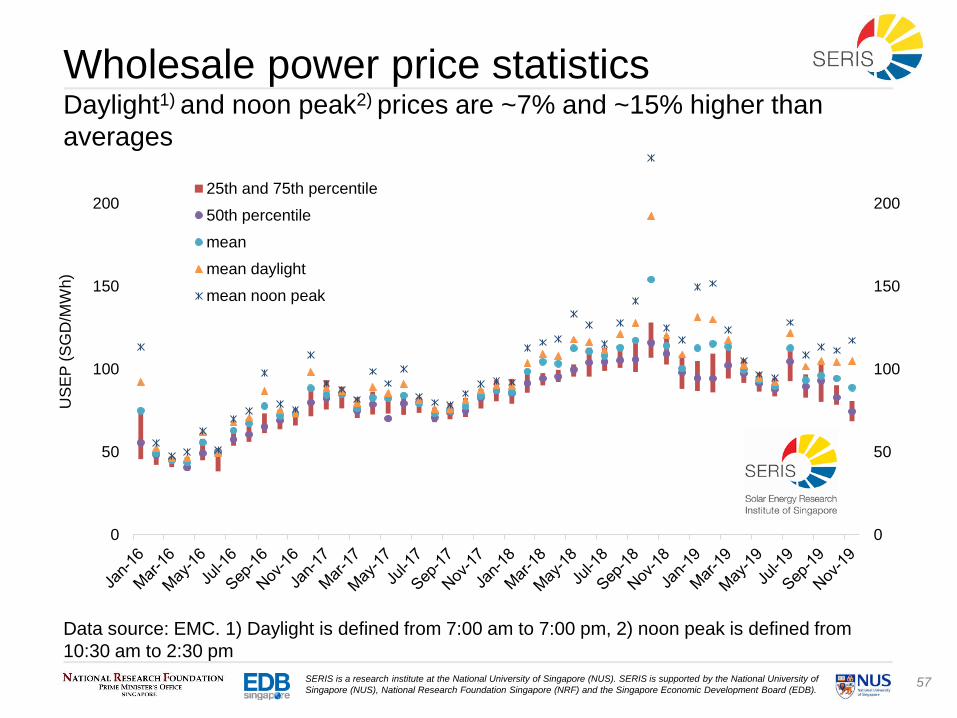
Wholesale power price statisticsDaylight1) and noon peak2) prices are ~7% and ~15% higher than
averages
Data source: EMC. 1) Daylight is defined from 7:00 am to 7:00 pm, 2) noon peak is defined from
10:30 am to 2:30 pm
0
50
100
150
200
0
50
100
150
200
US
EP
(S
GD
/MW
h)
25th and 75th percentile
50th percentile
mean
mean daylight
mean noon peak
58SERIS is a research institute at the National University of Singapore (NUS). SERIS is supported by the National University of
Singapore (NUS), National Research Foundation Singapore (NRF) and the Singapore Economic Development Board (EDB).
4. PV adoption in Singapore
59SERIS is a research institute at the National University of Singapore (NUS). SERIS is supported by the National University of
Singapore (NUS), National Research Foundation Singapore (NRF) and the Singapore Economic Development Board (EDB).
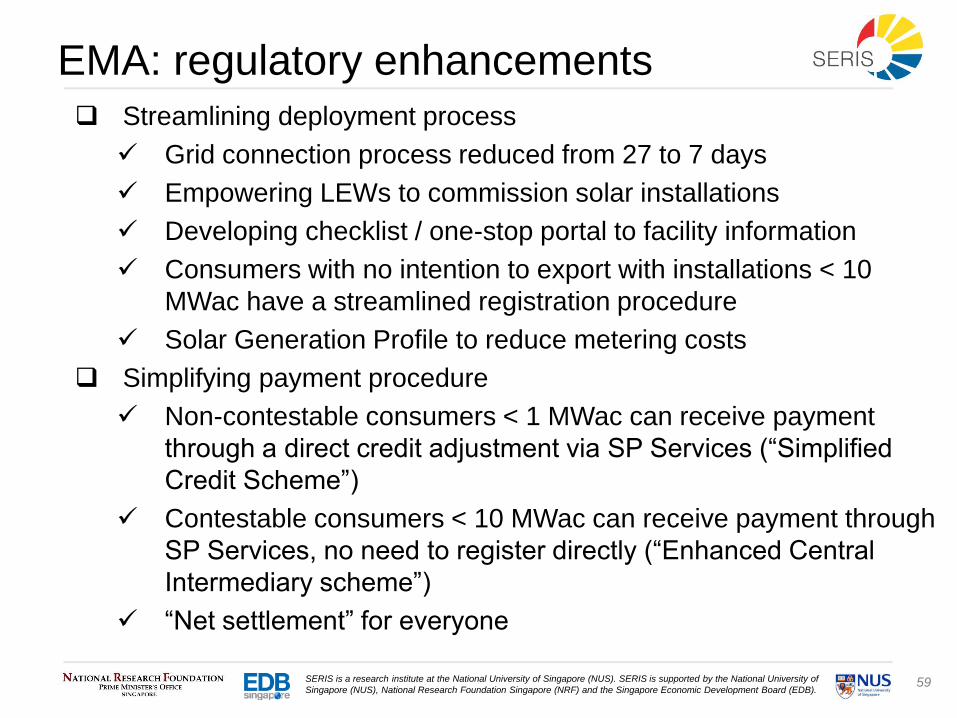
EMA: regulatory enhancements
Streamlining deployment process
Grid connection process reduced from 27 to 7 days
Empowering LEWs to commission solar installations
Developing checklist / one-stop portal to facility information
Consumers with no intention to export with installations < 10
MWac have a streamlined registration procedure
Solar Generation Profile to reduce metering costs
Simplifying payment procedure
Non-contestable consumers < 1 MWac can receive payment
through a direct credit adjustment via SP Services (“Simplified
Credit Scheme”)
Contestable consumers < 10 MWac can receive payment through
SP Services, no need to register directly (“Enhanced Central
Intermediary scheme”)
“Net settlement” for everyone
60SERIS is a research institute at the National University of Singapore (NUS). SERIS is supported by the National University of
Singapore (NUS), National Research Foundation Singapore (NRF) and the Singapore Economic Development Board (EDB).
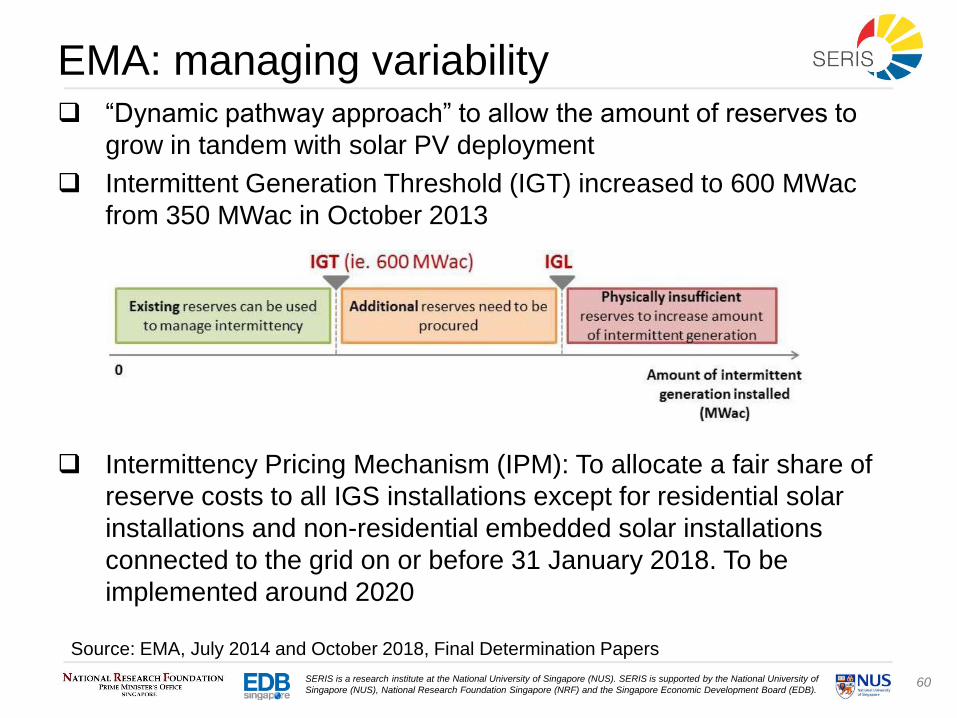
EMA: managing variability “Dynamic pathway approach” to allow the amount of reserves to
grow in tandem with solar PV deployment
Intermittent Generation Threshold (IGT) increased to 600 MWac
from 350 MWac in October 2013
Intermittency Pricing Mechanism (IPM): To allocate a fair share of
reserve costs to all IGS installations except for residential solar
installations and non-residential embedded solar installations
connected to the grid on or before 31 January 2018. To be
implemented around 2020
Source: EMA, July 2014 and October 2018, Final Determination Papers
61SERIS is a research institute at the National University of Singapore (NUS). SERIS is supported by the National University of
Singapore (NUS), National Research Foundation Singapore (NRF) and the Singapore Economic Development Board (EDB).
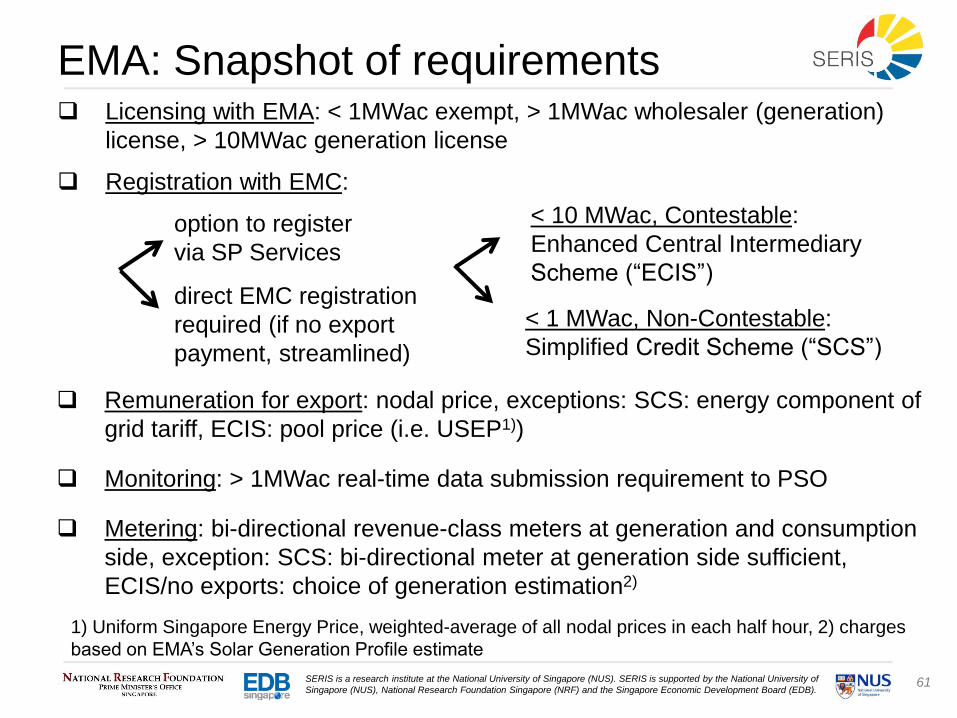
EMA: Snapshot of requirements Licensing with EMA: < 1MWac exempt, > 1MWac wholesaler (generation)
license, > 10MWac generation license
Registration with EMC:
option to register
via SP Services
direct EMC registration
required (if no export
payment, streamlined)
< 10 MWac, Contestable:
Enhanced Central Intermediary
Scheme (“ECIS”)
< 1 MWac, Non-Contestable:
Simplified Credit Scheme (“SCS”)
Remuneration for export: nodal price, exceptions: SCS: energy component of
grid tariff, ECIS: pool price (i.e. USEP1))
Monitoring: > 1MWac real-time data submission requirement to PSO
Metering: bi-directional revenue-class meters at generation and consumption
side, exception: SCS: bi-directional meter at generation side sufficient,
ECIS/no exports: choice of generation estimation2)
1) Uniform Singapore Energy Price, weighted-average of all nodal prices in each half hour, 2) charges
based on EMA’s Solar Generation Profile estimate
62SERIS is a research institute at the National University of Singapore (NUS). SERIS is supported by the National University of
Singapore (NUS), National Research Foundation Singapore (NRF) and the Singapore Economic Development Board (EDB).
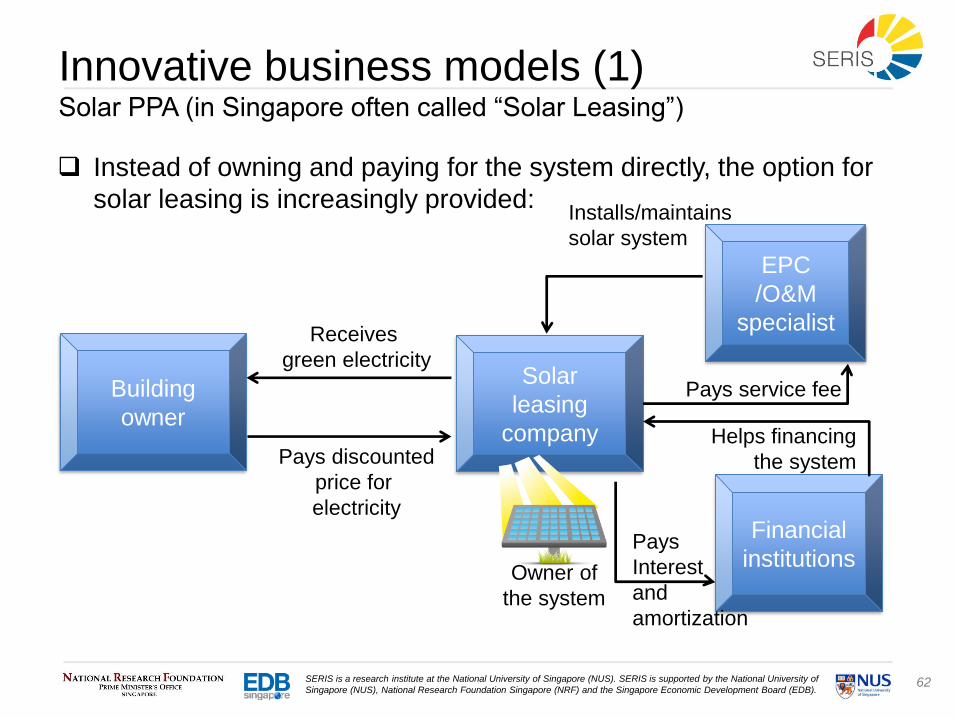
Innovative business models (1)Solar PPA (in Singapore often called “Solar Leasing”)
Instead of owning and paying for the system directly, the option for
solar leasing is increasingly provided:
Building
owner
Solar
leasing
company
EPC
/O&M
specialist
Financial
institutions
Receives
green electricity
Pays discounted
price for
electricity
Owner of
the system
Installs/maintains
solar system
Helps financing
the system
Pays
Interest
and
amortization
Pays service fee
63SERIS is a research institute at the National University of Singapore (NUS). SERIS is supported by the National University of
Singapore (NUS), National Research Foundation Singapore (NRF) and the Singapore Economic Development Board (EDB).
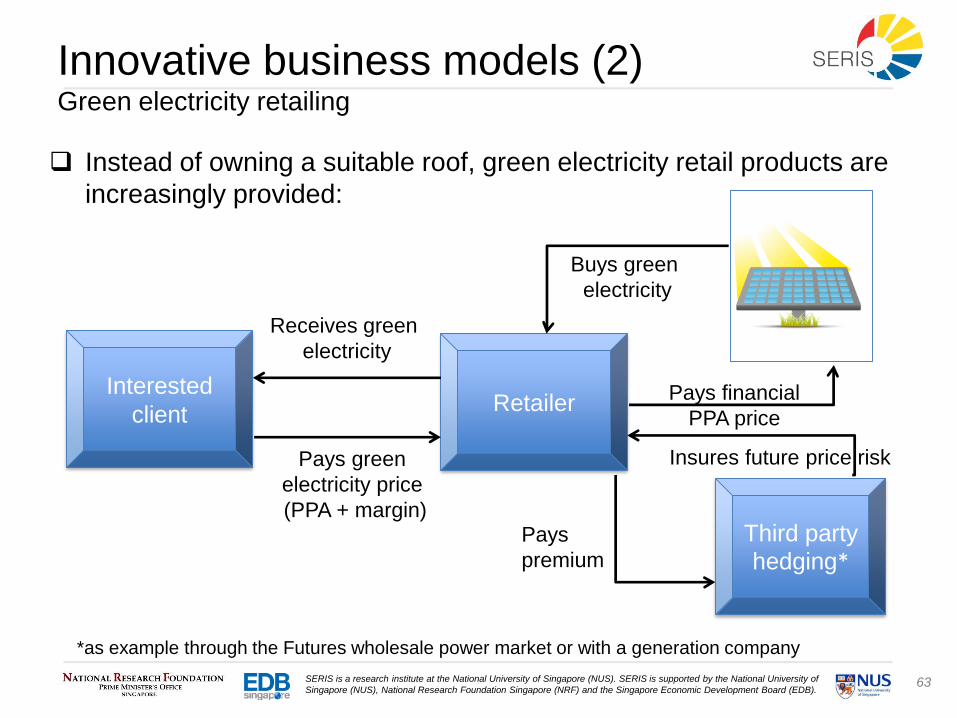
Innovative business models (2)Green electricity retailing
Instead of owning a suitable roof, green electricity retail products are
increasingly provided:
Interested
clientRetailer
Third party
hedging*
Receives green
electricity
Pays green
electricity price
(PPA + margin)
Buys green
electricity
Pays financial
PPA price
*as example through the Futures wholesale power market or with a generation company
Insures future price risk
Pays
premium
64SERIS is a research institute at the National University of Singapore (NUS). SERIS is supported by the National University of
Singapore (NUS), National Research Foundation Singapore (NRF) and the Singapore Economic Development Board (EDB).
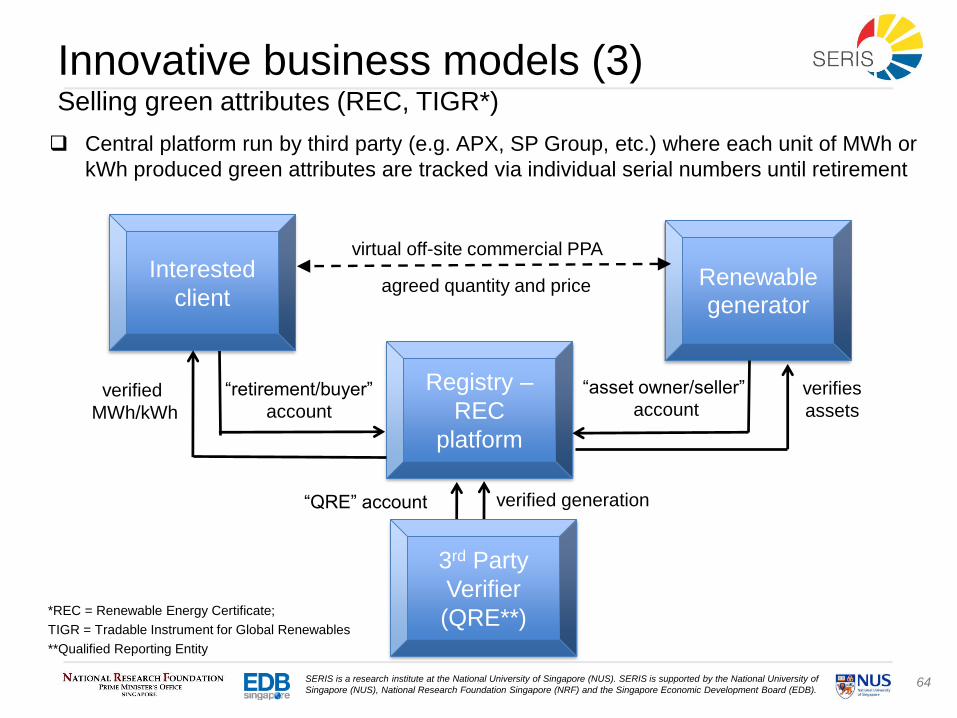
Innovative business models (3)Selling green attributes (REC, TIGR*)
Central platform run by third party (e.g. APX, SP Group, etc.) where each unit of MWh or
kWh produced green attributes are tracked via individual serial numbers until retirement
Interested
client
Registry –
REC
platform
Renewable
generator
virtual off-site commercial PPA
“retirement/buyer”
account
*REC = Renewable Energy Certificate;
TIGR = Tradable Instrument for Global Renewables
**Qualified Reporting Entity
agreed quantity and price
verifies
assets
3rd Party
Verifier
(QRE**)
“asset owner/seller”
accountverified
MWh/kWh
verified generation“QRE” account
65SERIS is a research institute at the National University of Singapore (NUS). SERIS is supported by the National University of
Singapore (NUS), National Research Foundation Singapore (NRF) and the Singapore Economic Development Board (EDB).
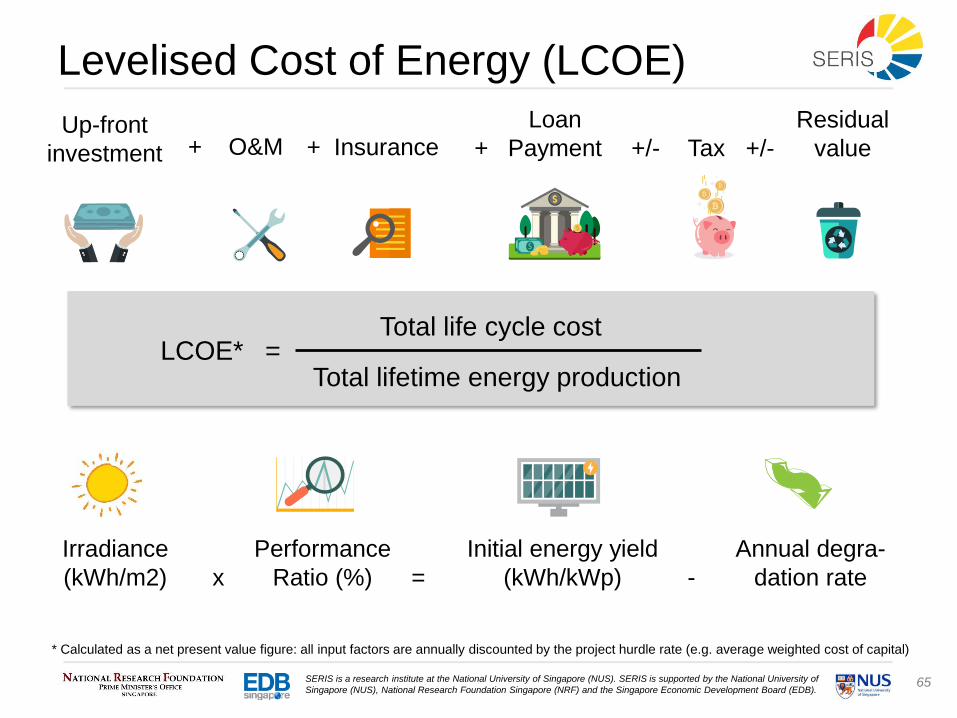
Levelised Cost of Energy (LCOE)
Total life cycle cost
Total lifetime energy productionLCOE* =
Up-front
investment
Irradiance
(kWh/m2) x
* Calculated as a net present value figure: all input factors are annually discounted by the project hurdle rate (e.g. average weighted cost of capital)
+ O&M +
Loan
Payment +/- Tax +/-
Residual
value+ Insurance
-
Annual degra-
dation rate
Initial energy yield
(kWh/kWp)
Performance
Ratio (%) =
66SERIS is a research institute at the National University of Singapore (NUS). SERIS is supported by the National University of
Singapore (NUS), National Research Foundation Singapore (NRF) and the Singapore Economic Development Board (EDB).
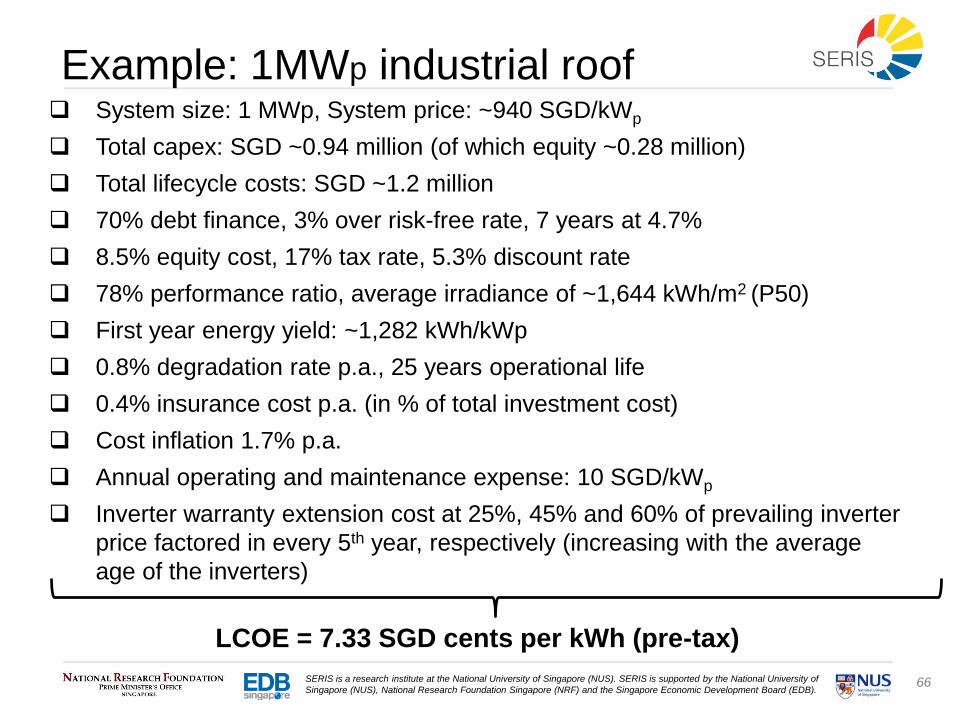
System size: 1 MWp, System price: ~940 SGD/kWp
Total capex: SGD ~0.94 million (of which equity ~0.28 million)
Total lifecycle costs: SGD ~1.2 million
70% debt finance, 3% over risk-free rate, 7 years at 4.7%
8.5% equity cost, 17% tax rate, 5.3% discount rate
78% performance ratio, average irradiance of ~1,644 kWh/m2 (P50)
First year energy yield: ~1,282 kWh/kWp
0.8% degradation rate p.a., 25 years operational life
0.4% insurance cost p.a. (in % of total investment cost)
Cost inflation 1.7% p.a.
Annual operating and maintenance expense: 10 SGD/kWp
Inverter warranty extension cost at 25%, 45% and 60% of prevailing inverter
price factored in every 5th year, respectively (increasing with the average
age of the inverters)
LCOE = 7.33 SGD cents per kWh (pre-tax)
Example: 1MWp industrial roof
67SERIS is a research institute at the National University of Singapore (NUS). SERIS is supported by the National University of
Singapore (NUS), National Research Foundation Singapore (NRF) and the Singapore Economic Development Board (EDB).
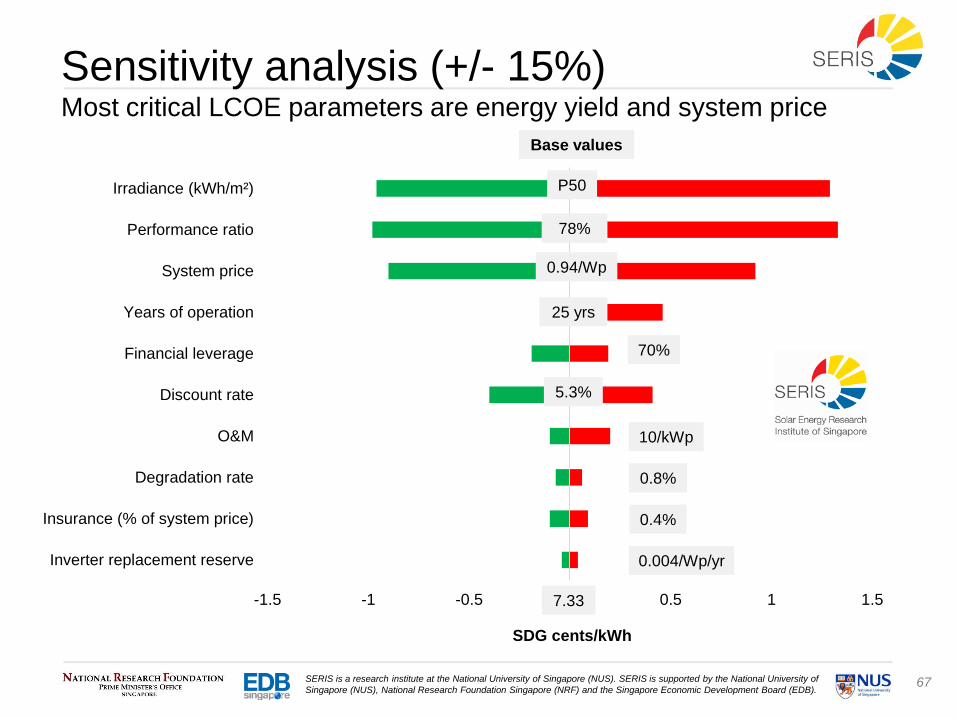
Sensitivity analysis (+/- 15%)Most critical LCOE parameters are energy yield and system price
-1.5 -1 -0.5 0 0.5 1 1.5
Irradiance (kWh/m²)
Performance ratio
System price
Years of operation
Financial leverage
Discount rate
O&M
Degradation rate
Insurance (% of system price)
Inverter replacement reserve
7.33
Base values
SDG cents/kWh
P50
78%
0.94/Wp
25 yrs
70%
5.3%
0.8%
0.4%
0.004/Wp/yr
10/kWp
68SERIS is a research institute at the National University of Singapore (NUS). SERIS is supported by the National University of
Singapore (NUS), National Research Foundation Singapore (NRF) and the Singapore Economic Development Board (EDB).
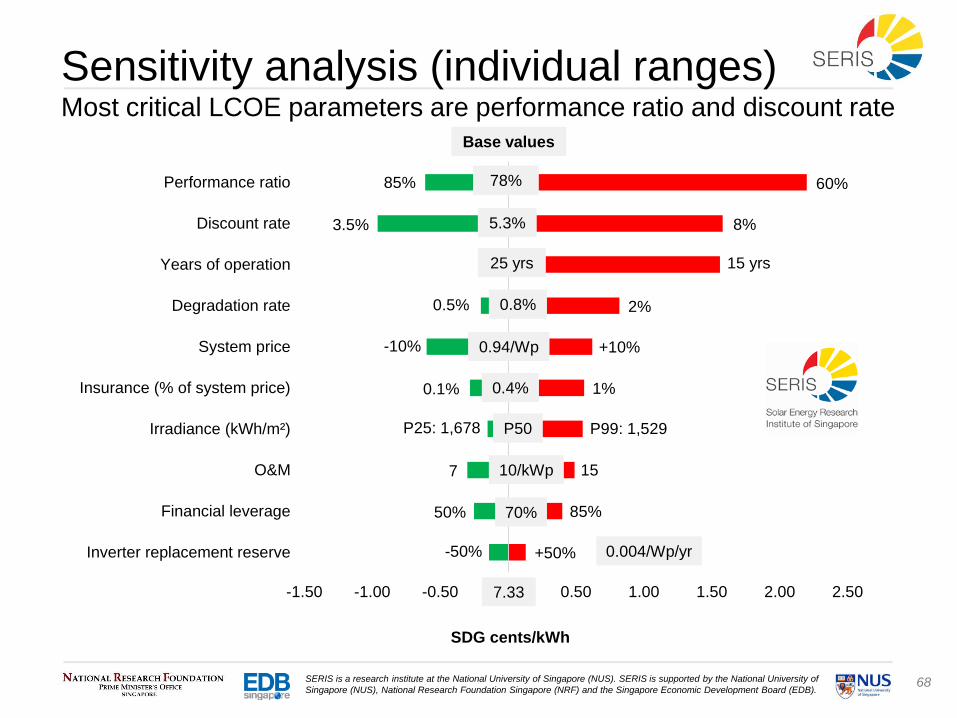
Sensitivity analysis (individual ranges)Most critical LCOE parameters are performance ratio and discount rate
-1.50 -1.00 -0.50 0.00 0.50 1.00 1.50 2.00 2.50
Performance ratio
Discount rate
Years of operation
Degradation rate
System price
Insurance (% of system price)
Irradiance (kWh/m²)
O&M
Financial leverage
Inverter replacement reserve
2%
SDG cents/kWh
Base values
7.33
P50
78%
0.94/Wp
25 yrs
70%
5.3%
0.8%
0.4%
0.004/Wp/yr
10/kWp
60%85%
3.5% 8%
-10%
0.5%
15 yrs
P25: 1,678
1%0.1%
+10%
157
P99: 1,529
85%
-50% +50%
50%
69SERIS is a research institute at the National University of Singapore (NUS). SERIS is supported by the National University of
Singapore (NUS), National Research Foundation Singapore (NRF) and the Singapore Economic Development Board (EDB).
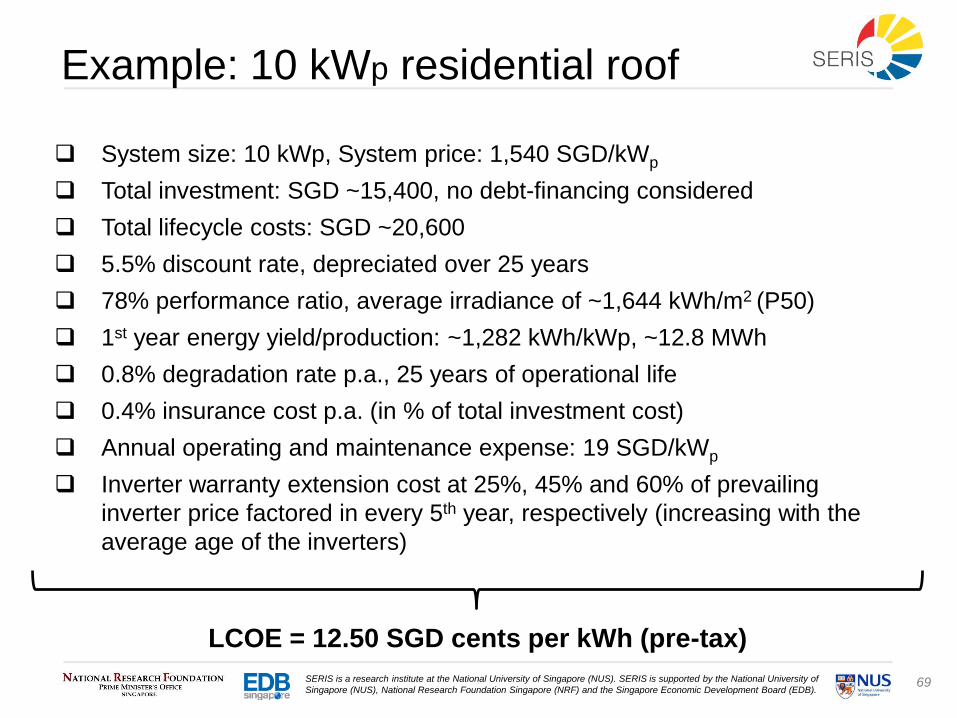
System size: 10 kWp, System price: 1,540 SGD/kWp
Total investment: SGD ~15,400, no debt-financing considered
Total lifecycle costs: SGD ~20,600
5.5% discount rate, depreciated over 25 years
78% performance ratio, average irradiance of ~1,644 kWh/m2 (P50)
1st year energy yield/production: ~1,282 kWh/kWp, ~12.8 MWh
0.8% degradation rate p.a., 25 years of operational life
0.4% insurance cost p.a. (in % of total investment cost)
Annual operating and maintenance expense: 19 SGD/kWp
Inverter warranty extension cost at 25%, 45% and 60% of prevailing
inverter price factored in every 5th year, respectively (increasing with the
average age of the inverters)
LCOE = 12.50 SGD cents per kWh (pre-tax)
Example: 10 kWp residential roof
70SERIS is a research institute at the National University of Singapore (NUS). SERIS is supported by the National University of
Singapore (NUS), National Research Foundation Singapore (NRF) and the Singapore Economic Development Board (EDB).
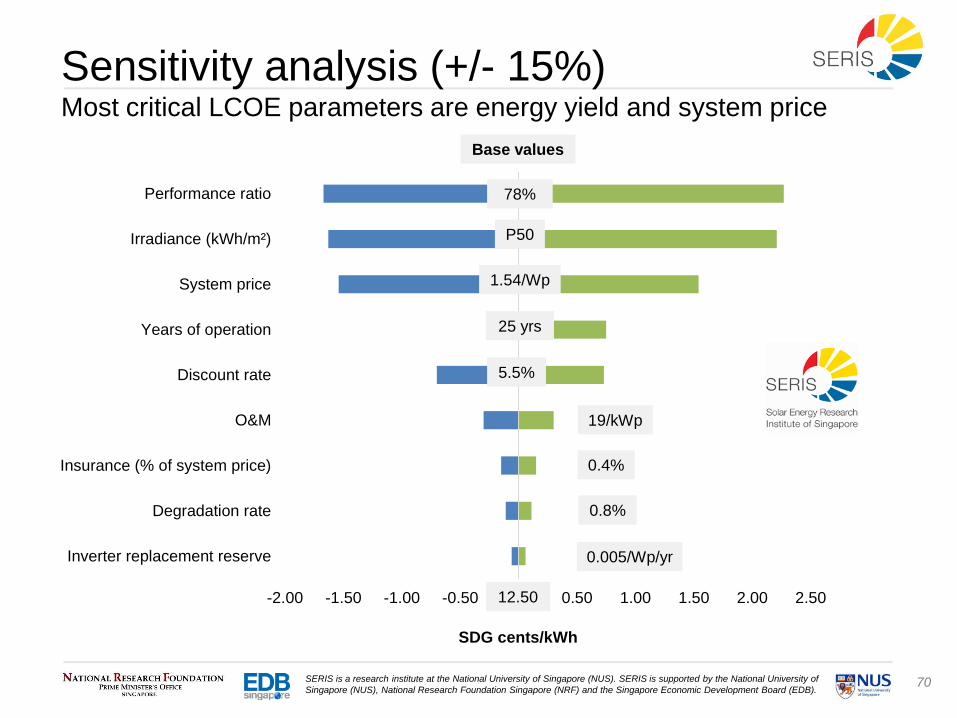
Sensitivity analysis (+/- 15%)Most critical LCOE parameters are energy yield and system price
-2.00 -1.50 -1.00 -0.50 0.00 0.50 1.00 1.50 2.00 2.50
Performance ratio
Irradiance (kWh/m²)
System price
Years of operation
Discount rate
O&M
Insurance (% of system price)
Degradation rate
Inverter replacement reserve
Base values
SDG cents/kWh
12.50
P50
78%
1.54/Wp
25 yrs
5.5%
0.8%
0.4%
0.005/Wp/yr
19/kWp

71SERIS is a research institute at the National University of Singapore (NUS). SERIS is supported by the National University of
Singapore (NUS), National Research Foundation Singapore (NRF) and the Singapore Economic Development Board (EDB).
Sensitivity analysis (individual ranges)Most critical LCOE parameters are performance ratio, durability and
discount rate
-2.00 -1.00 0.00 1.00 2.00 3.00 4.00
Performance ratio
Years of operation
Discount rate
Degradation rate
System price
Irradiance (kWh/m²)
Insurance (% of system price)
O&M
Inverter replacement reserve
Base values
SDG cents/kWh
12.50
P50
78%
1.54/Wp
25 yrs
5.5%
0.8%
0.4%
0.005/Wp/yr
19/kWp
60%85%
3.5% 8%
0.5%
15 yrs
-10%
P25: 1,678
1%0.1%
+10%
15 25
P99: 1,529
-50% +50%
2%

72SERIS is a research institute at the National University of Singapore (NUS). SERIS is supported by the National University of
Singapore (NUS), National Research Foundation Singapore (NRF) and the Singapore Economic Development Board (EDB).
Irradiance resource in Singapore (1) Exceedance probability risk assessment is important
Data source: National Environment Agency (NEA), monthly data from 1991-2000, 2010-2018, Changi
Met. Station (S24), irradiance resource varies among different locations in Singapore and between
different sensor technologies and level of maintenance. P-values shown are empirical figures
Example:
A P90 value of
~1,573 kWh/m2
means that there is a
90% likelihood that
the annual irradiance
resource will be
greater than 1,573
kWh/m2.
1500 1550 1600 1650 1700 1750 1800-0.1
0.0
0.1
0.2
0.3
0.4
0.5
0.6
0.7
0.8
0.9
1.0
1.1 Normal dist. CDF
P99: ~1,529 kWh/m2
P95: ~1,554 kWh/m2
P90: ~1,573 kWh/m2
P75: ~1,609 kWh/m2
Cum
ula
tive
dis
trib
utio
n f
un
ction
(CD
F)
Annual irradiance [kWh/m2]
P50: ~1,644 kWh/m2
Normal dist. P-values
NEA raw data
73SERIS is a research institute at the National University of Singapore (NUS). SERIS is supported by the National University of
Singapore (NUS), National Research Foundation Singapore (NRF) and the Singapore Economic Development Board (EDB).
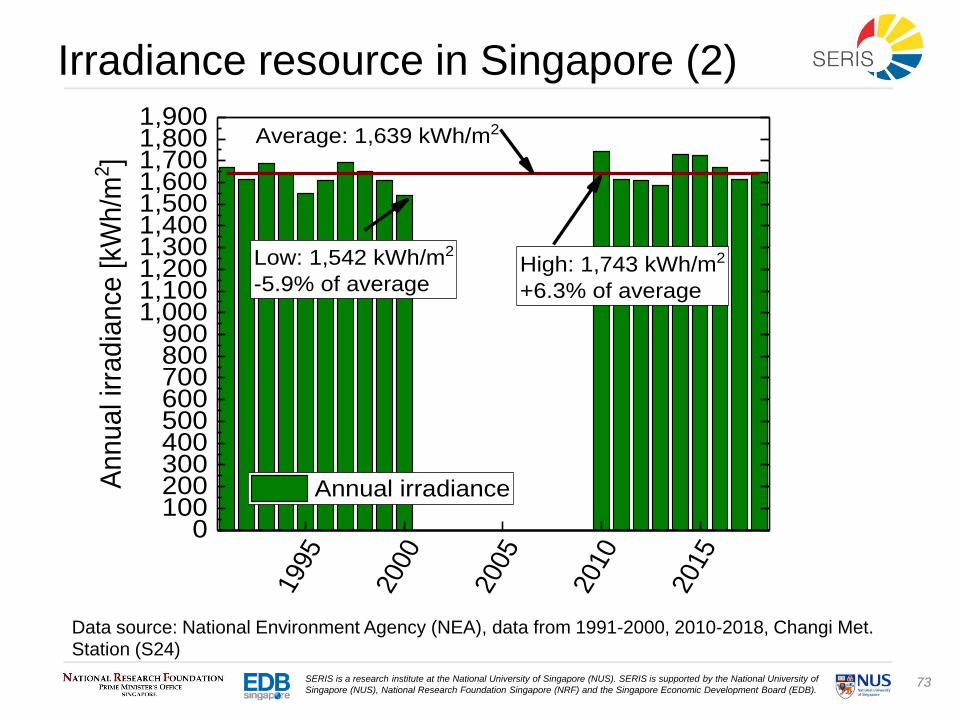
Irradiance resource in Singapore (2)
1995
2000
2005
2010
2015
0100200300400500600700800900
1,0001,1001,2001,3001,4001,5001,6001,7001,8001,900
High: 1,743 kWh/m2
+6.3% of average
Low: 1,542 kWh/m2
-5.9% of average
An
nu
al i
rra
dia
nce
[kW
h/m
2]
Annual irradiance
Average: 1,639 kWh/m2
Data source: National Environment Agency (NEA), data from 1991-2000, 2010-2018, Changi Met. Station (S24)
74SERIS is a research institute at the National University of Singapore (NUS). SERIS is supported by the National University of
Singapore (NUS), National Research Foundation Singapore (NRF) and the Singapore Economic Development Board (EDB).
5. Future electricity price scenarios
75SERIS is a research institute at the National University of Singapore (NUS). SERIS is supported by the National University of
Singapore (NUS), National Research Foundation Singapore (NRF) and the Singapore Economic Development Board (EDB).
0
5
10
15
20
25
30
35
1Q
09
2Q
09
3Q
09
4Q
09
1Q
10
2Q
10
3Q
10
4Q
10
1Q
11
2Q
11
3Q
11
4Q
11
1Q
12
2Q
12
3Q
12
4Q
12
1Q
13
2Q
13
3Q
13
4Q
13
1Q
14
2Q
14
3Q
14
4Q
14
1Q
15
2Q
15
3Q
15
4Q
15
1Q
16
2Q
16
3Q
16
4Q
16
1Q
17
2Q
17
3Q
17
4Q
17
1Q
18
2Q
18
3Q
18
4Q
18
1Q
19
2Q
19
3Q
19
4Q
19
SG
D c
en
ts/k
Wh
Rooftop PV LCOE range
Wholesale Price (USEP)
Contestable Average Rate
Electricity Tariff (residential)*
Vesting Price (piped gas)
Vesting Price (LNG)
Average OEM price (residential)
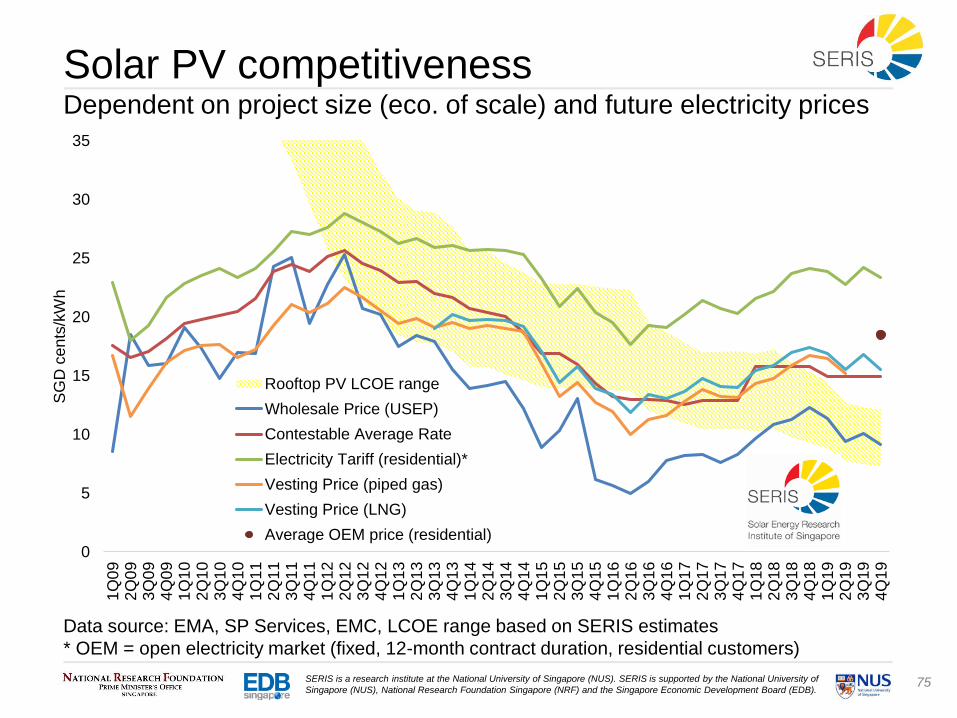
Solar PV competitivenessDependent on project size (eco. of scale) and future electricity prices
Data source: EMA, SP Services, EMC, LCOE range based on SERIS estimates
* OEM = open electricity market (fixed, 12-month contract duration, residential customers)
76SERIS is a research institute at the National University of Singapore (NUS). SERIS is supported by the National University of
Singapore (NUS), National Research Foundation Singapore (NRF) and the Singapore Economic Development Board (EDB).
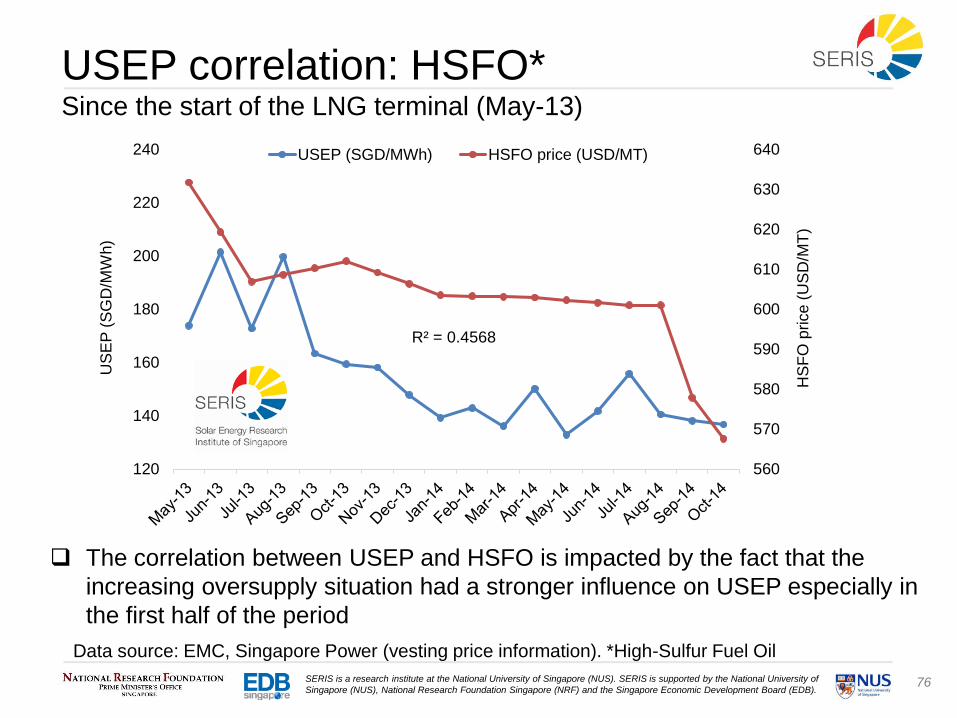
USEP correlation: HSFO*Since the start of the LNG terminal (May-13)
Data source: EMC, Singapore Power (vesting price information). *High-Sulfur Fuel Oil
The correlation between USEP and HSFO is impacted by the fact that the
increasing oversupply situation had a stronger influence on USEP especially in
the first half of the period
560
570
580
590
600
610
620
630
640
120
140
160
180
200
220
240
HS
FO
price
(U
SD
/MT
)
US
EP
(S
GD
/MW
h)
USEP (SGD/MWh) HSFO price (USD/MT)
R² = 0.4568
77SERIS is a research institute at the National University of Singapore (NUS). SERIS is supported by the National University of
Singapore (NUS), National Research Foundation Singapore (NRF) and the Singapore Economic Development Board (EDB).
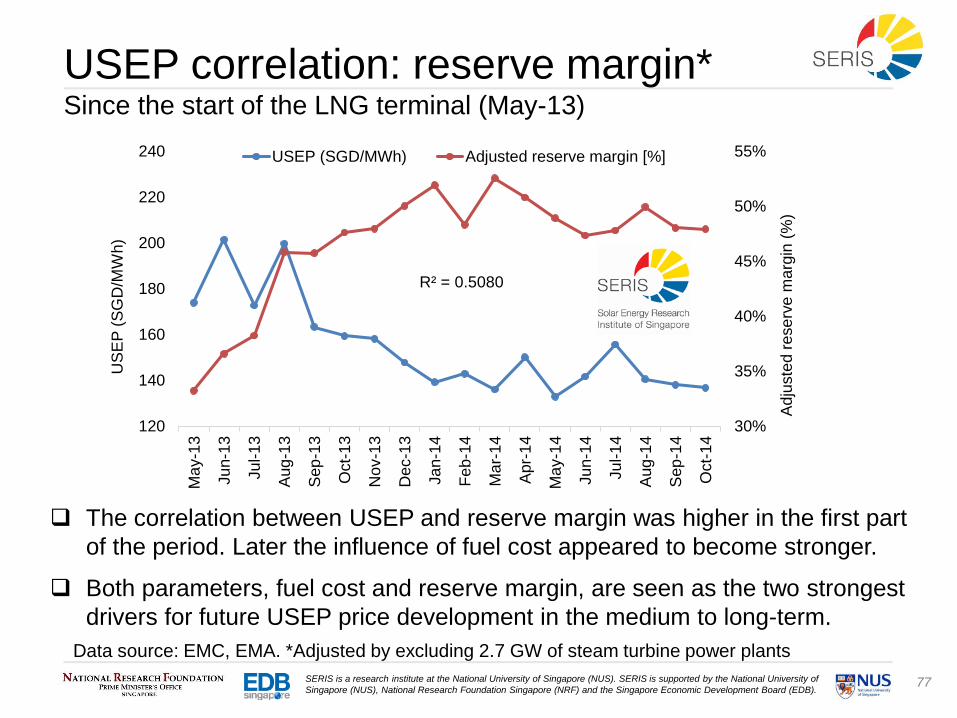
Data source: EMC, EMA. *Adjusted by excluding 2.7 GW of steam turbine power plants
USEP correlation: reserve margin*Since the start of the LNG terminal (May-13)
The correlation between USEP and reserve margin was higher in the first part
of the period. Later the influence of fuel cost appeared to become stronger.
Both parameters, fuel cost and reserve margin, are seen as the two strongest
drivers for future USEP price development in the medium to long-term.
R² = 0.5080
30%
35%
40%
45%
50%
55%
120
140
160
180
200
220
240
Ma
y-1
3
Ju
n-1
3
Ju
l-1
3
Aug
-13
Sep
-13
Oct-
13
Nov-1
3
Dec-1
3
Ja
n-1
4
Fe
b-1
4
Ma
r-14
Apr-
14
Ma
y-1
4
Ju
n-1
4
Ju
l-1
4
Aug
-14
Sep
-14
Oct-
14
Ad
juste
d r
ese
rve
ma
rgin
(%
)
US
EP
(S
GD
/MW
h)
USEP (SGD/MWh) Adjusted reserve margin [%]
78SERIS is a research institute at the National University of Singapore (NUS). SERIS is supported by the National University of
Singapore (NUS), National Research Foundation Singapore (NRF) and the Singapore Economic Development Board (EDB).
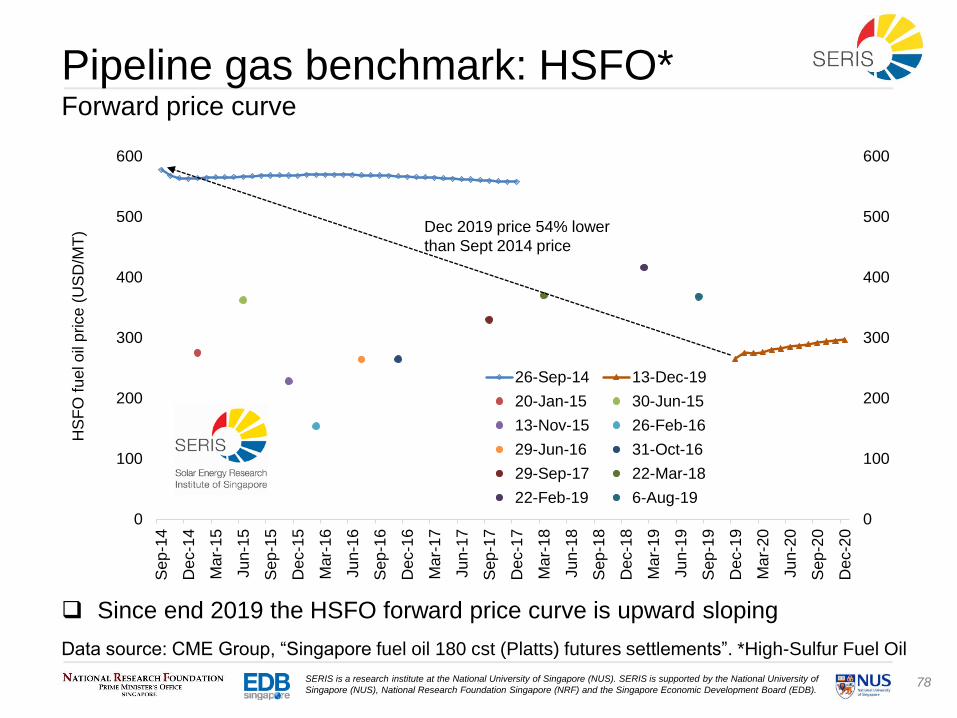
Pipeline gas benchmark: HSFO*Forward price curve
Data source: CME Group, “Singapore fuel oil 180 cst (Platts) futures settlements”. *High-Sulfur Fuel Oil
Since end 2019 the HSFO forward price curve is upward sloping
0
100
200
300
400
500
600
0
100
200
300
400
500
600S
ep
-14
Dec-1
4
Ma
r-15
Ju
n-1
5
Sep
-15
Dec-1
5
Ma
r-16
Ju
n-1
6
Sep
-16
Dec-1
6
Ma
r-17
Ju
n-1
7
Sep
-17
Dec-1
7
Ma
r-18
Ju
n-1
8
Sep
-18
Dec-1
8
Ma
r-19
Ju
n-1
9
Sep
-19
Dec-1
9
Ma
r-20
Ju
n-2
0
Sep
-20
Dec-2
0
HS
FO
fu
el o
il p
rice
(U
SD
/MT
)
26-Sep-14 13-Dec-19
20-Jan-15 30-Jun-15
13-Nov-15 26-Feb-16
29-Jun-16 31-Oct-16
29-Sep-17 22-Mar-18
22-Feb-19 6-Aug-19
Dec 2019 price 54% lower
than Sept 2014 price
79SERIS is a research institute at the National University of Singapore (NUS). SERIS is supported by the National University of
Singapore (NUS), National Research Foundation Singapore (NRF) and the Singapore Economic Development Board (EDB).
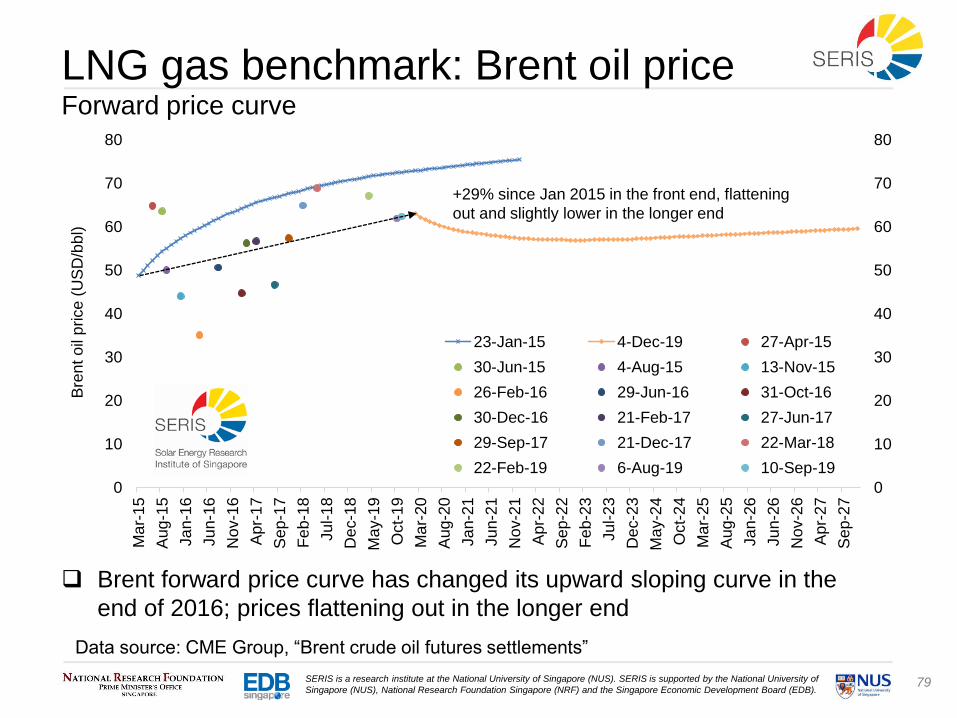
LNG gas benchmark: Brent oil priceForward price curve
Data source: CME Group, “Brent crude oil futures settlements”
Brent forward price curve has changed its upward sloping curve in the
end of 2016; prices flattening out in the longer end
0
10
20
30
40
50
60
70
80
0
10
20
30
40
50
60
70
80M
ar-
15
Aug
-15
Ja
n-1
6
Ju
n-1
6
Nov-1
6
Apr-
17
Sep
-17
Fe
b-1
8
Ju
l-1
8
Dec-1
8
Ma
y-1
9
Oct-
19
Ma
r-20
Aug
-20
Ja
n-2
1
Ju
n-2
1
Nov-2
1
Apr-
22
Sep
-22
Fe
b-2
3
Ju
l-2
3
Dec-2
3
Ma
y-2
4
Oct-
24
Ma
r-25
Aug
-25
Ja
n-2
6
Ju
n-2
6
Nov-2
6
Apr-
27
Sep
-27
Bre
nt o
il p
rice
(U
SD
/bb
l)
23-Jan-15 4-Dec-19 27-Apr-15
30-Jun-15 4-Aug-15 13-Nov-15
26-Feb-16 29-Jun-16 31-Oct-16
30-Dec-16 21-Feb-17 27-Jun-17
29-Sep-17 21-Dec-17 22-Mar-18
22-Feb-19 6-Aug-19 10-Sep-19
+29% since Jan 2015 in the front end, flattening
out and slightly lower in the longer end
80SERIS is a research institute at the National University of Singapore (NUS). SERIS is supported by the National University of
Singapore (NUS), National Research Foundation Singapore (NRF) and the Singapore Economic Development Board (EDB).
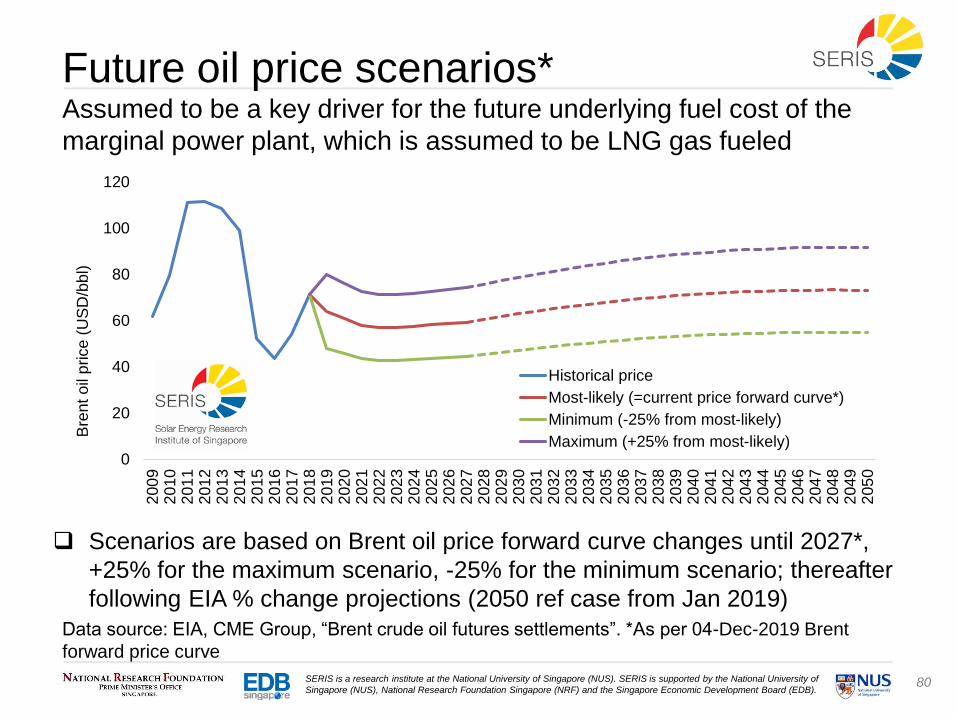
0
20
40
60
80
100
120
200
92
01
02
01
12
01
22
01
32
01
42
01
52
01
62
01
72
01
82
01
92
02
02
02
12
02
22
02
32
02
42
02
52
02
62
02
72
02
82
02
92
03
02
03
12
03
22
03
32
03
42
03
52
03
62
03
72
03
82
03
92
04
02
04
12
04
22
04
32
04
42
04
52
04
62
04
72
04
82
04
92
05
0
Bre
nt o
il p
rice
(U
SD
/bb
l)
Historical price
Most-likely (=current price forward curve*)
Minimum (-25% from most-likely)
Maximum (+25% from most-likely)
Scenarios are based on Brent oil price forward curve changes until 2027*,
+25% for the maximum scenario, -25% for the minimum scenario; thereafter
following EIA % change projections (2050 ref case from Jan 2019)
Future oil price scenarios*Assumed to be a key driver for the future underlying fuel cost of the
marginal power plant, which is assumed to be LNG gas fueled
Data source: EIA, CME Group, “Brent crude oil futures settlements”. *As per 04-Dec-2019 Brent
forward price curve
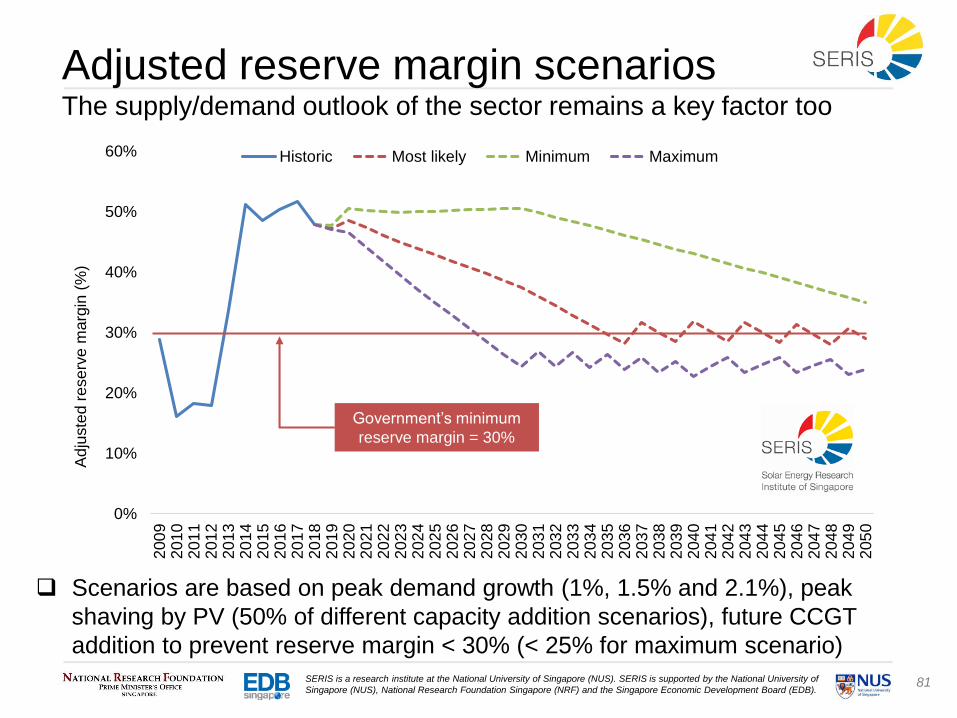
81SERIS is a research institute at the National University of Singapore (NUS). SERIS is supported by the National University of
Singapore (NUS), National Research Foundation Singapore (NRF) and the Singapore Economic Development Board (EDB).
0%
10%
20%
30%
40%
50%
60%2
00
92
01
02
01
12
01
22
01
32
01
42
01
52
01
62
01
72
01
82
01
92
02
02
02
12
02
22
02
32
02
42
02
52
02
62
02
72
02
82
02
92
03
02
03
12
03
22
03
32
03
42
03
52
03
62
03
72
03
82
03
92
04
02
04
12
04
22
04
32
04
42
04
52
04
62
04
72
04
82
04
92
05
0
Ad
juste
d r
ese
rve
ma
rgin
(%
)
Historic Most likely Minimum Maximum
Adjusted reserve margin scenariosThe supply/demand outlook of the sector remains a key factor too
Scenarios are based on peak demand growth (1%, 1.5% and 2.1%), peak
shaving by PV (50% of different capacity addition scenarios), future CCGT
addition to prevent reserve margin < 30% (< 25% for maximum scenario)
Government’s minimum
reserve margin = 30%
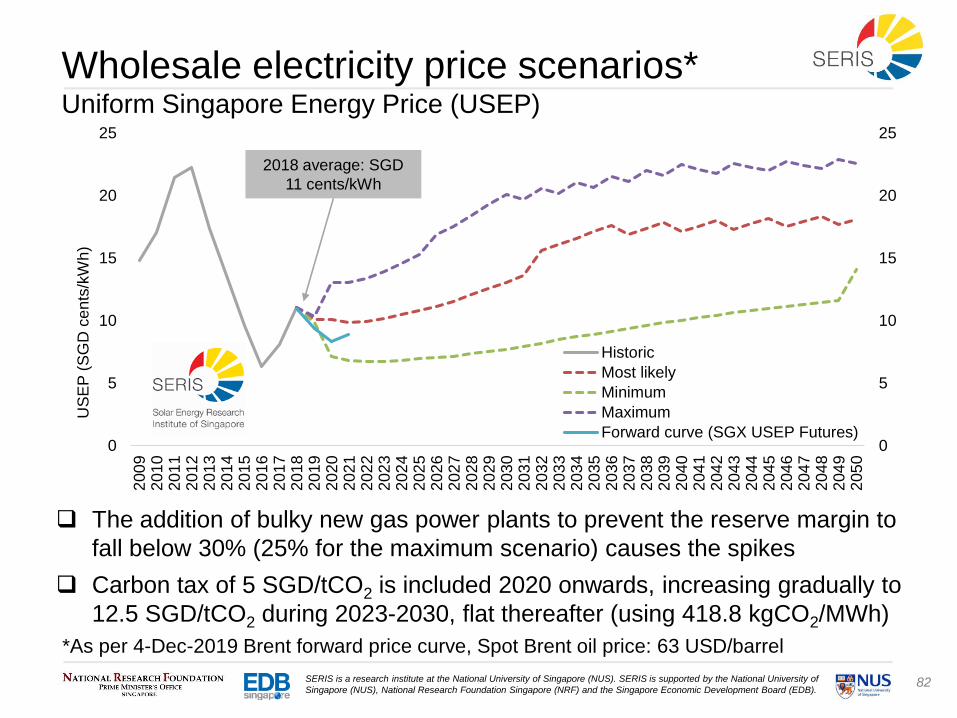
82SERIS is a research institute at the National University of Singapore (NUS). SERIS is supported by the National University of
Singapore (NUS), National Research Foundation Singapore (NRF) and the Singapore Economic Development Board (EDB).
0
5
10
15
20
25
0
5
10
15
20
252
00
92
01
02
01
12
01
22
01
32
01
42
01
52
01
62
01
72
01
82
01
92
02
02
02
12
02
22
02
32
02
42
02
52
02
62
02
72
02
82
02
92
03
02
03
12
03
22
03
32
03
42
03
52
03
62
03
72
03
82
03
92
04
02
04
12
04
22
04
32
04
42
04
52
04
62
04
72
04
82
04
92
05
0
US
EP
(S
GD
ce
nts
/kW
h)
Historic
Most likely
Minimum
Maximum
Forward curve (SGX USEP Futures)
Wholesale electricity price scenarios*Uniform Singapore Energy Price (USEP)
The addition of bulky new gas power plants to prevent the reserve margin to
fall below 30% (25% for the maximum scenario) causes the spikes
Carbon tax of 5 SGD/tCO2 is included 2020 onwards, increasing gradually to
12.5 SGD/tCO2 during 2023-2030, flat thereafter (using 418.8 kgCO2/MWh)
*As per 4-Dec-2019 Brent forward price curve, Spot Brent oil price: 63 USD/barrel
2018 average: SGD
11 cents/kWh
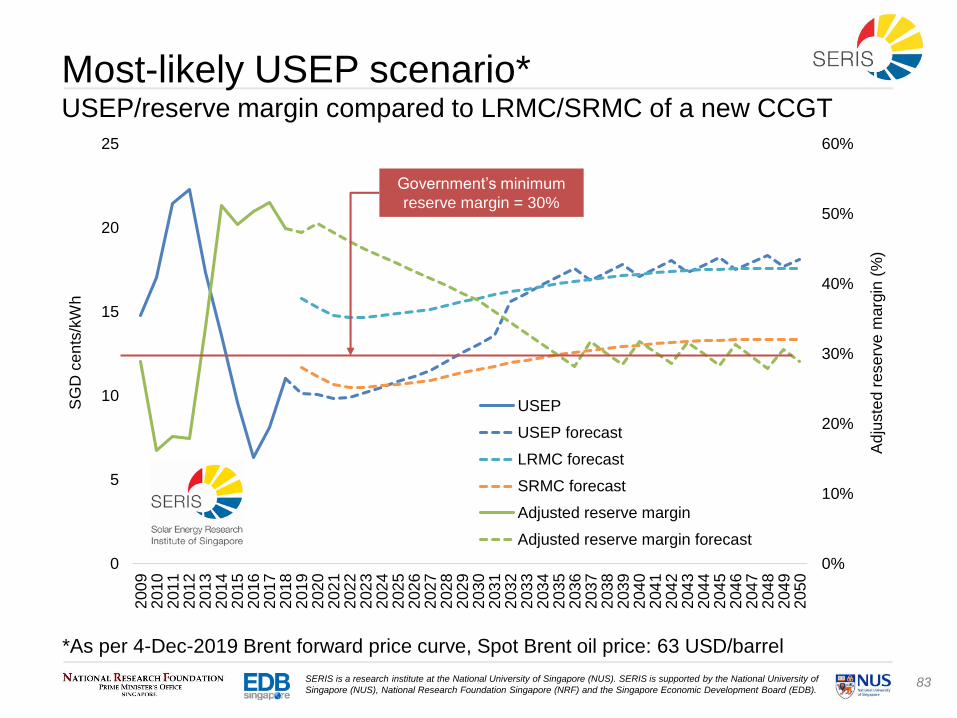
83SERIS is a research institute at the National University of Singapore (NUS). SERIS is supported by the National University of
Singapore (NUS), National Research Foundation Singapore (NRF) and the Singapore Economic Development Board (EDB).
0%
10%
20%
30%
40%
50%
60%
0
5
10
15
20
252
00
92
01
02
01
12
01
22
01
32
01
42
01
52
01
62
01
72
01
82
01
92
02
02
02
12
02
22
02
32
02
42
02
52
02
62
02
72
02
82
02
92
03
02
03
12
03
22
03
32
03
42
03
52
03
62
03
72
03
82
03
92
04
02
04
12
04
22
04
32
04
42
04
52
04
62
04
72
04
82
04
92
05
0
Ad
juste
d r
ese
rve
ma
rgin
(%
)
SG
D c
en
ts/k
Wh
USEP
USEP forecast
LRMC forecast
SRMC forecast
Adjusted reserve margin
Adjusted reserve margin forecast
Most-likely USEP scenario*USEP/reserve margin compared to LRMC/SRMC of a new CCGT
*As per 4-Dec-2019 Brent forward price curve, Spot Brent oil price: 63 USD/barrel
Government’s minimum
reserve margin = 30%
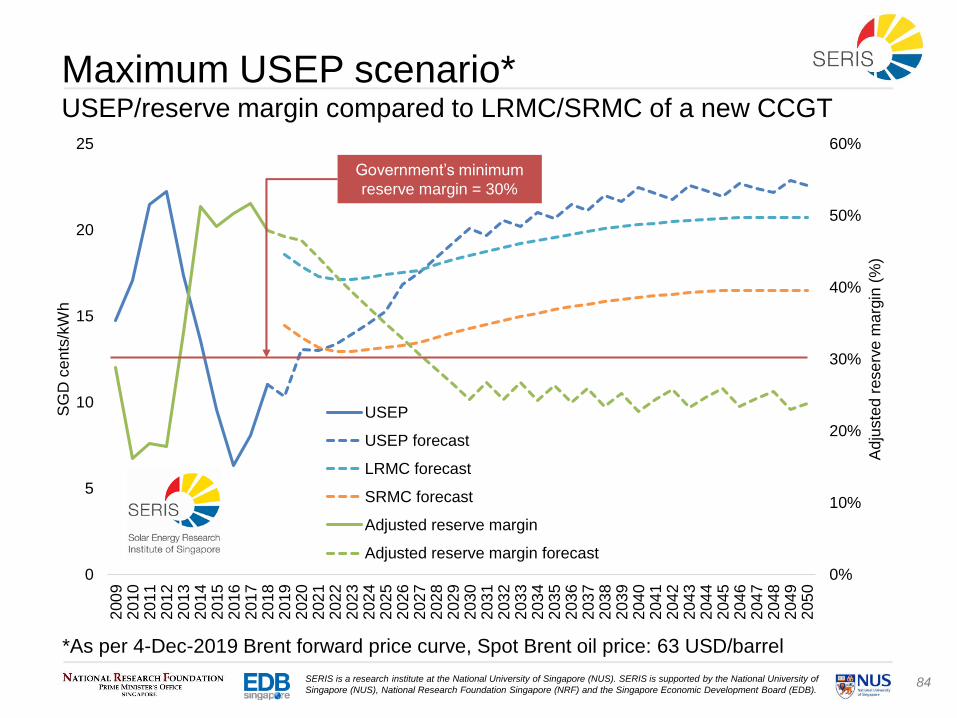
84SERIS is a research institute at the National University of Singapore (NUS). SERIS is supported by the National University of
Singapore (NUS), National Research Foundation Singapore (NRF) and the Singapore Economic Development Board (EDB).
Maximum USEP scenario*USEP/reserve margin compared to LRMC/SRMC of a new CCGT
0%
10%
20%
30%
40%
50%
60%
0
5
10
15
20
25
200
92
01
02
01
12
01
22
01
32
01
42
01
52
01
62
01
72
01
82
01
92
02
02
02
12
02
22
02
32
02
42
02
52
02
62
02
72
02
82
02
92
03
02
03
12
03
22
03
32
03
42
03
52
03
62
03
72
03
82
03
92
04
02
04
12
04
22
04
32
04
42
04
52
04
62
04
72
04
82
04
92
05
0
Ad
juste
d r
ese
rve
ma
rgin
(%
)
SG
D c
en
ts/k
Wh
USEP
USEP forecast
LRMC forecast
SRMC forecast
Adjusted reserve margin
Adjusted reserve margin forecast
Government’s minimum
reserve margin = 30%
*As per 4-Dec-2019 Brent forward price curve, Spot Brent oil price: 63 USD/barrel
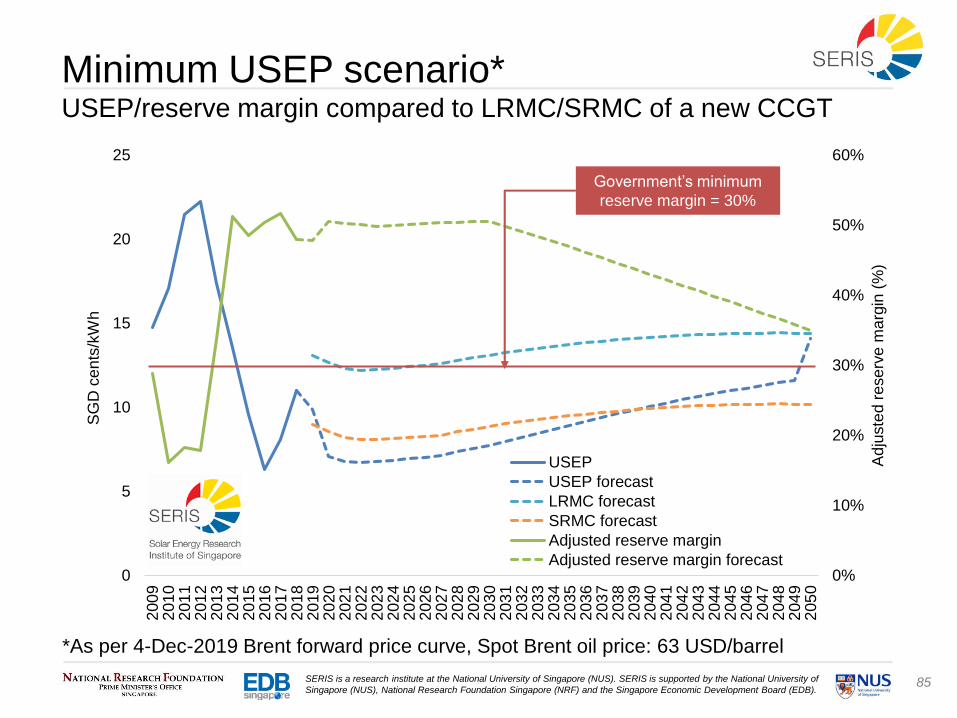
85SERIS is a research institute at the National University of Singapore (NUS). SERIS is supported by the National University of
Singapore (NUS), National Research Foundation Singapore (NRF) and the Singapore Economic Development Board (EDB).
Minimum USEP scenario*USEP/reserve margin compared to LRMC/SRMC of a new CCGT
*As per 4-Dec-2019 Brent forward price curve, Spot Brent oil price: 63 USD/barrel
0%
10%
20%
30%
40%
50%
60%
0
5
10
15
20
252
00
92
01
02
01
12
01
22
01
32
01
42
01
52
01
62
01
72
01
82
01
92
02
02
02
12
02
22
02
32
02
42
02
52
02
62
02
72
02
82
02
92
03
02
03
12
03
22
03
32
03
42
03
52
03
62
03
72
03
82
03
92
04
02
04
12
04
22
04
32
04
42
04
52
04
62
04
72
04
82
04
92
05
0
Ad
juste
d r
ese
rve
ma
rgin
(%
)
SG
D c
en
ts/k
Wh
USEP
USEP forecast
LRMC forecast
SRMC forecast
Adjusted reserve margin
Adjusted reserve margin forecast
Government’s minimum
reserve margin = 30%
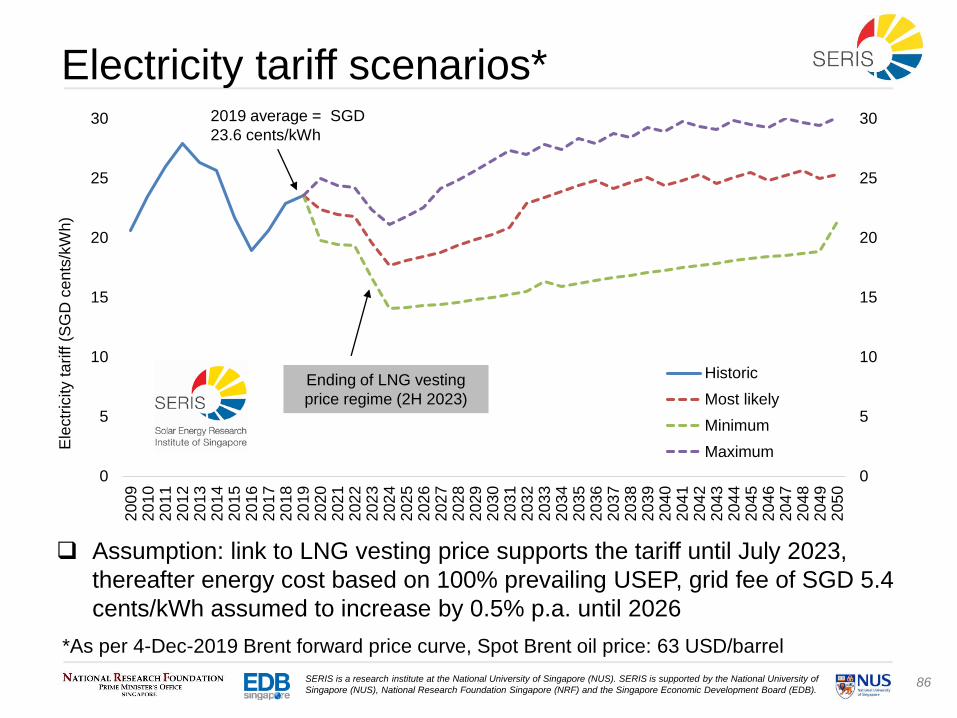
86SERIS is a research institute at the National University of Singapore (NUS). SERIS is supported by the National University of
Singapore (NUS), National Research Foundation Singapore (NRF) and the Singapore Economic Development Board (EDB).
Electricity tariff scenarios*
Assumption: link to LNG vesting price supports the tariff until July 2023,
thereafter energy cost based on 100% prevailing USEP, grid fee of SGD 5.4
cents/kWh assumed to increase by 0.5% p.a. until 2026
*As per 4-Dec-2019 Brent forward price curve, Spot Brent oil price: 63 USD/barrel
0
5
10
15
20
25
30
0
5
10
15
20
25
302
00
92
01
02
01
12
01
22
01
32
01
42
01
52
01
62
01
72
01
82
01
92
02
02
02
12
02
22
02
32
02
42
02
52
02
62
02
72
02
82
02
92
03
02
03
12
03
22
03
32
03
42
03
52
03
62
03
72
03
82
03
92
04
02
04
12
04
22
04
32
04
42
04
52
04
62
04
72
04
82
04
92
05
0
Ele
ctr
icity t
ariff
(S
GD
ce
nts
/kW
h)
Historic
Most likely
Minimum
Maximum
Ending of LNG vesting
price regime (2H 2023)
2019 average = SGD
23.6 cents/kWh
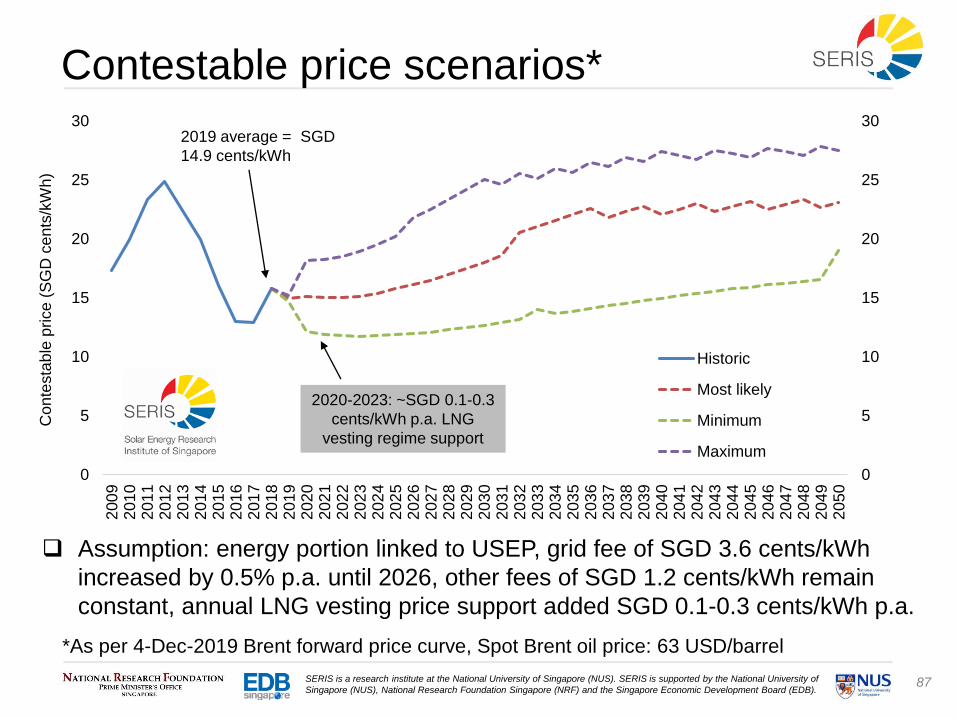
87SERIS is a research institute at the National University of Singapore (NUS). SERIS is supported by the National University of
Singapore (NUS), National Research Foundation Singapore (NRF) and the Singapore Economic Development Board (EDB).
Contestable price scenarios*
Assumption: energy portion linked to USEP, grid fee of SGD 3.6 cents/kWh
increased by 0.5% p.a. until 2026, other fees of SGD 1.2 cents/kWh remain
constant, annual LNG vesting price support added SGD 0.1-0.3 cents/kWh p.a.
*As per 4-Dec-2019 Brent forward price curve, Spot Brent oil price: 63 USD/barrel
0
5
10
15
20
25
30
0
5
10
15
20
25
302
00
92
01
02
01
12
01
22
01
32
01
42
01
52
01
62
01
72
01
82
01
92
02
02
02
12
02
22
02
32
02
42
02
52
02
62
02
72
02
82
02
92
03
02
03
12
03
22
03
32
03
42
03
52
03
62
03
72
03
82
03
92
04
02
04
12
04
22
04
32
04
42
04
52
04
62
04
72
04
82
04
92
05
0
Con
testa
ble
price
(S
GD
ce
nts
/kW
h)
Historic
Most likely
Minimum
Maximum
2020-2023: ~SGD 0.1-0.3
cents/kWh p.a. LNG
vesting regime support
2019 average = SGD
14.9 cents/kWh
88SERIS is a research institute at the National University of Singapore (NUS). SERIS is supported by the National University of
Singapore (NUS), National Research Foundation Singapore (NRF) and the Singapore Economic Development Board (EDB).
6. Grid parity and economic viability analysis
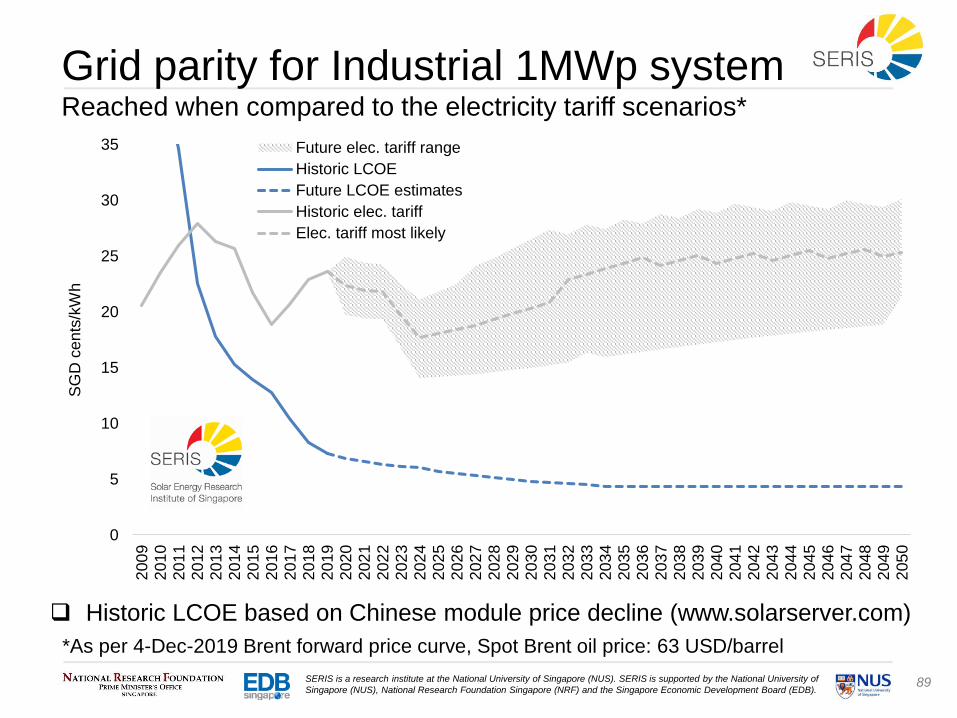
89SERIS is a research institute at the National University of Singapore (NUS). SERIS is supported by the National University of
Singapore (NUS), National Research Foundation Singapore (NRF) and the Singapore Economic Development Board (EDB).
Grid parity for Industrial 1MWp systemReached when compared to the electricity tariff scenarios*
Historic LCOE based on Chinese module price decline (www.solarserver.com)
0
5
10
15
20
25
30
352
00
92
01
02
01
12
01
22
01
32
01
42
01
52
01
62
01
72
01
82
01
92
02
02
02
12
02
22
02
32
02
42
02
52
02
62
02
72
02
82
02
92
03
02
03
12
03
22
03
32
03
42
03
52
03
62
03
72
03
82
03
92
04
02
04
12
04
22
04
32
04
42
04
52
04
62
04
72
04
82
04
92
05
0
SG
D c
en
ts/k
Wh
Future elec. tariff range
Historic LCOE
Future LCOE estimates
Historic elec. tariff
Elec. tariff most likely
*As per 4-Dec-2019 Brent forward price curve, Spot Brent oil price: 63 USD/barrel

90SERIS is a research institute at the National University of Singapore (NUS). SERIS is supported by the National University of
Singapore (NUS), National Research Foundation Singapore (NRF) and the Singapore Economic Development Board (EDB).
Grid parity for Industrial 1MWp systemReached when compared to average contestable price scenarios*
*As per 4-Dec-2019 Brent forward price curve, Spot Brent oil price: 63 USD/barrel
Historic LCOE based on Chinese module price decline (www.solarserver.com)
0
5
10
15
20
25
30
352
00
9
201
0
201
1
201
2
201
3
201
4
201
5
201
6
201
7
201
8
201
9
202
0
202
1
202
2
202
3
202
4
202
5
202
6
202
7
202
8
202
9
203
0
203
1
203
2
203
3
203
4
203
5
203
6
203
7
203
8
203
9
204
0
204
1
204
2
204
3
204
4
204
5
204
6
204
7
204
8
204
9
205
0
SG
D c
en
ts/k
Wh
Future cont. price range
Historic LCOE
Future LCOE estimates
Historic contestable price
Cont. price most likely

91SERIS is a research institute at the National University of Singapore (NUS). SERIS is supported by the National University of
Singapore (NUS), National Research Foundation Singapore (NRF) and the Singapore Economic Development Board (EDB).
Grid parity for Industrial 1MWp systemReached when compared to the LRMC of an new gas-fired CCGT*
Historic LCOE based on Chinese module price decline (www.solarserver.com)
*As per 4-Dec-2019 Brent forward price curve, Spot Brent oil price: 63 USD/barrel
**Long-run marginal cost (LRMC), combined cycle gas turbine (CCGT), historic based until
2013 on allocated vesting prices, 2014 onwards on LNG vesting price
0
5
10
15
20
25
30
352
00
92
01
02
01
12
01
22
01
32
01
42
01
52
01
62
01
72
01
82
01
92
02
02
02
12
02
22
02
32
02
42
02
52
02
62
02
72
02
82
02
92
03
02
03
12
03
22
03
32
03
42
03
52
03
62
03
72
03
82
03
92
04
02
04
12
04
22
04
32
04
42
04
52
04
62
04
72
04
82
04
92
05
0
SG
D c
en
ts/k
Wh
Future LRMC range
Historic LCOE
Future LCOE estimates
Historic LRMC **
LRMC most likely
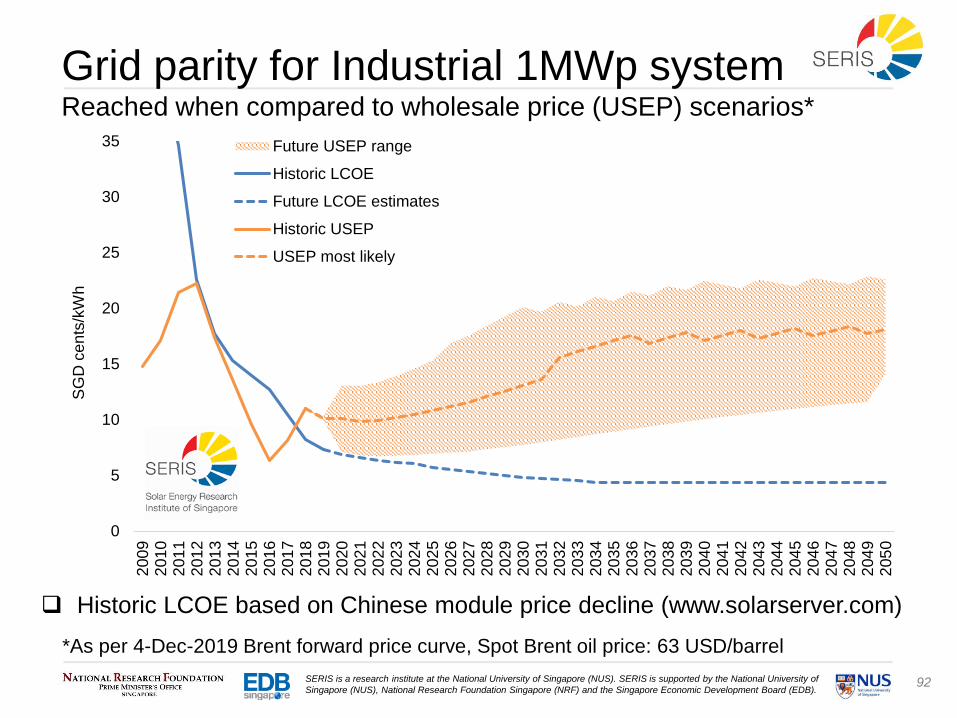
92SERIS is a research institute at the National University of Singapore (NUS). SERIS is supported by the National University of
Singapore (NUS), National Research Foundation Singapore (NRF) and the Singapore Economic Development Board (EDB).
Grid parity for Industrial 1MWp systemReached when compared to wholesale price (USEP) scenarios*
Historic LCOE based on Chinese module price decline (www.solarserver.com)
*As per 4-Dec-2019 Brent forward price curve, Spot Brent oil price: 63 USD/barrel
0
5
10
15
20
25
30
352
00
92
01
02
01
12
01
22
01
32
01
42
01
52
01
62
01
72
01
82
01
92
02
02
02
12
02
22
02
32
02
42
02
52
02
62
02
72
02
82
02
92
03
02
03
12
03
22
03
32
03
42
03
52
03
62
03
72
03
82
03
92
04
02
04
12
04
22
04
32
04
42
04
52
04
62
04
72
04
82
04
92
05
0
SG
D c
en
ts/k
Wh
Future USEP range
Historic LCOE
Future LCOE estimates
Historic USEP
USEP most likely
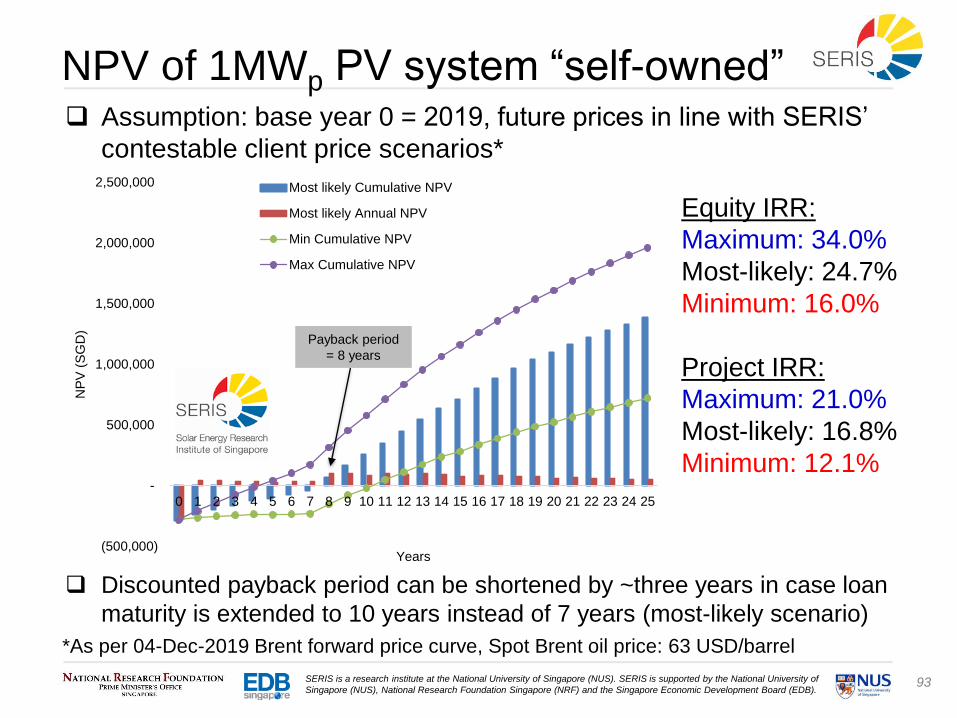
93SERIS is a research institute at the National University of Singapore (NUS). SERIS is supported by the National University of
Singapore (NUS), National Research Foundation Singapore (NRF) and the Singapore Economic Development Board (EDB).
(500,000)
-
500,000
1,000,000
1,500,000
2,000,000
2,500,000
0 1 2 3 4 5 6 7 8 9 10 11 12 13 14 15 16 17 18 19 20 21 22 23 24 25
NP
V (
SG
D)
Years
Most likely Cumulative NPV
Most likely Annual NPV
Min Cumulative NPV
Max Cumulative NPV
NPV of 1MWp PV system “self-owned” Assumption: base year 0 = 2019, future prices in line with SERIS’
contestable client price scenarios*
Equity IRR:
Maximum: 34.0%
Most-likely: 24.7%
Minimum: 16.0%
Project IRR:
Maximum: 21.0%
Most-likely: 16.8%
Minimum: 12.1%
Discounted payback period can be shortened by ~three years in case loan
maturity is extended to 10 years instead of 7 years (most-likely scenario)
*As per 04-Dec-2019 Brent forward price curve, Spot Brent oil price: 63 USD/barrel
Payback period
= 8 years
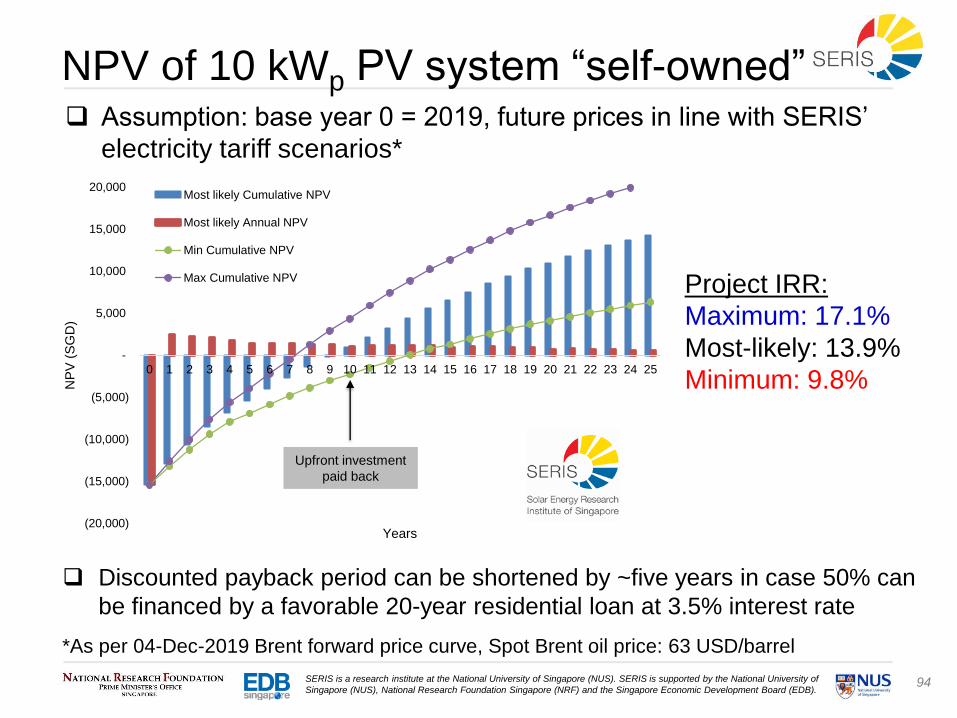
94SERIS is a research institute at the National University of Singapore (NUS). SERIS is supported by the National University of
Singapore (NUS), National Research Foundation Singapore (NRF) and the Singapore Economic Development Board (EDB).
(20,000)
(15,000)
(10,000)
(5,000)
-
5,000
10,000
15,000
20,000
0 1 2 3 4 5 6 7 8 9 10 11 12 13 14 15 16 17 18 19 20 21 22 23 24 25
NP
V (
SG
D)
Years
Most likely Cumulative NPV
Most likely Annual NPV
Min Cumulative NPV
Max Cumulative NPV
NPV of 10 kWp PV system “self-owned” Assumption: base year 0 = 2019, future prices in line with SERIS’
electricity tariff scenarios*
Project IRR:
Maximum: 17.1%
Most-likely: 13.9%
Minimum: 9.8%
Discounted payback period can be shortened by ~five years in case 50% can
be financed by a favorable 20-year residential loan at 3.5% interest rate
*As per 04-Dec-2019 Brent forward price curve, Spot Brent oil price: 63 USD/barrel
Upfront investment
paid back
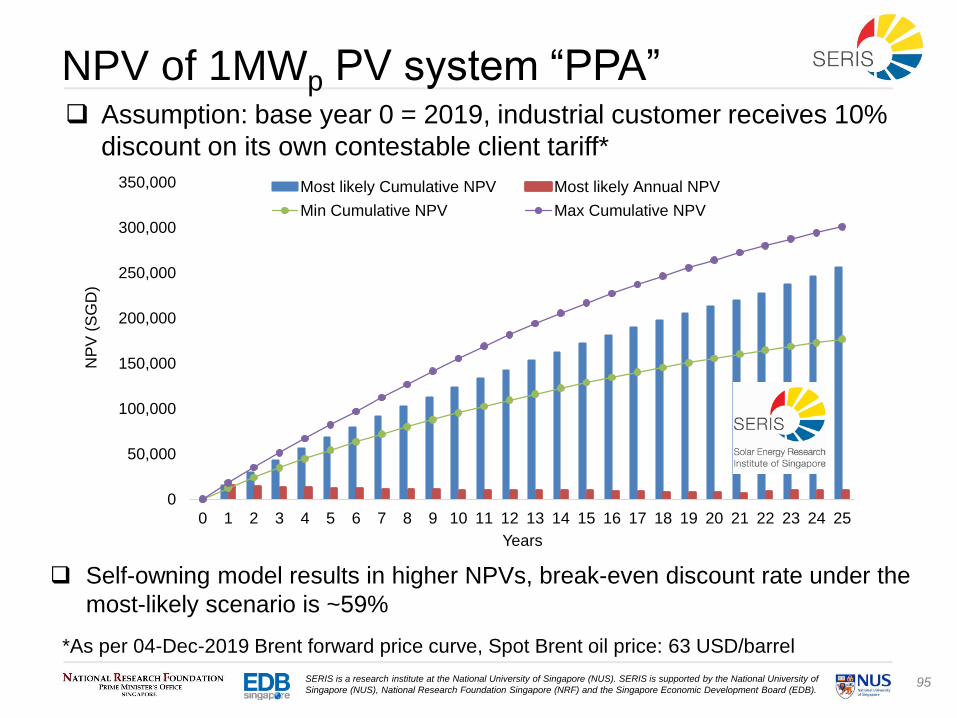
95SERIS is a research institute at the National University of Singapore (NUS). SERIS is supported by the National University of
Singapore (NUS), National Research Foundation Singapore (NRF) and the Singapore Economic Development Board (EDB).
0
50,000
100,000
150,000
200,000
250,000
300,000
350,000
0 1 2 3 4 5 6 7 8 9 10 11 12 13 14 15 16 17 18 19 20 21 22 23 24 25
NP
V (
SG
D)
Years
Most likely Cumulative NPV Most likely Annual NPV
Min Cumulative NPV Max Cumulative NPV
NPV of 1MWp PV system “PPA” Assumption: base year 0 = 2019, industrial customer receives 10%
discount on its own contestable client tariff*
Self-owning model results in higher NPVs, break-even discount rate under the
most-likely scenario is ~59%
*As per 04-Dec-2019 Brent forward price curve, Spot Brent oil price: 63 USD/barrel
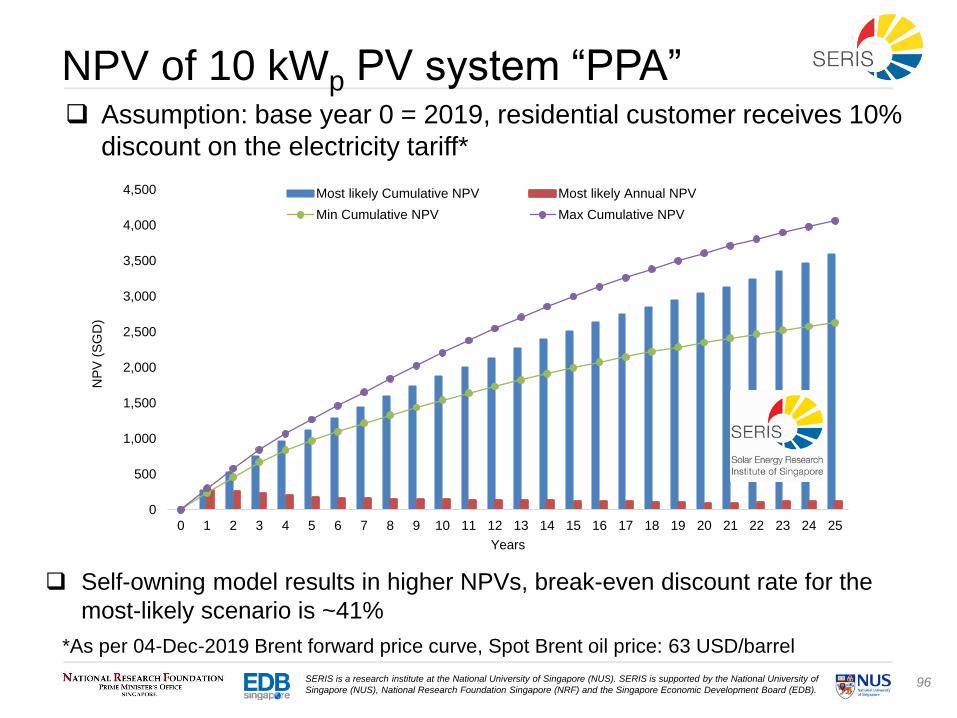
96SERIS is a research institute at the National University of Singapore (NUS). SERIS is supported by the National University of
Singapore (NUS), National Research Foundation Singapore (NRF) and the Singapore Economic Development Board (EDB).
0
500
1,000
1,500
2,000
2,500
3,000
3,500
4,000
4,500
0 1 2 3 4 5 6 7 8 9 10 11 12 13 14 15 16 17 18 19 20 21 22 23 24 25
NP
V (
SG
D)
Years
Most likely Cumulative NPV Most likely Annual NPV
Min Cumulative NPV Max Cumulative NPV
NPV of 10 kWp PV system “PPA” Assumption: base year 0 = 2019, residential customer receives 10%
discount on the electricity tariff*
Self-owning model results in higher NPVs, break-even discount rate for the
most-likely scenario is ~41%
*As per 04-Dec-2019 Brent forward price curve, Spot Brent oil price: 63 USD/barrel
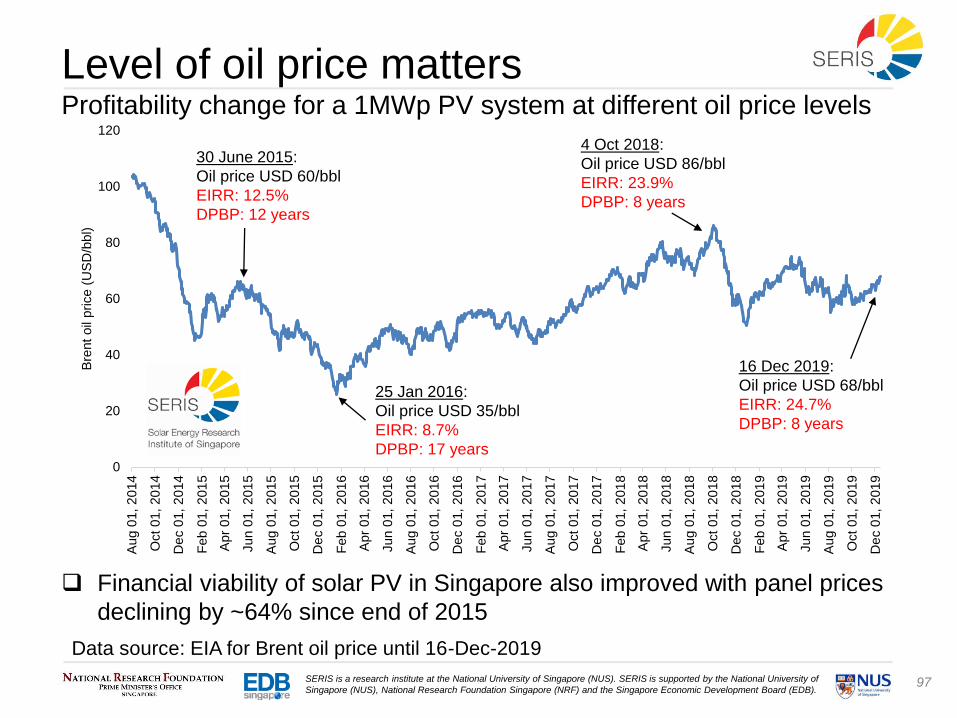
97SERIS is a research institute at the National University of Singapore (NUS). SERIS is supported by the National University of
Singapore (NUS), National Research Foundation Singapore (NRF) and the Singapore Economic Development Board (EDB).
Level of oil price mattersProfitability change for a 1MWp PV system at different oil price levels
Data source: EIA for Brent oil price until 16-Dec-2019
Financial viability of solar PV in Singapore also improved with panel prices
declining by ~64% since end of 2015
0
20
40
60
80
100
120A
ug 0
1, 2
014
Oct 01
, 20
14
De
c 0
1, 2
014
Feb
01,
201
5
Apr
01
, 20
15
Jun 0
1,
201
5
Aug 0
1, 2
015
Oct 01
, 20
15
De
c 0
1, 2
015
Feb
01,
201
6
Apr
01
, 20
16
Jun 0
1,
201
6
Aug 0
1, 2
016
Oct 01
, 20
16
De
c 0
1, 2
016
Feb
01,
201
7
Apr
01
, 20
17
Jun 0
1,
201
7
Aug 0
1, 2
017
Oct 01
, 20
17
De
c 0
1, 2
017
Feb
01,
201
8
Apr
01
, 20
18
Jun 0
1,
201
8
Aug 0
1, 2
018
Oct 01
, 20
18
De
c 0
1, 2
018
Feb
01,
201
9
Apr
01
, 20
19
Jun 0
1,
201
9
Aug 0
1, 2
019
Oct 01
, 20
19
De
c 0
1, 2
019
Bre
nt
oil
price (
US
D/b
bl)
30 June 2015:
Oil price USD 60/bbl
EIRR: 12.5%
DPBP: 12 years
25 Jan 2016:
Oil price USD 35/bbl
EIRR: 8.7%
DPBP: 17 years
4 Oct 2018:
Oil price USD 86/bbl
EIRR: 23.9%
DPBP: 8 years
16 Dec 2019:
Oil price USD 68/bbl
EIRR: 24.7%
DPBP: 8 years
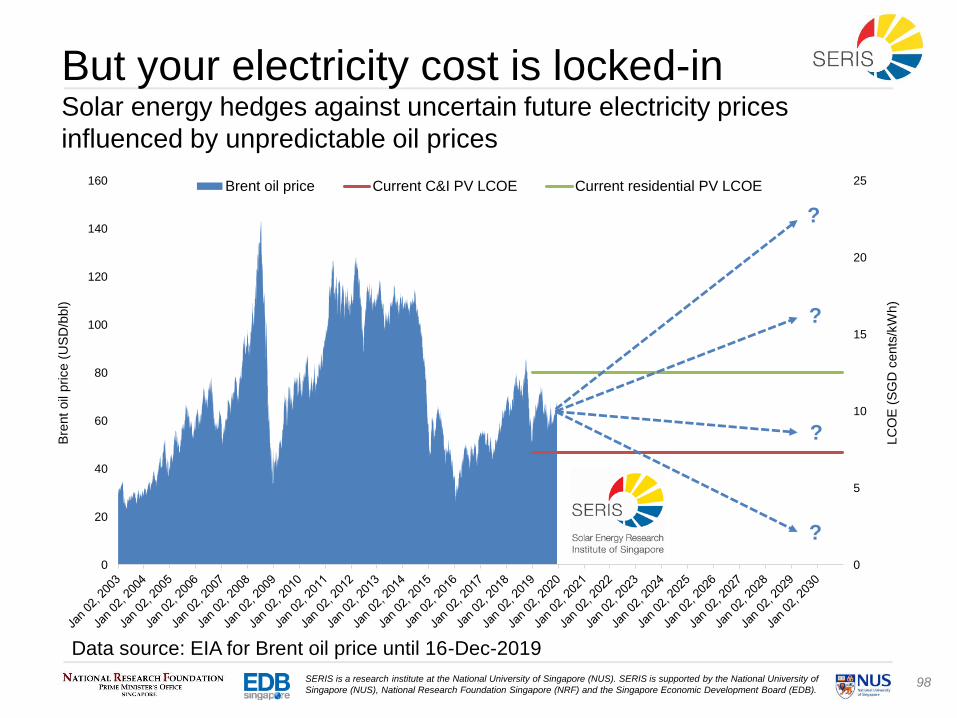
98SERIS is a research institute at the National University of Singapore (NUS). SERIS is supported by the National University of
Singapore (NUS), National Research Foundation Singapore (NRF) and the Singapore Economic Development Board (EDB).
0
5
10
15
20
25
0
20
40
60
80
100
120
140
160
LC
OE
(S
GD
cents
/kW
h)
Bre
nt
oil
price (
US
D/b
bl)
Brent oil price Current C&I PV LCOE Current residential PV LCOE
But your electricity cost is locked-inSolar energy hedges against uncertain future electricity prices
influenced by unpredictable oil prices
Data source: EIA for Brent oil price until 16-Dec-2019
?
?
?
?
99SERIS is a research institute at the National University of Singapore (NUS). SERIS is supported by the National University of
Singapore (NUS), National Research Foundation Singapore (NRF) and the Singapore Economic Development Board (EDB).
More information at
www.seris.sg
www.solar-respository.sg
We are also on: