Embed Size (px)
Citation preview

Solar Cycle 24
Why the world will continue to cool and why carbon dioxide won’t make a detectable difference.
David Archibald

Solar Cycle 24 2
Table of Contents 1. Prologue 2. Foreword 3. Introduction 4. The Climate Record 5. The Solar Driver of Climate 6. The Warming Effect of Carbon Dioxide 7. Carbon Dioxide in a Cooling World 8. Can Carbon Dioxide be even a little bit bad? 9. Summary List of Figures 1. The Satellite Record 2. Global Sea Ice Area 3. Tropical Troposphere Temperature Anomalies at the 200 hPa level 1958 -2008 4. A Rural US Temperature Profile 5. A 300 Year Thermometer Record 6. Medieval Warm Period – Little Ice Age 7. The Holocene Optimum 8. Vostok Ice Core Temperature Profile 9. Vostok Interglacials Superimposed and Aligned on Peak Temperature 10. Solar Cycles from 1700 and Projected to 2030 11. Sunspots on the face of the Sun 12. Solar Cycle Length Relative to Temperature 13. Portland, Maine – Solar Cycle Length Relative to Temperature 14. Hanover, New Hampshire with Solar Cycle 22 Plotted Relative to Solar Cycle 23 15. Accumulated Number of Spotless Days – Solar Cycles 10 to 15 compared to Solar Cycles 16 to 23 16. The Transition from Solar Cycle 22 to Solar Cycle 23

Solar Cycle 24 3
17. Solar Cycle 23 – 24 Transition Relative to Late 19th Century and Late 20th Century Transitions 18. A Repeat of the Dalton Minimum? 19. The Solar – Climate Relationship 20. The Solar Dynamo Index 21. Polar Faculae on the Sun 22. Interplanetary Magnetic Field 23. Oulu, Finland Neutron Monitor Count 1960 - 2010 24. Projected US Temperature Profile to 2030 25. The Consequential Climate Shift 26. Another Dalton Minimum, or Worse? 27. Be10 from the Dye 3 Ice Core of Greenland 28. The aa Index from 1868 to 2008 29. The aa Index 1960 - 2008 30. The Warming Effect of Carbon Dioxide 31. Relative Contributions of Pre-Industrial and Anthropogenic Carbon Dioxide 32. Correct Safe Limit 33. Comparison of Climate Sensitivity Estimates 34. Historic and Projected Atmospheric Carbon Contributions by the United States, China and Australia 35. Relative Contribution of the Major Greenhouse Gasses 36. The Temperature Profile of the Oceans 37. Annual Carbon Flux between the Oceans, Vegetation and Soils, and the Atmosphere Sources of Figures Bibliography Online Resources Acknowledgements Appendices 1. In Praise of Carbon 2. Failure to Warm
Solar Cycle 24 4
1.0 Prologue Warming or cooling?
The first thing to be aware of is that the warming effect of carbon dioxide is strongly logarithmic. Of the 3° C. that carbon dioxide contributes to the greenhouse effect, the first 20 ppm has a greater effect than the following 400 ppm. By the time we get to the current level of 384 ppm, each 100 ppm increment will produce only about 0.1° of warming. With atmospheric carbon dioxide rising at about 2 ppm per annum, temperature will rise at 0.1° every 50 years.
If that is true, you will ask, how does the Intergovernmental Panel on Climate Change (IPCC) get its icecap-melting figure of 5° for doubling of the preindustrial level to 560 ppm? An equation called the Stefan-Boltzmann equation tells us that in the absence of feedbacks, doubling would produce a rise of 1°. The IPCC climate modelling assumes that the feedback from this rise will be positive; that is, that the extra heat will cause more water vapour in the atmosphere, which in turn will cause more heat to be trapped, and the system compounds away until 1° gets turned into 5°. As described, the Earth’s climate would be tremendously unstable, prone to thermal runaway at the slightest disturbance.
The real world evidence says the opposite. In late 2007, a Dr. Roy Spencer of the University of Alabama published a paper analyzing data from the Aqua satellite. Based on the response of tropical clouds, Dr. Spencer demonstrated that the feedback is negative. He calculates a 0.5° warming for a doubling of the preindustrial carbon dioxide level. Global warming is real, but it is also minuscule.
Atmospheric temperature rose 0.7° in the 20th century; it has also fallen by the same amount in the last 18 months. Global warming, as caused by carbon dioxide, will be lost in the noise of the system.
If carbon dioxide didn’t cause the warming of the 20th century, what did? Well, a good place to start is the sun. In the 20th century, the sun was more active than at any time in the previous 8,000 years. But what is happening now suggests that it will soon be much quieter. Two Danish researchers, Friis-Christensen and Lassen, demonstrated in a 1991 paper that there is a correlation between the length of a solar cycle and the temperature during the following solar cycle. The longer a solar cycle, the cooler the following solar cycle, and visa versa. In 1996, Butler and Johnson demonstrated the same relationship on climate data from the Armagh observatory in Northern Ireland. I have extended that to the 400 year Central England temperature record, the De Bilt data from Holland, and a number of temperature records from the northeastern US. In the latter, the relationship is that each 1-year increase in solar cycle length will cause a 0.7° decline of atmospheric temperature during the following cycle.
Solar cycles are normally 11 years long. We are currently near the end of Solar Cycle 23, which started in May 1996. It is now just over 12 years long. The previous cycle, 22, was a short one at 9.6 years. The differential is now 2½ years, which equates to a temperature decline of 1.7°. This is in the bag. The way that Solar

Solar Cycle 24 5
Cycle 23 is declining, combined with the very weak ramp-up of Solar Cycle 24 sunspot activity, suggests that the month of solar cycle minimum will be July 2009. If that transpires, the cooling will amount to over 2°.
That last time that something like this happened was a period called the Dalton Minimum from 1796 to 1820. This was caused by the very weak Solar Cycles 5 and 6. They were preceded by the very long Solar Cycle 4, which was 13.6 years long. There were quite a lot of crop failures due to cold weather during the Dalton Minimum. That is why there is so much interest in sunspot activity at the moment. Each day’s delay in the month of solar minimum will make the second decade of the 21st century two thousandths of a degree
colder. That doesn’t sound like much, but we may have another year to go.
A little-discussed consequence of the coming doubling of the atmospheric carbon dioxide level is the effect on plant growth. Wheat yields have already risen 15% due to the 100 ppm rise from the preindustrial level. Doubling will cause a 50% increase in yield, with similar effects for all other crops. In summary, global warming is real but minuscule, there is a big solar-driven cooling coming in a few short years, and increased atmospheric carbon dioxide is wonderful for plant growth. It therefore follows that burying or trying to limit such a wonderful substance is exactly wrong in science.
Solar Cycle 24 6
1.0 Foreword By Professor David Bellamy OBE Early in my school career, the physics master told me that, despite my lack of mathematical acumen, I could still enjoy physics by mastering the definitions and the meaning of the laws that explain why the world goes round. Facts of science peer reviewed by observation, experiment and robust discussion across the centuries eventually took their place in the corpus of the knowledge and practice of civilization. The fact that the Earth does go round the sun was proved thanks to Galileo's telescope and his faith in science and sun spots. Heat cannot of itself pass from a colder body to a hotter one, pointing to the fact that the universe must therefore be slowly but surely cooling down. The wavelengths of sunshine beaming in from our nearest source of heat and light pass freely through outer space because there is negligible mass of anything to affect their passage. It is for this reason that the temperature in the nothingness of the interstellar void is only three degrees absolute, that is minus 270 degrees Celsius, so cold that all chemical reactions are at a standstill. As the sun's radiance approaches the atmosphere some 90 kilometres up it impacts with molecules of gases that are there because each have sufficient mass to be held in orbit by the gravitational mass of this lonely planet. These gases which are important building blocks of all living things including you and me are nitrogen, oxygen, water vapour, carbon dioxide, nitrogen oxides and methane. Nitrogen and oxygen that
make up 98.63% of the mass of the atmosphere are spectrally transparent to the incoming radiation from the sun and so take no part in warming the atmospheric envelope. The sun's rays heat the surface of the earth and the heated surface gives off infrared radiation. Most of the infrared radiation is absorbed by the molecules of water vapour and carbon dioxide in the atmosphere so producing heat which causes the local excitation of other atoms and molecules. As the air warms it becomes less dense and rising into the colder layers above obey Newton's Law of cooling which states that the rate of cooling is dependant on the difference in temperature between the warmest and the coolest body. The wrap-round galactic fridge acts as an eternal sink and the attenuation of gravity with distance from this lonely planet sets the outer limit of the atmospheric blanket as the gases are further attenuated in the enormity of space. Anyone who travels by jumbo jet can bear witness to Newton's law, as the plane takes off, the ambient temperature drops and the reverse happens during descent. Every such in-flight experience demonstrates the fact that without these reactive "greenhouse" gases we would freeze to death as life as we know it came to an end. The turbulence of mass flow and solar wind complicates the matter as does the fact that the amount of water vapour in the atmosphere varies with temperature.

Solar Cycle 24 7
Between plus 4 degrees and zero Celsius, liquid water begins to take on the structure of ice, which being less dense than the liquid, floats on the surface, putting a protective lid on lakes and oceans that prevents them from deep freezing. The fact that the overwhelming mass and spectral clout of water vapour in the atmosphere fluctuates with temperature serves to regulate the vagaries of temperature by producing sunshade or heat trapping clouds, and high albedo ice crystals. The latent heat of evaporation and ice formation add to the complexities of Le Chatelier's concept of mobile equilibrium. Back in the early ninety seventies while teaching botany at Durham University, morning coffee became spiced with Armageddon talk. The current ice age had not come to an end, indeed it was about to return with a vengeance, so warned the doomsters highlighting a drop in the Earth's temperature of 0.3 of a degree Celsius over a period of 20 years to press their argument. During this short period, the enactment of a clean air act had effectively reduced the scourge of death by sulphurous smogs in the cities of Britain, cities that had done their best to keep death by hypothermia at bay by burning cheap low grade coal in millions of open grates. The only real problem with switching to this simple form of clean coal technology was that our farmers had to add the cost of sulphur to their already expensive mix of fertilisers. Life expectancies took a turn for the better but the icy sword of Damocles was wielded with good effect by the media and other consenting scaremongers. However an inconvenient upswing of world temperatures put the ice age scenario on hold, setting part of the same pack of sandwich board scientists off on a new band wagon of doom and gloom which
has already cost the world’s taxpayers over 50 billion greenbacks to pay for computer and international conference time. They called it anthropogenic global warming and blamed it on carbon dioxide, the atmospheric levels of which had been rising since the industrial revolution began digging and drilling into the world’s fossil fuel reserves. The days of production biology sent research teams out across the world to measure the production of organic matter by a range of natural and managed ecosystems from the poles to the equator and from mountain tops to the depths of the euphotic zone. Each study was a working inventory of the state of play in the balance of photosynthesis and respiration that makes this living planet go round, while keeping its environment in some form of balance. Plant ecologists worthy of their honours degree were well versed in the importance of stomatal indices controlling the ingress of carbon dioxide and egress of water vapour from photosynthetic plants. They even had the audacity to point out that far from being a pollutant, carbon dioxide was the most important airborne fertiliser in the world. All just in time because the decades of destruction were gathering pace and diversification of the use of the internal combustion engine was in the driving seat. Soil erosion, floods, droughts, the collapse of coral reefs and the extinction of species made headlines in the broadsheets and tabloids as habitat destruction, overgrazing and over-fishing took their toll. Wanton acts of ecological vandalism starred on films, tapes, documentaries, newsprint, books, magazines and scientific papers and the conservation industry was born.

Solar Cycle 24 8
Sadly it did not take long for them to sing along with the global warmers, blaming just about every one of the world's environmental woes on their favourite tail pipe emission carbon dioxide, not on the march of the machines themselves. By this time computers were opening up the world of maths to biologists like me and the rapid handling of data allowed even taxonomy, evolution and plant ecology into realms undreamed of by Linnaeus, Wallace and Darwin. I felt ready to join in the discussion. I rapidly found myself confronted by what can only be termed a state of McCarthyism in Science, unbelievably backed up by that once doyenne of impartiality the BBC, for whom I had made many
documentaries based on natural history and the environment. Hence this book. David Bellamy is the most eminent botanist and conservationist in the United Kingdom. He is the author of over 45 books published over the last 36 years and the writer and presenter of over 400 television programmes. His presidencies include the Wildlife Trusts Partnership, the Galapagos Conservation Trust and the British Naturalists’ Association. David Bellamy’s deep commitment to conservation and energy in promoting that cause has made him the recipient of many honours.

Solar Cycle 24 9
2.0 Introduction Do we live in a special time in which the laws of physics and Nature are suspended? No, we do not. Can we expect relationships between the Sun’s activity and climate, that we can see in data going back several hundred years, to continue for at least another 20 years? With absolute certainty. This book will demonstrate that the Sun drives climate, and use that demonstrated relationship to predict the Earth’s climate to 2030. It is a prediction that differs from most in the public domain. It is a prediction of continuing cooling.
To put the solar – climate relationship in context, we will begin by looking at the recent temperature record. Then we will examine the role of the Sun in changing climate, and following that, the contribution of anthropogenic warming from carbon dioxide. I will show that increased atmospheric carbon dioxide is not even a little bit bad. It is wholly beneficial. The more carbon dioxide we can put into the atmosphere, the better the planet will be – for humans, and all other living things.

Solar Cycle 24 10
3.0 The Climate Record
Figure 1: The Satellite Record Figure 1 shows the satellite temperature record. This is the highest quality temperature data series in the climate record. We have 30 years of satellite temperature data. It shows that the Earth’s temperature is essentially unchanged over the last thirty years. Note the El Nino peak in 1998. Globally, we have had 10 years of temperature decline since that peak in 1998, with a rate of decline of 0.06 degrees per annum. I am expecting the rate of decline to accelerate to 0.2 degrees per annum from the end of this decade.

Solar Cycle 24 11
Figure 2: Global Sea Ice Area That satellite temperature record is corroborated by the satellite record of Antarctic and Arctic sea ice extent over the same period. There is no long term trend evident as yet.

Solar Cycle 24 12
Figure 3: Tropical Troposphere Temperature Anomalies at the 200 hectopascal level 1958 -2008 Balloons carried radiosondes into the upper atmosphere from the late 1950s, and take the high quality data record back a further 20 years. At the 200 hectopascal level, corresponding to 12,000 metres – the level at which commercial jet aircraft fly, recent temperatures have been as low as those recorded during the 1970s cooling period.

Solar Cycle 24 13
Figure 4: A Rural US Temperature Profile Most rural temperature records in the United States were set in the 1930s and 1940s. Greenland had its highest recorded temperatures in the 1930s and has been cooler since. That is why it is possible to select a number of rural US temperature records and construct a temperature profile that shows that it is cooler now than it was seventy years ago, and in this case, appreciably cooler than it was seventy years ago. The 1.5° temperature decline from the late 1950s to the mid-70s was due to a weak solar cycle 20 after a strong solar cycle 19.

Solar Cycle 24 14
Figure 5: A 300 Year Thermometer Record After the invention of thermometers, records started to be kept. This is the longest temperature series in the record. A number of interesting things can be seen in this record, including the depths of the Little Ice Age in the late 17th century, and the Dalton Minimum which was the last time the Thames froze over in the City of London. What is also interesting is the 2.2° temperature rise from 7.8° in 1696 to 10.0° in 1732. This is a 2.2° rise is 36 years. By comparison, the world has seen a 0.6° rise over the 100 years of the 20th century. That temperature rise in the early 18th century was four times as large and three times as fast as the rise in the 20th century. The significance of this is that the world can experience very rapid temperature swings all due to natural causes. The temperature peak of 10° in 1732 wasn’t reached again until 1947.

Solar Cycle 24 15
Figure 6: Medieval Warm Period – Little Ice Age To reconstruct climate prior to thermometer records, isotope ratios and tree ring widths are used. This graph shows the Medieval Warm Period and Little Ice Age. The peak of the Medieval Warm Period was 2° warmer than today and the Little Ice Age 2° colder at its worst. The total range is 4° C. The warming over the 20th century was 0.7° C by comparison. This recent warming has melted ice on some high passes in the Swiss Alps, uncovering artifacts from the Medieval Warm Period and the prior Roman Warm Period.

Solar Cycle 24 16
Figure 7: The Holocene Optimum It was warmer again not long after the last ice age ended. Sea level was 2 metres higher than it is today. Since the Holocene Optimum about eight thousand years ago, we have been in long term temperature decline at about 0.25° C per thousand years.

Solar Cycle 24 17
Figure 8: Vostok Ice Core Temperature Profile When I asked in the introduction to this book if we lived in a special time, well that is true in relation to the last three million years. The special time we live in is called an interglacial. Normally, and that is 90% of the time, a large portion of the continents are covered in over one thousand metres of ice. Relative to the last four interglacials, we may be somewhere near the end of the current interglacial. The end of the Holocene will be a brutal time for humanity.

Solar Cycle 24 18
Figure 9: Vostok Interglacials Superimposed and Aligned on Peak Temperature To paraphrase Thomas Hobbes, interglacials are short and then we enter the nasty brutishness of the glacial periods. This graph suggests that that may be soon. It shows the last five interglacials of the Vostok core superimposed on each other, all aligned on the peak temperature reached in each interglacial. The Holocene, the period we are in now, is tracking along with three of the four previous interglacials. Of those three, if the Holocene ends up being like the Eemian, then we may have up to 3,000 years of Little Ice Age-like conditions before we plunge into the next glacial period. If not, then the plunge could start any time now.
Holocene
Solar Cycle 24 19
4.0 The Solar Driver of Climate
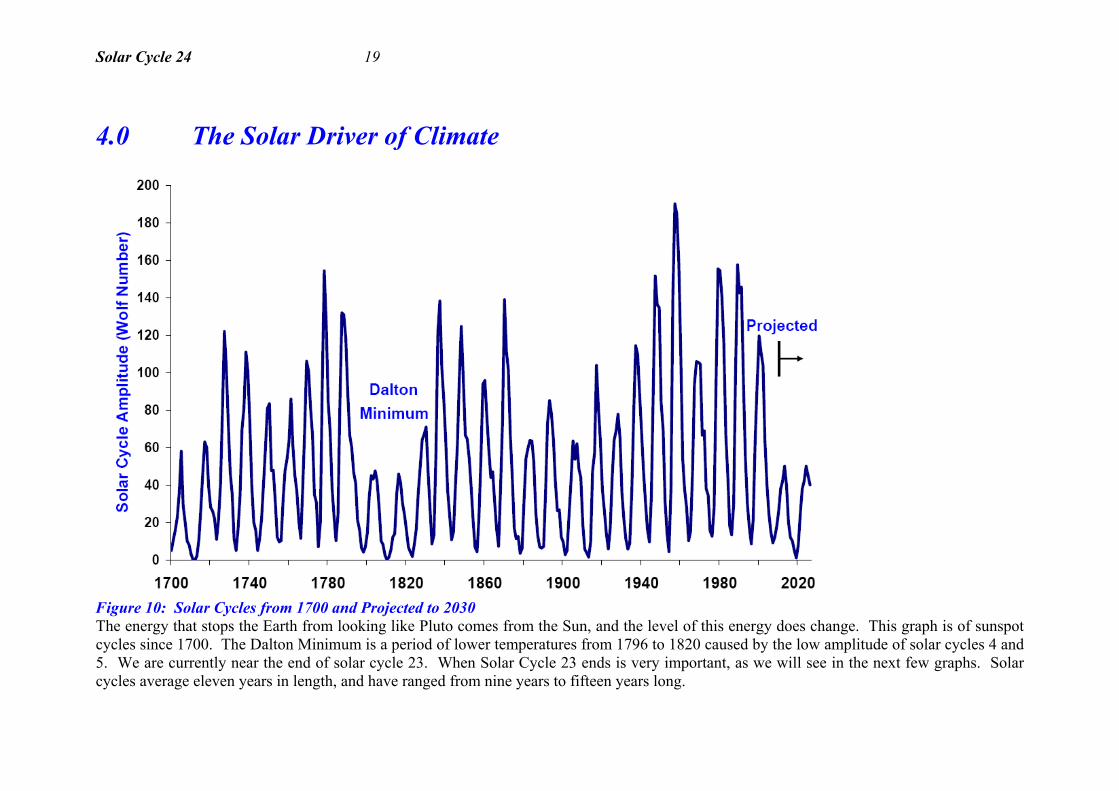
Figure 10: Solar Cycles from 1700 and Projected to 2030 The energy that stops the Earth from looking like Pluto comes from the Sun, and the level of this energy does change. This graph is of sunspot cycles since 1700. The Dalton Minimum is a period of lower temperatures from 1796 to 1820 caused by the low amplitude of solar cycles 4 and 5. We are currently near the end of solar cycle 23. When Solar Cycle 23 ends is very important, as we will see in the next few graphs. Solar cycles average eleven years in length, and have ranged from nine years to fifteen years long.

Solar Cycle 24 20
(a) Full face of the Sun (b) Close up of a sunspot pair Figure 11: Sunspots on the face of the Sun Sunspots are caused by tubes of intense magnetic flux rising to the Sun’s surface due to buoyancy. They are at temperatures of 4,000° to 4,500°C. The contrast with the rest of the Sun’s surface makes them visible as dark spots. The number and intensity of sunspots varies greatly through the solar cycle. The Sun’s magnetic fields switch at the peak of the solar cycle.

Solar Cycle 24 21
Figure 12: Solar Cycle Length Relative to Temperature There is a variation in atmospheric temperature through the solar cycle, though the correlation between temperature and solar cycle length is better than that of temperature with solar cycle amplitude. The correlation between solar cycle length and the average temperature of the following solar cycle was discovered by two Danish researchers, Friis-Christensen and Lassen, in 1991. This graph is produced from the Central England Temperature record seen on page 6. The slope of the line is 0.6° centigrade per year of solar cycle length. This means that the temperature of this weather station will fall by 0.6° centigrade for every year that a solar cycle is longer than the solar cycle that preceded it.

Solar Cycle 24 22
Figure 13: Portland, Maine – Solar Cycle Length Relative to Temperature A number of cities in the northeastern United States also show a solar cycle length – temperature correlation. This is Portland, Maine with a correlation of 0.7º centigrade per year of solar cycle length.

Solar Cycle 24 23
Figure 14: Hanover, New Hampshire with Solar Cycle 22 Plotted Relative to Solar Cycle 23 Solar Cycle 22 was 9.6 years long. On the basis that Solar Cycle 23 is thirteen years long, there will be a 2.2 degree celcius decline in temperature in Hanover, New Hampshire over the next decade. In terms of quantum, this is three times the temperature rise over the twentieth century, but in the opposite direction. The evidence from the Hanover solar cycle length to temperature relationship is that there will be a significant cooling very soon. Our generation has known a warm, giving Sun, but the next generation will suffer a Sun that is less giving, and the Earth will be less fruitful.

Solar Cycle 24 24
Figure 15: Accumulated Number of Spotless Days – Solar Cycles 10 to 15 compared to Solar Cycles 16 to 23 This graph is another pointer that we are heading back to the weak solar cycles of the 19th century, with 19th century-type winters to accompany them. Solar cycles 10 to 15, from 1860 to 1917, had an average of 66 months from the first spotless day to solar cycle minimum. Since then, solar cycles have averaged half that at 33 months from first spotless day to solar cycle minimum. So far, solar cycle 24 is plotting on the 19th century line. With the first spotless day on 27th January, 2004, and if the 66 month observation holds, then solar minimum will be on or about July 2009. This would make solar cycle 23 thirteen years long.

Solar Cycle 24 25
Figure 16: The Transition from Solar Cycle 22 to Solar Cycle 23 The first sunspots of a new solar cycle appear usually at more than 20° latitude on the Sun’s surface, with subsequent sunspots generally forming closer to the solar equator until the cycle dies out. Solar minimum is the lowest point in the overlap between low latitude sunspots of the old cycle and high latitude sunspots with reversed polarity of the new cycle. This is illustrated by the transition from Solar Cycle 22 to Solar Cycle 23.

Solar Cycle 24 26
Figure 17: Solar Cycle 23 – 24 Transition Relative to Late 19th Century and Late 20th Century Transitions This figure, originally produced by Jan Janssens, is yet another pointer that we are heading back to the weak solar cycles of the late 19th century, or the even weaker solar cycles of the beginning of the 19th century. If the Solar Cycle 23 – 24 transition continued to track along with the Solar Cycle 11 – 12 transition, Solar Cycle 23 would be over 13 years long. (Original figure by Jan Janssens, Belgian Solar Section, annotated by the author)

Solar Cycle 24 27
Figure 18: A Repeat of the Dalton Minimum? Plotting Solar Cycle 23 over Solar Cycle 4, which preceded the Dalton Minimum, shows the similarity between the cycles. July 2009 would be month of minimum for a thirteen year long Solar Cycle 23. A few solar physicists have been predicting amplitudes for Solar Cycles 24 and 25 of approximately 40, which would be a repeat of the experience of the Dalton Minimum.

Solar Cycle 24 28
The Solar – Climate RelationshipLower Magnetic Field StrengthFewer
Sunspots
Less SolarWind
More GalacticCosmic Rays
More Low LevelCloud Formation
More SunlightReflected Into Space
Earth BecomesColder
Lower ChromosphereTemperature
Less Ultraviolet Light
Decreased LowerStratospheric Ozone
Negative North AtlanticOscillation
Northern HemisphereBecomes Colder
Figure 19: The Solar – Climate Relationship This graphic illustrates two of the ways in which reduced solar activity results in lower temperatures on Earth. Very small changes in different types of solar radiation have effects out of proportion to their share of Total Solar Irradiance. Clouds are very important in climate because of their high reflectivity, a property termed albedo. Clouds reflect 60% of the Sun’s radiation, whereas open ocean will absorb 95% of it. A 1% decrease in cloud cover could have caused the warming of the 20th century.

Solar Cycle 24 29
Figure 20: The Solar Dynamo Index
We can follow the path outlined in the previous slide. Ken Schatten is the solar physicist with the best track record in predicting the strength of solar cycles, using the solar dynamo theory he co-authored in 1978. This is the basis of Ken Schatten’s prediction. The red line is the strength of the polar magnetic fields on the Sun and the blue line is the strength of the toroidal magnetic fields. During a sunspot cycle, polar magnetic fields are converted to toroidal magnetic fields and back again. Sunspots form from the toroidal magnetic fields breaking through to the Sun’s surface. The top line sums the polar and toroidal magnetic field strengths. This has been in downtrend since the early 1990s. This downtrend means that there is much less magnetic force available to make sunspots, so Solar Cycle 24 will be much weaker than solar cycle 23.
Solar Cycle 24 30
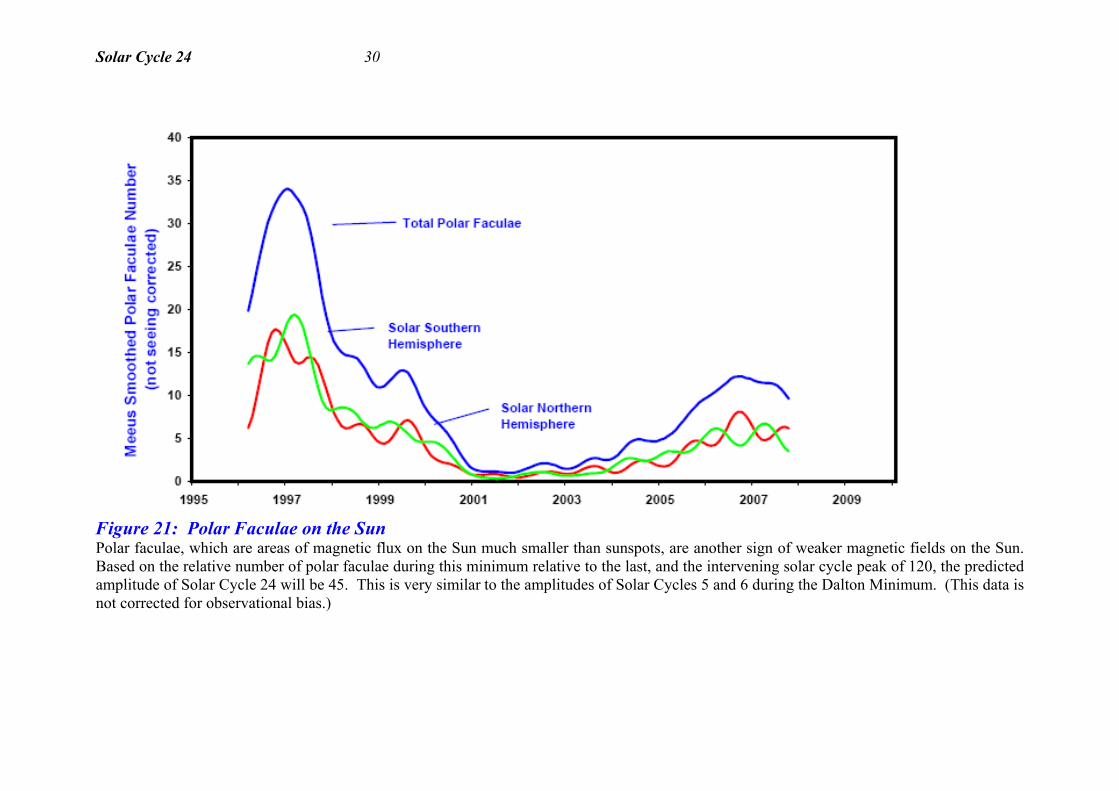
Figure 21: Polar Faculae on the Sun Polar faculae, which are areas of magnetic flux on the Sun much smaller than sunspots, are another sign of weaker magnetic fields on the Sun. Based on the relative number of polar faculae during this minimum relative to the last, and the intervening solar cycle peak of 120, the predicted amplitude of Solar Cycle 24 will be 45. This is very similar to the amplitudes of Solar Cycles 5 and 6 during the Dalton Minimum. (This data is not corrected for observational bias.)

Solar Cycle 24 31
Figure 22: Interplanetary Magnetic Field A weak solar magnetic field produces a weak interplanetary magnetic field. There are a few interesting features on this graph. Note that the flatness of the interplanetary magnetic field associated with the 1970s cooling period associated with Solar Cycle 20. What is significant is that the strength of the interplanetary magnetic field has fallen below the levels of previous solar minima.

Solar Cycle 24 32
Figure 23: Oulu, Finland Neutron Monitor Count 1960 – 2010 The first earthly consequence of a weak interplanetary magnetic field is a higher count of galactic cosmic rays, seen here in the neutron count of the Oulu station in Finland. This graph plots the expected maximum neutron count in this solar minimum, based on what the interplanetary field strength could fall to. The increased galactic cosmic rays will cause increased cloudiness, which in turn increases the Earth’s albedo, and the world then cools in search of a new equilibrium.

Solar Cycle 24 33
Figure 24: Projected Mid-latitude US Temperature Profile to 2030 Combining the rural US data set we saw earlier and the projected temperature response to the length of Solar Cycle 23, this graph shows the expected decline to 2030. The temperature decline will be as steep as that of the 1970s cooling scare, but will go on for longer.
Solar Cycle 24 34
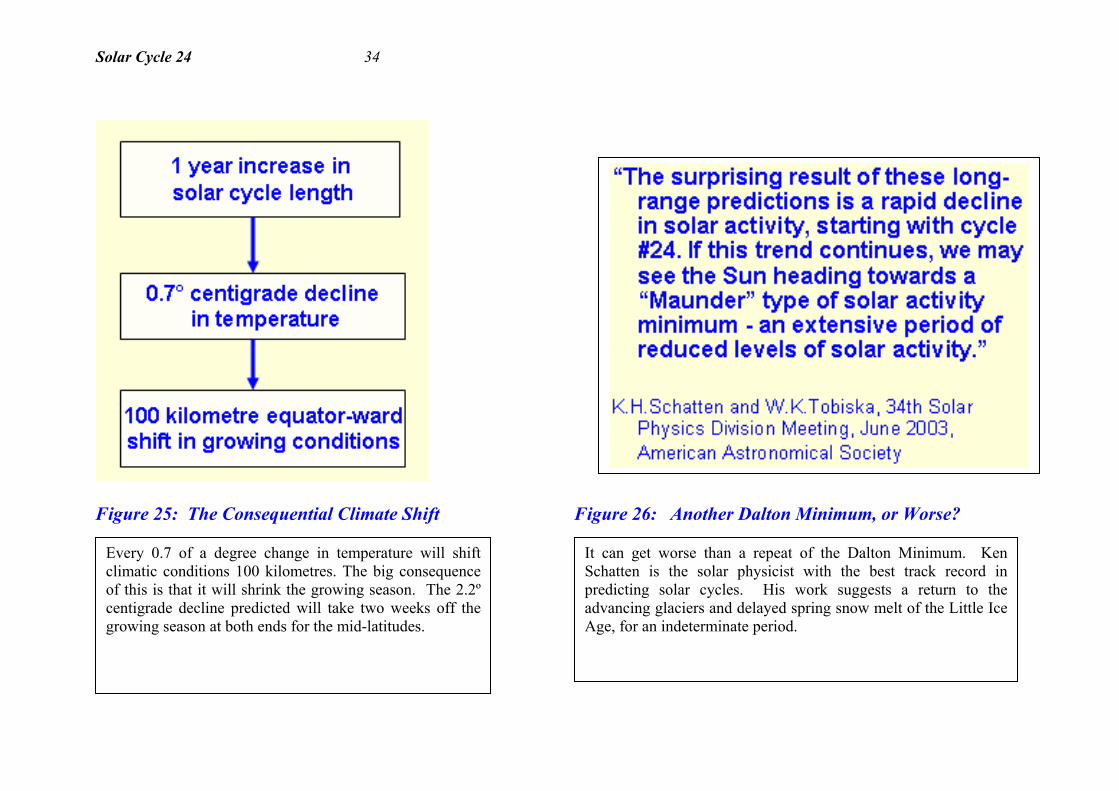
Figure 25: The Consequential Climate Shift Figure 26: Another Dalton Minimum, or Worse?
Every 0.7 of a degree change in temperature will shift climatic conditions 100 kilometres. The big consequence of this is that it will shrink the growing season. The 2.2º centigrade decline predicted will take two weeks off the growing season at both ends for the mid-latitudes.
It can get worse than a repeat of the Dalton Minimum. Ken Schatten is the solar physicist with the best track record in predicting solar cycles. His work suggests a return to the advancing glaciers and delayed spring snow melt of the Little Ice Age, for an indeterminate period.

Solar Cycle 24 35
Figure 27: Be10 from the Dye 3 Ice Core of Greenland
There is physical evidence for solar control of climate. This graph shows the Beryllium 10 data from an ice core in Greenland. Beryllium 10 is formed by high energy galactic cosmic rays coming into the Earth’s atmosphere. When the Sun is active and the solar wind is blowing strongly, the solar wind pushes the galactic cosmic rays away from the inner planets of the solar system and as a consequence, little beryllium 10 is formed. The spikes up in beryllium 10 concentration coincide with the cold periods in Earth’s history for the last 400 years. All the major climate minima are evident in the beryllium 10 record, and the cold period at the end of the 19th century. What is also evident is that beryllium 10 levels started falling away dramatically at the beginning of the Modern Warm Period. This graph alone suggests that the warming of the 20th century was solar-driven.

Solar Cycle 24 36
Figure 28: The aa Index from 1868 to 2008 The aa Index is a geomagnetic activity index which is driven by the solar coronal magnetic field strength. The strength of the solar coronal magnetic field doubled over the 20th century. At the same time, the Earth came out of the Little Ice Age.

Solar Cycle 24 37
Figure 29: The aa Index 1960 – 2008 Looking at the last half century in more detail, what we see happening right now is the aa Index falling to new lows. We can expect the aa Index to continue to fall to 19th century –type levels with the extended minimum of the Solar Cycle 23 – 24 transition.

Solar Cycle 24 38
5.0 The Warming Effect of Carbon Dioxide
Figure 30: The Warming Effect of Carbon Dioxide

Solar Cycle 24 39
Can global warming from increased atmospheric carbon dioxide save us from a decline in mid-latitude agricultural production? Not at all. The first thing to be aware of is that the warming effect of carbon dioxide is strongly logarithmic. Of the three degrees that carbon dioxide contributes to the greenhouse effect, the first 20 ppm has a greater effect than the following 400 ppm. By the time we get to the current level of 384 ppm, each 100 ppm increment will produce only about 0.1 degrees of warming. If the atmospheric carbon dioxide level continued rising at about 2 ppm per annum, temperature will rise at 0.1°C every fifty years. If that is true, you will ask, how does the IPCC get its icecap-melting figure of five degrees for doubling of the pre-industrial carbon dioxide level to 560 ppm? An equation called the Stefan-Boltzmann equation tells us that in the absence of feedbacks, doubling would produce a rise of one degree. The IPCC climate modelling assumes that the feedback from this rise will be positive. That is that the that the extra heat will cause more water vapour in the atmosphere, which in turn will cause more heat to be trapped, and the system compounds away until one degree gets turned into five degrees. As described, the Earth’s climate would be tremendously unstable, prone to thermal runaway at the slightest disturbance. The real world evidence says the opposite. In late 2007, a Dr Roy Spencer of the University of Alabama published a paper analysing data from the Aqua satellite. Based on the response of tropical clouds, Dr Spencer demonstrated that the feedback is negative. He calculates a 0.5°C warming for a doubling of the pre-industrial carbon dioxide level. Global warming is real, but it is also miniscule. Atmospheric temperature rose 0.7 degrees in the 20th century, it has also fallen by the same amount in the last eighteen months. Global warming, as caused by carbon dioxide, will be lost in the noise of the system. Carbon dioxide is tuckered out as a greenhouse gas. Very little can be expected of it from here.

Solar Cycle 24 40
Figure 31: Relative Contributions of Pre-industrial and Anthropogenic CO2
The 0.1° centigrade heating to date from atmospheric carbon dioxide isn’t much, in fact it is almost next to nothing. To the end of time, and let’s call that 600 ppm of carbon dioxide in the atmosphere, the total effect might be good for 0.4°C. It is hard to get excited or concerned about such a number. It is swamped by natural variability, for example the two degree temperature range of the 20th century, and the two degree temperature fall to come over the next decade. This graph takes the data from the previous graph and summarises it in one bar. As you can see, relative to 600 ppm, the warming effect of carbon dioxide was over 85% saturated at the pre-industrial level of 280 ppm.

Solar Cycle 24 41
500048004600440042004000380036003400320030002800260024002200200018001600140012001000
800600400200
0
150 million years ago
400 million years ago
500 million years ago
“the safe upper limit for atmospheric CO2 is no more than 350 ppm”– Dr Hansen of NASA, American Geophysical Union meeting, San Francisco, December 2007
Dr Hansen’s safe upper limit
Pre-industrial level of 280 ppm
Level reached during interglacials, level below which plant growth shuts down
Atmospheric CO2In ppm Correct Safe Limit
Figure 32: Correct Safe Limit
In late 2007, a Dr Hansen of NASA made a statement that the maximum safe level of carbon dioxide in the atmosphere is 350 ppm, about 10% below its current level. This graph shows Dr Hansen’s danger level of 350 ppm relative to levels that the Earth has experienced from the recent to the distant past. The Earth has happily survived levels more than ten times the level that Dr Hansen considers to be the threshold of disaster. Carbon dioxide levels have fallen over geological time. Relative to the last five hundred million years, the average level is around 2,500 ppm.. Prior to the Industrial Revolution, the atmospheric carbon dioxide level was bumping along the level required to sustain life on this planet. The more we take carbon dioxide above that minimum critical level, the safer life on this planet will be.

Solar Cycle 24 42
Figure 33: Comparison of Climate Sensitivity Estimates This graph compares my estimate of climate sensitivity to carbon dioxide, based on Idso’s climate sensitivity derived from observations of Nature, with the estimates of the most prominent in this field. Commonly, sensitivity is based on what would happen if the carbon dioxide level in the atmosphere doubled from its pre-industrial level, as if this was something tragic, when in fact we know that that will be something wonderful if it could happen.

Solar Cycle 24 43
The Stefan Boltzmann figure of one degree centigrade is based on the Stefan-Boltzmann equation without the application of feedbacks. Everybody agrees that this is what would happen if there were no feedbacks involved. Bill Kininmonth is a former head of Australia’s National Climate Centre. His estimate of the forcing is 0.6C and this is based on water vapour amplification but also includes the strong damping effect of surface evaporation. Richard Lindzen is America’s most eminent climate scientist. His estimate of the forcing is based on water vapour and negative cloud feedback. Roy Spencer’s work on data from the Aqua satellite has now proven that these estimates are very close to what happens in Nature. The models the IPCC rely upon take the one degree of heating from the Stefan-Boltzmann equation and apply an enormous amount of compounding water vapour feedback. At their worst, the IPCC models take one degree of heating and turn it into 6.4 degrees. The eminent climate scientists believe the opposite. This would be just an interesting divergence of academic opinion if it weren’t for the fact that tens of millions of people stand to lose their jobs, and billions of people beyond that will suffer unnecessarily, as a consequence of those modelled feedback assumptions. Before hundreds of billions of dollars are squandered, resources misallocated, and many people driven into penury, it would be a productive exercise to examine the basis of the modelled feedback assumptions, especially when the eminent scientists in the field have the contrary opinion.

Solar Cycle 24 44
Figure 34: Historic and Projected Atmospheric Carbon Contributions by the United States, China and Australia
The projected increase in atmospheric carbon dioxide is likely to be brought forward if Chinese economic expansion continues for the next ten years at the same rate that it has demonstrated over the last ten years. This graph shows emissions of carbon to the atmosphere by the United States, Australia and China, with historic data to 2005 and a projection to 2020. Chinese emissions will overtake US emissions in 2008, and then double from the current level by 2016. Per capita emissions by the three countries will be equivalent by 2020.

Solar Cycle 24 45
Figure 35: Relative Contribution of the Major Greenhouse Gasses Greenhouse gases keep the Earth about 33° C warmer than it would be without them, and thus habitable. The largest contribution to the greenhouse effect is from water vapour.
Figure 36: The Temperature Profile of the Oceans Almost all of the heat content of the oceans is held in the top 500 metres above the thermocline, a zone of a high temperature gradient that slows mixing of the upper layer of the ocean with the deep ocean. The consequence of this is that atmospheric carbon dioxide is effectively mixing with a portion of the oceans above the thermocline.

Solar Cycle 24 46
6.0 Carbon Dioxide in a Cooling World
Oceans38,000 billion tonnes of carbon
as carbon dioxide
Atmosphere760 billion tonnes of carbon
As carbon dioxide
Vegetation and Soils2,300 billion tonnes
of carbon
119
120 10097
Anthropogenic Carbon
7
Ocean Surface Layer800 billion tonnes of carbon as carbon dioxide
Slow exchange
Figure 37: Annual Carbon Flux between the Oceans, Vegetation and Soils, and the Atmosphere
This figure shows the relative amount of carbon in each major system, with the annual interchange between them. The oceans have fifty times as much carbon dioxide as the atmosphere. What is important is that the total annual interchange between the atmosphere and the other two systems is more than one fifth of the total amount of carbon dioxide in the atmosphere. The implication is that, on average, a molecule of carbon dioxide spends less than five years in the atmosphere. This means that atmospheric carbon dioxide is in equilibrium with the oceans, or a portion of the oceans. It also means that carbon dioxide is not a pollutant that is accumulating in the atmosphere – it is rapidly turning over. As the atmospheric concentration of carbon dioxide has risen 30% since the pre-industrial level, the portion of the oceans the atmosphere is in near equilibrium with must have also risen 30% to maintain partial pressure equilibrium. This is calculated to be the top 100 metres of the total 3,000 metre water column. This part of the ocean will cool rapidly as the world cools and will tend to take more carbon dioxide from the atmosphere. As a consequence, the atmospheric level may remain relatively flat for the next twenty years.

Solar Cycle 24 47
7.0 Can Carbon Dioxide be even a little bit bad? Carbon dioxide is not even a little bit bad. It is wholly beneficial. The 100 ppm carbon dioxide increase since the beginning of industrialisation has been responsible for an average increase in plant growth rate of about 15%. The 50% increase in plant growth rate due to a 300 ppm increase in atmospheric carbon dioxide can be expected about the middle of the next century. What a wonderful time that will be. C3 Cereals 49% C4 Cereals 20% Fruits and Melons 24% Legumes 44% Roots and Tubers 48% Vegetables 37% Table 1: Growth Response to a 300 ppm increase in Atmospheric Carbon Dioxide Level A 300 ppm increase is something that we can only dream about, but some future generation will get these sort of benefits from the current industrious burrowing of the Chinese in their coal mines. C3 cereals include wheat and C4 cereals include maize. In a world of higher atmospheric carbon dioxide, crops will use less water per unit of carbon dioxide uptake, and thus the productivity of semi-arid lands will increase the most. It’s not all good news. We will need this increase in agricultural productivity to offset the colder weather coming. It also follows that if the developed countries of the world wanted to be caring and sharing towards the third world, the best thing that could be done for the third world is to increase atmospheric carbon dioxide levels. Who would want to deny the third world such a wonderful benefit?
Solar Cycle 24 48
7.0 Summary Proponents of global warming are exactly wrong:
1. The Earth is getting colder and this will accelerate. 2. Carbon dioxide has a minuscule warming effect. 3. Increased atmospheric carbon dioxide will increase agricultural productivity.
2008 is the tenth anniversary of the recent peak on global temperature in 1998. The world has been cooling at 0.06 degrees per annum since then. My prediction is that this rate of cooling will accelerate to 0.2 degrees per annum following the month of solar minimum sometime in 2009. Dr Hansen’s statement that the maximum safe level of carbon dioxide in the atmosphere is 350 ppm begs the question of what the actual ideal level is. 1,000 ppm is the level that commercial greenhouse operators prefer to run their greenhouses at. The ability to grow food is going to be the overriding concern next decade. Regarding that 1,000 ppm level, we will never get there. Atmospheric carbon dioxide levels have been much higher in the geological past – up to 5,000 ppm five hundred million years ago. But most of that carbon is now bound up in the Earth’s sediments where we can’t get to it. Half of the carbon dioxide we are producing now is being gobbled up by the oceans, in soils and in the Russian tundra. At best, we might get to about 600 ppm before the deep oceans take it down to where we will never see it again. What this book demonstrated is that carbon dioxide is largely irrelevant to the Earth’s climate. The carbon dioxide that Mankind will put into the atmosphere over the next few hundred years will offset a couple of millenia of post-Holocene Optimum cooling before we plunge into the next ice age. There are no deleterious consequences of higher atmospheric carbon dioxide levels. Higher atmospheric carbon dioxide levels are wholly beneficial. We have to be thankful to the anthropogenic global warming proponents for one thing. If it weren’t for them and their voodoo science, climate science wouldn’t have attracted the attention of those in the solar field, and we would be sleepwalking into the rather disruptive cooling that is coming next decade. We have a few years to prepare for that in terms of agricultural production. Stopping coal-fired power generation due to carbon dioxide emissions is exactly wrong in science. The more carbon dioxide you put into the atmosphere, the more you are helping all living things on the planet and of course that makes you a better person. This is my message.

Solar Cycle 24 49
Sources of Figures 1. University of Alabama Huntsville Microwave Sounding Unit http://vortex.nsstc.uah.edu/data/msu/t2lt/tltglhmam_5.2 2. Cryosphere Today http://arctic.atmos.uiuc.edu/cryosphere/ 3. UK Metrological Office Hadley Centre http://hadobs.metoffice.com/hadat/hadat2/hadat2_monthly_tropical.txt 4. Archibald, D. 2006, Solar Cycles 24 and 25 and Predicted Climate Response Energy and Environment, 17, 29-38. 5. NASA GISS http://data.giss.nasa.gov/gistemp/station_data/ 6. Modified from IPCC 1990 TAR 7. Graph after Dansgaard et al., 1969, and Schonwiese, 1995 8. National Oceanic and Atmospheric Administration
http://www.ncdc.noaa.gov/paleo/icecore/antarctica/vostok/vostok_timescales.html 9. Archibald, D. 2008, Solar Cycle 24: Implication for the United States, New York Climate Conference 10. Archibald, D. 2006, Solar Cycles 24 and 25 and Predicted Climate Response Energy and Environment, 17, 29-38. 11. (a) Courtesy of SOHO/[instrument] consortium. SOHO is a project of international cooperation between ESA and NASA.
(b) Swedish Institute for Solar Physics 12. Archibald, D. 2008, Solar Cycle 24: Implication for the United States, New York Climate Conference 13. Archibald, D. 2008, Solar Cycle 24: Implication for the United States, New York Climate Conference 14. Archibald, D. 2006, Solar Cycles 24 and 25 and Predicted Climate Response Energy and Environment, 17, 29-38. 15. Jan Janssens, Belgian Solar Section http://users.telenet.be/j.janssens/Engwelcome.html 16. Jan Janssens, Belgian Solar Section http://users.telenet.be/j.janssens/Engwelcome.html 17. Jan Janssens, Belgian Solar Section http://users.telenet.be/j.janssens/Engwelcome.html 18. Developed for this publication. Sunspot data from http://sidc.oma.be/sunspot-data/ 19. Developed for this publication. 20. K.Schatten pers. comm.. 21. Jan Janssens, Belgian Solar Section http://users.telenet.be/j.janssens/Engwelcome.html 22. Developed for this publication http://omniweb.gsfc.nasa.gov/ 23. Sodankyla Geophysical Observatory http://cosmicrays.oulu.fi/ 24. Archibald, D. 2008, Solar Cycle 24: Implication for the United States, New York Climate Conference 25. Archibald, D. 2008, Solar Cycle 24: Implication for the United States, New York Climate Conference 26. Schatten, K.H. and Tobiska, W.K., 34th Solar Physics Division Meeting, June 2003, American Astronomical Society
Solar Cycle 24 50
27. Data provided by Dr Juerg Beer Eidg. Anst. für Wasserversorgung, Abwasserreinigung 28. Developed for this publication. 29. British Geological Survey http://www.geomag.bgs.ac.uk/gifs/aaindex.html 30. Archibald, D. 2007, Climate Outlook to 2030 Energy and Environment, Vol. 18 No. 5 pp 615-619. 31. Archibald, D. 2008, Solar Cycle 24: Implication for the United States, New York Climate Conference 32. Archibald, D. 2008, Solar Cycle 24: Implication for the United States, New York Climate Conference 33. Developed for this publication. 34. Archibald, D. 2007, Climate Outlook to 2030 Energy and Environment, Vol. 18 No. 5 pp 615-619. 35. Developed for this publication 36. Developed for this publication 37. NASA figure on carbon dioxide exchange Bibliography Archibald, D. 2006, Solar Cycles 24 and 25 and Predicted Climate Response Energy and Environment, 17, 29-38. Archibald, D. 2007, Climate Outlook to 2030 Energy and Environment, 18, 615-619. Archibald, D. 2008, Solar Cycle 24: Implications for the United States, International Conference on Climate Change, New York. Butler, C. J. and D.J.Johnston., 1996, A provisional long mean air temperature series for Armagh Observatory. J. Atmos. Terrestrial Phys., 58, 1657-1672. Clilverd, M., E.Clarke, T.Ulrich, H.Rishbeth and M.J.Jarvis 2006, Predicting Solar Cycle 24 and beyond, Space Weather, 4, S09005 Dikpati, M., G. de Toma and P.A.Gilman 2006, Predicting the strength of solar cycle 24 using a flux-transport dynamo-based tool Geophysical Research Letters, 33, L05102 Friis-Christensen, E. and K.Lassen 1991, Length of the solar cycle: an indicator of solar activity closely associated with climate, Science, 254, 698-700. Idso, S. 1998, CO2-induced global warming: a skeptic’s view of potential climate change Climate Research, 10, 69-82. Schatten, K.H. and W.K.Tobiska 2003, Solar Activity Heading for a Maunder Minimum?, Bulletin of the American Astronomical Society, 35 (3), 6.03 Badalyan, O.G., V.N.Obridko and J.Sykora 2001, Brightness of the Coronal Green Line and Prediction for Activity Cycles 23 and 24 Solar Physics, 199, 421–435.

Solar Cycle 24 51
Brunetti, M. 2003, Solar signals in instrumental historical series of meteorological parameters Memorie della Societa Astronomica Italiana, 74 (3), 778-785. Eddy, J. 1976, The Maunder Minimum, Science, 192, 1189-1202. Clilverd, M. 2005, Prediction of solar activity the next 100 years Solar Activity: Exploration, Understanding and Prediction, Workshop in Lund, Sweden Friis-Christensen, E. and K.Lassen 1991, Length of the solar cycle: an indicator of solar activity closely associated with climate, Science, 254, 698-700. Juckett, D.A. and B.Rosenburg 1993, Correlation of Human Longevity Oscillations with Sunspot Cycles, Radiation Research, 133, 312-320. Hood, L.L., 2003, Thermal response of the tropical tropopause region to solar ultraviolet variations, Geophysical Research Letters, 30, No. 23, 2215, doi:10.1029/2003GL018364 Pallé, E. et al 2004, Changes in the Earth's reflectance over the past two decades, Science, 304, 1299-1301. Reichel, R., P.A.Thejll and K.Lassen 2001, The cause-and-effect relationship of solar cycle length and the Northern hemisphere air surface temperature, Journal of Geophysical Research - Space Physics, 106 (A8), 15635-15641. Reid, G.C. 1991, Solar total irradiance variations and the global sea surface temperature record, Journal of Geophysical Research, 96, 2835-2844. Schatten, K.H. and W.K.Tobiska 2003, Solar Activity Heading for a Maunder Minimum?, Bulletin of the American Astronomical Society, 35 (3), 6.03 Spencer, R.W., Braswell, W.D., Christy, J.R. and Hnilo, J. 2007, Cloud and radiation budget changes associated with tropical intraseasonal oscillations, Geophysical Research Letters, 34, L15707. Svalgaard, L., E.W.Cliver and Y.Kamide 2005, Cycle 24: the smallest sunspot cycle in 100 years?, Geophysical Research Letters, 32, L011104. Svensmark, H. and E.Friis-Christensen 1997, Variation of Cosmic Ray Flux and Global Cloud Coverage - a Missing Link in Solar-Climate Relationships, Journal of Atmospheric and Solar-Terrestrial Physics, 59 (11), 1225-1232. Thejll, P. and K.Lassen 2000, Solar forcing of the Northern hemisphere land air temperature: New data, Journal of Atmospheric and Solar-Terrestrial Physics, 62, 1207-1213. Usokin, I.G., M. Schuessler, S.K. Solanki, and K.Mursula 2005, Solar activity, cosmic rays, and the Earth’s temperature: A millennium-scale comparison, Journal of Geophysical Research, 110, A10102 Zhou, K.and C.J.Butler 1998, A statistical study of the relationship between the solar cycle length and tree-ring index values, Journal of Atmospheric and Solar- Terrestrial Physics, 60, 1711-1718. Online Resources

Solar Cycle 24 52
Climate Audit http://www.climateaudit.org/ Dalton Minimum Returns http://ncwatch.typepad.com/dalton_minimum_returns/ Cryosphere Today http://arctic.atmos.uiuc.edu/cryosphere/ Watts up with that http://wattsupwiththat.wordpress.com/ Icecap http://icecap.us/ Solar Cylce 24 http://www.solarcycle24.com/ Barrett Bellamy Climate http://www.barrettbellamyclimate.com/ Acknowledgements The author is grateful for the help and advice he has received on his journey in climate science from Bob Foster, Jan Janssens, Bill Kininmonth, David Bellamy, Ray Evans, Walter Cohn, Joe Bast, David Evans, Viscount Monckton, Erl Happ, Ian Wilson, Warwick Hughes, Ken Schatten and many others.

Solar Cycle 24 53
Appendix 1: In Praise of Carbon
Introduction
The eminent English astronomer, Fred Hoyle (1915 – 2001), was so astounded by the properties of carbon that he renounced atheism. In trying to work out the routes of stellar nucleosynthesis, he observed that one particular nuclear reaction, the triple-alpha proces, which generated carbon, would require the carbon nucleus to have a very specific energy for it to work. The large amount of carbon in the universe, which makes it possible for carbon-based lifeforms (e.g. humans) to exist, demonstrated that this nuclear reaction must work. Based on this notion, he made a prediction of the energy levels in the carbon nucleus that was later borne out by experiment.
However, those energy levels, while needed in order to produce carbon in large quantities, were statistically very unlikely. Hoyle later wrote: “Would you not say to yourself, "Some super-calculating intellect must have designed the properties of the carbon atom, otherwise the chance of my finding such an atom through the blind forces of nature would be utterly minuscule." Of course you would . . . A common sense interpretation of the facts suggests that a super-intellect has monkeyed with physics, as well as with chemistry and biology, and that there are no blind forces worth speaking about in nature. The numbers one calculates from the facts seem to me so overwhelming as to put this conclusion almost beyond question.”
Hoyle, an atheist until that time, said that this suggestion of a guiding hand left him "greatly shaken." (Source: Wikipedia)
In the following text, Professor John Brignell continues the praise of carbon.

Solar Cycle 24 54
In Praise of Carbon
The whole aim of practical politics is to keep the populace alarmed (and hence clamorous to be led to safety) by menacing it with an endless series of hobgoblins, all of them imaginary. H. L. Mencken
Children are having nightmares about their carbon footprint. What a pretty pass modern man has brought himself to! Frightening children with scary stories about hell fire is the way our ancestors drilled society into conformity. It might have been hoped that the age of science would bring all that to an end, but now we have entered the post-scientific age, in which a new class of high priest returns to the traditional methods of enforcement. In order to establish the essential fear-provoking scenario, they have nominated in the role of original sin one particular element, one atom out of the whole gamut. It is a choice that is bizarre to the rational mind, yet one that conforms to the long established principles of the founding of authoritative religions. Why is it bizarre? If you are of a mind to seek out magic and miracles look no further than the sixth member of the periodic table of elements.
The primal seed
Shortly after the discontinuity that launched the universe (if, indeed, that is the way it happened) the elementary particles came together to form the first atoms – hydrogen, helium, lithium; later beryllium, boron – and then something quite unique, an element of such startling properties that the ultimate outcome was the profound and mysterious development to which we designate the abstraction of “life”. Furthermore, that development reached such a state of advancement that it could understand the nature of that which gave it being, and then had the perversity to vilify it as the root of all evil.
Shape shifter
Even as a pure chemical, carbon exhibits a multiple personality that is quite exceptional in its variety. The soft powder that is lamp black, the amorphous stick of charcoal with which Leonardo first sketched the outline of a mysterious woman, the hardest of sparkling crystals nestling between the soft breasts of other women who changed history, yet which has been crucial to high technology, the smooth flaky centre of the draughtsman’s pencil that also lubricated the workings of his mechanical designs and the new nanostructures of unimaginable possibilities (fullerines, buckyballs, nanotubes etc.) are all chemically identical.

Solar Cycle 24 55
The promiscuous bonder
But the diversity of the pure element is as nothing compared with the infinite variety of its combination with others: for the structure of the carbon atom lends itself to a mechanism of unconstrained potential known as the covalent bond. The atom has four electrons in its incomplete outer shell and exhibits a remarkable tendency to share these with other atoms. It forms chains, both straight and branched, and rings that yield combinations of unlimited length and complexity. Compounds of the same chemical formula can have quite different structures and properties (isomers). Onto the basic carbon skeletons many other atoms can be attached by covalent bonding to create an infinite variety of compounds with an awesome range of properties.
Jekyll and Hyde
Apart from some curiosities there are two prominent oxides of carbon. One is the silent killer, while the other is the giver of life. Carbon monoxide is preferentially taken up by haemoglobin, so poisons the body and brain by depriving them of oxygen, and is the most common cause of human death by poisoning.
Carbon dioxide, in contrast is the sole source of the food chain. Every item of nutrition you consume started out as atmospheric carbon dioxide. Through the intermediary of the photoreceptor chlorophyll (a carbon compound rather like haemoglobin, but centred on magnesium rather than iron) plants trap light energy from the sun and use it to manufacture sugars from carbon dioxide and water. These sugars are then used to create the higher compounds that plants and animals need for structure and function, while also making energy available where and when it is needed.
The only experimentally proven effect of increased carbon dioxide in the air is an increase in the growth rate of plants and, in particular, crops. The gas also makes a modest contribution to making the planet habitable by the so-called greenhouse effect, though water vapour is by far the dominant factor in this life maintaining mechanism.
The founding fire of civilisation
The discovery of fire was the spark that ignited the explosive growth of civilisation. Man was surrounded by carbon, initially in the form of wood, and oxidation of carbon is highly exothermic; so the consequent liberation of energy and its subsequent control gradually made man the master of his environment rather than its slave. Up to that point technology had been based on flint knapping (to which some modern religionists seek to return). First fire gave us warmth, then the cooking of flesh, but it was the discoveries from the accidental exposure of various materials to fire that began the great technological ascent of man. Hence we were granted the boons of pottery, bricks, smelting of metals, manufacture of

Solar Cycle 24 56
glass etc. Adding carbon to iron produced steel, a workable material of extraordinary strength that produced structures and machines of previously unimaginable capability. Unfortunately, it also enabled us to kill each other more efficiently.
Energy
The gift of unlimited energy freed man from the constraints of the musculature of himself and his domesticated animals. It freed him from the confines of the cave to travel the globe and master the air.
One of the more fanciful offshoots of anticarbonism is the dream of the hydrogen economy. It is nonsense, of course. The hydrogen has to be manufactured and you have to put in more energy than you take out (there are always losses) so you have gained nothing. It is dangerous nonsense too; hydrogen being the most explosive and mobile of all the elements, able to stream through the tiniest pinhole. If you are tempted to drive around on top of a tank of hydrogen, take a look at pictures of the Hindenburg disaster. The best way to transport and store hydrogen as a fuel is to link it to carbon in the form of hydrocarbons. The paraffins, for example, are straight chains of carbon with every available link taken up by hydrogen. They are chemically unreactive (which is what their name means) yet on complete combustion they yield up all their energy and just two benign gases, carbon dioxide and water vapour.
It is carbon that grants Al Gore, for example, the means to bestride the world like a colossus in his private jet, earning more in an hour of mendacious diatribe against that which enables him to do so than most of us have to live on for a year.
Conductor of the orchestra of evolution
As the earth cooled and the oceans formed, the covalent promiscuity of carbon created a primeval soup of molecules of ever-increasing complexity. It only needed the appearance of a self-reproducing molecule, perhaps a form of RNA, for the grand progress of evolution to begin. Assemblages of molecules enhanced their capability of mutual survival and at some ill-defined stage life came into existence. Other hypotheses as to its origin are held, of course, but this one will suffice for the present argument. One of these molecules was a photoreceptor, which launched the process of converting a carbon dioxide rich planet into an oxygen rich one that was a generous host to animals and man.
The cycle of life
Before carbon was turned into a bugaboo for purposes of religious propaganda, school children learned about the carbon cycle. Carbon moves continuously between four reservoirs – the biosphere, geosphere, atmosphere and hydrosphere.

Solar Cycle 24 57
The carbon cycle provides the ideal means of recycling garbage. High temperature incineration returns carbon to the atmosphere whence it is converted back to food, the ashes being available to fertilise the soil, and as the combustion is exothermic there is a bonus of energy that can be utilised for power generation.
Almost every structure and process within the human body owes its existence to carbon. The protein collagen provides skeletal strength, chemical messengers control operations, muscles enable motion etc., all bountifully endowed by the chemistry of carbon. Nature grants each of us the loan of a stock of carbon to house that mysterious entity we call consciousness and, when the time comes, calls for its return to the eternal cycle. Each of us enjoys our term at the top of the food chain, to which we are destined to return.
KING CLAUDIUS: Now, Hamlet, where's Polonius? HAMLET: At supper. KING CLAUDIUS: At supper! where? HAMLET: Not where he eats, but where he is eaten: a certain convocation of politic worms are e'en at him. Your worm is your only emperor for diet: we fat all creatures else to fat us, and we fat ourselves for maggots: your fat king and your lean beggar is but variable service, two dishes, but to one table: that's the end. KING CLAUDIUS: Alas, alas! HAMLET: A man may fish with the worm that hath eat of a king, and cat of the fish that hath fed of that worm. KING CLAUDIUS: What dost you mean by this? HAMLET: Nothing but to show you how a king may go a progress through the guts of a beggar. William Shakespeare: Hamlet
The great coda
Of all the creation that has emerged from the extraordinary properties of the simple carbon atom, the most remarkable is the bearer of the code, deoxyribonucleic acid, DNA. It is an infinitely variable molecule of great length. The decoding of the double helix by Crick and Watson was

Solar Cycle 24 58
perhaps the pinnacle of the scientific age before it went into decline. DNA carries a four-symbol code that can completely define a structure as complex as the human body.
The pinnacle of evolution
The long trail started by those primordial giant molecules floating in the primeval soup led eventually to the human brain, a calculating machine of unfathomed potential, and with it that strange abstraction of self-awareness. For carbon chemistry led to the evolution of the neuron, not only the carrier of information around the body but also the fundamental electrical logic component that enables computation. There are a hundred billion of them in a human brain, which can thereby solve problems of great complexity, yet also mischievously think up imaginary terrors to haunt its owner.
In the stocks
In mediaeval times those who strayed from the path of correctness were put in the stocks to receive a hail of abuse, detritus and ordure. It is a curious reflection on the nature of modern man that he should choose to allocate analogous treatment to an atom; not just any atom either, but the one that is responsible for the bounty of nature. This, of course, is the whole point. When you are establishing a new religion, it is necessary to create the basic infrastructure of sacrifice, ritual and credence. Commitment comes from the combination of these three, but the greatest of these is belief. It is not sufficient to induce just any undemanding belief, such as that the sky is blue. That would require no leap of faith and therefore no devotion. If you can induce a belief that is logically insupportable, such as the reward for immolating yourself and others being eternal attendance by somewhat implausibly numerous virgins, then you have established mastery. It is then, of course, absolutely necessary to cut off other interfering sources of information, which is why the Greenies made such strenuous, if covert, efforts to occupy the commanding heights of the scientific and media establishments, from which to orchestrate a blanket censorship of alternative views.
That is the perversity of some manifestations of religion. They operate on a principle of opposites in the nomination of that which is defined as evil. The contradictions are an essential part of the mystique. Religion creates commitment by belief and then adds reinforcement by demanding sacrifice and ritual. It is in the nature of man to deny that a sacrifice, once made, has been in vain, it offends his self regard, so that each further little discomfort and inconvenience affirms the dedication. They have been with us since the dawn of human language – doomsayers, puritans, flagellants, killjoys – the deniers of contentment and the promoters of pain. Every tiny pointless gesture reinforces the commitment: turn off the stand-by light, tolerate death-dealing maggots in the garbage bin, do without the holiday, abandon fresh milk and on and on. Each gesture must involve an element of pain or discomfort and be linkable by mangled logic to the realisation of the return to the supposed stone-age paradise.

Solar Cycle 24 59
The self-appointed chief inquisitor of the atom in question is Al Gore. Armed with a towering disregard of reason, truth or evidence, he preaches the coming Armageddon with all the fervour of an Old Testament prophet. He is a reincarnation of that favourite grotesque of the mediaeval satirists, the opulent prince of the church on a magnificent progress through the land; gathering further wealth on his way and forever declaiming the eternal message of the ostentatiously and hypocritically devout to the common herd “Do as I say and not as I do!” His familiar, James Hansen, shares his shameless addiction to self-promotion, gross exaggeration and contempt for reasoned debate. He manufactures the ammunition from behind a screen of secrecy and obfuscation. Behind them is a vast army of true believers, who propagate the scriptures and, just as importantly, suppress dissent. They actively penetrate and take control of the media, scientific institutions and educational establishments, turning our schools into eco-theological madrassas, in which the traditional religious service is replaced by five minutes’ hate against the innocent butt, carbon.
The evidence
There is no scientific theory linking carbon dioxide to the “runaway” global warming that is the basis of the calamitous predictions. The contribution of the gas to the making of a comfortable planet by the greenhouse effect is well understood, modest and self-limiting. It is only turned into a terror by computer models. These are worthless; depending as they do on extensive guesswork about the ill-understood mechanisms and interactions involved in climate, and involving so many tunable parameters and feedback factors that they could produce any desired result by appropriate tweaking. A quarter of a century ago, before science came under firm bureaucratic control, such models would have been laughed out of court.
The putative experimental evidence is equally dubious. It all sounds very impressive and scary, but on close examination tends to dissolve like the morning mist in the light of the sun. It is only recently that a small troupe of volunteers with few resources has begun a serious audit of the claims. The much vaunted “high-quality” sensor network turns out to be ramshackle almost beyond belief; the processing of the data involves inapplicable methods, glaring errors and unexplained adjustments, which all mysteriously turn out to exaggerate the desired effect. There is a morbid and obsessive secrecy among the practitioners that is quite contrary to the open nature of the scientific method, which prompts the question “What have they got to hide?” Details of publicly funded “research” are kept, quite illegally, from the public who fund it; and only the claimed results, inevitably apocalyptic, are exposed. Such data that have been wrested with great difficulty from their creators almost invariably turn out to be subject to serious dubiety.
Carbon has been framed for purely political purposes.
Consequences

Solar Cycle 24 60
There are many ironies in the appointment of carbon as the epitome of original sin. Modern religious man, having made the foolish, empty gesture of turning his back on the atom that is his primal progenitor and the essence of his being, has admitted a Trojan horse that is being used to attack basic human liberties gained by centuries of struggle. Carbon-based, carbon-dioxide-exhaling politicians invent carbon taxes, carbon trading and carbon rationing; quite meaningless paper transactions that only serve to manacle the masses and (naturally) enrich those individuals with an eye to the main chance. People submit to repression and restraints of liberty that would have seemed inconceivable twenty years ago, purely because they come wrapped up in a cloak of religious conviction. They are subjected to absurd rituals without the right to dissent. They are denied access to the knowledge that could unshackle them.
Of course, carbon is not alone as an element in the periodic table that has come under politico-religious attack. Both mercury and lead, for example, have been excommunicated by the totalitarian regime in Brussels, on the basis of empty scares and monumental ignorance. That is what happens in a bureaucracy unconstrained by monitoring and criticism. In the case of lead, the consequences are dire: not only is there a threat to the entire electronics industry by the banning of solder; people are going to die because of predictable equipment failures.
The contagion also spreads to other compounds of carbon. The maggots of musca domestica, that underestimated yet deadly carrier of dangerous infections, are there in our garbage bins because of an empty scare about methane, the simplest of the paraffin series, said to be a powerful greenhouse gas, but so rare in the atmosphere that to all intents and purposes there isn’t any (0.0002% and considerably rarer than argon, neon or helium).
Envoi
So, if it is in your nature to give thanks for anything, spare a thought for the much maligned atom that is your primal ancestor and the provider of everything that you are, that you have and that keeps you alive.
Professor John Brignell Professor John Brignell held the Chair in Industrial Instrumentation at University of Southampton, United Kingdom, from 1980 to the late 1990s. Professor Brignell retired in the late 1990's from his academic career and now devotes his time to his interest in debunking the use of what he claims to be false statistics, common in much of today's media. He presents his views on his website Numberwatch, which was launched in July 2000, and is "devoted to the monitoring of the misleading numbers that rain down on us via the media. Whether they are generated by Single Issue Fanatics (SIFs), politicians, bureaucrats, quasi-scientists (junk, pseudo- or just bad), such numbers swamp the media, generating unnecessary alarm and panic.
Solar Cycle 24 61
Appendix 2 Introduction The author is a member of the Lavoisier Group, a society formed to foster rational debate in climate science. He was invited to give an address to a meeting of the society in late 2007. This address provides background to the author’s interest in climate science.
Failure to Warm
Occasional Address to the Annual General Meeting of the Lavoisier Group 22 October, 2007 I will start this address by giving thanks and making a confession. The thanks are to Bob Foster, who set me off on this journey two years ago when he asked me to contribute a paper to an edition of Energy and Environment of which he was the editor. Bob wanted me to replicate the work of Theodor Landscheidt on the influence of the planets on Earth’s climate. My mathematical ability falls well short of such a task, but it did start me down some interesting paths of enquiry. Before I discuss what I found down those paths, I will make my confession. Theodor Landscheidt’s widow had written to Bob Foster, offering to provide him with electronic copies of Theodor’s computer programmes. She lives in Waldmunchen, a little village
hard by the Czech border. I offered to Bob to travel to Germany to retrieve this precious trove of data. Precious, because Theodor Landscheidt had the best track record for predicting the timing and severity of El Nino events. For Australia this would be an enormous benefit for agricultural planning. I thought that I could combine a side trip to Waldmunchen with other business on the continent. By the time that happened, I had been beaten to the precious trove. A PhD student from Potsdam University had been given it. Potsdam University is a notorious hotbed of climate modeling activity. There is no doubt that Landscheidt’s work has been irretrievably lost. Instead of going to Germany immediately I had heard of Frau Landscheidt’s offer, I hesitated, and the fruits of Theodor Landscheidt’s prodigious intellect have now been lost to Western Civilisation. It is as if we were back in the Middle Ages, and a rare manuscript had been destroyed by the Mongol hordes. I have tried to make good that loss, at least in part, by doing original work of my own. My reward for this work, as it is for every member of the Lavoisier Society, will be in Heaven, for the Forces of Darkness control the science journals, government departments, public institutes and universities. They reward each other for concocting ever more fantastic apocalyptic visions. It is as if all the biology journals were edited by creationists. In life, we practitioners of rational science are formally recognized for our efforts in only one place - a website called De Smog Blog, which maintains a list of what it calls “climate change deniers”. I

Solar Cycle 24 62
want to be on that list, and I am not just thinking of myself in this matter. I have asked that my friend Warwick Hughes also be listed. Now I will speak of what I have found in the field of climate science, and you will be the judge of whether or not I deserve to be included in De Smog Blog’s list. I believe that I have made two useful contributions to the field, one of which is original. The first is my prediction that a very weak Solar Cycle 24 will make the second decade of the 21st century a very cold one. Others solar-driven predictions of cold decades to come have started with Solar Cycle 25, or another three decades out in mid-century. My work says that cold weather for the mid-latitudes is upon us now. The basis for that prediction is simply this. There is one set of solar physicists who have correlated past solar cycles with the temperature record, and there is another set of solar physicists who look forward to predict solar activity. I simply applied the calibration provided by the former set to the predictions made by the latter set. Very simple indeed, but nobody had done that before. Here’s what the data looks like. Solar Cycles 4 and 5, in the early 19th century, were very weak. This was also a period of cold temperatures globally called the Dalton Minimum. This might just be a coincidence, but the correlation between solar cycle length and temperature is very strong over at least the last three hundred years, as shown in my work on the data from De Bilt in the Netherlands. It is also shown in the work by Butler and Johnson on 200 years of Armagh data. They in turn were replicating the original observation of this relationship by Friis-Christensen and Lassen. At Armagh, a thirteen year long solar cycle 23 would result in a 1.6 degree decline
in temperature. This effect is upon us right now. In a few short years, we will have a reversal of the warming of the 20th century. Now let’s look at predictions of the amplitude of Solar Cycle 24. In early 2007, these ranged from 40 to 170. NASA subsequently came out with two predictions – one of 140 and one of 90, straddling the result of Solar Cycle 23. The more predictions NASA make, the more chance they have of being right. The scientist with the greatest credibility in this field is Ken Schatten. His methodology sums the field strengths of the Sun’s toroidal and poloidal magnetic fields. He calls this the Solar Dynamo Index. It has been in a steep downtrend since the early 1990s. The amount of magnetic force available to make sunspots is declining. At its simplest, the relationship between the solar magnetic field strength and the Earth’s climate is this: lower magnetic field strength means few sunspots, fewer sunspots means less solar wind, less solar wind means more galactic cosmic rays, more galactic cosmic rays means more low level cloud formation, more low level clouds means more sunlight reflected back into space, which in turn means less heating of the Earth’s surface and atmosphere. When Bob Foster originally set me upon my task, I remember saying to him that I didn’t think that climate is a random walk. And I have demonstrated that it isn’t. If you can find a solar physicist who will make a prediction of solar activity, you can use that to make a prediction of climate. That prediction will be good for perhaps twenty-five years out.
Solar Cycle 24 63
We are all aware that the Forces of Darkness have concocted a range of apocalyptic visions of the future, and have used those visions to try to force us to have cold showers, amongst other things. As it turns out, my climate prediction is even more apocalyptic, and more immediate, than those of the Forces of Darkness. Let’s look at the effect on Canadian grain production, as an example. My work, first published in Energy and Environment last year, predicts a two degree decline in annual average temperature for the mid-latitudes, equating to the experience of the Dalton Minimum. The Spring Wheat growing regions of the Canadian Prairies conform to the areas in which the July daily average temperatures are in the range of 16 to 20 degrees centigrade. A two degree decline in temperature will halve the growing area, with production going from 22 million tonnes per annum to perhaps 10 million tonnes per annum. Similar effects can be expected through Russia and into northern Europe. In theological terms, the global warming belief system is a reversion to animism. It is like the Old Testament story of Moses going out into the desert and coming back to find the Israelites worshipping a golden calf. We on the rational side of science know to worship a higher god – the Sun. I, for one, examine its auguries on a daily basis, specifically looking for the first sunspot of Solar Cycle 24. If Solar Cycle 23 was a normal cycle, 10.7 years long, then we would have seen the first sunspot of Solar Cycle 24, at a high latitude and with reversed polarity, in January 2006 and solar minimum would have been in January 2007.
As at the date of this Annual General Meeting, no such sunspot has been seen, which means that the month of solar minimum will be in October 2008, or later. My estimate is that the month of solar minimum will be July 2009. Each day’s delay in the onset of Solar Cycle 24 means that the world will be two thousands of a degree cooler during that cycle. That doesn’t sound like much, but days become weeks, which run into months, and then years, and each year of delay is good for a 0.7 degree decline in temperature. If you are expecting three years of delay, as I am, that amounts to over two degrees. For we few, we happy few of the Lavoisier Society, our immediate thought is of how we are going to adjust to longer ski seasons. Less fortunate people will be spending more time staring out through frosty windows onto the barren wastelands of their frozen fields, wondering when Spring will come. We on the rational side of science now have our own belief system. That is very important when you are battling a theological menace. Of the Christian leaders in Australia, only Cardinal Pell has recognized global warming alarmism as a reversion to animism, and is thus a competing religion. Other church leaders have tried to incorporate global warming into their belief system, not realizing that it will eat them up. My second contribution to climate science was to examine in detail the warming effect of atmospheric carbon dioxide. It is well known that the 380 ppm of carbon dioxide in the atmosphere makes it about three degrees warmer than it would otherwise be. To a casual observer, it looks like the relationship is 100 ppm of carbon dioxide equating to one degree of warming. On that basis, temperature

Solar Cycle 24 64
would move up in lockstep with carbon dioxide and we are all going to fry, apart from those who will drown first due to the melting of the Greenland ice sheet. Examination of the carbon dioxide – temperature relationship using the MODTRAN facility, maintained by the University of Chicago, demonstrates that it is strongly logarithmic. Lo and behold, the first 20 ppm is good for half of all the warming effect to this point. By the time you get to our current atmospheric concentration, each 100 ppm increase is only worth 0.1 of a degree. This isn’t much, in fact it is almost next to nothing. To the end of time, and let’s call that 1,000 ppm of carbon dioxide in the atmosphere, which might take three hundred years from here, the total effect might be good for 0.4 degrees. It is hard to get excited or concerned about such a number. It is swamped by natural variability, for example the two degree temperature range of the 20th century, and the two degree temperature fall to come over the next decade. To any animists in attendance at our AGM, I will now offer a theory that incorporates Gaia to explain the role of humans in helping to maintain life on this planet. One hundred and fifty million years ago the carbon dioxide level in the atmosphere was almost ten times what its pre-industrial level was, and more than ten times the 180 ppm that carbon dioxide got down to during the ice ages of the last one million years. There has been a lot of research done demonstrating the effect of high carbon dioxide levels in enhancing plant growth, and we will get to that. There also has been research on the effect of artificially low levels of carbon dioxide on plant growth. This research shows that 180 ppm is about the lower limit at which plants can grow and reproduce
themselves. The fact that levels didn’t get below 180 ppm during glacial periods may be due to the fact that terrestrial vegetation was struggling to grow at that level. If plants were doing climate science, instead of we humans, they would be looking at that 90% decline in atmospheric carbon dioxide over 150 million years and conclude that they were facing imminent extinction, and so it might have been. For the plant kingdom, the ice ages came along just in time to accelerate human evolution and get a lot of buried carbon back into the atmosphere where it came from. Catastrophe has been averted by the hand of Gaia in bringing on the ice ages. It is therefore quite evident that the true purpose of mankind in being responsible custodians of this planet is to get as much carbon into the atmosphere as we possibly can. It is not commonly known that the Earth’s original atmosphere was 20% carbon dioxide, which is 200,000 ppm. Over the last two billion years, almost all the carbon that was bound to each oxygen molecule currently in the atmosphere has been stripped off by photosynthesis and buried in sediments, either as carbon or bound up in carbonates. Humankind will only be able to get about half a percent of that carbon back into the atmosphere before we will run of out rocks we can economically burn. And we should burn them. Plant growth responds dramatically to higher atmospheric carbon dioxide. It is the best thing that the developed world can do for the third world. Giving the third world higher atmospheric carbon dioxide is like giving them free phosphate fertilizer. And my prediction for the Canadian wheat crop suggests that the developed
Solar Cycle 24 65
world will need all the help it can get from higher levels of atmospheric carbon dioxide also. Now the fact that higher atmospheric carbon dioxide levels are wholly beneficial to life on this planet leads us to the strange notion of clean coal technology. The Forces of Darkness want us to adopt this technology in order to reduce emissions of carbon dioxide into the atmosphere from whence it came. This notion is strange at a number of levels. Firstly, it is very hard to keep carbon dioxide in the subsurface. It is very soluble in water, and thus the popularity of soda water. There are almost no naturally occurring fields of carbon dioxide, because it is so soluble, as compared to natural gas fields. The burial of carbon dioxide will be difficult enough, but getting it there will be even more inane. The energy required to strip carbon dioxide from the exhaust stream of power stations will come from the burning of more coal, and coal consumption will increase by 30% to 50%, or perhaps more, per unit of electricity produced. So this is a proposition which will halve the economic life of the world’s coal reserves. You might expect in a normal world that a proposal to double power costs and halve the economic life of our coal reserves might have some rigorous scientific examination associated with it. But there has been none. Relative to the scale of the impoverishment being attempted, and the squandering of our natural endowment, none whatsoever. All the institutions which should be guarding us against the climate change rent seekers and carpetbaggers have abrogated their responsibility. The worst, and by this I mean the CSIRO, are actively conniving against the interests of the Australian people. Our largest companies have become rent seekers, promoting their
version of clean coal technology. This perverse ideology has corrupted so many. The money changers are in the temple. The story now gets even more bizarre, because all the wailing from the CSIRO and others is in the face of a temperature that has not changed. The trend is flat. Antarctica has cooled appreciably over the same period. In the Northern Hemisphere, the United States and Greenland were both warmer in the 1930s than they are now. The ability to believe in global warming in the face of a failure to warm, proving that theory wrong, demonstrates an enormous capacity for self-delusion. While Australia is badly afflicted by global warming self-delusion, it is even worse in Europe, for there, strange ideologies have slaughtered tens of millions over the last seventy years. You might have thought that those painful experiences would have inoculated the Europeans against misanthropic ideologies, but not so, and they will suffer also, with that suffering made yet more bitter by longer winters. In this quote, Winston Churchill warned of the perverted science of national socialist ideology: “the whole world, including the United States, including all that we have know and cared for, will sink into the abyss of a new Dark Age, made more sinister, and perhaps more protracted, by the lights of perverted science” Sir Winston Churchill, 4th June, 1940. It is just as applicable today to the perverted science of global warming. Global warming alarmism has been compared to the Y2K scare. I think that a more apposite analogy is the internet bubble on the

Solar Cycle 24 66
world’s stockmarkets. In that bubble, tens of thousands of the world’s most intelligent and highly paid people succumbed to a mass hysteria. That bubble ended in tears, but the current global warming alarmism is causing real suffering, even in the fartherest reaches of darkest Africa, where subsistence farmers are being displaced for the planting of carbon offset forests.
I believe that the Lavoisier Society was formed so that we as a group could do what we can to protect the Australian people from the suffering that all our political leaders want to impose upon us for no good reason, while squandering our birthright in the process. We must not resile from that task, nor falter, or fall beside the wayside. For without us, the Australian people have no prospect of being spared the depredations of that perverted science. As I said earlier in this address, we will get no thanks in this life, but Australians as yet ungotten, and unborn, will have cause to thank us.

Solar Cycle 24 67
Praise from Professors for Solar Cycle 24 Professor Folke Stenman, Professor of Physics at University of Helsinki 1970-2003 I must say your argumentation is among the most convincing and beautifully distilled down to bare facts I have come upon in the present mess of IPCC-dominated "science" (to which most of our local politicians vigorously subscribe). Professor Ian Plimer, School of Earth & Environmental Sciences at the University of Adelaide, South Australia Keep up the good work. Professor Bob Carter, Marine Geophysical Laboratory, James Cook University, Queensland This is a very, very useful paper indeed.
About the Author David Archibald is a Perth, Australia-based scientist operating in the fields of climate science, cancer research and oil exploration. He has published several technical papers on the role of solar cycles in climate. His initial climate paper in 2006 popularised monitoring sunspot cycles as a climate prediction tool. All profits from this book will be directed to cancer research. About Solar Cycle 24 This book details how the Sun, not carbon dioxide, controls climate and predicts a significant cooling for the next two decades. At the same time, the heating effect of carbon dioxide will be minuscule. Combined with its positive effect on plant growth, increased atmospheric carbon dioxide is shown to be wholly beneficial. It is estimated that the carbon taxes proposed for Australia will cost 1.1 million jobs. This book shows that only are these taxes exactly wrong in science, we should be doing all we can to increase carbon dioxide in the atmosphere.