Embed Size (px)
Citation preview
SOLAR COOLING TECHNOLOGIESS SRINIVASA MURTHYS. SRINIVASA MURTHY
Professor of Refrigeration & Clean Energy [email protected]
India - Spain Workshop on Renewable Energies Sevilla (Spain) M h 1 4 2011March, 1-4, 2011
Dirección General de Cooperación InternacionalDepartment of Science & Technology
Department of Mechanical EngineeringIndian Institute of Technology Madras
pp gy
gyChennai India
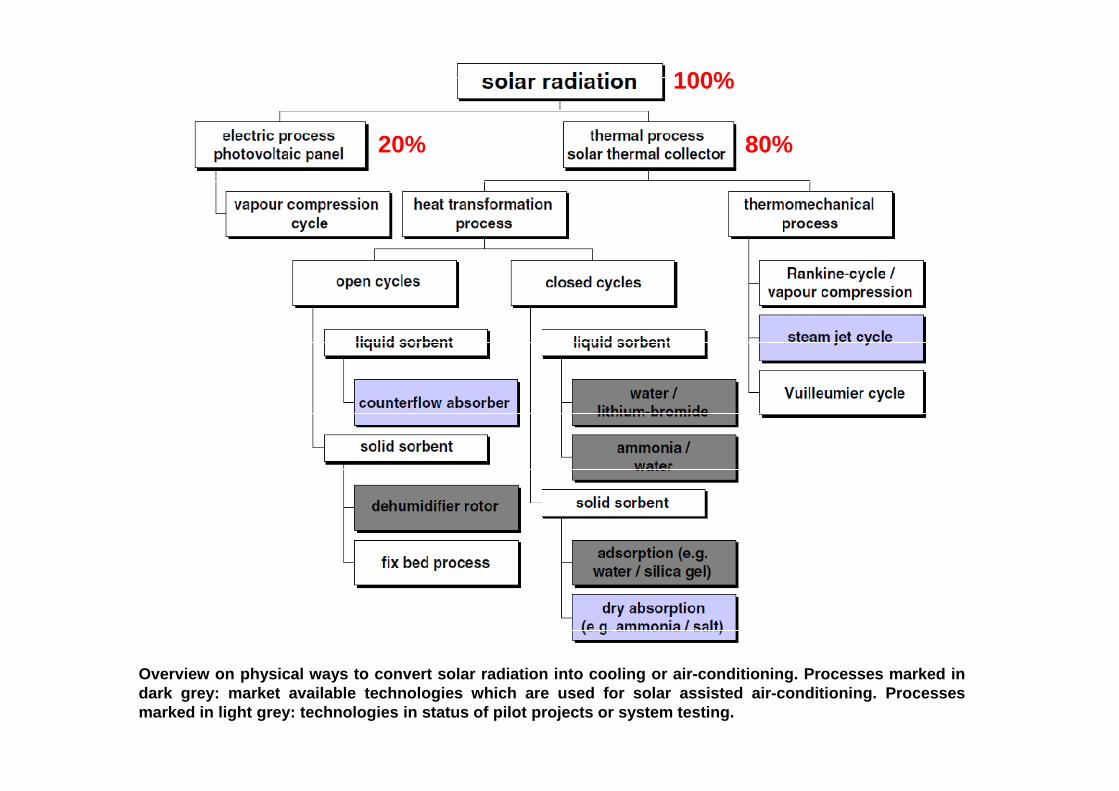
100%
20% 80%
Overview on physical ways to convert solar radiation into cooling or air-conditioning. Processes marked indark grey: market available technologies which are used for solar assisted air-conditioning. Processesmarked in light grey: technologies in status of pilot projects or system testing.
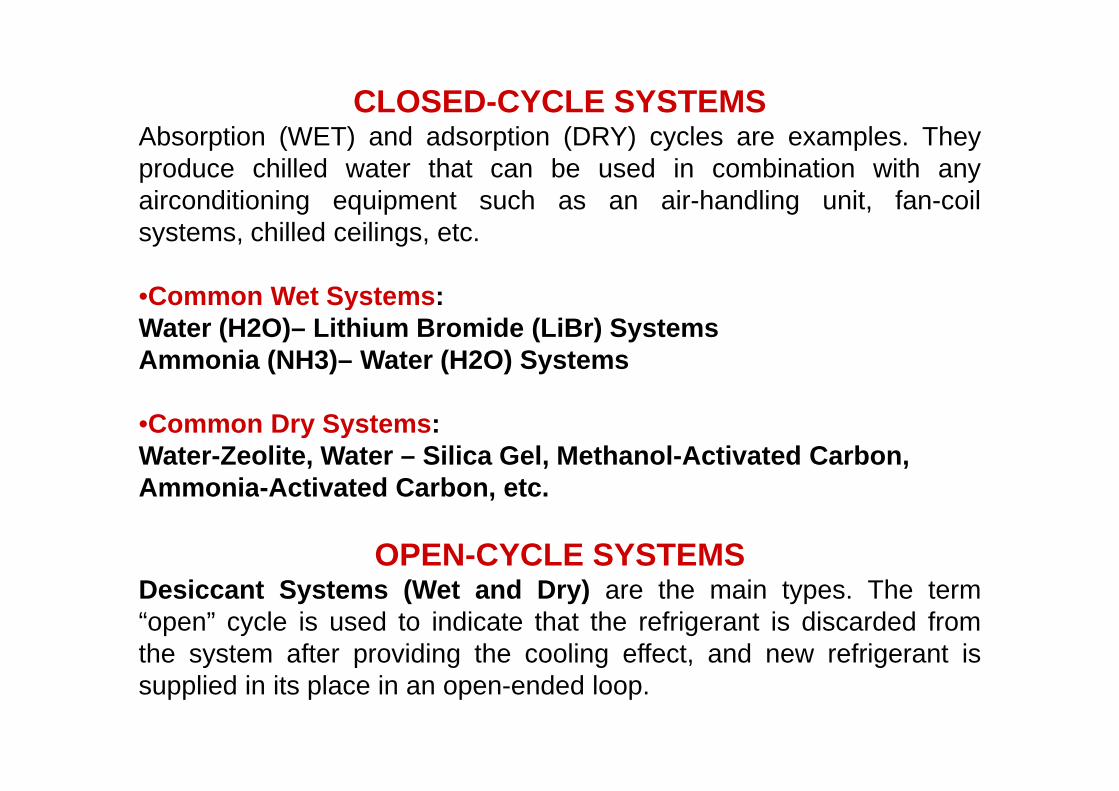
CLOSED-CYCLE SYSTEMS( ) ( )Absorption (WET) and adsorption (DRY) cycles are examples. They
produce chilled water that can be used in combination with anyairconditioning equipment such as an air-handling unit, fan-coilsystems, chilled ceilings, etc.
•Common Wet Systems:yWater (H2O)– Lithium Bromide (LiBr) SystemsAmmonia (NH3)– Water (H2O) Systems
•Common Dry Systems:Water-Zeolite, Water – Silica Gel, Methanol-Activated Carbon, Ammonia Activated Carbon etcAmmonia-Activated Carbon, etc.
OPEN-CYCLE SYSTEMSDesiccant Systems (Wet and Dry) are the main types. The term“open” cycle is used to indicate that the refrigerant is discarded fromthe system after providing the cooling effect, and new refrigerant isy p g g , gsupplied in its place in an open-ended loop.
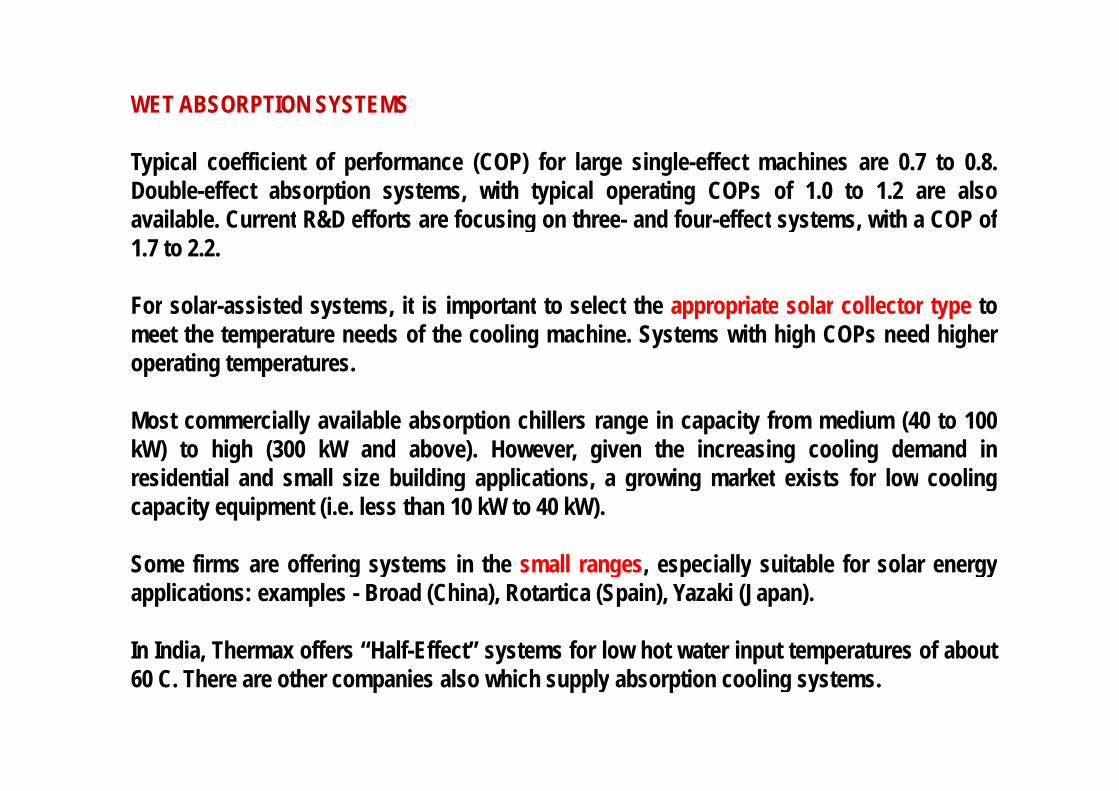
WET ABSORPTION SYSTEMS
Typical coefficient of performance (COP) for large single-effect machines are 0.7 to 0.8.Double-effect absorption systems, with typical operating COPs of 1.0 to 1.2 are alsoavailable Current R&D efforts are focusing on three and four effect systems with a COP ofavailable. Current R&D efforts are focusing on three- and four-effect systems, with a COP of1.7 to 2.2.
For solar assisted systems it is important to select the appropriate solar collector type toFor solar-assisted systems, it is important to select the appropriate solar collector type tomeet the temperature needs of the cooling machine. Systems with high COPs need higheroperating temperatures.
Most commercially available absorption chillers range in capacity from medium (40 to 100kW) to high (300 kW and above). However, given the increasing cooling demand inresidential and small size building applications, a growing market exists for low coolingresidential and small size building applications, a growing market exists for low coolingcapacity equipment (i.e. less than 10 kW to 40 kW).
Some firms are offering systems in the small ranges, especially suitable for solar energyg y g , p y gyapplications: examples - Broad (China), Rotartica (Spain), Yazaki (Japan).
In India, Thermax offers “Half-Effect” systems for low hot water input temperatures of about60 C. There are other companies also which supply absorption cooling systems.
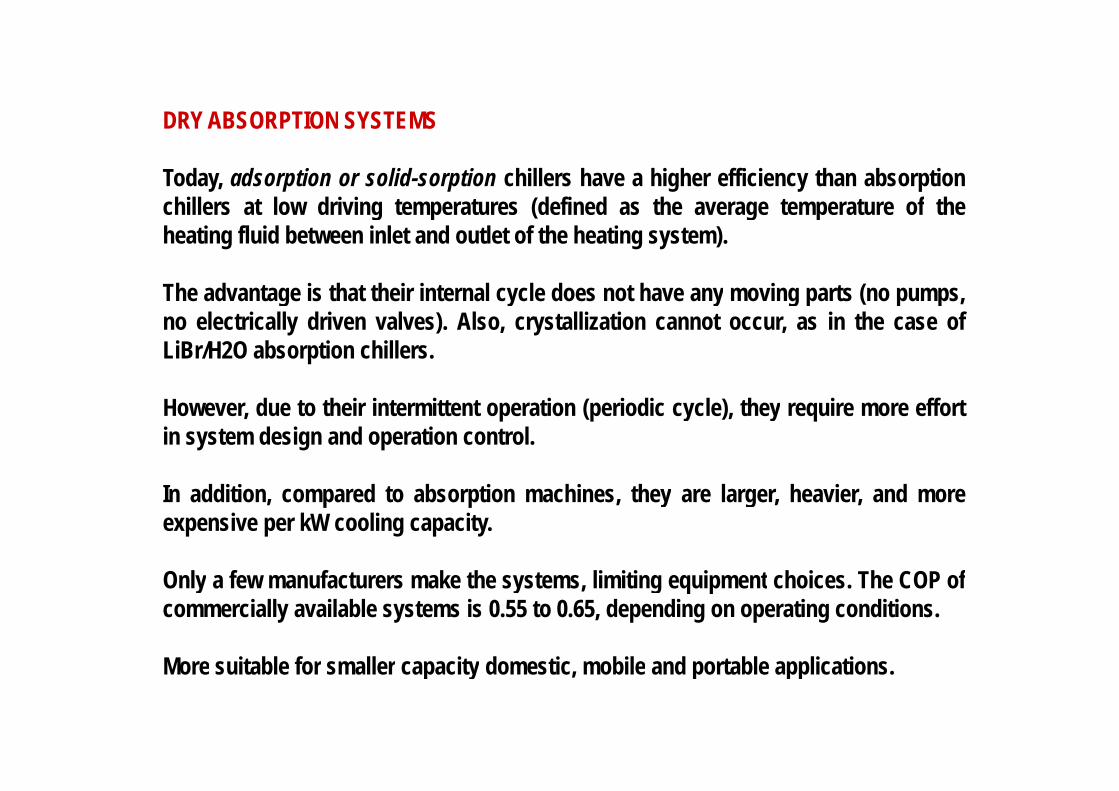
DRY ABSORPTION SYSTEMSDRY ABSORPTION SYSTEMS
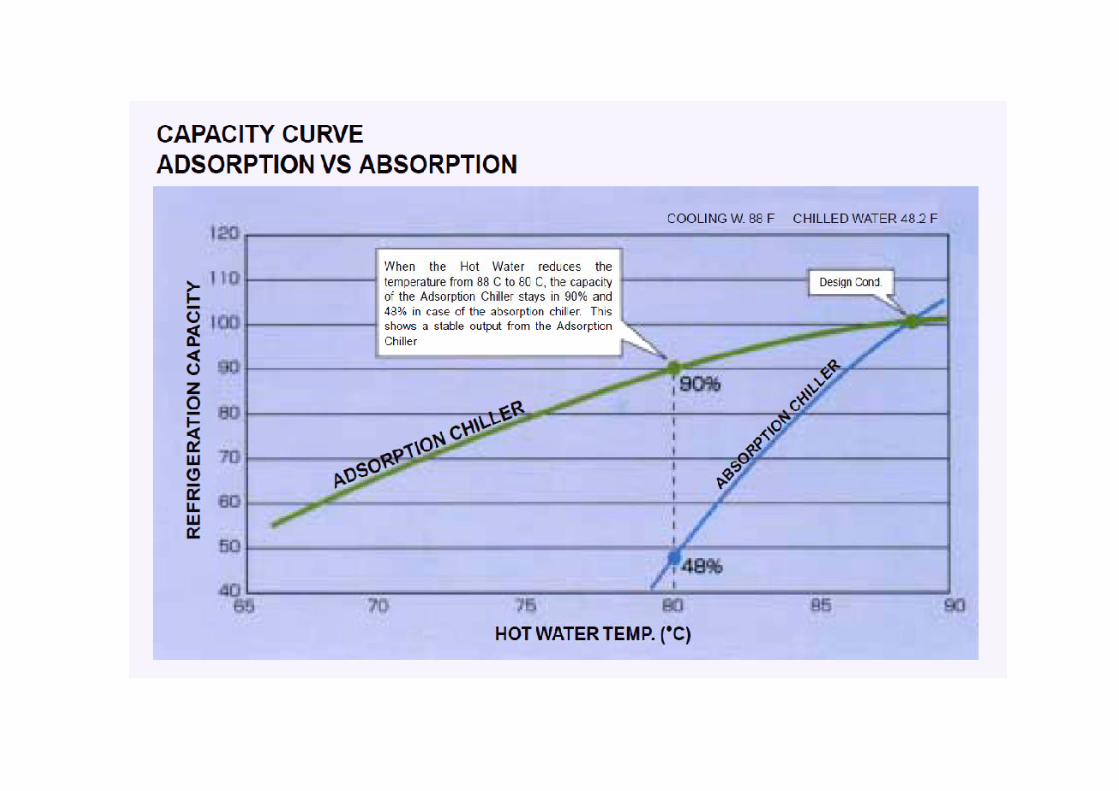
Today, adsorption or solid-sorption chillers have a higher efficiency than absorptionchillers at low driving temperatures (defined as the average temperature of theg p ( g pheating fluid between inlet and outlet of the heating system).
The advantage is that their internal cycle does not have any moving parts (no pumps,g y y g (no electrically driven valves). Also, crystallization cannot occur, as in the case ofLiBr/H2O absorption chillers.
However, due to their intermittent operation (periodic cycle), they require more effortin system design and operation control.
I dditi d t b ti hi th l h i dIn addition, compared to absorption machines, they are larger, heavier, and moreexpensive per kW cooling capacity.
O l f f t k th t li iti i t h i Th COP fOnly a few manufacturers make the systems, limiting equipment choices. The COP ofcommercially available systems is 0.55 to 0.65, depending on operating conditions.
More suitable for smaller capacity domestic mobile and portable applicationsMore suitable for smaller capacity domestic, mobile and portable applications.
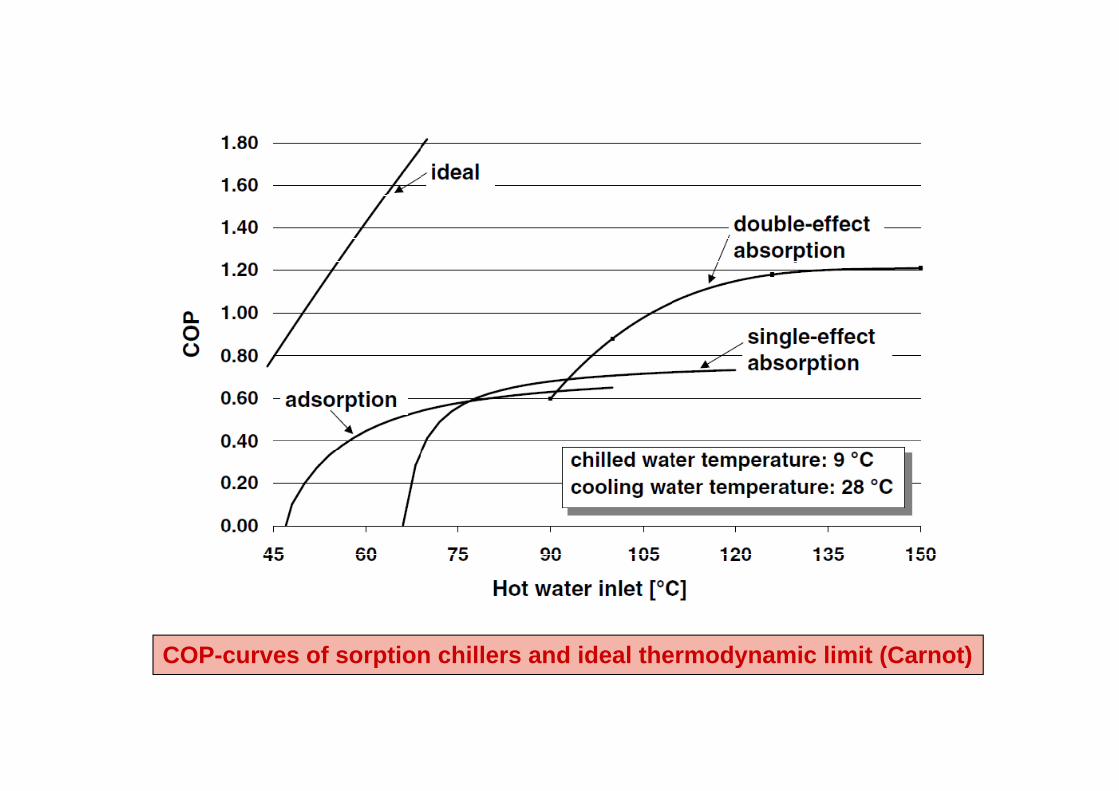
COP-curves of sorption chillers and ideal thermodynamic limit (Carnot)p y ( )
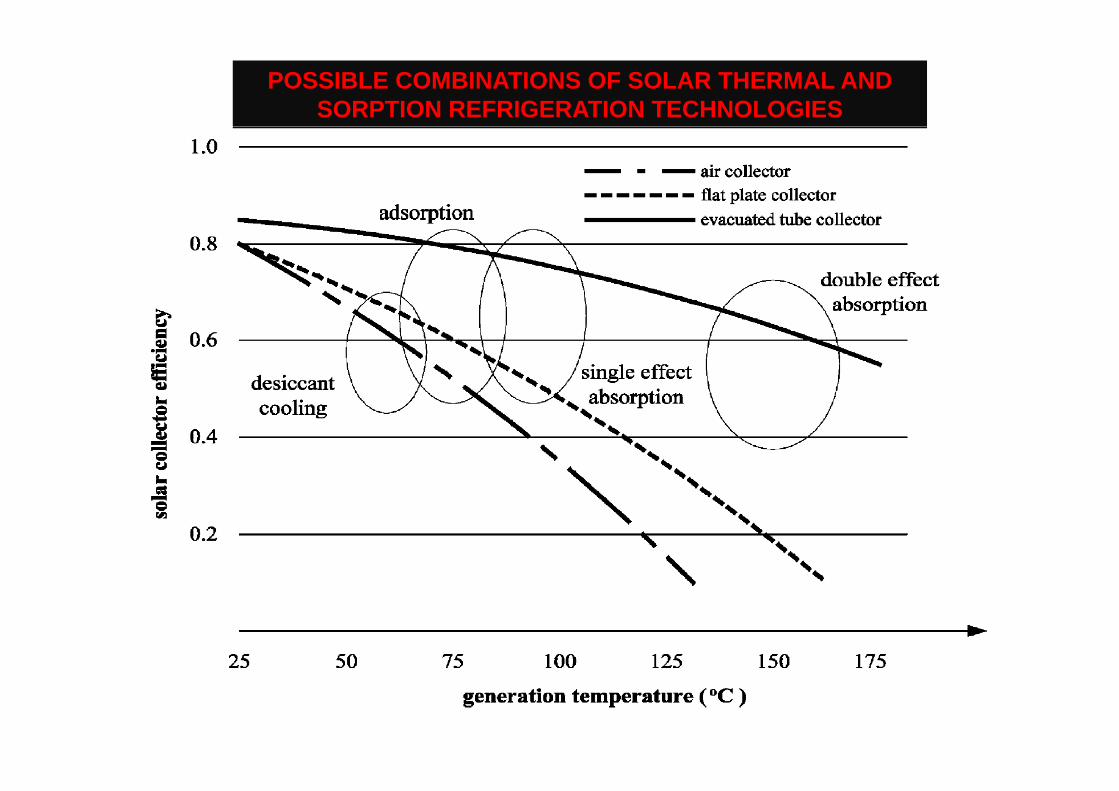
POSSIBLE COMBINATIONS OF SOLAR THERMAL AND SORPTION REFRIGERATION TECHNOLOGIES
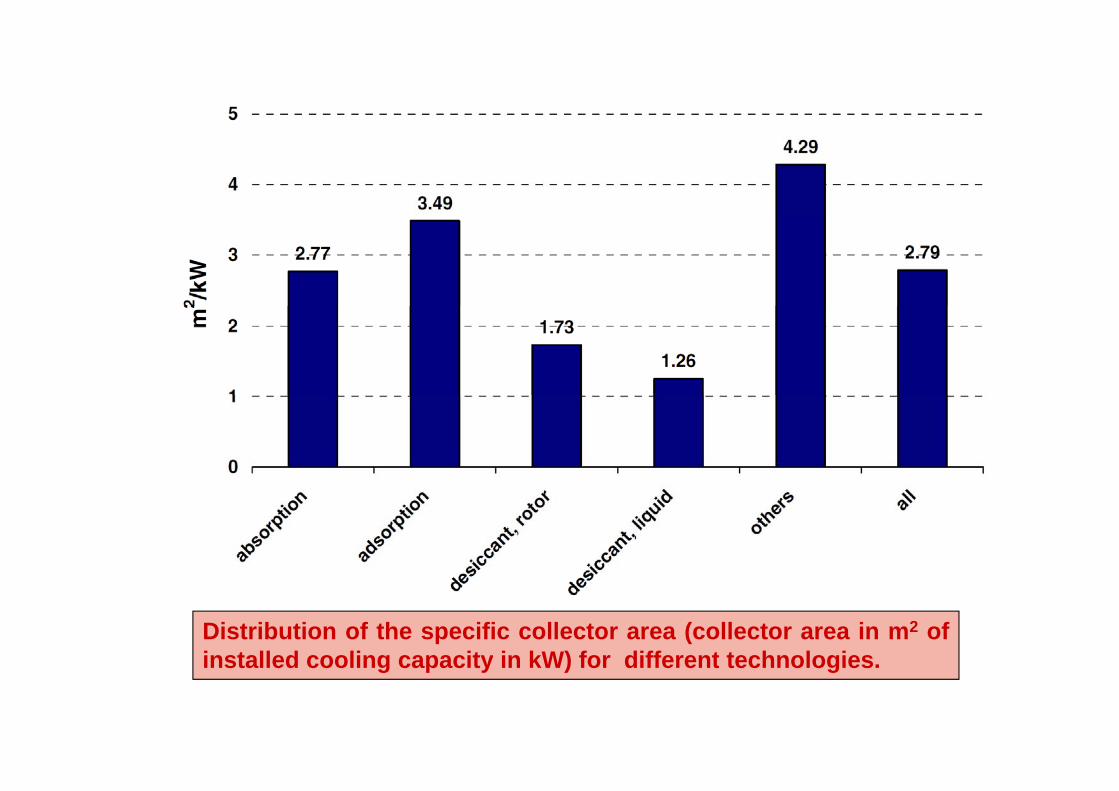
Distribution of the specific collector area (collector area in m2 ofinstalled cooling capacity in kW) for different technologies.installed cooling capacity in kW) for different technologies.
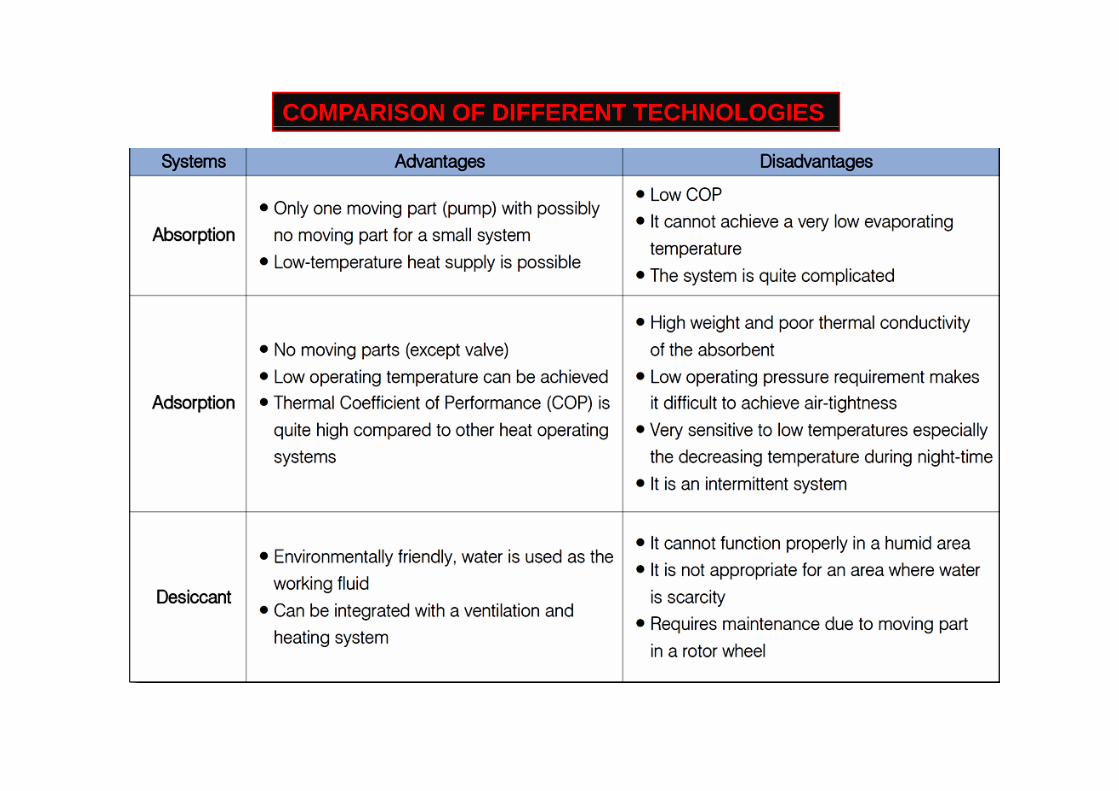
COMPARISON OF DIFFERENT TECHNOLOGIES
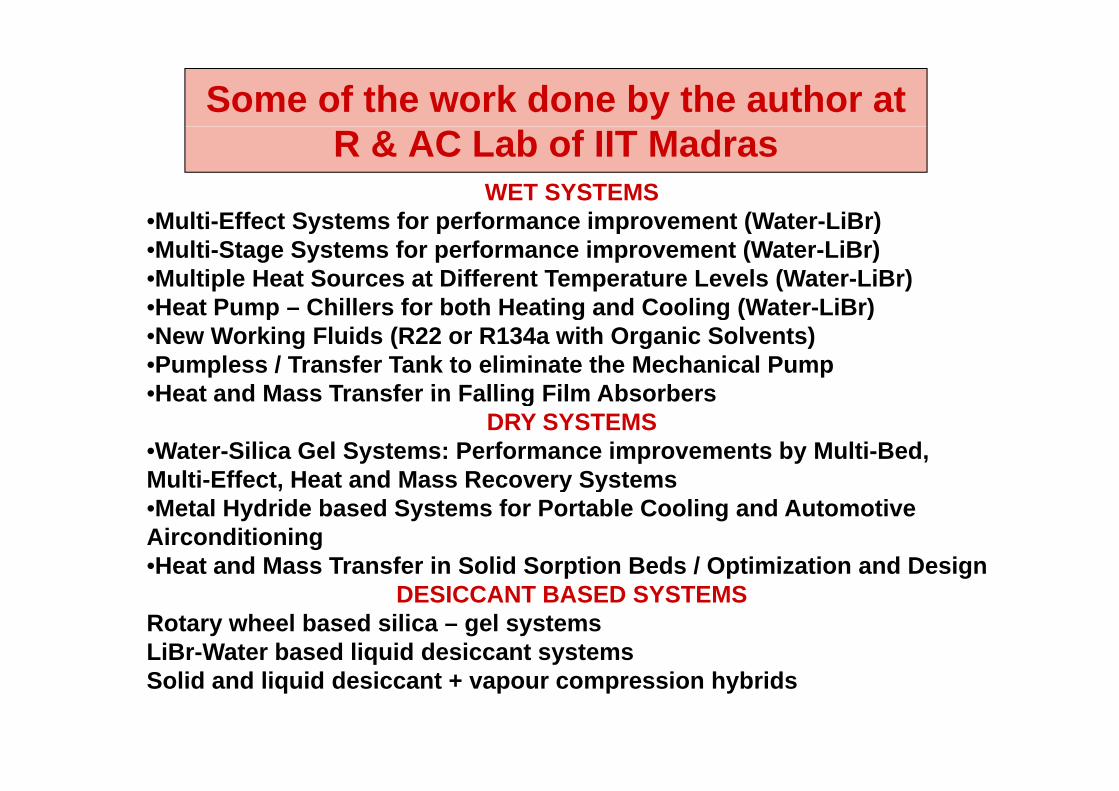
Some of the work done by the author at R & AC Lab of IIT Madras
WET SYSTEMSM lti Eff t S t f f i t (W t LiB )•Multi-Effect Systems for performance improvement (Water-LiBr)
•Multi-Stage Systems for performance improvement (Water-LiBr)•Multiple Heat Sources at Different Temperature Levels (Water-LiBr)•Heat Pump Chillers for both Heating and Cooling (Water LiBr)•Heat Pump – Chillers for both Heating and Cooling (Water-LiBr)•New Working Fluids (R22 or R134a with Organic Solvents)•Pumpless / Transfer Tank to eliminate the Mechanical Pump•Heat and Mass Transfer in Falling Film Absorbers•Heat and Mass Transfer in Falling Film Absorbers
DRY SYSTEMS•Water-Silica Gel Systems: Performance improvements by Multi-Bed, Multi-Effect, Heat and Mass Recovery SystemsMulti Effect, Heat and Mass Recovery Systems•Metal Hydride based Systems for Portable Cooling and Automotive Airconditioning•Heat and Mass Transfer in Solid Sorption Beds / Optimization and Designp p g
DESICCANT BASED SYSTEMSRotary wheel based silica – gel systemsLiBr-Water based liquid desiccant systemsySolid and liquid desiccant + vapour compression hybrids
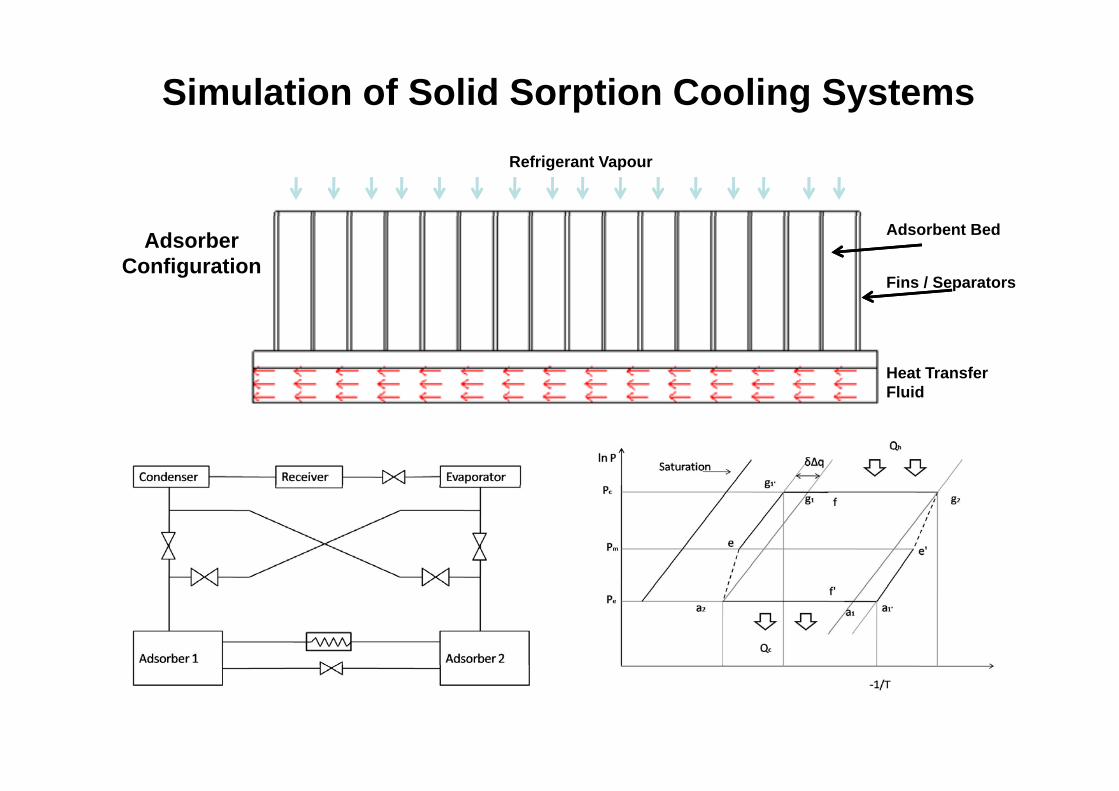
Simulation of Solid Sorption Cooling SystemsRefrigerant Vapour
Fins / Separators
Adsorbent BedAdsorberConfiguration
Heat TransferFluidFluid
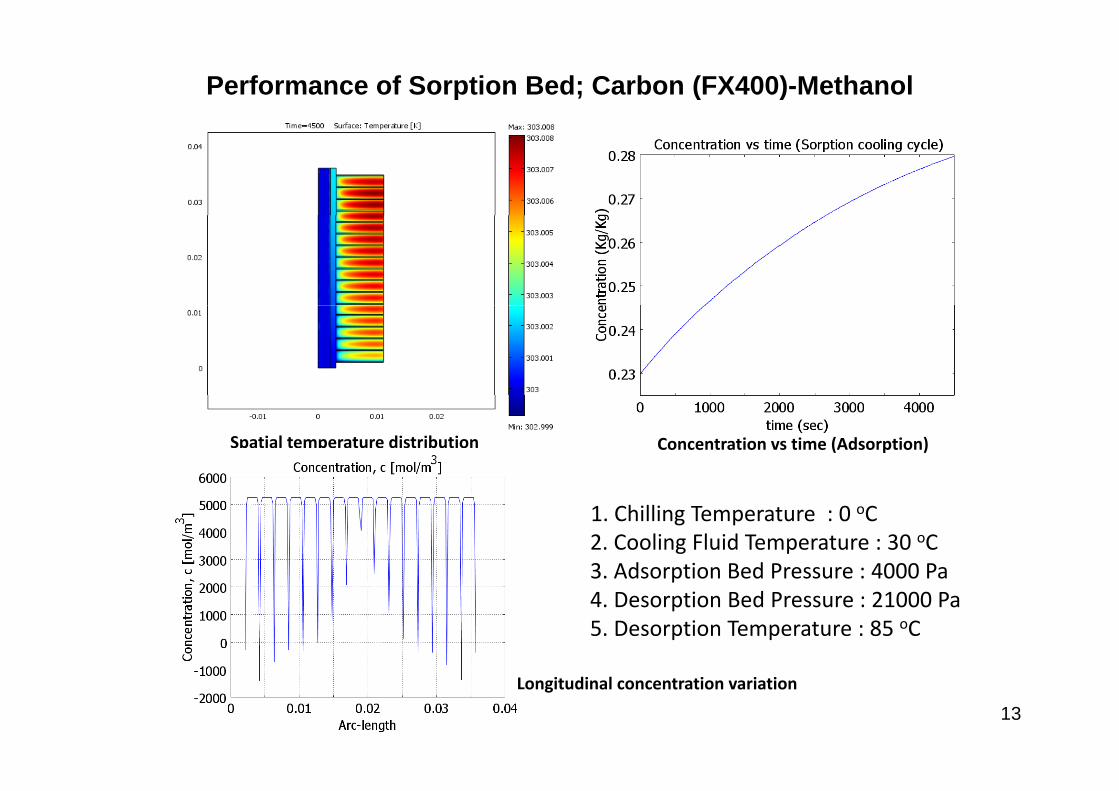
Performance of Sorption Bed; Carbon (FX400)-Methanol
Spatial temperature distribution Concentration vs time (Adsorption)
1. Chilling Temperature : 0 oC 2. Cooling Fluid Temperature : 30 oC3 Adsorption Bed Pressure : 4000 Pa3. Adsorption Bed Pressure : 4000 Pa4. Desorption Bed Pressure : 21000 Pa5. Desorption Temperature : 85 oC
13Longitudinal concentration variation
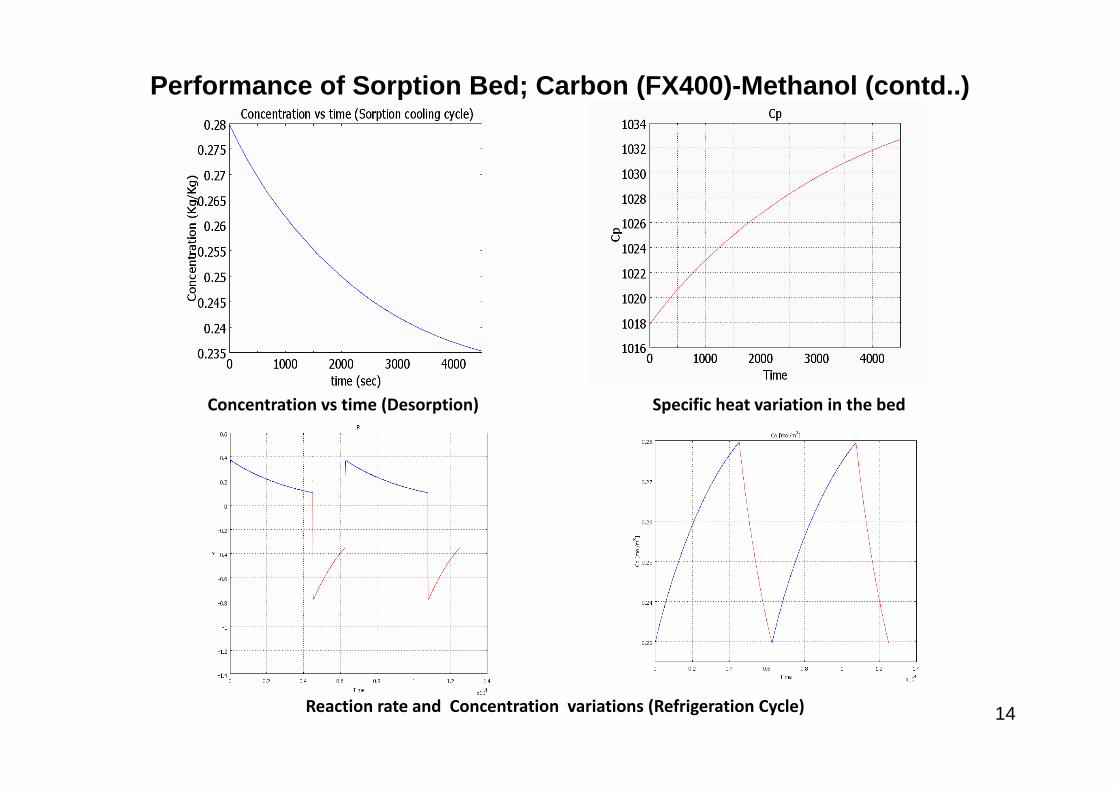
Performance of Sorption Bed; Carbon (FX400)-Methanol (contd..)
Concentration vs time (Desorption) Specific heat variation in the bed
14Reaction rate and Concentration variations (Refrigeration Cycle)
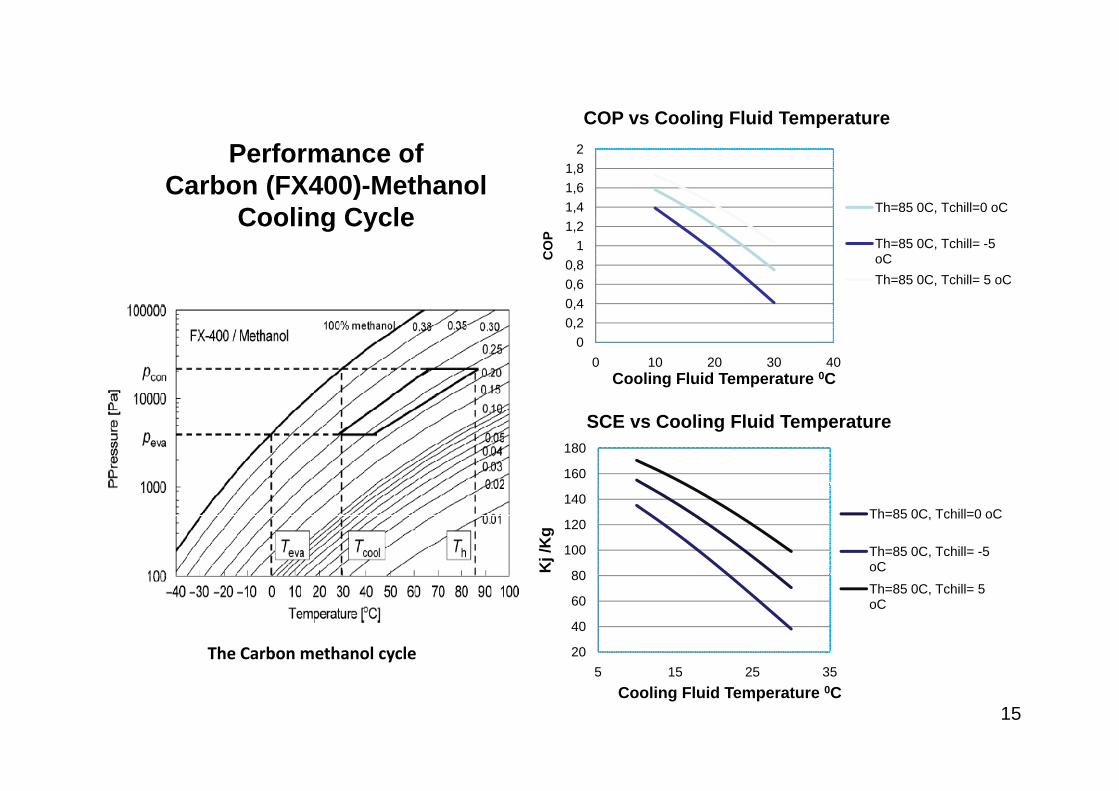
COP vs Cooling Fluid Temperature
1,41,61,8
2
g p
Th=85 0C, Tchill=0 oC
Performance of Carbon (FX400)-Methanol
Cooling Cycle
0 40,60,8
11,2
CO
P Th=85 0C, Tchill= -5 oCTh=85 0C, Tchill= 5 oC
Cooling Cycle
00,20,4
0 10 20 30 40Cooling Fluid Temperature 0C
160
180
SCE vs Cooling Fluid Temperature
80
100
120
140
Kj /
Kg
Th=85 0C, Tchill=0 oC
Th=85 0C, Tchill= -5 oC
20
40
60
80Th=85 0C, Tchill= 5 oC
The Carbon methanol cycle
15
5 15 25 35Cooling Fluid Temperature 0C
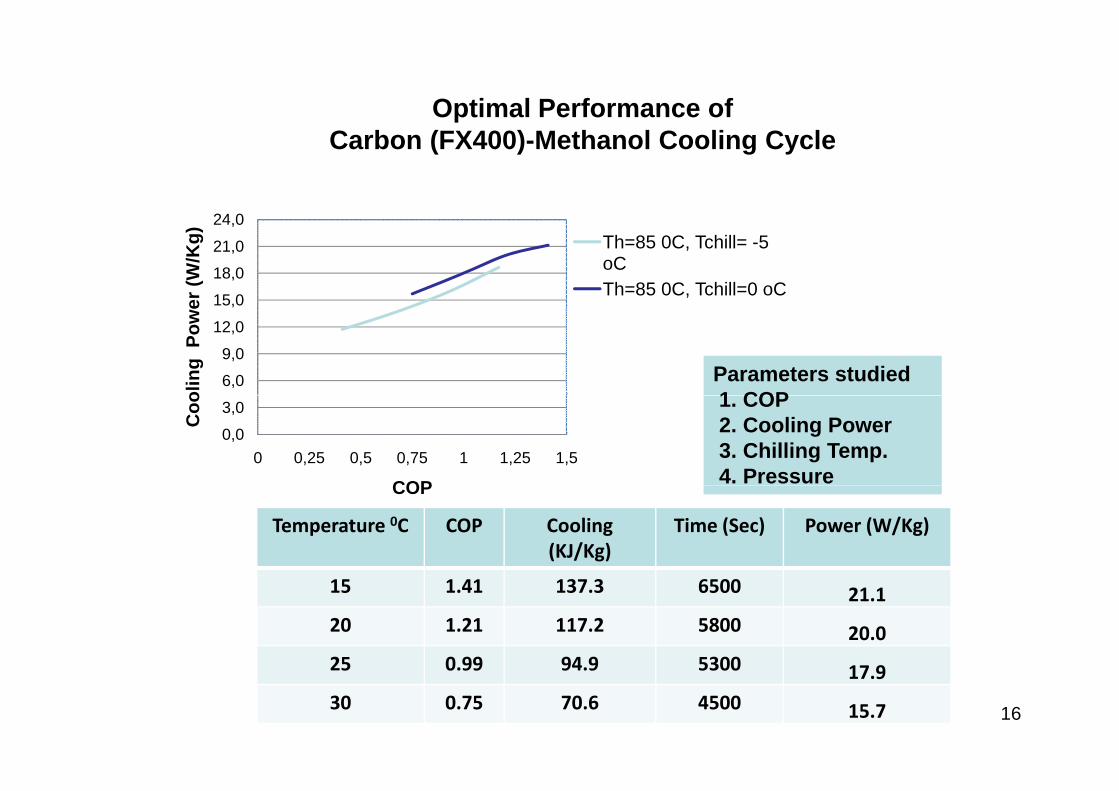
Optimal Performance of
24 0
Carbon (FX400)-Methanol Cooling Cycle
15,0
18,0
21,0
24,0er
(W/K
g) Th=85 0C, Tchill= -5 oCTh=85 0C, Tchill=0 oC
6,0
9,0
12,0
,
olin
g P
owe
Parameters studied1 COP
0,0
3,0
0 0,25 0,5 0,75 1 1,25 1,5
Coo
COP
1. COP2. Cooling Power3. Chilling Temp.4. PressureCOP
Temperature 0C COP Cooling (KJ/Kg)
Time (Sec) Power (W/Kg)
15 1.41 137.3 6500 21.120 1.21 117.2 5800 20.025 0 99 94 9 5300
16
25 0.99 94.9 5300 17.930 0.75 70.6 4500 15.7
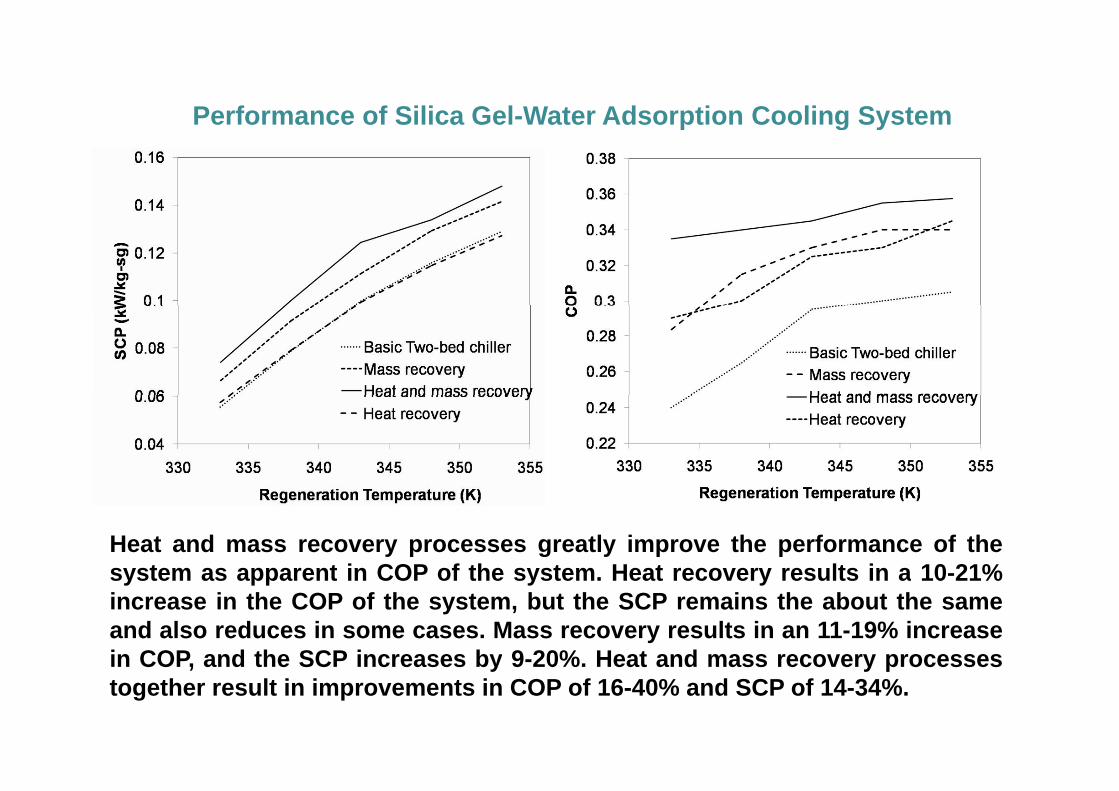
Performance of Silica Gel-Water Adsorption Cooling Systemp g y
Heat and mass recovery processes greatly improve the performance of thesystem as apparent in COP of the system Heat recovery results in a 10-21%system as apparent in COP of the system. Heat recovery results in a 10-21%increase in the COP of the system, but the SCP remains the about the sameand also reduces in some cases. Mass recovery results in an 11-19% increasein COP, and the SCP increases by 9-20%. Heat and mass recovery processesin COP, and the SCP increases by 9 20%. Heat and mass recovery processestogether result in improvements in COP of 16-40% and SCP of 14-34%.
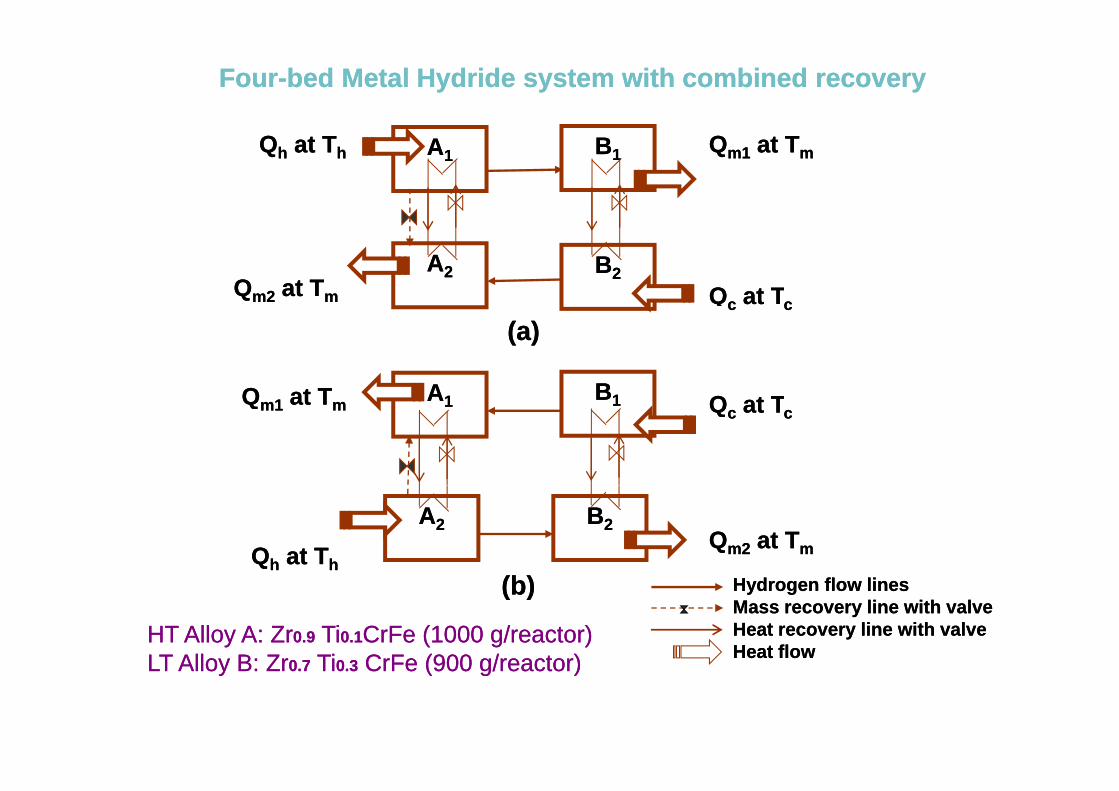
FourFour--bed bed Metal Hydride system Metal Hydride system with combined recoverywith combined recovery
AA11 BB11QQhh at Tat Thh QQm1m1 at Tat Tmm
AA22 BB22QQcc at Tat Tcc
QQm2m2 at Tat Tmm
AA11 BB11
cc cc
QQ TTQQ at Tat T
(a)(a)
AA11 BB11 QQcc at Tat TccQQm1m1 at Tat Tmm
AA22 BB22QQm2m2 at Tat TmmQQhh at Tat Thh
( )( ) HydrogenHydrogen flowflow lineslinesMassMass recoveryrecovery lineline withwith valvevalveHeatHeat recoveryrecovery lineline withwith valvevalveHeat flowHeat flow
(b)(b)
HTHT AlloyAlloy AA:: ZrZr00..99 TiTi00..11CrFeCrFe ((10001000 g/reactor)g/reactor)LTLT AlloyAlloy BB:: ZrZr00 77 TiTi00 33 CrFeCrFe ((900900 g/reactor)g/reactor)LTLT AlloyAlloy BB:: ZrZr00..77 TiTi00..33 CrFeCrFe ((900900 g/reactor)g/reactor)
0 9
0 70.80.9
0.50.60.7
P
0.30.40.5
CO
P
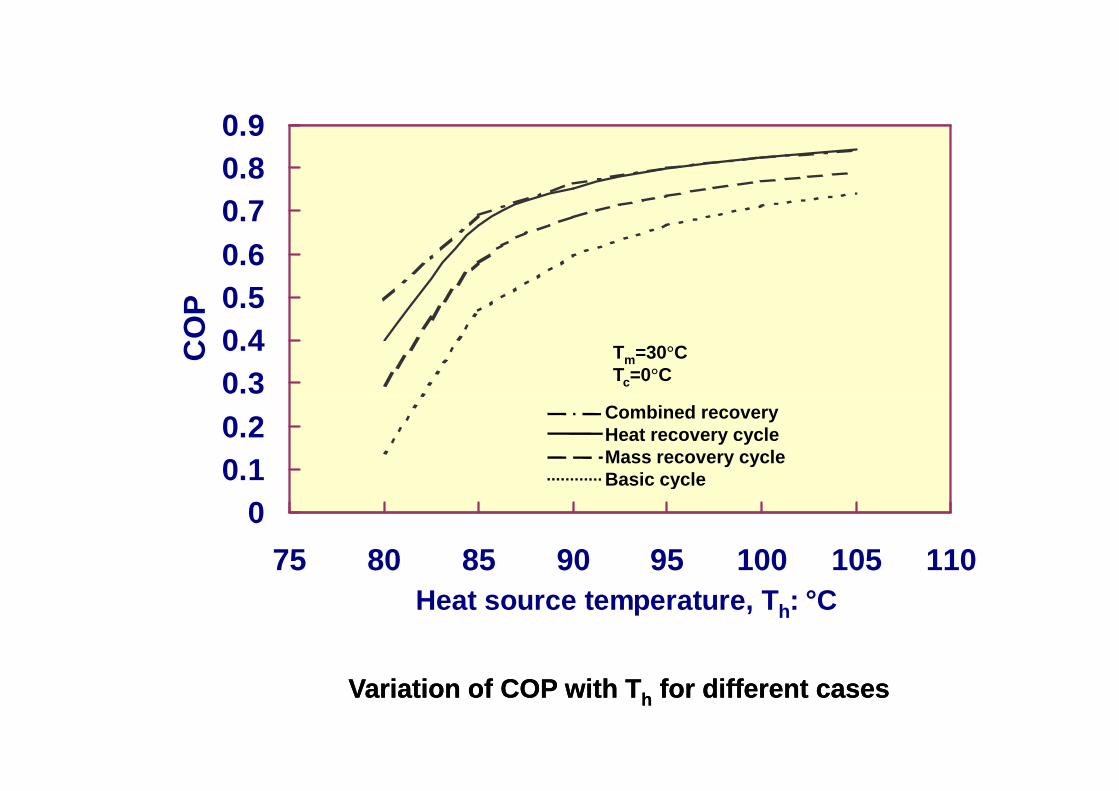
Tm=30°CTc=0°C
0.10.2 Combined recovery
Heat recovery cycleMass recovery cycleBasic cycle
075 80 85 90 95 100 105 110
Basic cycle
Heat source temperature, Th: °C
VariationVariation ofof COPCOP withwith TThh forfor differentdifferent casescases
0 9
0 70.80.9
0.50.60.7
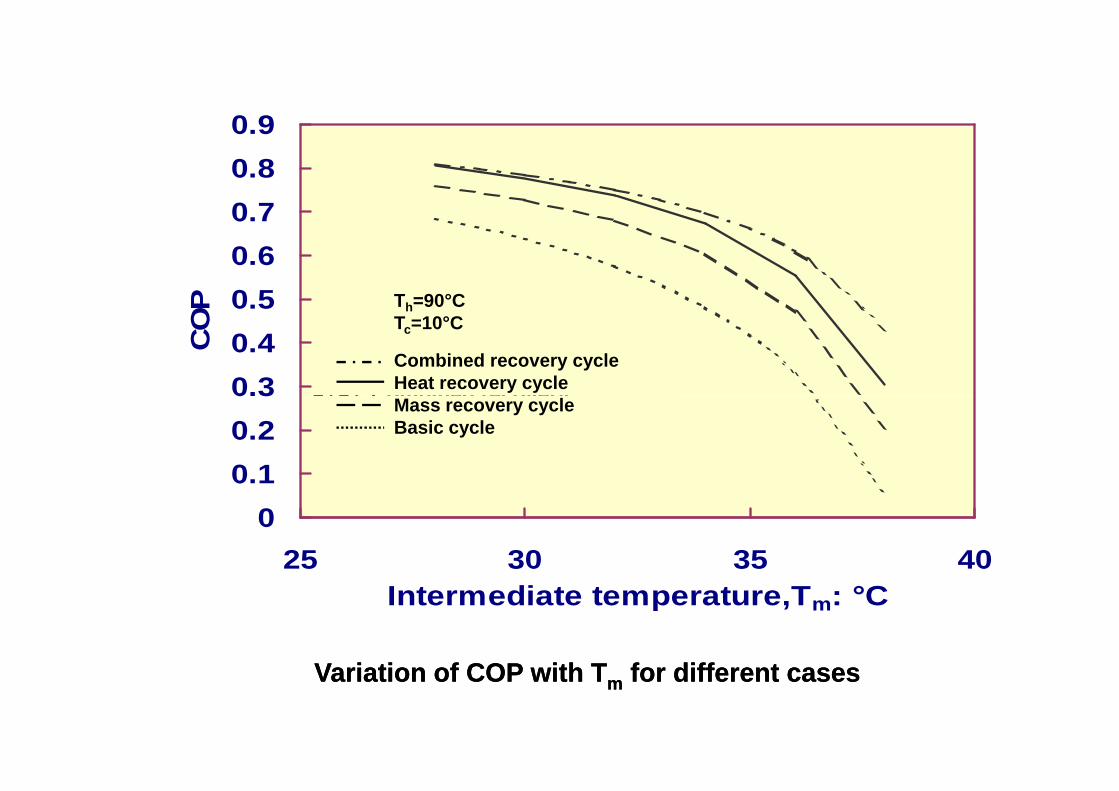
P Th=90°C
Th=90°CTc=10°CCombined recovery0.3
0.40.5
CO
P Th 90 CTc=10°C
Combined recovery cycleHeat recovery cycleCombined recovery
cycleHeat recovery cycleMass recovery cycle0.1
0.20.3
Mass recovery cycleBasic cycle
Basic cycle0
25 30 35 40
V i tiV i ti ff COPCOP ithith TT ff diff tdiff t
Intermediate temperature,Tm: °C
VariationVariation ofof COPCOP withwith TTmm forfor differentdifferent casescases
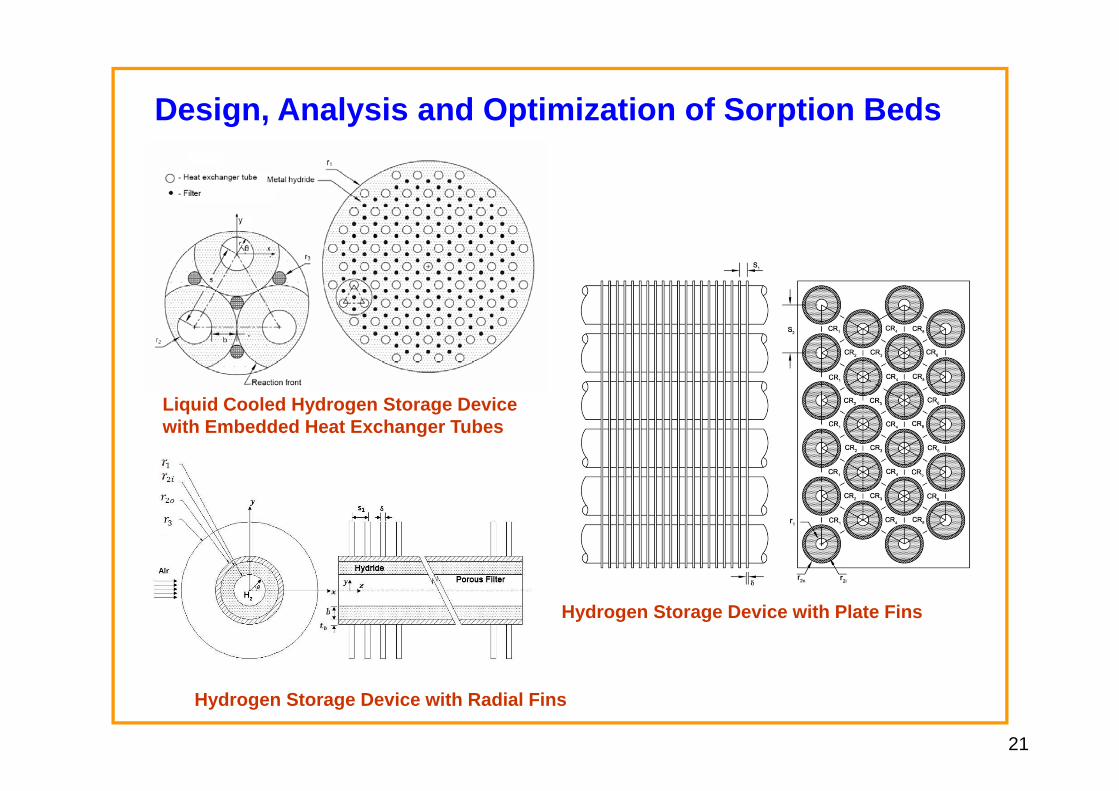
Design, Analysis and Optimization of Sorption Bedsg y p p
Liquid Cooled Hydrogen Storage Device with Embedded Heat Exchanger Tubes
Hydrogen Storage Device with Plate Fins
Hydrogen Storage Device with Radial Fins
21
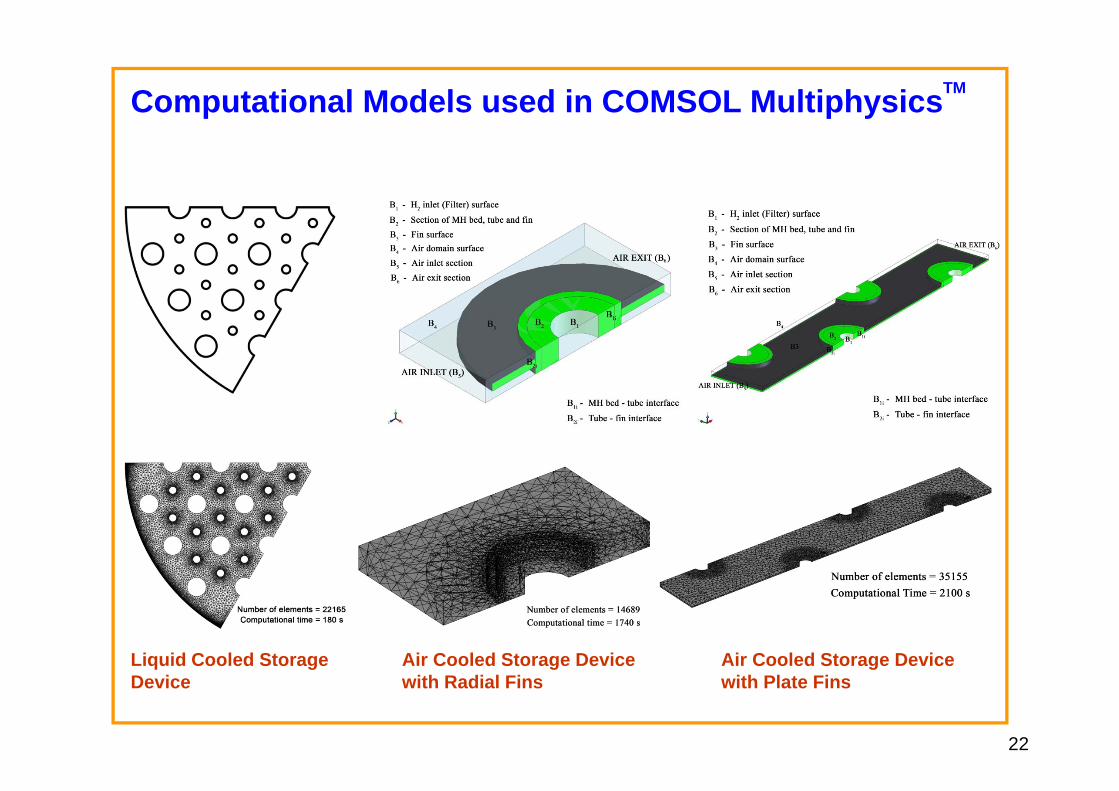
Computational Models used in COMSOL MultiphysicsTM
Liquid Cooled Storage Air Cooled Storage Device Air Cooled Storage DeviceLiquid Cooled Storage Device
Air Cooled Storage Device with Radial Fins
Air Cooled Storage Device with Plate Fins
22
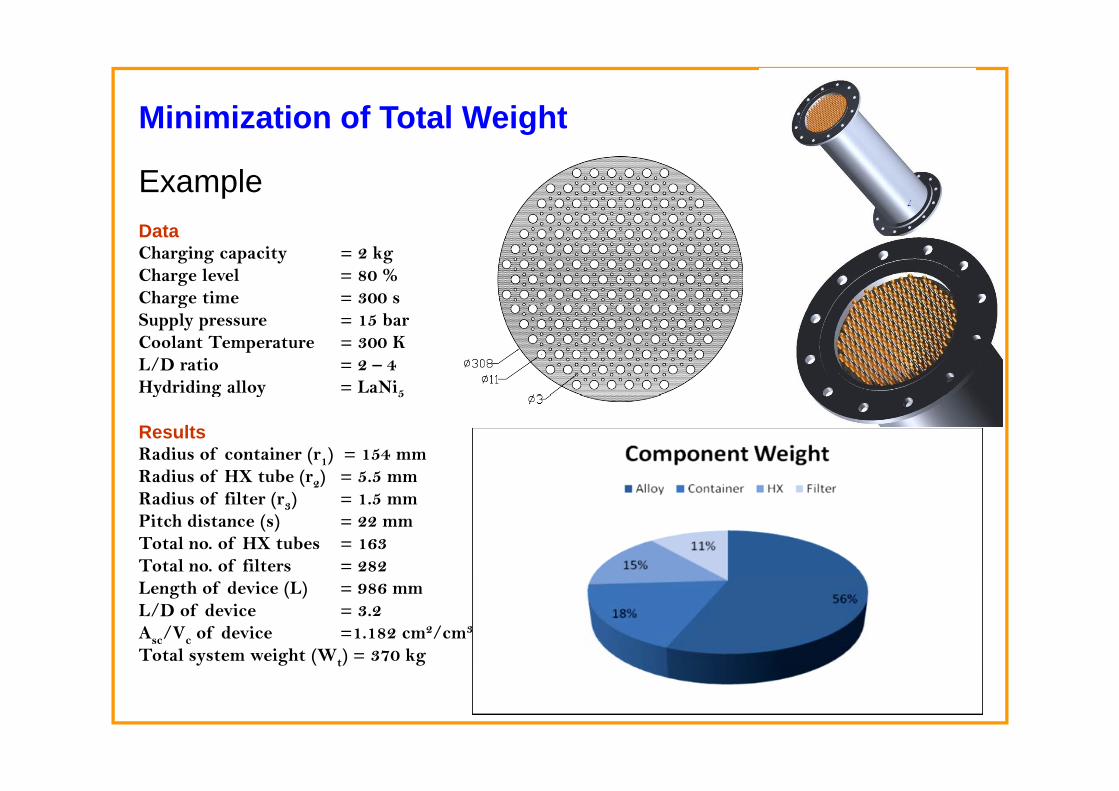
Minimization of Total Weight
Example
Minimization of Total Weight
DataCharging capacity = 2 kgCharge level = 80 %Charge time = 300 sgSupply pressure = 15 barCoolant Temperature = 300 KL/D ratio = 2 – 4Hydriding alloy = LaNi5y g y 5
ResultsRadius of container (r1) = 154 mmRadius of HX tube (r2) = 5.5 mm( 2)Radius of filter (r3) = 1.5 mmPitch distance (s) = 22 mmTotal no. of HX tubes = 163Total no. of filters = 282Length of device (L) = 986 mmL/D of device = 3.2Asc/Vc of device =1.182 cm2/cm3
Total system weight (Wt) = 370 kgy g ( t) g
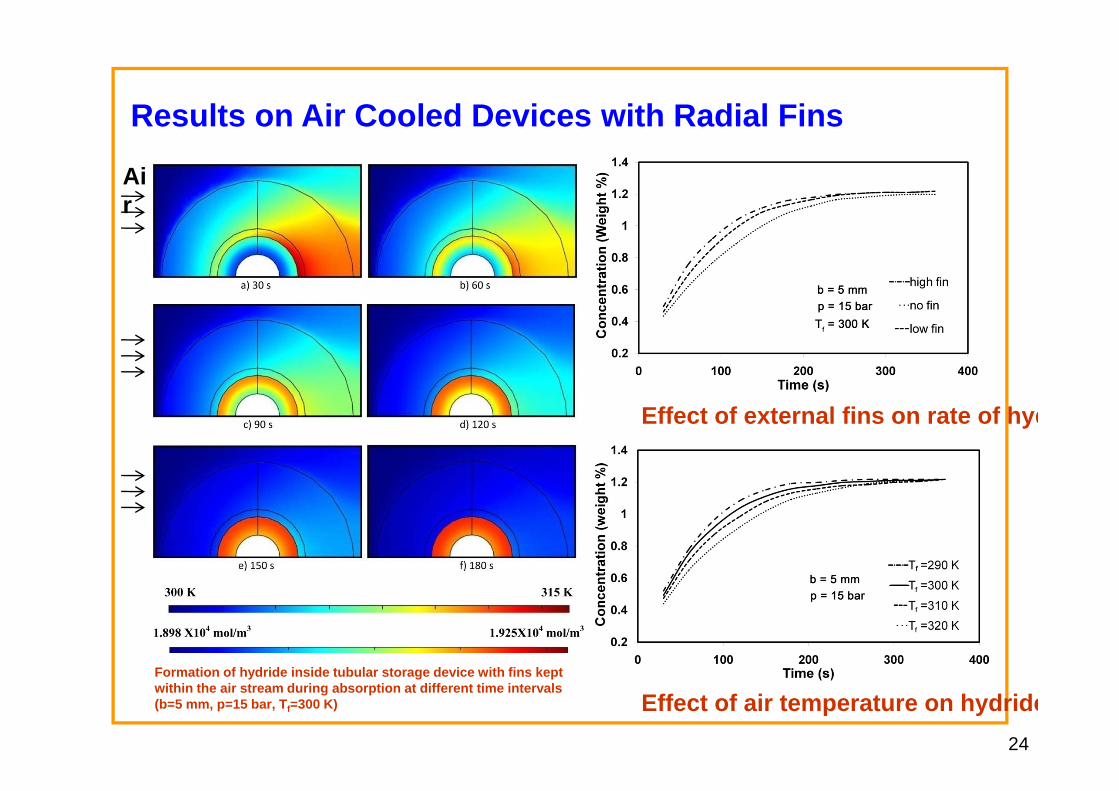
Results on Air Cooled Devices with Radial FinsResults on Air Cooled Devices with Radial Fins
Air
Effect of external fins on rate of hyd
Formation of hydride inside tubular storage device with fins kept within the air stream during absorption at different time intervals (b=5 mm, p=15 bar, Tf=300 K) Effect of air temperature on hydride
24
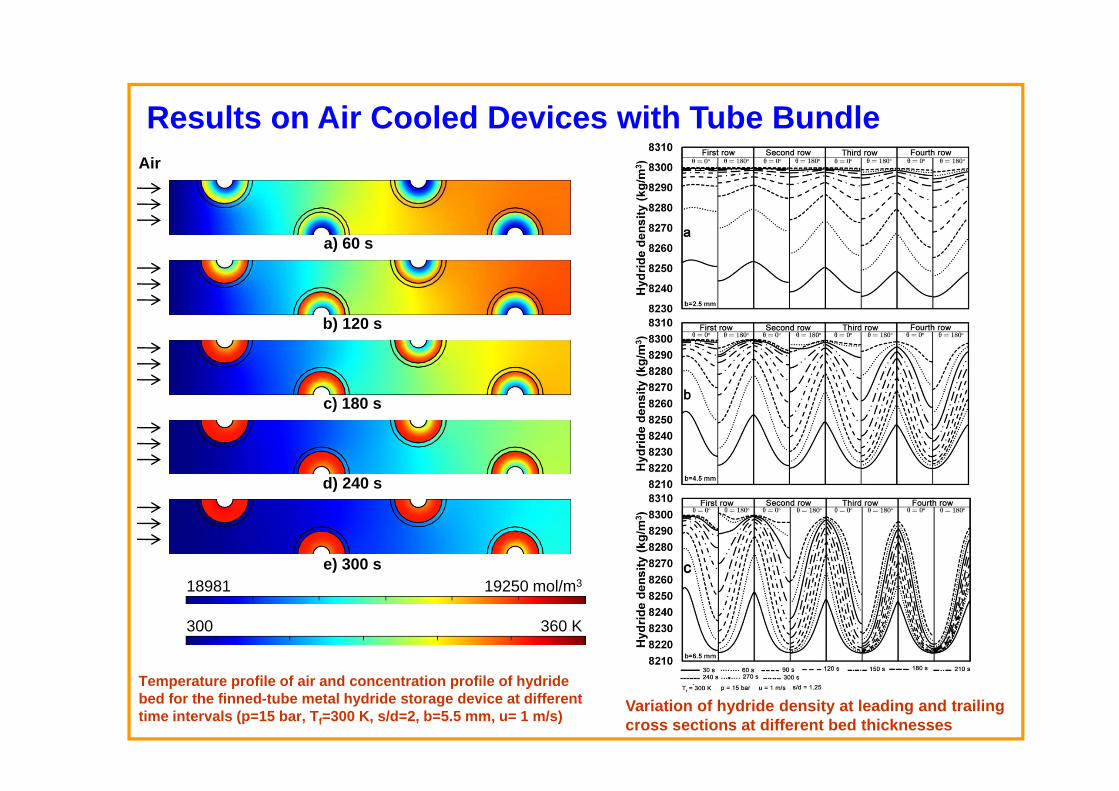
Results on Air Cooled Devices with Tube BundleResults on Air Cooled Devices with Tube BundleAir
a) 60 s
b) 120 s
c) 180 s
d) 240 sd) 240 s
e) 300 s18981 19250 mol/m3
300 360 K
Variation of hydride density at leading and trailing cross sections at different bed thicknesses
Temperature profile of air and concentration profile of hydride bed for the finned-tube metal hydride storage device at different time intervals (p=15 bar, Tf=300 K, s/d=2, b=5.5 mm, u= 1 m/s)
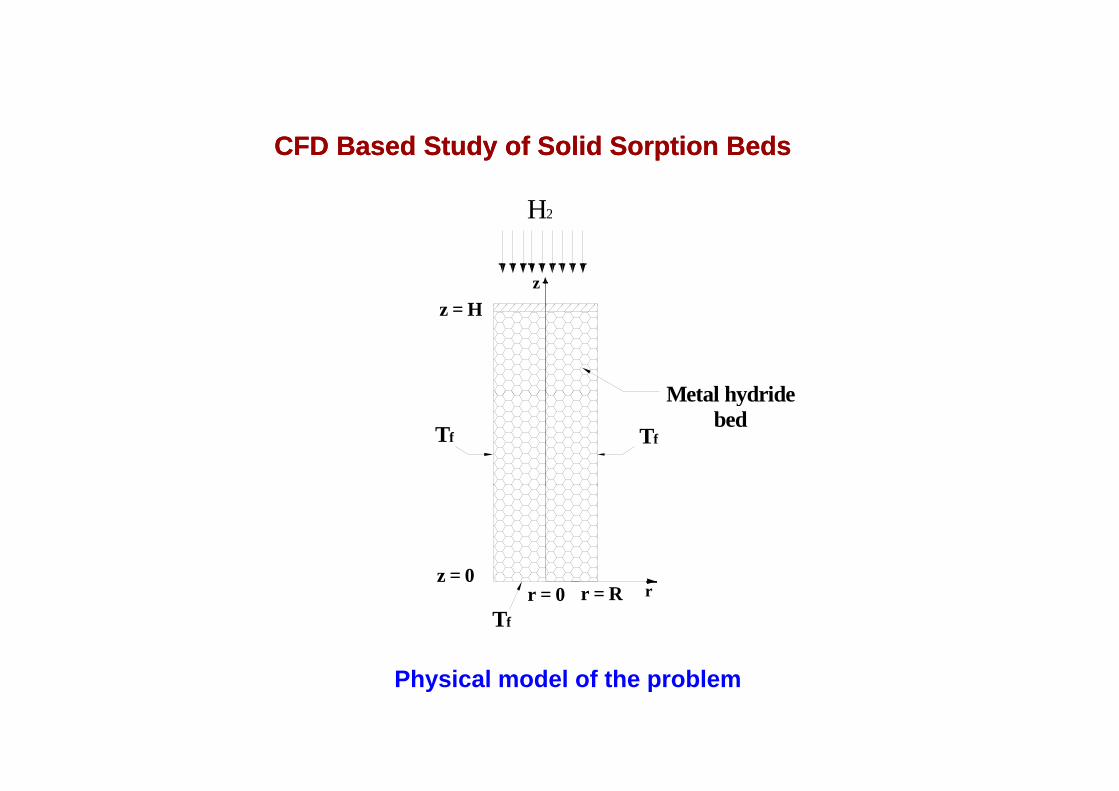
H2
CFD Based Study of Solid Sorption BedsCFD Based Study of Solid Sorption Beds
H
H2
zz = H
Metal hydride
Tf
Metal hydride bed
Tf
z = 0z = 0r = R
Tf
r = 0 r
Physical model of the problem
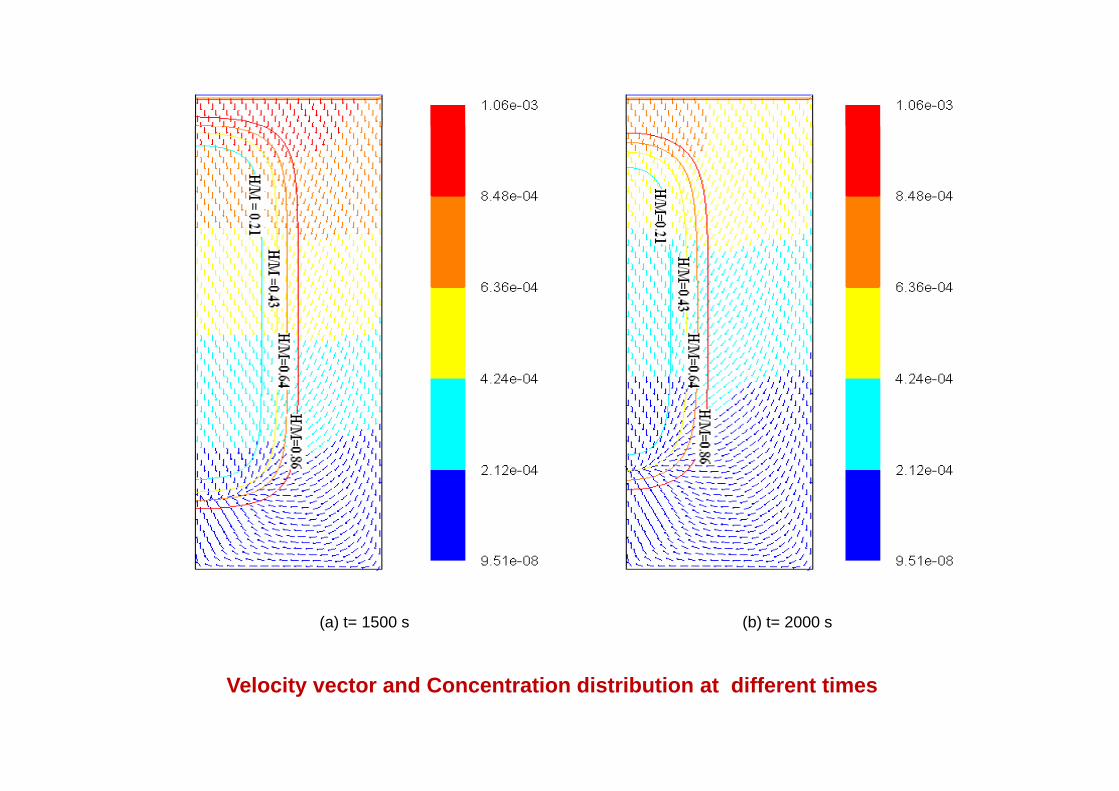
(a) t= 1500 s (b) t= 2000 s
Velocity vector and Concentration distribution at different times
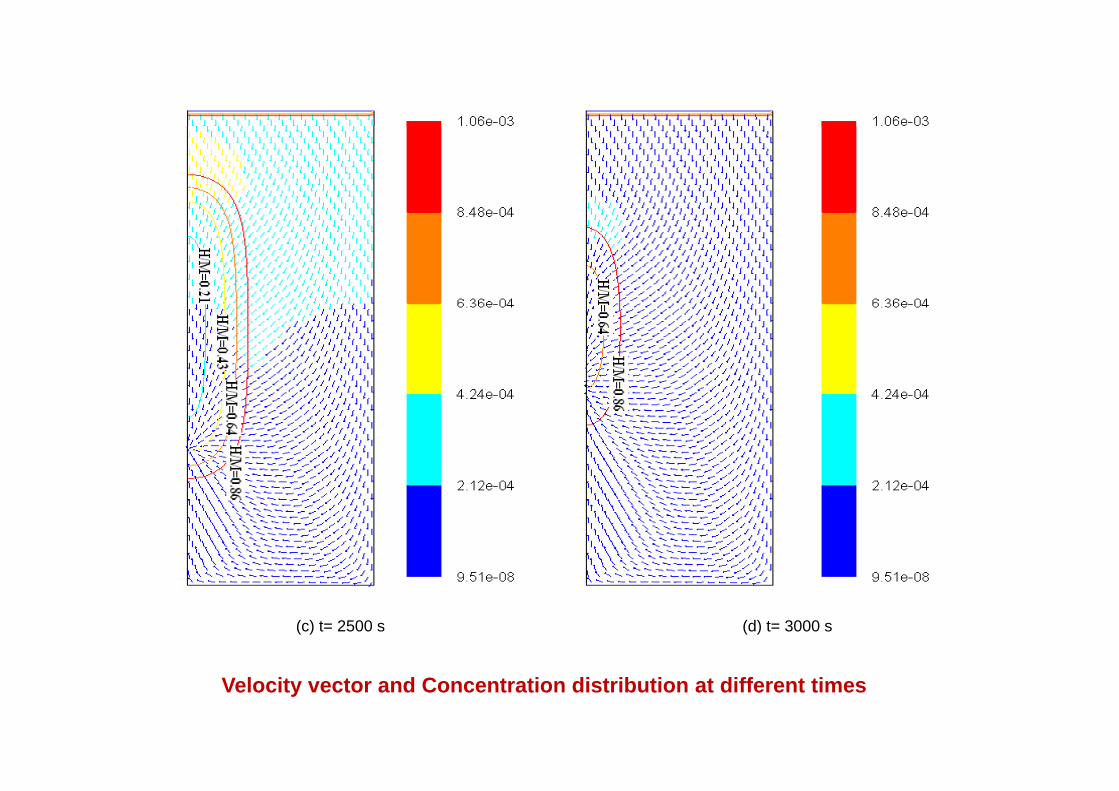
(c) t= 2500 s (d) t= 3000 s
Velocity vector and Concentration distribution at different times
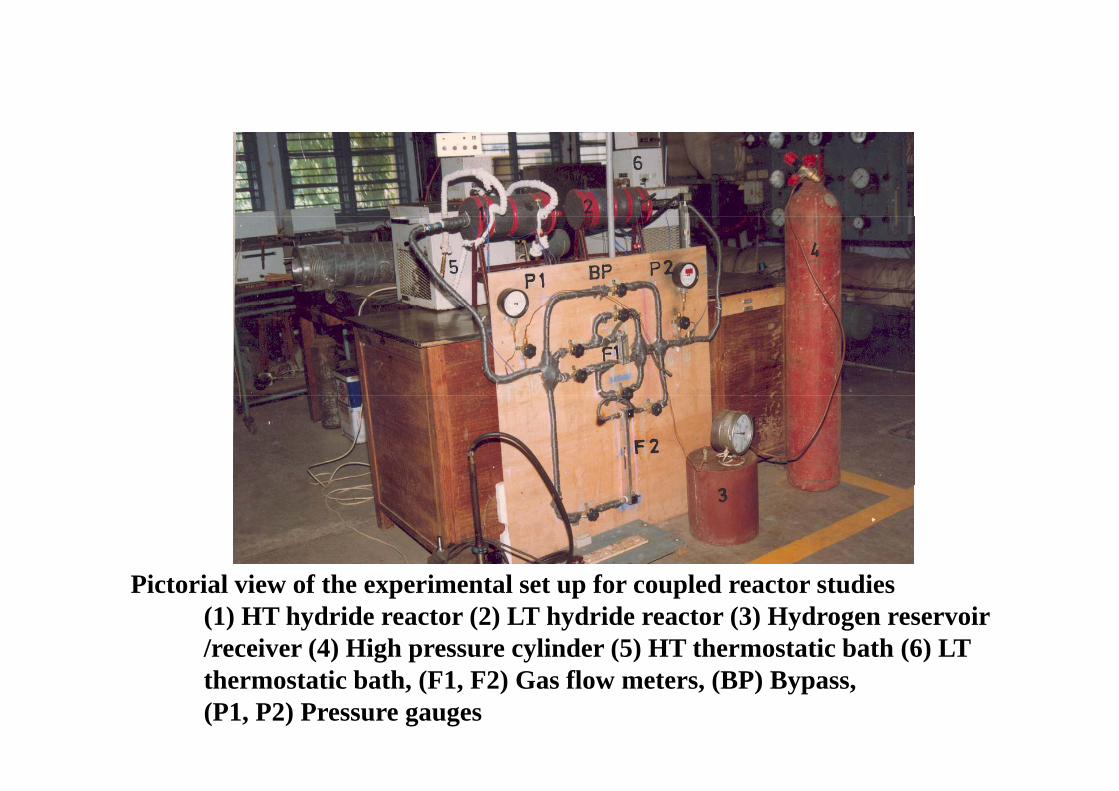
i i i f i f iPictorial view of the experimental set up for coupled reactor studies(1) HT hydride reactor (2) LT hydride reactor (3) Hydrogen reservoir /receiver (4) High pressure cylinder (5) HT thermostatic bath (6) LT thermostatic bath, (F1, F2) Gas flow meters, (BP) Bypass, (P1, P2) Pressure gauges
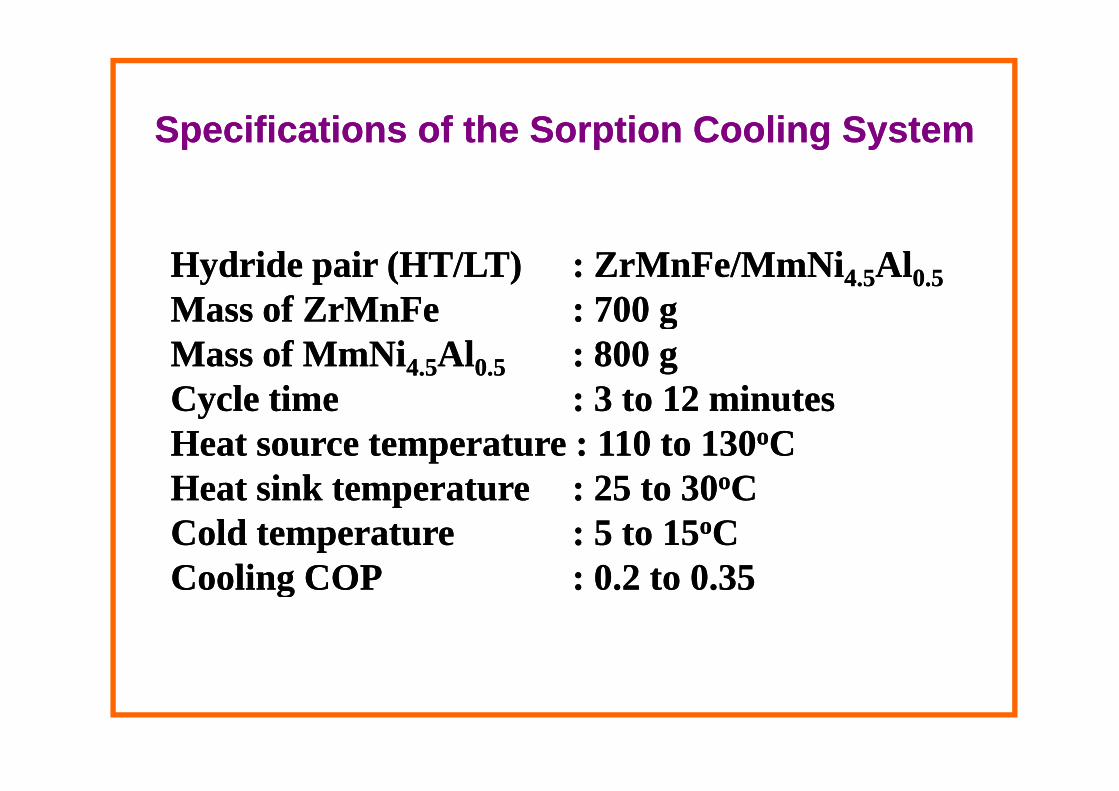
Specifications of the Sorption Cooling SystemSpecifications of the Sorption Cooling SystemSpecifications of the Sorption Cooling System Specifications of the Sorption Cooling System
Hydride pair (HT/LT)Hydride pair (HT/LT) : : ZrMnFeZrMnFe/MmNi/MmNi4.54.5AlAl0.50.5Mass ofMass of ZrMnFeZrMnFe : 700 g: 700 gMass of Mass of ZrMnFeZrMnFe : 700 g: 700 gMass of MmNiMass of MmNi4.54.5AlAl0.50.5 : 800 g: 800 gCycle timeCycle time : 3 to 12 minutes: 3 to 12 minutesCycle timeCycle time : 3 to 12 minutes: 3 to 12 minutesHeat source temperature : 110 to 130Heat source temperature : 110 to 130ooCCHeat sink temperatureHeat sink temperature : 25 to 30: 25 to 30ooCCHeat sink temperatureHeat sink temperature : 25 to 30: 25 to 30ooCCCold temperatureCold temperature : 5 to 15: 5 to 15ooCCCooling COPCooling COP : 0 2 to: 0 2 to 0 350 35Cooling COPCooling COP : 0.2 to : 0.2 to 0.350.35

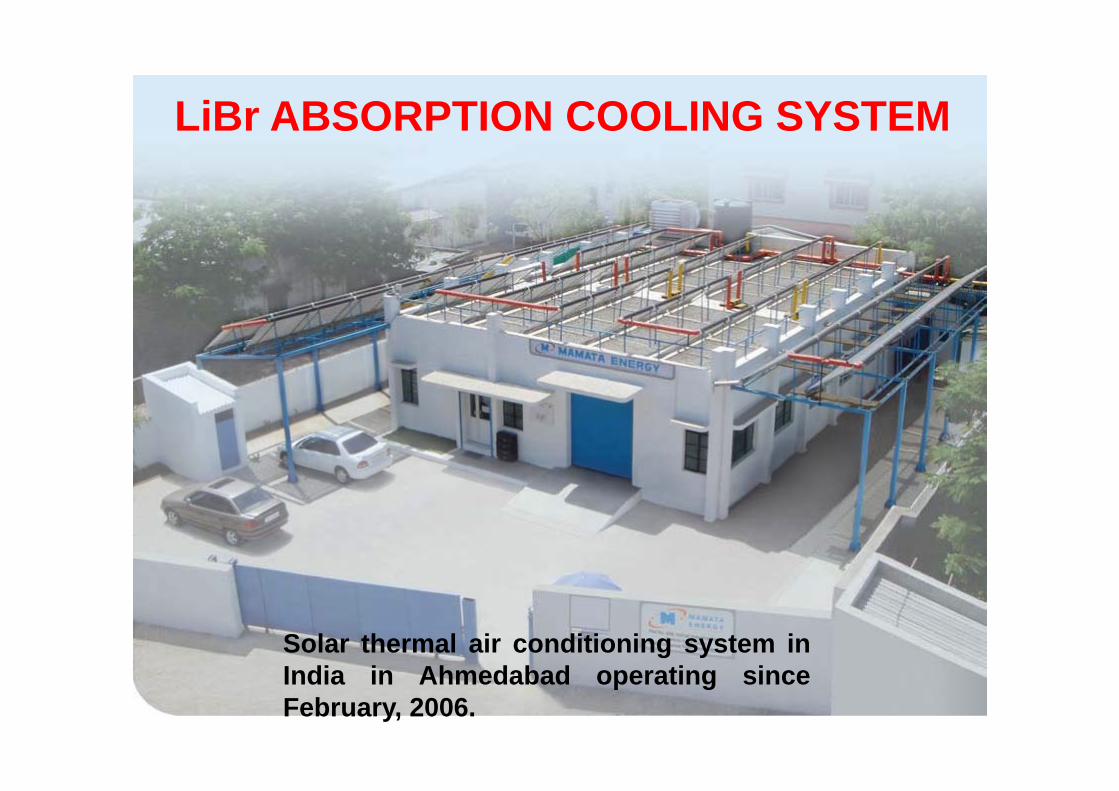
LiBr ABSORPTION COOLING SYSTEMLiBr ABSORPTION COOLING SYSTEM
Solar thermal air conditioning system inIndia in Ahmedabad operating sinceFebruary, 2006.
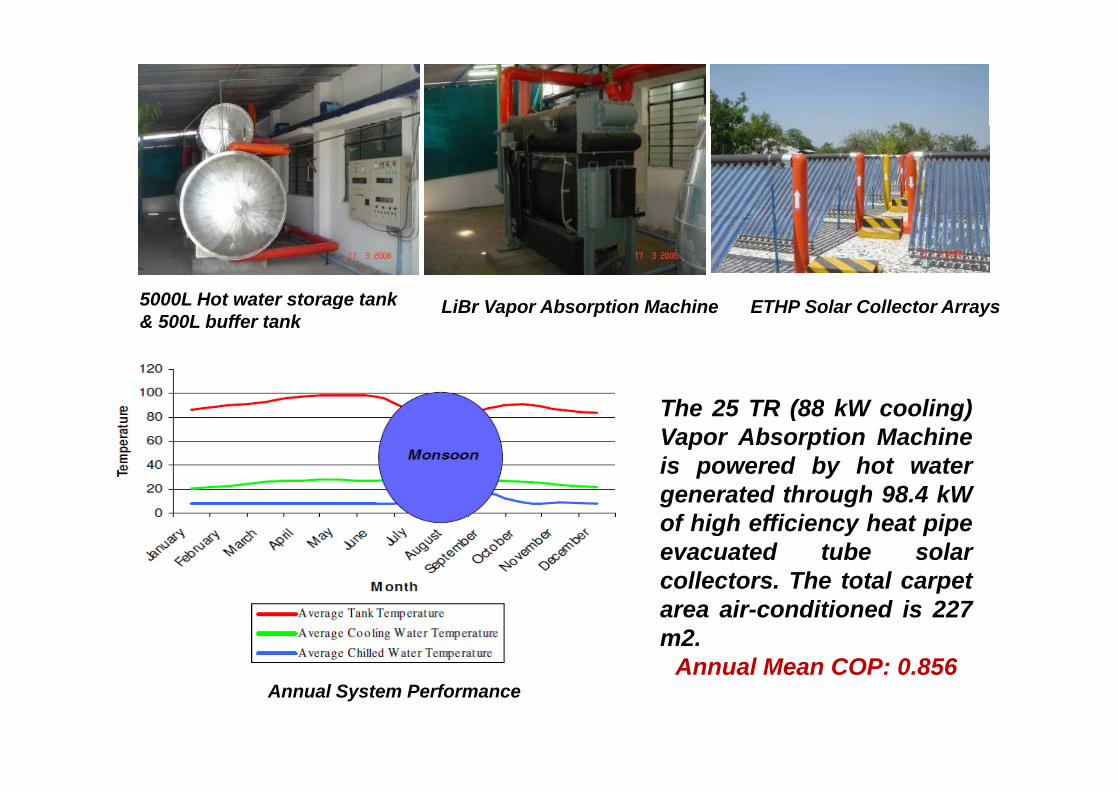
LiBr Vapor Absorption Machine ETHP Solar Collector Arrays5000L Hot water storage tank LiBr Vapor Absorption Machine ETHP Solar Collector Arraysg& 500L buffer tank
The 25 TR (88 kW cooling)Vapor Absorption Machineis powered by hot water
d h h 98 4 kWgenerated through 98.4 kWof high efficiency heat pipeevacuated tube solar
ll t Th t t l tcollectors. The total carpetarea air-conditioned is 227m2.
Annual Mean COP: 0 856Annual System Performance
Annual Mean COP: 0.856
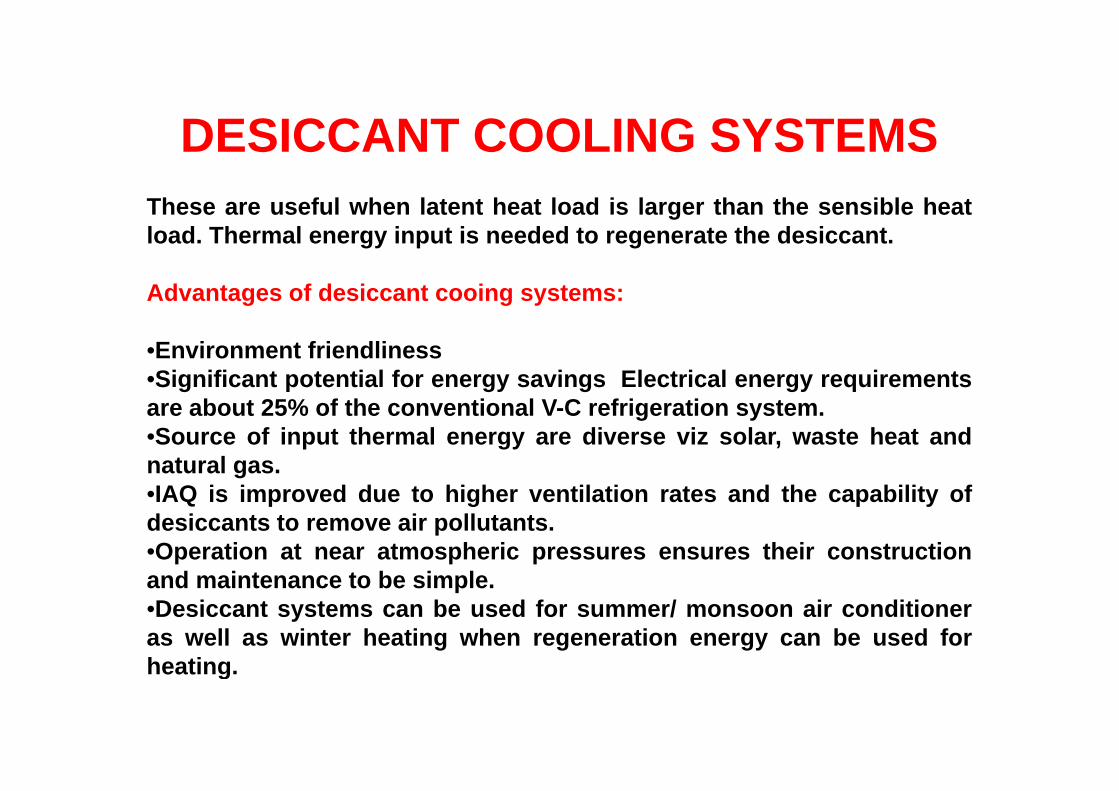
DESICCANT COOLING SYSTEMSDESICCANT COOLING SYSTEMSThese are useful when latent heat load is larger than the sensible heatgload. Thermal energy input is needed to regenerate the desiccant.
Advantages of desiccant cooing systems:g g y
•Environment friendliness•Significant potential for energy savings Electrical energy requirementsare about 25% of the conventional V-C refrigeration system.•Source of input thermal energy are diverse viz solar, waste heat andnatural gas.IAQ i i d d t hi h til ti t d th bilit f•IAQ is improved due to higher ventilation rates and the capability of
desiccants to remove air pollutants.•Operation at near atmospheric pressures ensures their construction
d i t t b i land maintenance to be simple.•Desiccant systems can be used for summer/ monsoon air conditioneras well as winter heating when regeneration energy can be used forheatingheating.
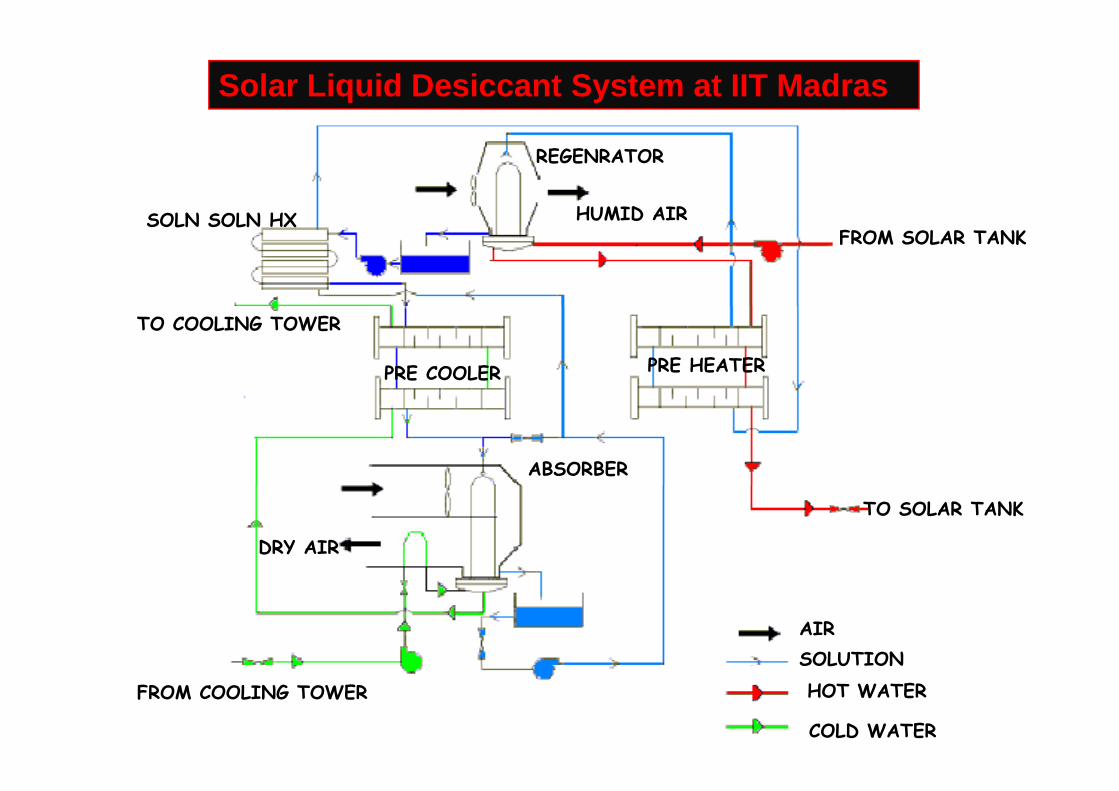
Solar Liquid Desiccant System at IIT Madras
REGENRATOR
SOLN SOLN HX HUMID AIRFROM SOLAR TANK
SOLN SOLN HX HUMID AIR
TO COOLING TOWER
PRE COOLER PRE HEATER
ABSORBER
TO SOLAR TANK
DRY AIR
AIRSOLUTION
FROM COOLING TOWER
SOLUTIONHOT WATER
COLD WATER
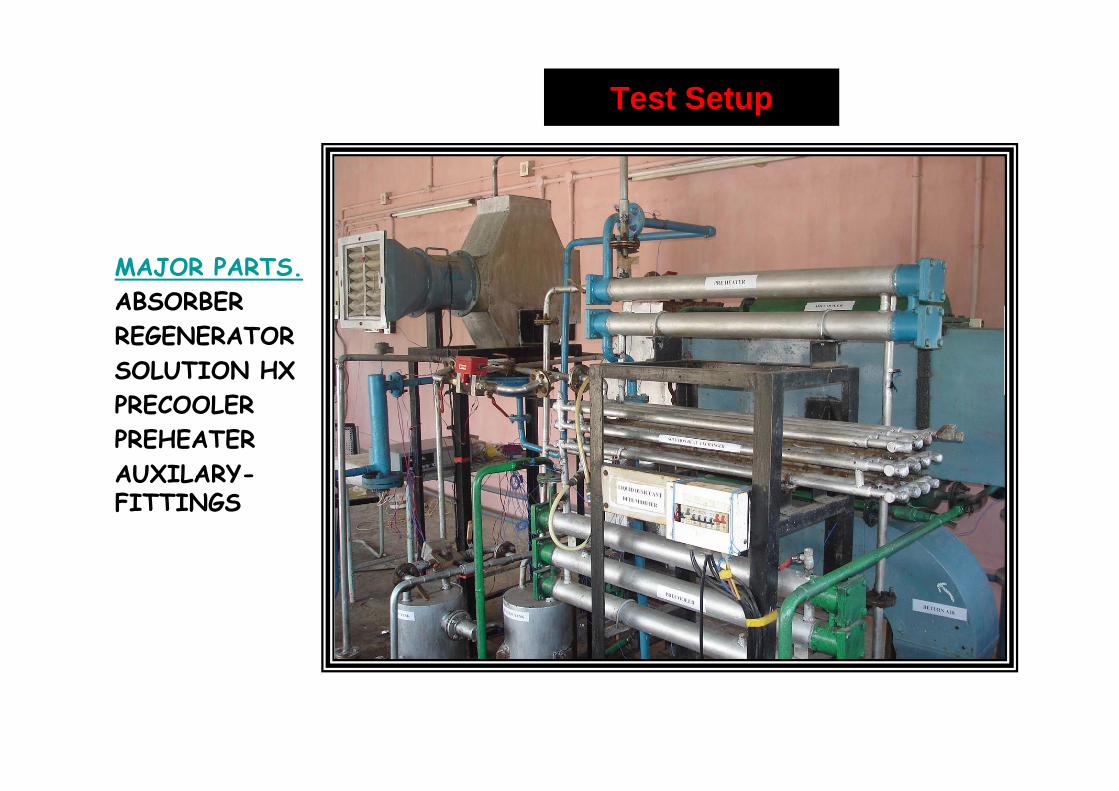
Test Setup
MAJOR PARTS.ABSORBERABSORBERREGENERATORSOLUTION HXPRECOOLERPRECOOLERPREHEATERAUXILARY-FITTINGS
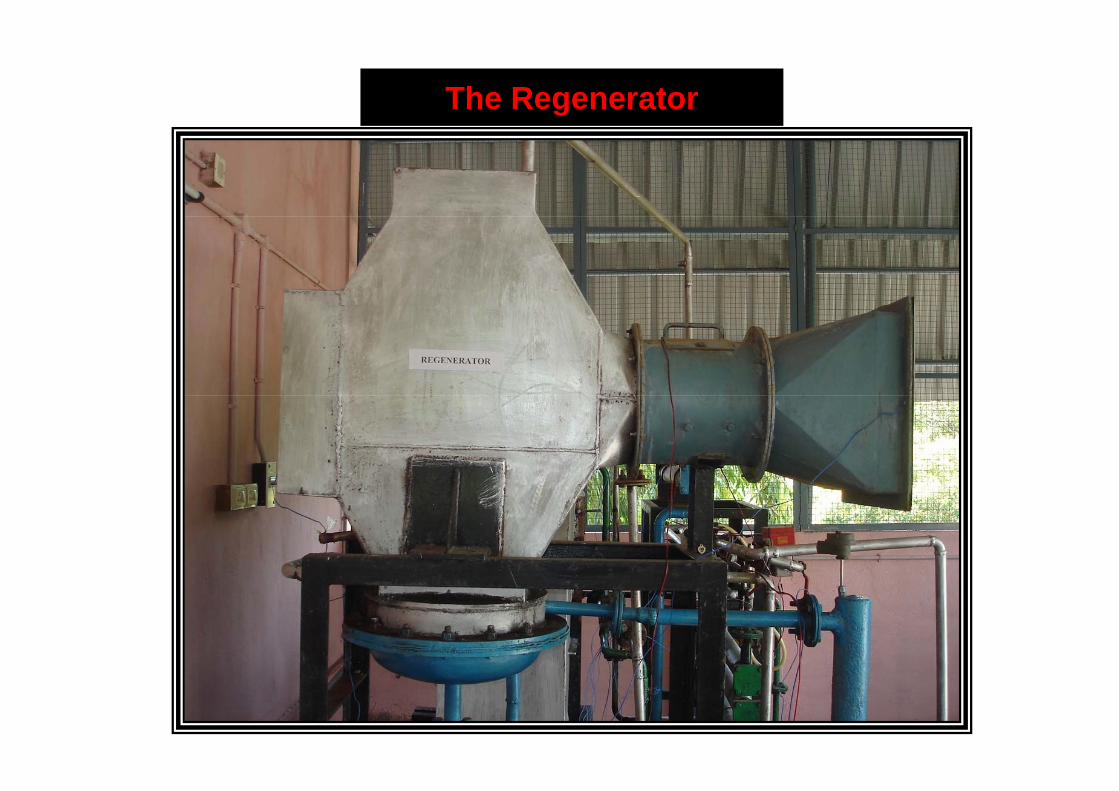
The Regenerator

The Solar Panels
E E EFLAT PLATE COLLECTOR FIELD15 C0LLECTORS PARALLEL IN 2 ROWS
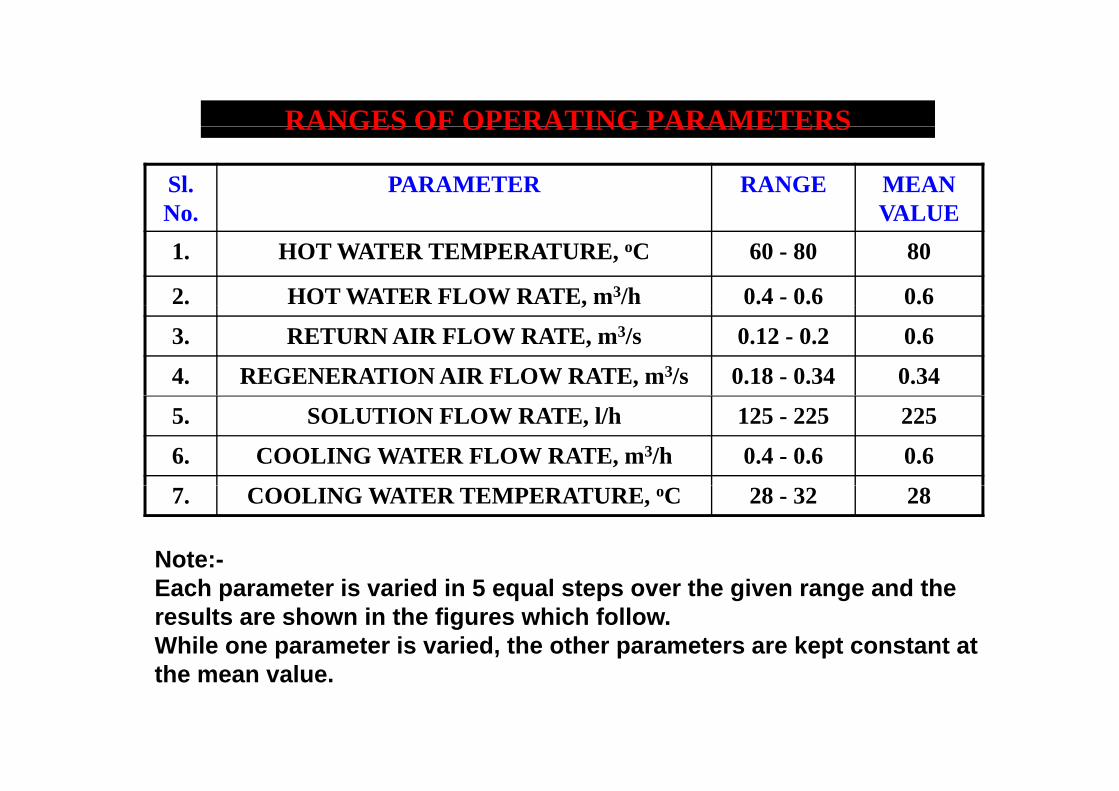
RANGES OF OPERATING PARAMETERSRANGES OF OPERATING PARAMETERS
Sl.No
PARAMETER RANGE MEAN VALUENo. VALUE
1. HOT WATER TEMPERATURE, oC 60 - 80 80
2. HOT WATER FLOW RATE, m3/h 0.4 - 0.6 0.6,
3. RETURN AIR FLOW RATE, m3/s 0.12 - 0.2 0.6
4. REGENERATION AIR FLOW RATE, m3/s 0.18 - 0.34 0.34
5. SOLUTION FLOW RATE, l/h 125 - 225 225
6. COOLING WATER FLOW RATE, m3/h 0.4 - 0.6 0.6
7. COOLING WATER TEMPERATURE, oC 28 - 32 28
Note:-Each parameter is varied in 5 equal steps over the given range and the results are shown in the figures which follow.While one parameter is varied, the other parameters are kept constant at the mean value.
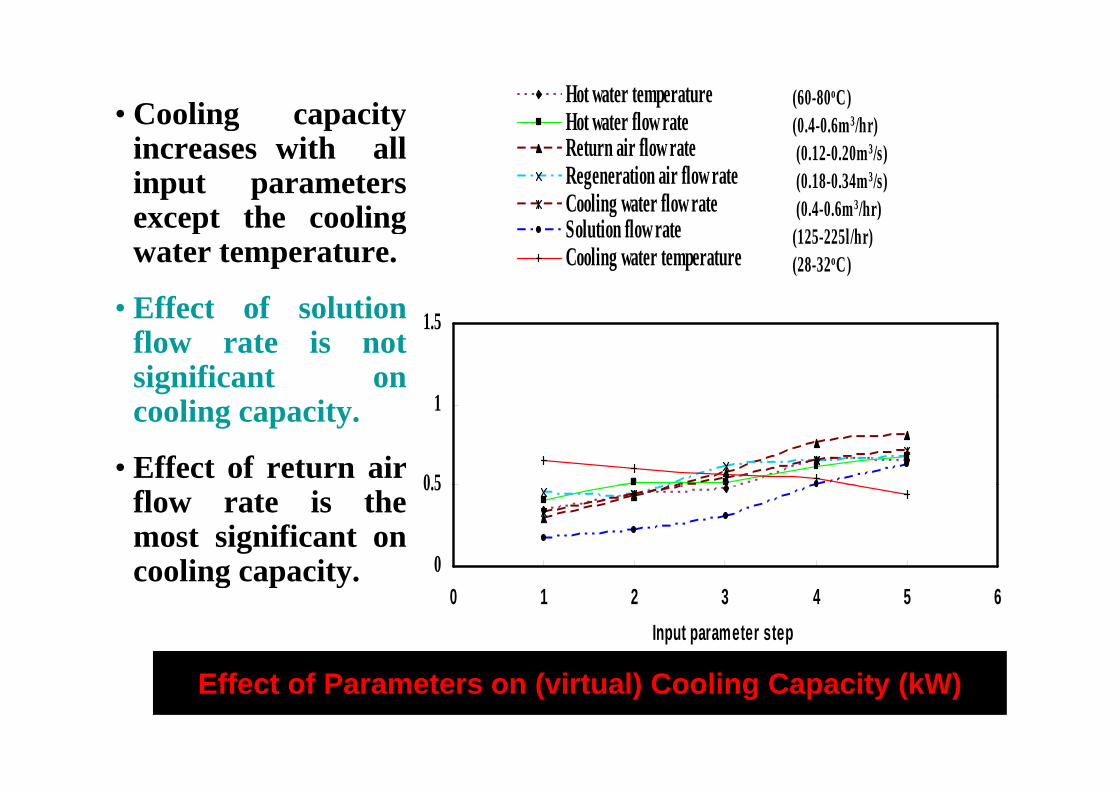
• Cooling capacity (60-80oC) (0 4-0 6m3/hr)
Hot water temperatureHot water flow rateg p y
increases with allinput parametersexcept the cooling
(0.4-0.6m /hr) (0.12-0.20m3/s) (0.18-0.34m3/s) (0.4-0.6m3/hr)
Hot water flow rateReturn air flow rateRegeneration air flow rateCooling water flow rateexcept the cooling
water temperature.
• Effect of solution
(0. 0.6 / )(125-225l/hr)(28-32oC)
gSolution flow rateCooling water temperature
• Effect of solutionflow rate is notsignificant on
1
1.5
cooling capacity.
• Effect of return air 0 5
1
flow rate is themost significant oncooling capacity 0
0.5
cooling capacity.0 1 2 3 4 5 6
Input parameter step
Effect of Parameters on (virtual) Cooling Capacity (kW)
(60-80oC) (0.4-0.6m3/hr) (0 12 0 20m3/s)
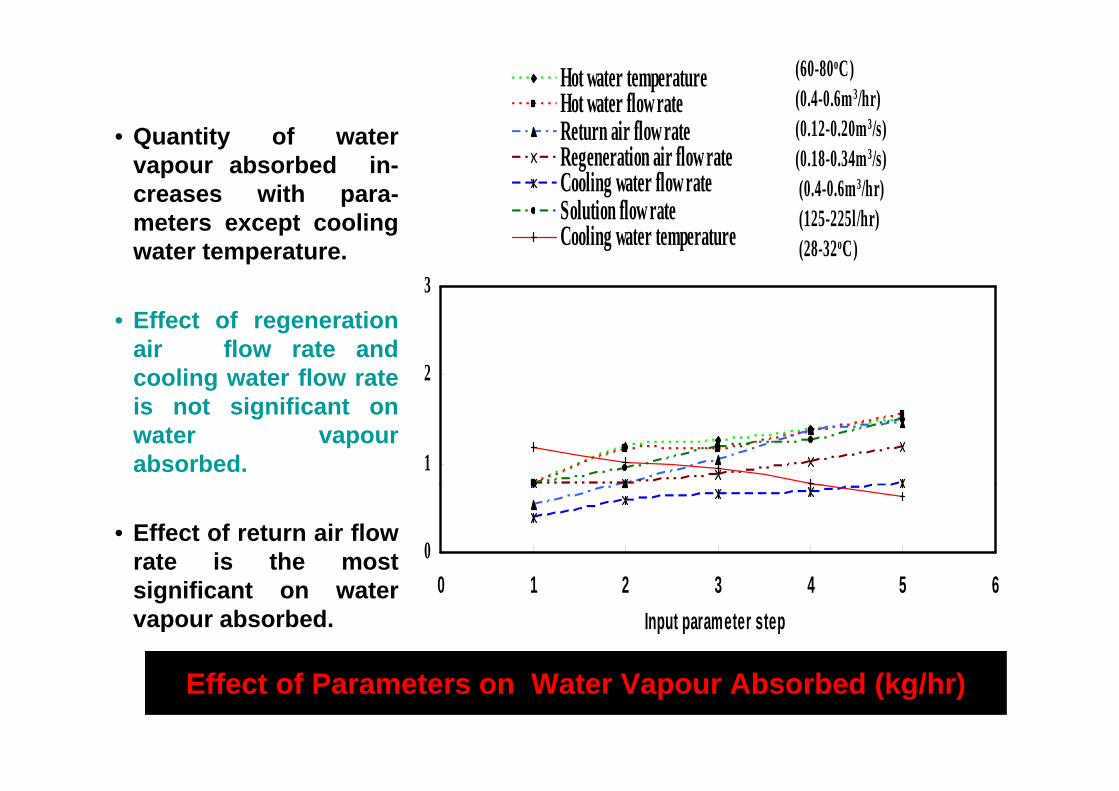
Hot water temperatureHot water flow rateR t i fl t• Quantity of water
vapour absorbed in-creases with para-
t t li
(0.12-0.20m3/s) (0.18-0.34m3/s) (0.4-0.6m3/hr)(125 225l/hr)
Return air flow rateRegeneration air flow rateCooling water flow rateSolution flowratemeters except cooling
water temperature.(125-225l/hr)
(28-32oC)3
Solution flow rateCooling water temperature
• Effect of regenerationair flow rate andcooling water flow rate 2is not significant onwater vapourabsorbed. 1
• Effect of return air flowrate is the most 0
significant on watervapour absorbed.
0 1 2 3 4 5 6Input parameter step
Effect of Parameters on Water Vapour Absorbed (kg/hr)
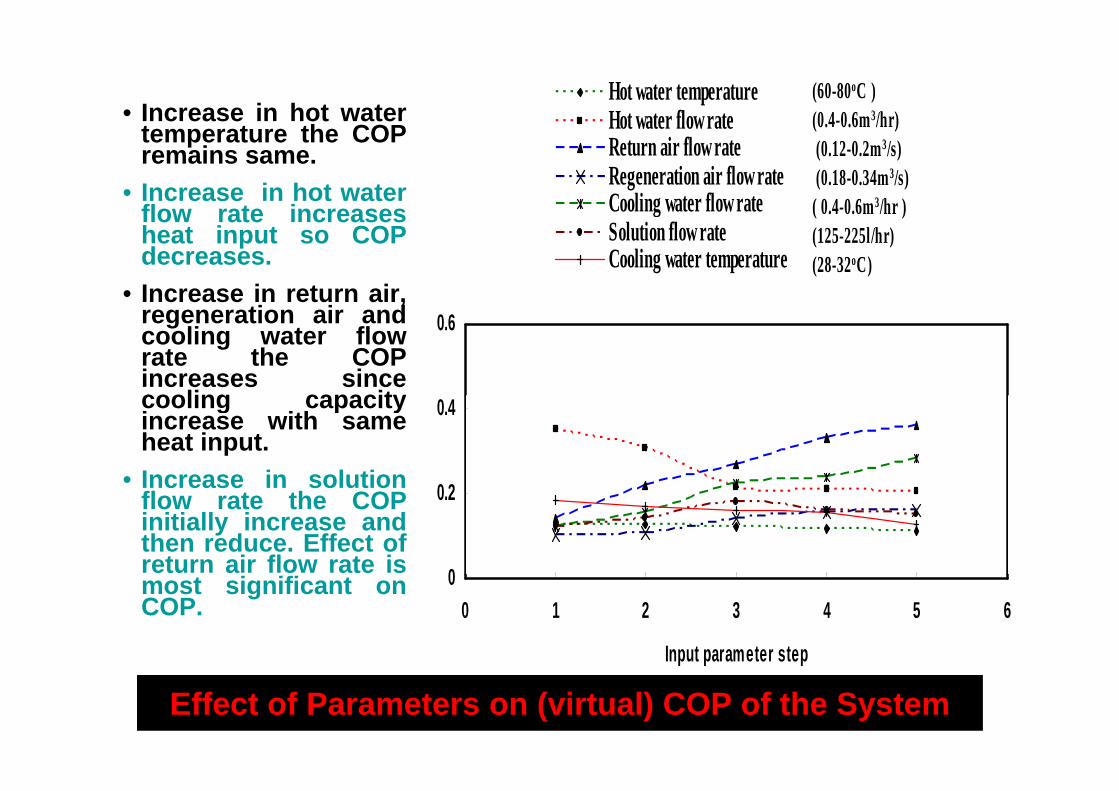
• Increase in hot watert t th COP
(60-80oC )(0.4-0.6m3/hr)
Hot water temperatureHot water flowratetemperature the COP
remains same.• Increase in hot water
flow rate increases
(0.4 0.6m /hr) (0.12-0.2m3/s) (0.18-0.34m3/s)( 0.4-0.6m3/hr )
Hot water flow rateReturn air flow rateRegeneration air flow rateCooling water flow rate flow rate increases
heat input so COPdecreases.
• Increase in return air,ti i d
( )(125-225l/hr) (28-32oC)
gSolution flow rateCooling water temperature
,regeneration air andcooling water flowrate the COPincreases sincecooling capacity
0.6
cooling capacityincrease with sameheat input.
• Increase in solution 0 2
0.4
Increase in solutionflow rate the COPinitially increase andthen reduce. Effect ofreturn air flow rate is 0
0.2
most significant onCOP.
00 1 2 3 4 5 6
Input parameter step
Effect of Parameters on (virtual) COP of the System p p p
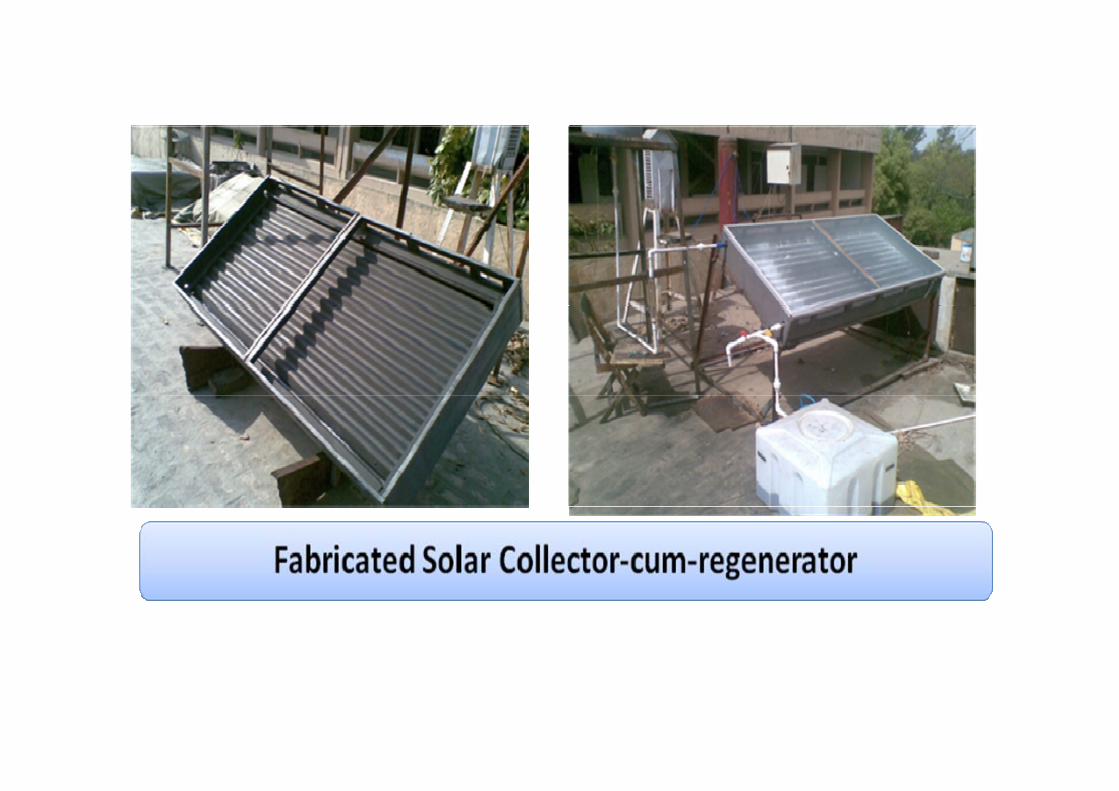
IntegrationIntegration, prototype development, and performance , prototype development, and performance evaluation of solar collection devices with heat based evaluation of solar collection devices with heat based
cooling technologies in the capacity range <cooling technologies in the capacity range < 10TR10TRcooling technologies in the capacity range < cooling technologies in the capacity range < 10TR10TRProject Sponsored by MNRE
Investigators : Sanjeev Jain & Subhash Mullick; IIT DelhiInvestigators : Sanjeev Jain & Subhash Mullick; IIT Delhi
MAIN OBJECTIVES:
Contact: [email protected]
MAIN OBJECTIVES:To develop prototype of a membrane based solardesiccant cooling systems for air-conditioningapplicationsTo develop prototype of a solar collector cumregeneratorgTo carry out detailed experimental investigations andlong term performance studies on the prototypes
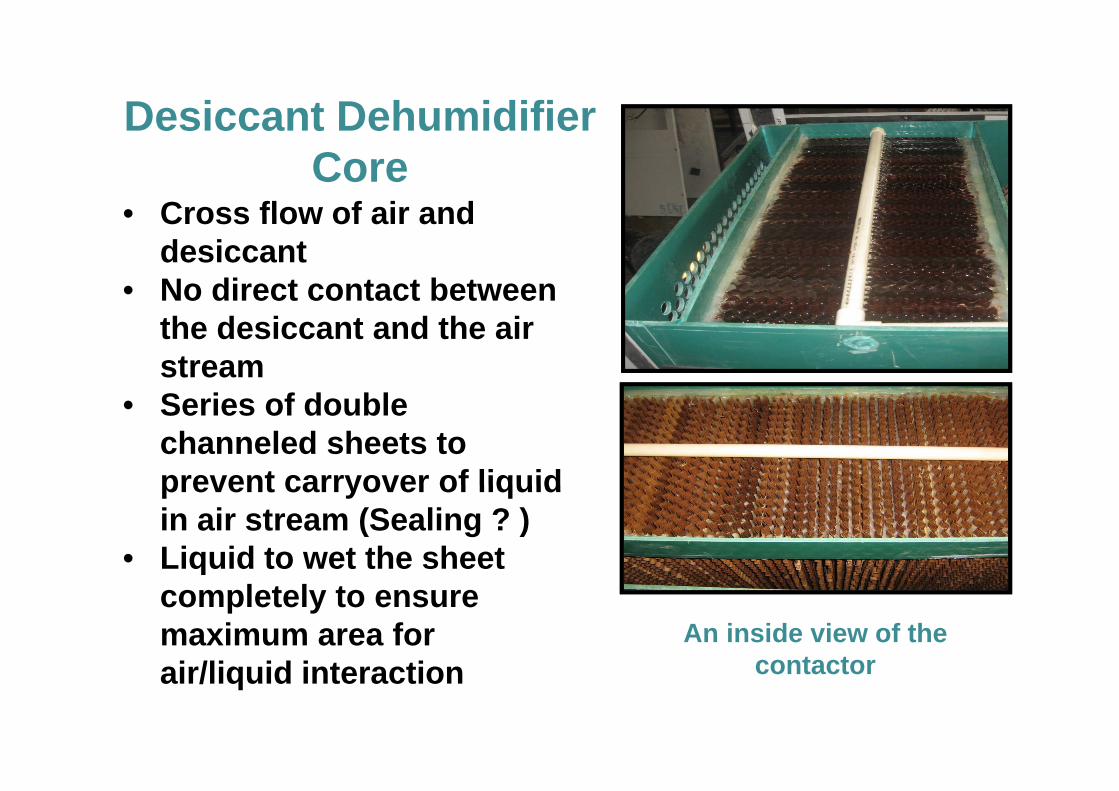
Desiccant Dehumidifier
• Cross flow of air and
Desiccant Dehumidifier Core
• Cross flow of air and desiccant
• No direct contact between the desiccant and the air streamS i f d bl• Series of double channeled sheets to prevent carryover of liquidprevent carryover of liquid in air stream (Sealing ? )
• Liquid to wet the sheet
An inside view of the contactor
completely to ensure maximum area for i /li id i t ti contactor air/liquid interaction
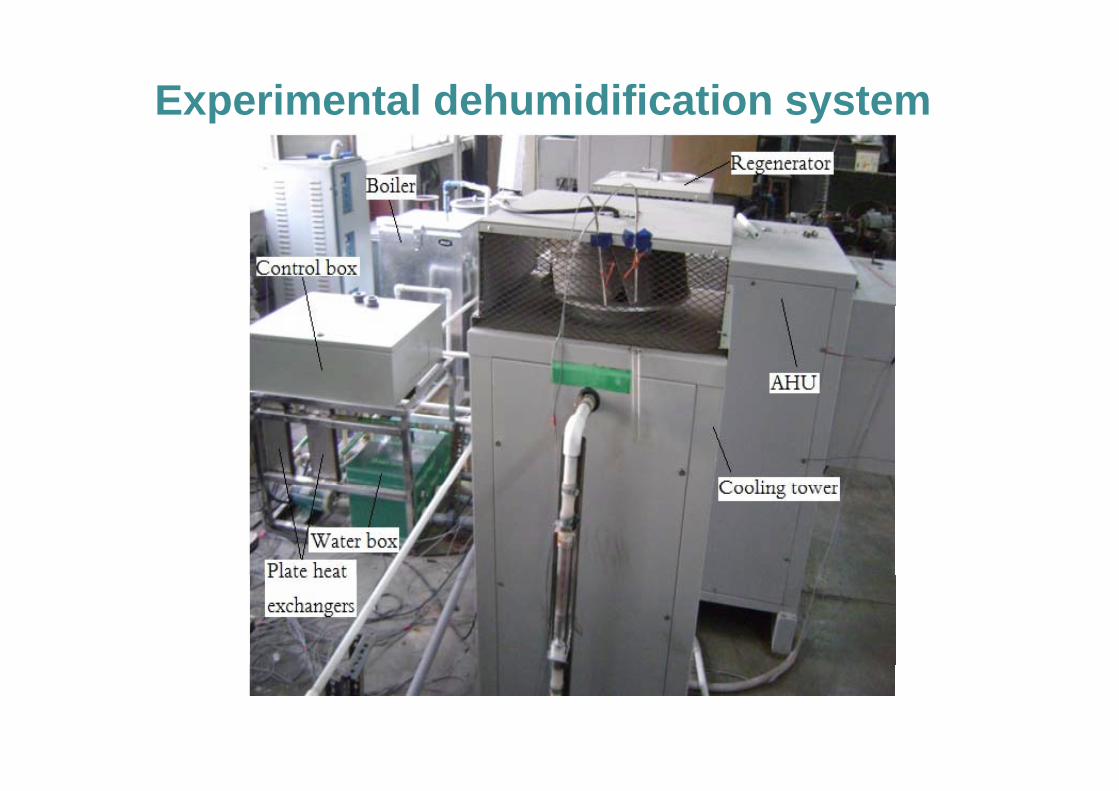
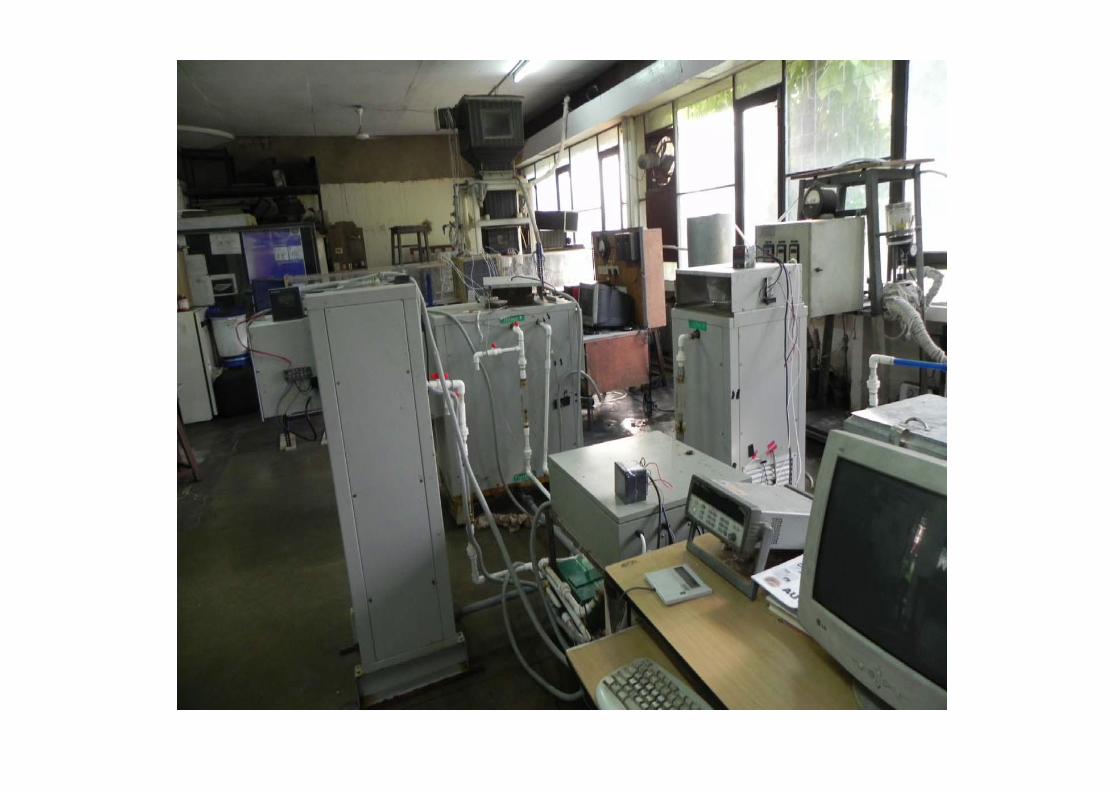
Experimental dehumidification system
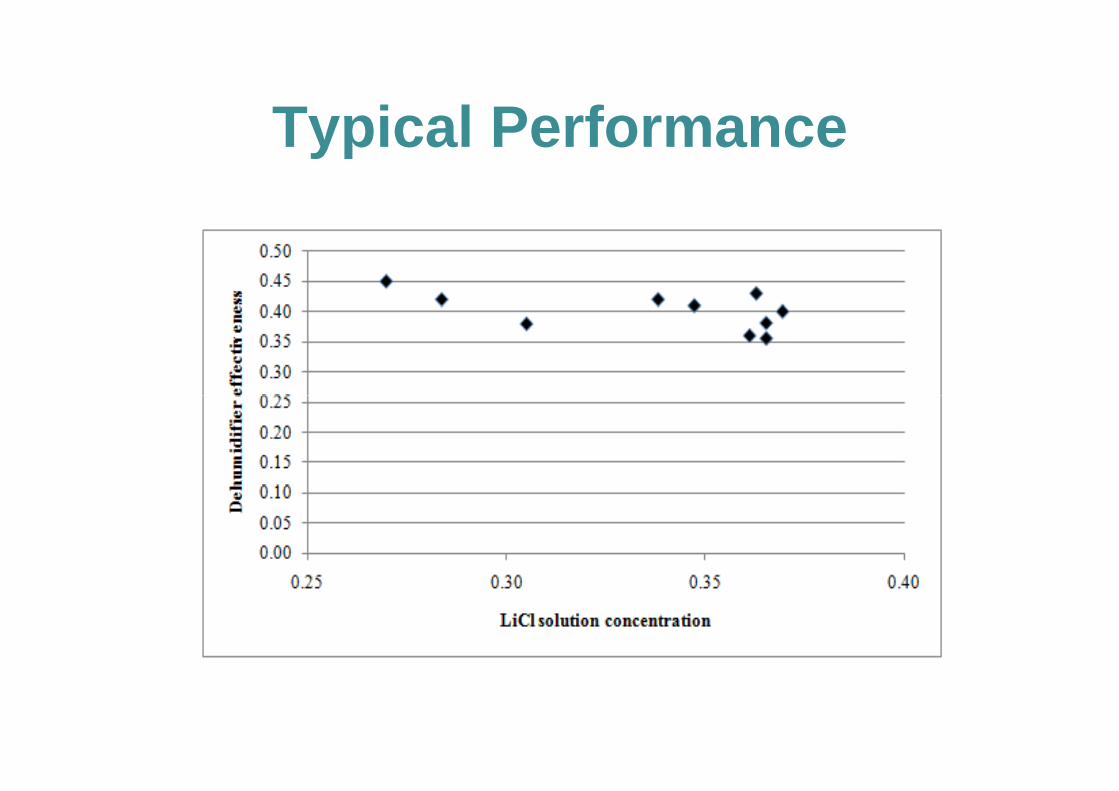
Typical PerformanceTypical Performance
CONCLUDING REMARKSCONCLUDING REMARKSSignificant Research and Developmental works are being done by theauthor on various aspects of Solar cooling technologiesauthor on various aspects of Solar cooling technologies.
All the three technologies, i.e. Wet Absorption, Dry Solid Sorption andalso Liquid- and Solid Desiccant Dehumidification, are being studied.also Liquid and Solid Desiccant Dehumidification, are being studied.
Main emphasis is on the Thermodynamics, and Heat & Mass Transferstudies. Integration with Solar Energy Collection and Thermal Energyg gy gyStorage Sub-Systems are also being done.
All these studies are yielding data for Optimal Thermal Design of SolarCooling Systems for a variety of applications.
The author is the Chairman of the Solar Thermal Projects AdvisoryCommittee and also the Chairman of the Solar Cooling ExpertCommittee of the MNRE; and may be contacted for collaboration inspecific areas ([email protected]).

THANK YOU VERY MUCH


![Life and work of the Mathemagician Srinivasa … and work of the...arXiv:math/0003184v1 [math.HO] 28 Mar 2000 Life and work of the Mathemagician Srinivasa Ramanujan K. Srinivasa Rao](https://img.pdfslide.us/doc/110x75/5ab499d97f8b9a2f438bc83b/life-and-work-of-the-mathemagician-srinivasa-and-work-of-thearxivmath0003184v1.jpg)