Embed Size (px)
Citation preview
PROGRESS IN PHOTOVOLTAICS: RESEARCH AND APPLICATIONSProg. Photovolt: Res. Appl. (2012)
Published online in Wiley Online Library (wileyonlinelibrary.com). DOI: 10.1002/pip.1255
PAPER PRESENTED AT 26TH EU PVSEC, HAMBURG, GERMANY 2011
Solar cell generations over 40% efficiencyR. R. King*, D. Bhusari, D. Larrabee, X.-Q. Liu, E. Rehder, K. Edmondson, H. Cotal, R. K. Jones,J. H. Ermer, C. M. Fetzer, D. C. Law and N. H. Karam
Spectrolab, Inc., 12500 Gladstone Ave, Sylmar, CA 91342, USA
ABSTRACT
Multijunction III-V concentrator cells of several different types have demonstrated solar conversion efficiency over 40% since2006, and represent the only third-generation photovoltaic technology to enter commercial power generation markets so far.The next stage of solar cell efficiency improvement, from 40% to 50%-efficient production cells, is perhaps the most importantyet, since it is in this range that concentrator photovoltaic (CPV) systems can become the lowest cost option for solar electric-ity, competing with conventional power generation without government subsidies. The impact of 40% and 50% cell efficiencyon cost-effective geographic regions for CPV systems is calculated in the continental US, Europe, and North Africa. We take asystematic look at a progression of multijunction cell architectures that will take us up to 50% efficiency, using modelinggrounded in well-characterized solar cell materials systems of today’s 40% cells, discussing the theoretical, materials science,and manufacturing considerations for the most promising approaches. The effects of varying solar spectrum and currentbalance on energy production in 4-junction, 5-junction, and 6-junction terrestrial concentrator cells are shown to be noticeable,but are far outweighed by the increased efficiency of these advanced cell designs. Production efficiency distributions of the lastfive generations of terrestrial concentrator solar cells are discussed. Experimental results are shown for a highly manufactur-able, upright metamorphic 3-junction GaInP/GaInAs/Ge solar cell with 41.6% efficiency independently confirmed at 484 suns(48.4W/cm2) (AM1.5D, ASTM G173-03, 25 �C), the highest demonstrated for a cell of this type requiring a single metal-organic vapor-phase epitaxy growth run. Copyright © 2012 John Wiley & Sons, Ltd.
KEYWORDS
multijunction; high efficiency; concentrator; III-V; metamorphic; 4-junction, 5-junction, 6-junction; energy production; cost modeling
*Correspondence
Richard King, Spectrolab, Inc., 12500 Gladstone Ave, Sylmar, CA 91342, USA.E-mail: [email protected]
Received 2 September 2011; Revised 2 November 2011; Accepted 22 November 2011
1. INTRODUCTION
Multijunction III-V concentrator cells have the highestenergy conversion efficiency of any solar cell technology,with several different types of cell architecture reachingover 40% efficiency since 2006 [1–7]. Such cells repre-sent the only third-generation photovoltaic technologyto enter commercial power generation markets so far,and continue to demonstrate what is possible for otheremerging solar cell technologies that divide the sun’sspectrum into discrete slices for higher efficiency, suchas flat-plate multijunction polycrystalline semiconductorcells, tandem organic solar cells, and spectral splittingoptical systems.
III-V multijunction concentrator cells using these high-efficiency innovations are now by far the dominant type ofsolar cells used in concentrator photovoltaic (CPV) solarelectric systems, due to their dramatic efficiency advantages.
Copyright © 2012 John Wiley & Sons, Ltd.
Photovoltaics have grown at a phenomenal rate of over 40%per year for the last decade, but much of this growth has beensustained by hefty government subsidies. To become atechnology that truly changes the way the global communitygenerates most of its electricity, photovoltaics will becometoo large to be helped substantially by funding from anygovernment, andwill need to be cost effective for bulk powergeneration without subsidies. Because of the III-V multi-junction cell efficiency advances discussed previouslyand the corresponding reduction in collector area, concen-trator photovoltaic systems promise dramatically lowercosts, without government subsidies, than today’s photo-voltaic technologies.
The next stage of solar cell efficiency improvement, inthe decade from 40% to 50%-efficient production cells, isperhaps the most important yet, because it is in this effi-ciency range that concentrator photovoltaic systems havethe ability to generate solar electricity at rates well below
Solar cell generations over 40% efficiency R. R. King et al.
0.10 €/kWh� 0.14 $/kWh over wide geographic areas.This allows CPV systems with 40%–50% cell efficienciesto compete effectively with conventional forms of powerproduction, even without government subsidies.
Though multijunction cell efficiencies are still far fromtheir theoretical efficiencies of over 70%, the effects ofthose physical limits can be felt in today’s cells, and the rateof efficiency increase has begun to lessen. As 3-junctionconcentrator solar cell technology becomes more highlyevolved, it has become increasingly evident that the nextsteps in efficiency will need to come from qualitativelynew cell structures, rather than from iterative improvementsof the existing 3-junction technology.
In this paper, we take a systematic look at the most prom-ising multijunction cell architectures that will take us up to50% efficiency, using empirically-based modeling groundedin well-characterized solar cell materials systems, discussingthe theoretical, materials science, and manufacturing consid-erations for the most promising approaches.
2. GEOGRAPHIC AND ECONOMICIMPACT OF HIGH EFFICIENCY
Sunlight is one of the most plentiful energy resources onearth. The amount of energy from the sun striking the planetis over 1.5� 1022 J (15,000EJ) each day, more than 104
times the 1.3 EJdaily energy consumption by human activity[8]. Clearly, solar energy is a sustainable resource, with en-ergy input far exceeding the rate it is consumed. It is also,however, a dilute source of energy, requiring relatively largecollector areas to generate solar electricity compared with,say, the lighting, appliances, vehicles, and manufacturing
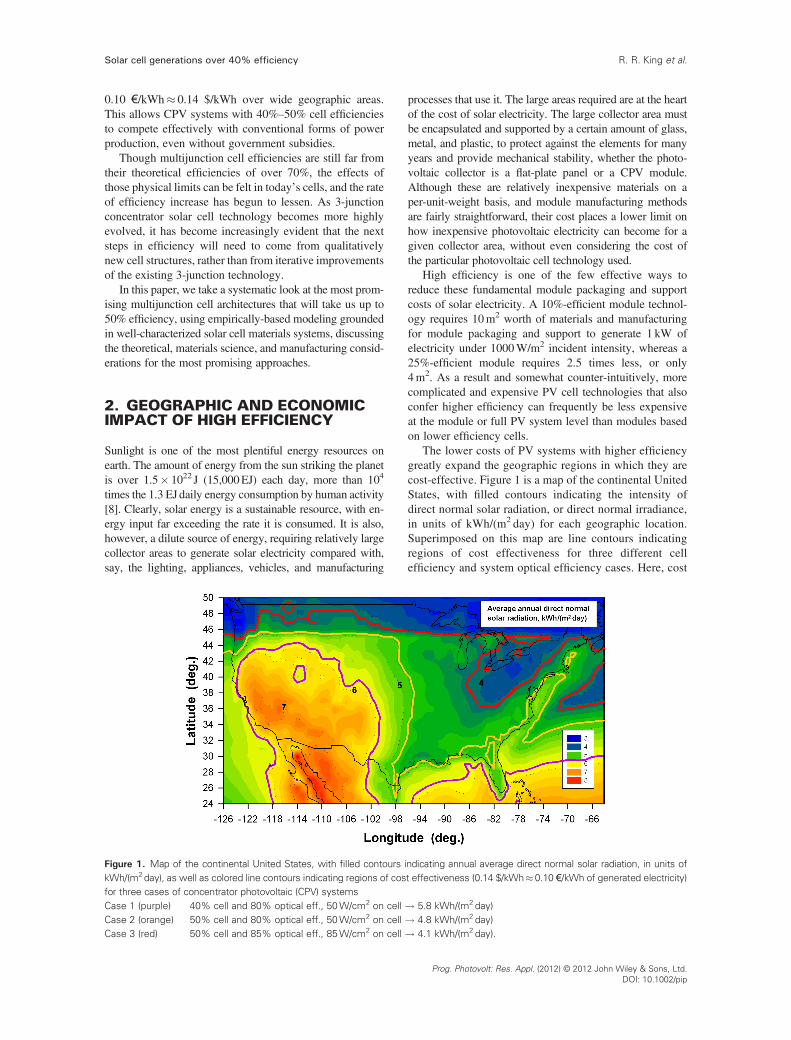
Figure 1. Map of the continental United States, with filled contours ikWh/(m2day), as well as colored line contours indicating regions of cosfor three cases of concentrator photovoltaic (CPV) systemsCase 1 (purple) 40% cell and 80% optical eff., 50W/cm2 on cellCase 2 (orange) 50% cell and 80% optical eff., 50W/cm2 on cellCase 3 (red) 50% cell and 85% optical eff., 85W/cm2 on cell
processes that use it. The large areas required are at the heartof the cost of solar electricity. The large collector area mustbe encapsulated and supported by a certain amount of glass,metal, and plastic, to protect against the elements for manyyears and provide mechanical stability, whether the photo-voltaic collector is a flat-plate panel or a CPV module.Although these are relatively inexpensive materials on aper-unit-weight basis, and module manufacturing methodsare fairly straightforward, their cost places a lower limit onhow inexpensive photovoltaic electricity can become for agiven collector area, without even considering the cost ofthe particular photovoltaic cell technology used.
High efficiency is one of the few effective ways toreduce these fundamental module packaging and supportcosts of solar electricity. A 10%-efficient module technol-ogy requires 10m2 worth of materials and manufacturingfor module packaging and support to generate 1 kW ofelectricity under 1000W/m2 incident intensity, whereas a25%-efficient module requires 2.5 times less, or only4m2. As a result and somewhat counter-intuitively, morecomplicated and expensive PV cell technologies that alsoconfer higher efficiency can frequently be less expensiveat the module or full PV system level than modules basedon lower efficiency cells.
The lower costs of PV systems with higher efficiencygreatly expand the geographic regions in which they arecost-effective. Figure 1 is a map of the continental UnitedStates, with filled contours indicating the intensity ofdirect normal solar radiation, or direct normal irradiance,in units of kWh/(m2 day) for each geographic location.Superimposed on this map are line contours indicatingregions of cost effectiveness for three different cellefficiency and system optical efficiency cases. Here, cost
ndicating annual average direct normal solar radiation, in units ot effectiveness (0.14 $/kWh� 0.10 €/kWh of generated electricity
! 5.8 kWh/(m2 day)! 4.8 kWh/(m2 day)! 4.1 kWh/(m2 day).
Prog. Photovolt: Res. Appl. (2012) © 2012 John Wiley & Sons, LtdDOI: 10.1002/pip
f)
.
Solar cell generations over 40% efficiencyR. R. King et al.
effectiveness is taken to mean that solar electricity can begenerated by a given concentrator photovoltaic technol-ogy for 0.14 $/kWh� 0.10 €/kWh, in 2011 currency, asan illustrative example. The cost per unit energy of con-ventional electricity generation is highly variable,depending on supply and demand in a given geographicand political region, but also on the structure of subsidiesfor conventional power generation, and the assumptionsmade about long-term costs of energy security, climatechange, and other environmental effects for a givenenergy technology; no one energy cost value fits all mar-kets. The value of 0.14 $/kWh� 0.10 €/kWh provides abenchmark in this study, and the results may be scaledup or down for other values of present non-PV energycosts, as appropriate for different assumption sets anddifferent energy markets.
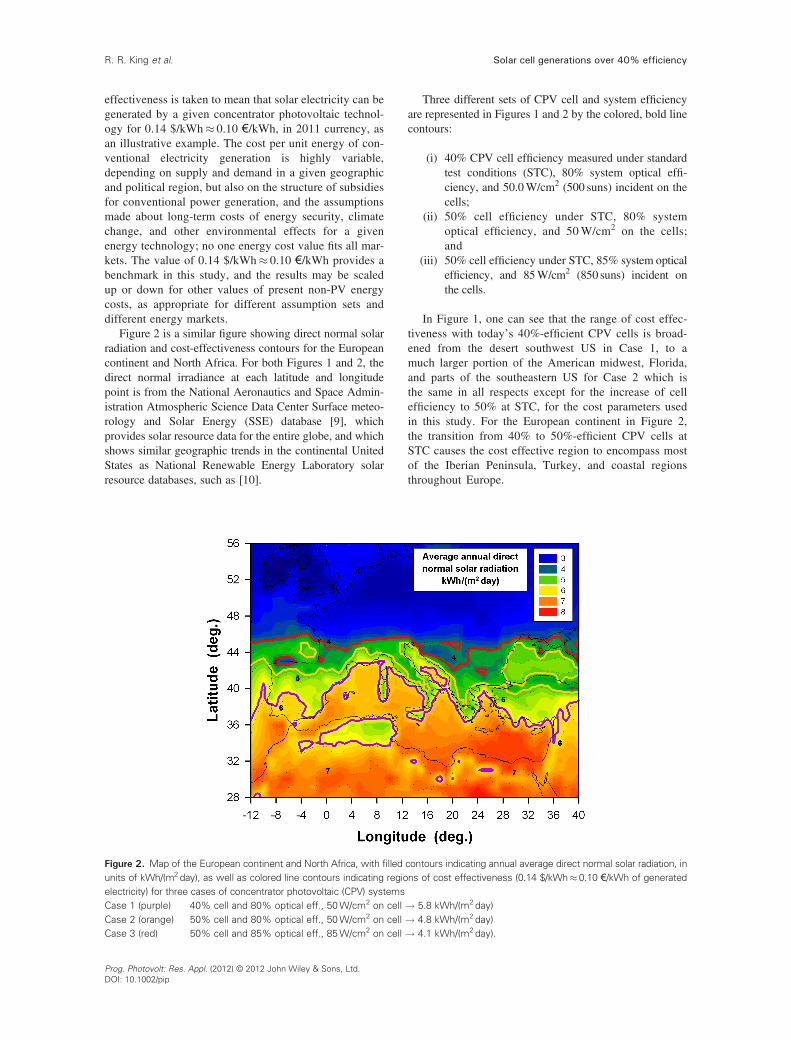
Figure 2 is a similar figure showing direct normal solarradiation and cost-effectiveness contours for the Europeancontinent and North Africa. For both Figures 1 and 2, thedirect normal irradiance at each latitude and longitudepoint is from the National Aeronautics and Space Admin-istration Atmospheric Science Data Center Surface meteo-rology and Solar Energy (SSE) database [9], whichprovides solar resource data for the entire globe, and whichshows similar geographic trends in the continental UnitedStates as National Renewable Energy Laboratory solarresource databases, such as [10].
Figure 2. Map of the European continent and North Africa, with filledunits of kWh/(m2day), as well as colored line contours indicating regioelectricity) for three cases of concentrator photovoltaic (CPV) systemsCase 1 (purple) 40% cell and 80% optical eff., 50W/cm2 on cellCase 2 (orange) 50% cell and 80% optical eff., 50W/cm2 on cellCase 3 (red) 50% cell and 85% optical eff., 85W/cm2 on cell
Prog. Photovolt: Res. Appl. (2012) © 2012 John Wiley & Sons, Ltd.DOI: 10.1002/pip
Three different sets of CPV cell and system efficiencyare represented in Figures 1 and 2 by the colored, bold linecontours:
(i) 40% CPV cell efficiency measured under standardtest conditions (STC), 80% system optical effi-ciency, and 50.0W/cm2 (500 suns) incident on thecells;
(ii) 50% cell efficiency under STC, 80% systemoptical efficiency, and 50W/cm2 on the cells;and
(iii) 50% cell efficiency under STC, 85% system opticalefficiency, and 85W/cm2 (850 suns) incident onthe cells.
In Figure 1, one can see that the range of cost effec-tiveness with today’s 40%-efficient CPV cells is broad-ened from the desert southwest US in Case 1, to amuch larger portion of the American midwest, Florida,and parts of the southeastern US for Case 2 which isthe same in all respects except for the increase of cellefficiency to 50% at STC, for the cost parameters usedin this study. For the European continent in Figure 2,the transition from 40% to 50%-efficient CPV cells atSTC causes the cost effective region to encompass mostof the Iberian Peninsula, Turkey, and coastal regionsthroughout Europe.
contours indicating annual average direct normal solar radiation, inns of cost effectiveness (0.14 $/kWh� 0.10 €/kWh of generated
! 5.8 kWh/(m2day)! 4.8 kWh/(m2day)! 4.1 kWh/(m2day).
Solar cell generations over 40% efficiency R. R. King et al.
If the increase in cell efficiency to 50% can be coupledwith ambitious improvements in CPV system optical effi-ciency as in Case 3, most of the contiguous 48 states ofthe US are in the cost effective region for CPV deploymentas shown in Figure 1, including the southeastern US andeastern US seaboard, without government subsidies. InEurope, the region of cost effectiveness for CPV systemsexpands to include southern France, and all of Italy andGreece, as plotted in Figure 2.
The cost accounting for CPV systems is straightforwardin principle. In a simplified approach, the system cost perunit of generated energy, (C/E)system, is the system costper unit module aperture area, divided by the energy perarea generated over a given payback time
C
E
� �system
¼ Cmod þ CBOS þ Cpwr cond
Amod Intannual avg �AC;system Tpayback(1)
where
Cmod cost of module (cells, cell packaging, andmodule packaging)
CBOS cost of balance-of-system (BOS) (e.g.,support structures, wiring, installation,operations and maintenance, financing),excluding power conditioning
Cpwr cond
cost of power conditioning unit (inverter)for systemAmod
aperture area of modules in system Intannual avg annual average intensity of solar resource(direct normal for concentrator, global forflat-plate) in a given geographic location,in units of kWh/(m2 day)
�AC,system
total efficiency of PV system, from sunlightto AC powerTpayback
time allotted to payback capital cost ofsystem, from power generated.The cost effectiveness contours in Figures 1 and 2 werefound by noting that for a given cost per unit generated en-ergy (C/E)system, taken to be 0.14 $/kWh� 0.10 €/kWh inthis study, the annual average intensity of sunlight Intannual avgthat can support this cost is
Intannual avg ¼ Cmod þ CBOS þ Cpwr cond
AmodCE
� �system�AC;system Tpayback
(2)
The greatest uncertainty in this analysis is in the cost ofthe non-cell components of the CPV module, and in theCPV system BOS costs. To provide a systematic estimateof these costs, US Department of Energy (DOE) current“Business as Usual” 2016 cost projections for utility scalePV systems were used [11], for module, BOS, and powerelectronics costs in all three cases. Using estimated III-Vmultijunction CPV cell costs of 7.50 $/cm2 of cell aperturearea plus 2.50 $/cm2 cell packaging costs, for a roundnumber of 10 $/cm2 for CPV cells plus cell packaging, thenon-cell module costs can be extracted from the total modulecost and are 122 $/m2 for all three cases as described in more
detail in Appendix A. The DOE balance of system costswithout tracking are 260 $/m2, to which the extra costs ofthe tracking mechanism for CPV systems are added. Theresulting total CPV system cost per unit module aperture area(Csystem/Amod) calculated in this way is 597 to 654 $/m
2. As acheck, this is well within the range between high and low-cost estimates in [12].
The efficiency of the overall CPV system starts withthe cell efficiency at STC, but also includes: the CPV sys-tem optical efficiency; power conditioning efficiency;fraction of power at STC remaining at operating temper-ature; fraction of power remaining because of the differ-ence between the standard design solar spectrum andaverage actual spectrum; fraction of energy productionremaining because of changes in the actual spectrum overthe day and year with respect to the average actualspectrum; and fraction of energy production remainingbecause of tracking errors, as detailed in Appendix B.Total system efficiencies are 26.8%, 33.5%, and 35.6%for Cases 1, 2, and 3, respectively. The payback periodTpayback is chosen to be 8 years.
With these cost and efficiency parameters, the threshold di-rect normal solar radiation level for cost effective CPV energyproduction at 0.14 $/kWh� 0.10 €/kWh are the following:
a total of 5.8 kWh/(m2 day) for Case 1 (40% cell and80% optical efficiency, 50W/cm2 on cell);
a total of 4.8 kWh/(m2 day) for Case 2 (50% cell and80% optical efficiency, 50W/cm2 on cell); and
a total of 4.1 kWh/(m2 day) for Case 3 (50% cell and85% optical efficiency, 85W/cm2 on cell),
as shown in the contours in Figures 1 and 2. For comparison,using the same cost parameters for a Case 4 using siliconCPV cells with 26% efficiency under STC at 50.0W/cm2,with 2.50 $/cm2 cell packaging cost as before, but optimisti-cally assuming zero cost for the Si cells, leads to a total CPVsystem efficiency of 16.5% for Case 4, confining the regionof cost effectiveness to the limited areas with direct normalsolar radiation greater than 7.5 kWh/(m2 day).
Because of the uncertainty in cost inputs, these costprojections are meant to be only illustrative; actual energycosts may be higher—or lower—depending on specifics ofthe CPV system. The trends are clear, however, the highefficiency of 40% III-V multijunction CPV cells, andultimately increasing efficiency to 50% are vitally importantfor reducing the area of non-cell module components andsupport structures, as well as the required area of CPV cellsthemselves, thereby expanding the range of cost effective-ness of photovoltaics. It is significant that large geographicregions can support economically viable solar electricitygeneration, even with the “Business as Usual” costparameters used here. With further reductions in the costof module, BOS, and power electronics components,CPV systems could push into even higher latitudes withlower direct normal irradiance and still remain costeffective.
Prog. Photovolt: Res. Appl. (2012) © 2012 John Wiley & Sons, Ltd.DOI: 10.1002/pip
Solar cell generations over 40% efficiencyR. R. King et al.
3. HIGH-EFFICIENCYMULTIJUNCTIONCELL STRUCTURES
Solar cell efficiencies can be dramatically improved by dividingthe broad solar spectrum up into smaller wavelength ranges,each of which can be converted more efficiently, through theuse of multijunction cells. Multijunction CPV solar cells arethe only third-generation photovoltaic technology—cells withdouble or triple the 15%–20% efficiencies targeted by firstand second generation PV cells [13] and able to overcome theShockley–Queisser efficiency limit for single-junction cells—that are now in commercial production. A large measure ofsuccess has been achieved with 3-junction GaInP/GaInAs/Geconcentrator solar cells operating on this principle, the firstsolar cell technology of any type to reach over 40% effi-ciency [1], and which is now the baseline technology for40% production CPV cells [14]. As efficient as they are,however, this baseline 3-junction design is still far fromthe optimum combination of subcell bandgaps, and far fromits efficiency potential.
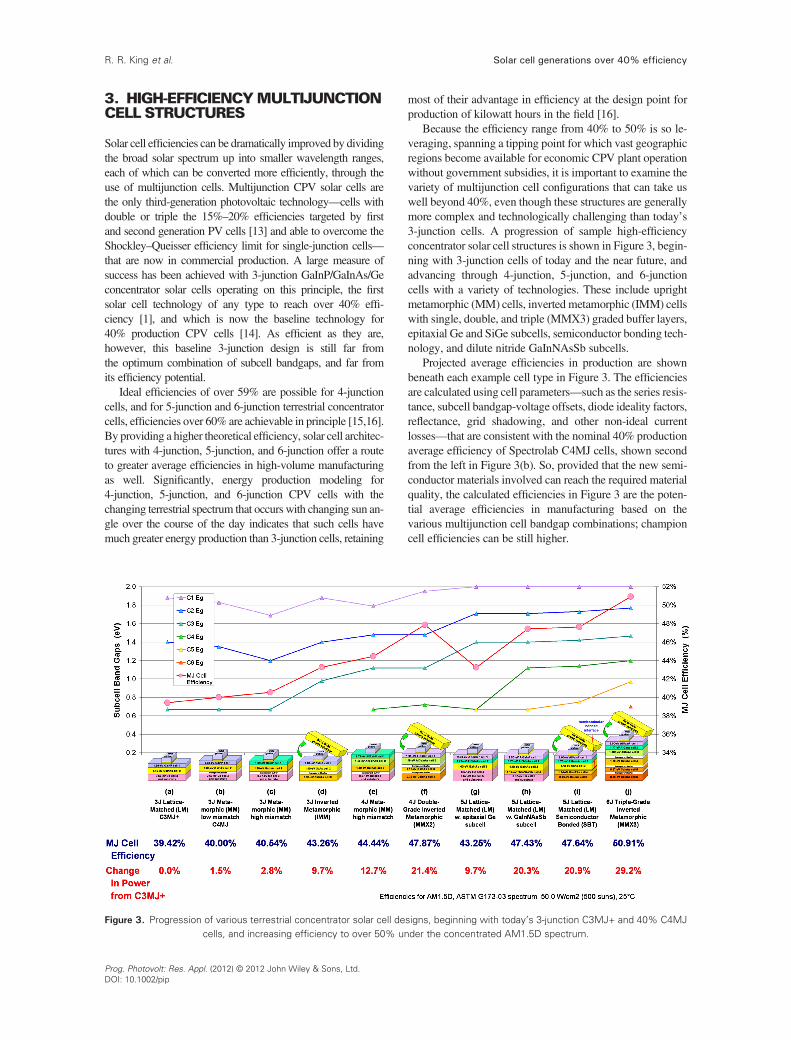
Ideal efficiencies of over 59% are possible for 4-junctioncells, and for 5-junction and 6-junction terrestrial concentratorcells, efficiencies over 60% are achievable in principle [15,16].By providing a higher theoretical efficiency, solar cell architec-tures with 4-junction, 5-junction, and 6-junction offer a routeto greater average efficiencies in high-volume manufacturingas well. Significantly, energy production modeling for4-junction, 5-junction, and 6-junction CPV cells with thechanging terrestrial spectrum that occurs with changing sun an-gle over the course of the day indicates that such cells havemuch greater energy production than 3-junction cells, retaining
Figure 3. Progression of various terrestrial concentrator solar cell decells, and increasing efficiency to over 50% un
Prog. Photovolt: Res. Appl. (2012) © 2012 John Wiley & Sons, Ltd.DOI: 10.1002/pip
most of their advantage in efficiency at the design point forproduction of kilowatt hours in the field [16].
Because the efficiency range from 40% to 50% is so le-veraging, spanning a tipping point for which vast geographicregions become available for economic CPV plant operationwithout government subsidies, it is important to examine thevariety of multijunction cell configurations that can take uswell beyond 40%, even though these structures are generallymore complex and technologically challenging than today’s3-junction cells. A progression of sample high-efficiencyconcentrator solar cell structures is shown in Figure 3, begin-ning with 3-junction cells of today and the near future, andadvancing through 4-junction, 5-junction, and 6-junctioncells with a variety of technologies. These include uprightmetamorphic (MM) cells, inverted metamorphic (IMM) cellswith single, double, and triple (MMX3) graded buffer layers,epitaxial Ge and SiGe subcells, semiconductor bonding tech-nology, and dilute nitride GaInNAsSb subcells.
Projected average efficiencies in production are shownbeneath each example cell type in Figure 3. The efficienciesare calculated using cell parameters—such as the series resis-tance, subcell bandgap-voltage offsets, diode ideality factors,reflectance, grid shadowing, and other non-ideal currentlosses—that are consistent with the nominal 40% productionaverage efficiency of Spectrolab C4MJ cells, shown secondfrom the left in Figure 3(b). So, provided that the new semi-conductor materials involved can reach the required materialquality, the calculated efficiencies in Figure 3 are the poten-tial average efficiencies in manufacturing based on thevarious multijunction cell bandgap combinations; championcell efficiencies can be still higher.
signs, beginning with today’s 3-junction C3MJ+ and 40% C4MJder the concentrated AM1.5D spectrum.
Solar cell generations over 40% efficiency R. R. King et al.
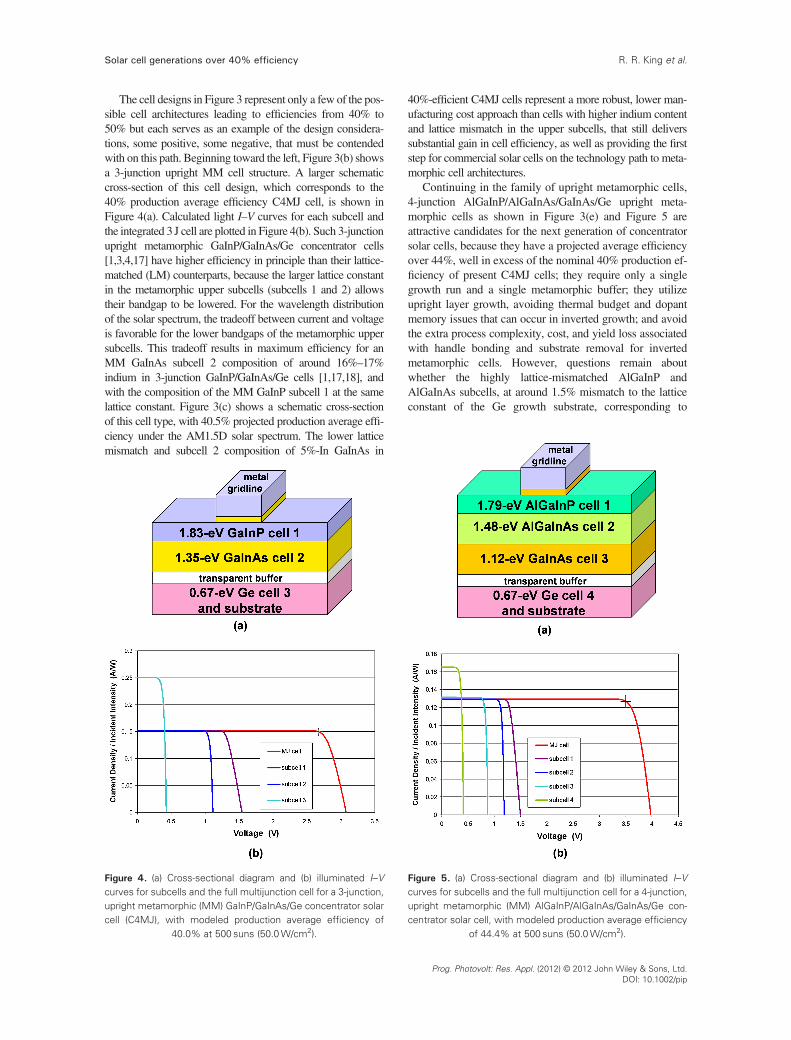
The cell designs in Figure 3 represent only a few of the pos-sible cell architectures leading to efficiencies from 40% to50% but each serves as an example of the design considera-tions, some positive, some negative, that must be contendedwith on this path. Beginning toward the left, Figure 3(b) showsa 3-junction upright MM cell structure. A larger schematiccross-section of this cell design, which corresponds to the40% production average efficiency C4MJ cell, is shown inFigure 4(a). Calculated light I–V curves for each subcell andthe integrated 3 J cell are plotted in Figure 4(b). Such 3-junctionupright metamorphic GaInP/GaInAs/Ge concentrator cells[1,3,4,17] have higher efficiency in principle than their lattice-matched (LM) counterparts, because the larger lattice constantin the metamorphic upper subcells (subcells 1 and 2) allowstheir bandgap to be lowered. For the wavelength distributionof the solar spectrum, the tradeoff between current and voltageis favorable for the lower bandgaps of the metamorphic uppersubcells. This tradeoff results in maximum efficiency for anMM GaInAs subcell 2 composition of around 16%–17%indium in 3-junction GaInP/GaInAs/Ge cells [1,17,18], andwith the composition of the MM GaInP subcell 1 at the samelattice constant. Figure 3(c) shows a schematic cross-sectionof this cell type, with 40.5% projected production average effi-ciency under the AM1.5D solar spectrum. The lower latticemismatch and subcell 2 composition of 5%-In GaInAs in
Figure 4. (a) Cross-sectional diagram and (b) illuminated I–Vcurves for subcells and the full multijunction cell for a 3-junction,upright metamorphic (MM) GaInP/GaInAs/Ge concentrator solarcell (C4MJ), with modeled production average efficiency of
40.0% at 500 suns (50.0W/cm2).
40%-efficient C4MJ cells represent a more robust, lower man-ufacturing cost approach than cells with higher indium contentand lattice mismatch in the upper subcells, that still deliverssubstantial gain in cell efficiency, as well as providing the firststep for commercial solar cells on the technology path to meta-morphic cell architectures.
Continuing in the family of upright metamorphic cells,4-junction AlGaInP/AlGaInAs/GaInAs/Ge upright meta-morphic cells as shown in Figure 3(e) and Figure 5 areattractive candidates for the next generation of concentratorsolar cells, because they have a projected average efficiencyover 44%, well in excess of the nominal 40% production ef-ficiency of present C4MJ cells; they require only a singlegrowth run and a single metamorphic buffer; they utilizeupright layer growth, avoiding thermal budget and dopantmemory issues that can occur in inverted growth; and avoidthe extra process complexity, cost, and yield loss associatedwith handle bonding and substrate removal for invertedmetamorphic cells. However, questions remain aboutwhether the highly lattice-mismatched AlGaInP andAlGaInAs subcells, at around 1.5% mismatch to the latticeconstant of the Ge growth substrate, corresponding to
Figure 5. (a) Cross-sectional diagram and (b) illuminated I–Vcurves for subcells and the full multijunction cell for a 4-junction,upright metamorphic (MM) AlGaInP/AlGaInAs/GaInAs/Ge con-centrator solar cell, with modeled production average efficiency
of 44.4% at 500 suns (50.0W/cm2).
Prog. Photovolt: Res. Appl. (2012) © 2012 John Wiley & Sons, Ltd.DOI: 10.1002/pip
Solar cell generations over 40% efficiencyR. R. King et al.
22%-In GaInAs, and with substantial Al content, can havethe required minority-carrier lifetimes and mobilities.
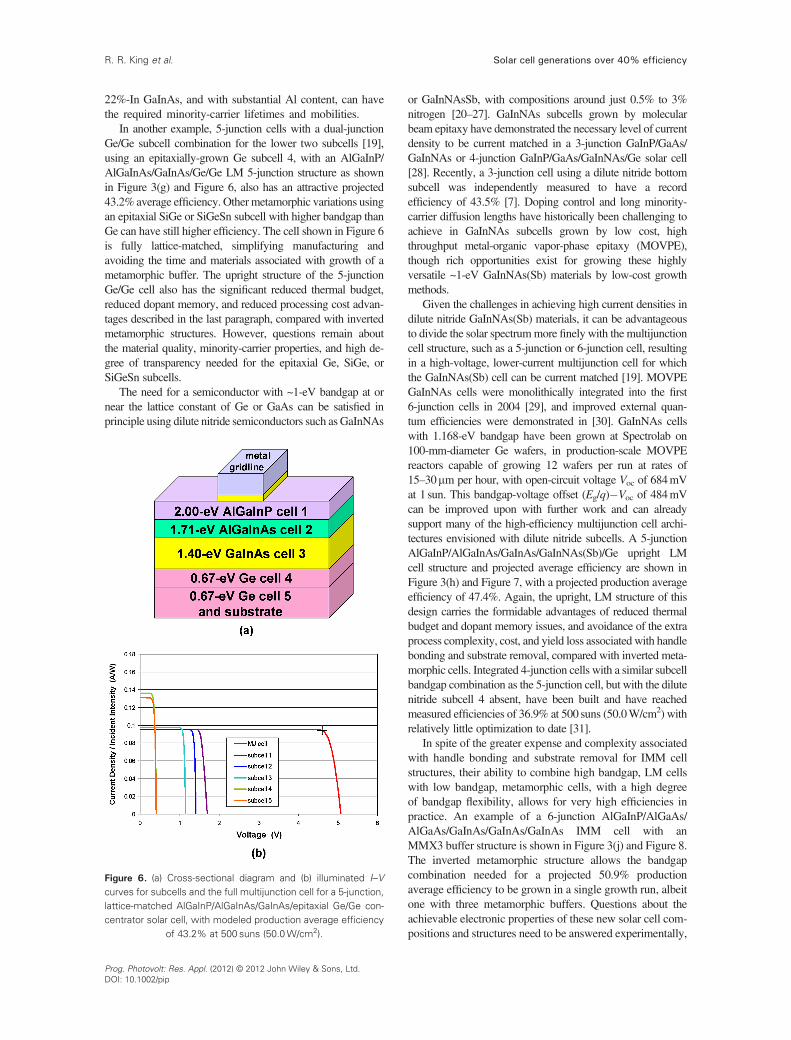
In another example, 5-junction cells with a dual-junctionGe/Ge subcell combination for the lower two subcells [19],using an epitaxially-grown Ge subcell 4, with an AlGaInP/AlGaInAs/GaInAs/Ge/Ge LM 5-junction structure as shownin Figure 3(g) and Figure 6, also has an attractive projected43.2% average efficiency. Other metamorphic variations usingan epitaxial SiGe or SiGeSn subcell with higher bandgap thanGe can have still higher efficiency. The cell shown in Figure 6is fully lattice-matched, simplifying manufacturing andavoiding the time and materials associated with growth of ametamorphic buffer. The upright structure of the 5-junctionGe/Ge cell also has the significant reduced thermal budget,reduced dopant memory, and reduced processing cost advan-tages described in the last paragraph, compared with invertedmetamorphic structures. However, questions remain aboutthe material quality, minority-carrier properties, and high de-gree of transparency needed for the epitaxial Ge, SiGe, orSiGeSn subcells.
The need for a semiconductor with ~1-eV bandgap at ornear the lattice constant of Ge or GaAs can be satisfied inprinciple using dilute nitride semiconductors such asGaInNAs
Figure 6. (a) Cross-sectional diagram and (b) illuminated I–Vcurves for subcells and the full multijunction cell for a 5-junction,lattice-matched AlGaInP/AlGaInAs/GaInAs/epitaxial Ge/Ge con-centrator solar cell, with modeled production average efficiency
of 43.2% at 500 suns (50.0W/cm2).
Prog. Photovolt: Res. Appl. (2012) © 2012 John Wiley & Sons, Ltd.DOI: 10.1002/pip
or GaInNAsSb, with compositions around just 0.5% to 3%nitrogen [20–27]. GaInNAs subcells grown by molecularbeam epitaxy have demonstrated the necessary level of currentdensity to be current matched in a 3-junction GaInP/GaAs/GaInNAs or 4-junction GaInP/GaAs/GaInNAs/Ge solar cell[28]. Recently, a 3-junction cell using a dilute nitride bottomsubcell was independently measured to have a recordefficiency of 43.5% [7]. Doping control and long minority-carrier diffusion lengths have historically been challenging toachieve in GaInNAs subcells grown by low cost, highthroughput metal-organic vapor-phase epitaxy (MOVPE),though rich opportunities exist for growing these highlyversatile ~1-eV GaInNAs(Sb) materials by low-cost growthmethods.
Given the challenges in achieving high current densities indilute nitride GaInNAs(Sb) materials, it can be advantageousto divide the solar spectrummore finely with the multijunctioncell structure, such as a 5-junction or 6-junction cell, resultingin a high-voltage, lower-current multijunction cell for whichthe GaInNAs(Sb) cell can be current matched [19]. MOVPEGaInNAs cells were monolithically integrated into the first6-junction cells in 2004 [29], and improved external quan-tum efficiencies were demonstrated in [30]. GaInNAs cellswith 1.168-eV bandgap have been grown at Spectrolab on100-mm-diameter Ge wafers, in production-scale MOVPEreactors capable of growing 12 wafers per run at rates of15–30mm per hour, with open-circuit voltage Voc of 684mVat 1 sun. This bandgap-voltage offset (Eg/q)�Voc of 484mVcan be improved upon with further work and can alreadysupport many of the high-efficiency multijunction cell archi-tectures envisioned with dilute nitride subcells. A 5-junctionAlGaInP/AlGaInAs/GaInAs/GaInNAs(Sb)/Ge upright LMcell structure and projected average efficiency are shown inFigure 3(h) and Figure 7, with a projected production averageefficiency of 47.4%. Again, the upright, LM structure of thisdesign carries the formidable advantages of reduced thermalbudget and dopant memory issues, and avoidance of the extraprocess complexity, cost, and yield loss associated with handlebonding and substrate removal, compared with inverted meta-morphic cells. Integrated 4-junction cells with a similar subcellbandgap combination as the 5-junction cell, but with the dilutenitride subcell 4 absent, have been built and have reachedmeasured efficiencies of 36.9% at 500 suns (50.0W/cm2) withrelatively little optimization to date [31].
In spite of the greater expense and complexity associatedwith handle bonding and substrate removal for IMM cellstructures, their ability to combine high bandgap, LM cellswith low bandgap, metamorphic cells, with a high degreeof bandgap flexibility, allows for very high efficiencies inpractice. An example of a 6-junction AlGaInP/AlGaAs/AlGaAs/GaInAs/GaInAs/GaInAs IMM cell with anMMX3 buffer structure is shown in Figure 3(j) and Figure 8.The inverted metamorphic structure allows the bandgapcombination needed for a projected 50.9% productionaverage efficiency to be grown in a single growth run, albeitone with three metamorphic buffers. Questions about theachievable electronic properties of these new solar cell com-positions and structures need to be answered experimentally,
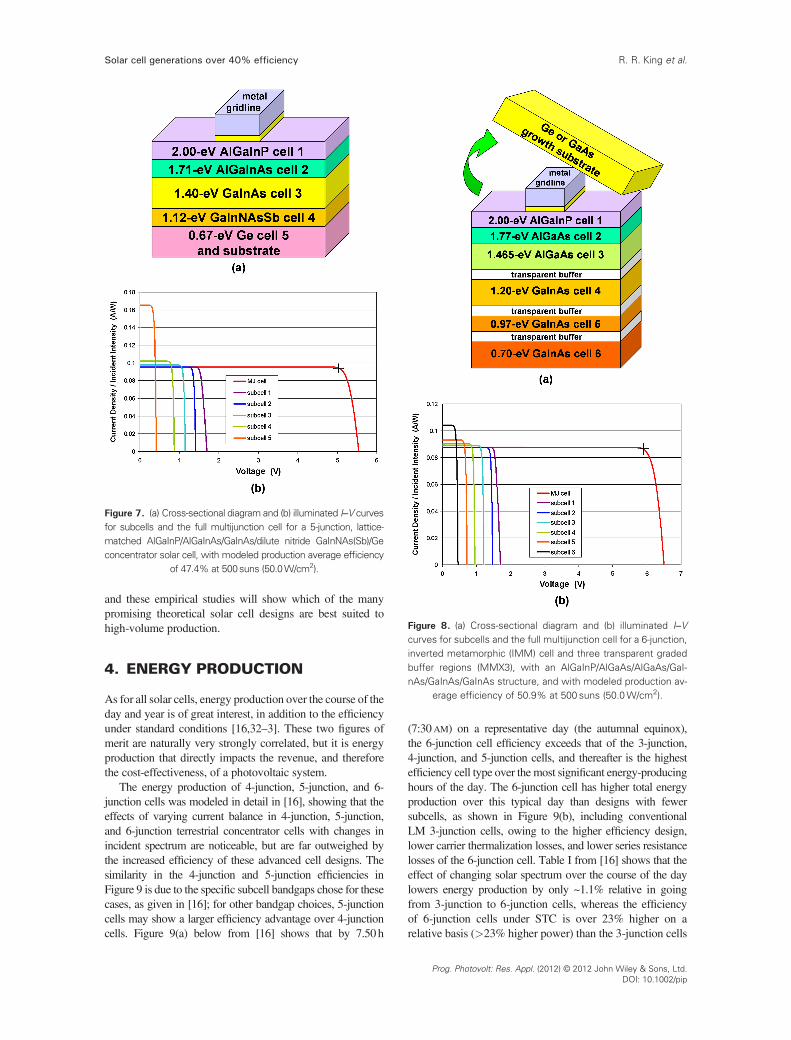
Figure 7. (a) Cross-sectional diagram and (b) illuminated I–V curvesfor subcells and the full multijunction cell for a 5-junction, lattice-matched AlGaInP/AlGaInAs/GaInAs/dilute nitride GaInNAs(Sb)/Geconcentrator solar cell, with modeled production average efficiency
of 47.4% at 500suns (50.0W/cm2).
Figure 8. (a) Cross-sectional diagram and (b) illuminated I–V
Solar cell generations over 40% efficiency R. R. King et al.
and these empirical studies will show which of the manypromising theoretical solar cell designs are best suited tohigh-volume production.
curves for subcells and the full multijunction cell for a 6-junction,inverted metamorphic (IMM) cell and three transparent gradedbuffer regions (MMX3), with an AlGaInP/AlGaAs/AlGaAs/GaI-nAs/GaInAs/GaInAs structure, and with modeled production av-
erage efficiency of 50.9% at 500 suns (50.0W/cm2).
4. ENERGY PRODUCTION
As for all solar cells, energy production over the course of theday and year is of great interest, in addition to the efficiencyunder standard conditions [16,32–3]. These two figures ofmerit are naturally very strongly correlated, but it is energyproduction that directly impacts the revenue, and thereforethe cost-effectiveness, of a photovoltaic system.
The energy production of 4-junction, 5-junction, and 6-junction cells was modeled in detail in [16], showing that theeffects of varying current balance in 4-junction, 5-junction,and 6-junction terrestrial concentrator cells with changes inincident spectrum are noticeable, but are far outweighed bythe increased efficiency of these advanced cell designs. Thesimilarity in the 4-junction and 5-junction efficiencies inFigure 9 is due to the specific subcell bandgaps chose for thesecases, as given in [16]; for other bandgap choices, 5-junctioncells may show a larger efficiency advantage over 4-junctioncells. Figure 9(a) below from [16] shows that by 7.50h
(7:30AM) on a representative day (the autumnal equinox),the 6-junction cell efficiency exceeds that of the 3-junction,4-junction, and 5-junction cells, and thereafter is the highestefficiency cell type over the most significant energy-producinghours of the day. The 6-junction cell has higher total energyproduction over this typical day than designs with fewersubcells, as shown in Figure 9(b), including conventionalLM 3-junction cells, owing to the higher efficiency design,lower carrier thermalization losses, and lower series resistancelosses of the 6-junction cell. Table I from [16] shows that theeffect of changing solar spectrum over the course of the daylowers energy production by only ~1.1% relative in goingfrom 3-junction to 6-junction cells, whereas the efficiencyof 6-junction cells under STC is over 23% higher on arelative basis (>23% higher power) than the 3-junction cells
Prog. Photovolt: Res. Appl. (2012) © 2012 John Wiley & Sons, Ltd.DOI: 10.1002/pip

Figure 9. (a) Multijunction cell efficiency over the course of the day, modeled for 3-junction, 4-junction, 5-junction, and 6-junction cellson the autumnal equinox and (b) modeled cumulative energy produced per unit area over the day, clearly showing that the higher ef-ficiency 4-junction and 5-junction cell designs produce more energy than conventional 3-junction cells, and 6-junction cells produce
more than any of the other cell designs by the end of the day (from [16]).
Solar cell generations over 40% efficiencyR. R. King et al.
in Table I. Thus, having greater than three junctions is not anoverall impediment to the energy production of a multijunc-tion cell, and because a greater number of junctions alsoallow for higher efficiency, such cells with 4-junction,5-junction, and 6-junction are actually a route toward higherenergy production that is difficult to avoid.
5. EXPERIMENTAL RESULTS
Experimental results are given in this section for some oftoday’s state-of-the-art multijunction cells. Figure 10 charts ef-ficiency distributions for the last five generations of Spectrolabproduction terrestrial concentrator cells at 500 suns (50.0W/cm2): the C1MJ, C2MJ, C3MJ, C3MJ+, and C4MJ cells.Upright metamorphic 3-junction GaInP/GaInAs/Ge concen-trator cells, of the type that were first to reach over the 40%
Prog. Photovolt: Res. Appl. (2012) © 2012 John Wiley & Sons, Ltd.DOI: 10.1002/pip
efficiency milestone, have now entered manufacturingproduction as the C4MJ cell. As shown in Figure 10, manufac-turing production of the C4MJ terrestrial concentrator cell hasdemonstrated an average efficiency of 39.8% to date and isexpected climb to the nominal 40% average efficiency forC4MJ as production continues.
Measurements are shown here for the first time of anupright metamorphic 3-junction GaInP/GaInAs/Ge solarcell with independently-confirmed 41.6% efficiency at484 suns (48.4W/cm2) (AM1.5D, ASTM G173-03,25 �C), the highest yet demonstrated for an uprightmetamorphic solar cell of this highly manufacturabletype, requiring a single MOVPE growth run. Thismetamorphic cell result matches the earlier recordefficiency of 41.6% on a LM 3-junction GaInP/GaInAs/Ge cell [5]. The present metamorphic cell result isparticularly remarkable because it was achieved at the
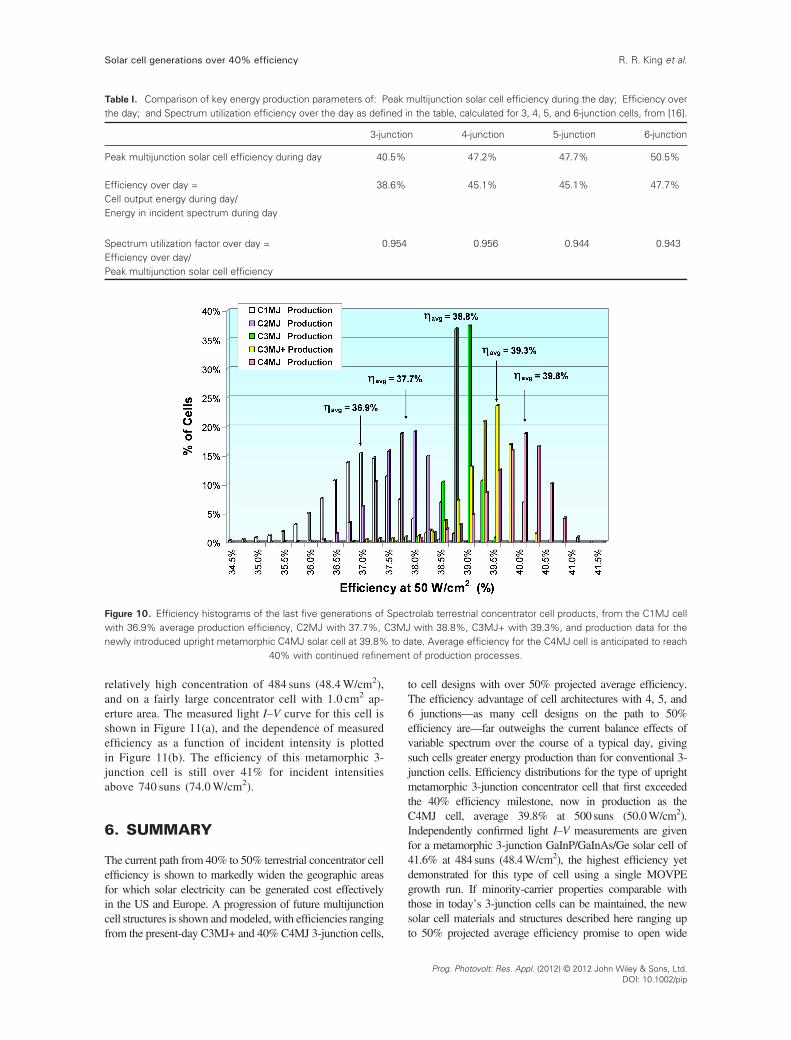
Table I. Comparison of key energy production parameters of: Peak multijunction solar cell efficiency during the day; Efficiency overthe day; and Spectrum utilization efficiency over the day as defined in the table, calculated for 3, 4, 5, and 6-junction cells, from [16].
3-junction 4-junction 5-junction 6-junction
Peak multijunction solar cell efficiency during day 40.5% 47.2% 47.7% 50.5%
Efficiency over day = 38.6% 45.1% 45.1% 47.7%Cell output energy during day/Energy in incident spectrum during day
Spectrum utilization factor over day = 0.954 0.956 0.944 0.943Efficiency over day/Peak multijunction solar cell efficiency
Figure 10. Efficiency histograms of the last five generations of Spectrolab terrestrial concentrator cell products, from the C1MJ cellwith 36.9% average production efficiency, C2MJ with 37.7%, C3MJ with 38.8%, C3MJ+ with 39.3%, and production data for thenewly introduced upright metamorphic C4MJ solar cell at 39.8% to date. Average efficiency for the C4MJ cell is anticipated to reach
40% with continued refinement of production processes.
Solar cell generations over 40% efficiency R. R. King et al.
relatively high concentration of 484 suns (48.4W/cm2),and on a fairly large concentrator cell with 1.0 cm2 ap-erture area. The measured light I–V curve for this cell isshown in Figure 11(a), and the dependence of measuredefficiency as a function of incident intensity is plottedin Figure 11(b). The efficiency of this metamorphic 3-junction cell is still over 41% for incident intensitiesabove 740 suns (74.0W/cm2).
6. SUMMARY
The current path from 40% to 50% terrestrial concentrator cellefficiency is shown to markedly widen the geographic areasfor which solar electricity can be generated cost effectivelyin the US and Europe. A progression of future multijunctioncell structures is shown andmodeled, with efficiencies rangingfrom the present-day C3MJ+ and 40% C4MJ 3-junction cells,
to cell designs with over 50% projected average efficiency.The efficiency advantage of cell architectures with 4, 5, and6 junctions—as many cell designs on the path to 50%efficiency are—far outweighs the current balance effects ofvariable spectrum over the course of a typical day, givingsuch cells greater energy production than for conventional 3-junction cells. Efficiency distributions for the type of uprightmetamorphic 3-junction concentrator cell that first exceededthe 40% efficiency milestone, now in production as theC4MJ cell, average 39.8% at 500 suns (50.0W/cm2).Independently confirmed light I–V measurements are givenfor a metamorphic 3-junction GaInP/GaInAs/Ge solar cell of41.6% at 484 suns (48.4W/cm2), the highest efficiency yetdemonstrated for this type of cell using a single MOVPEgrowth run. If minority-carrier properties comparable withthose in today’s 3-junction cells can be maintained, the newsolar cell materials and structures described here ranging upto 50% projected average efficiency promise to open wide
Prog. Photovolt: Res. Appl. (2012) © 2012 John Wiley & Sons, Ltd.DOI: 10.1002/pip
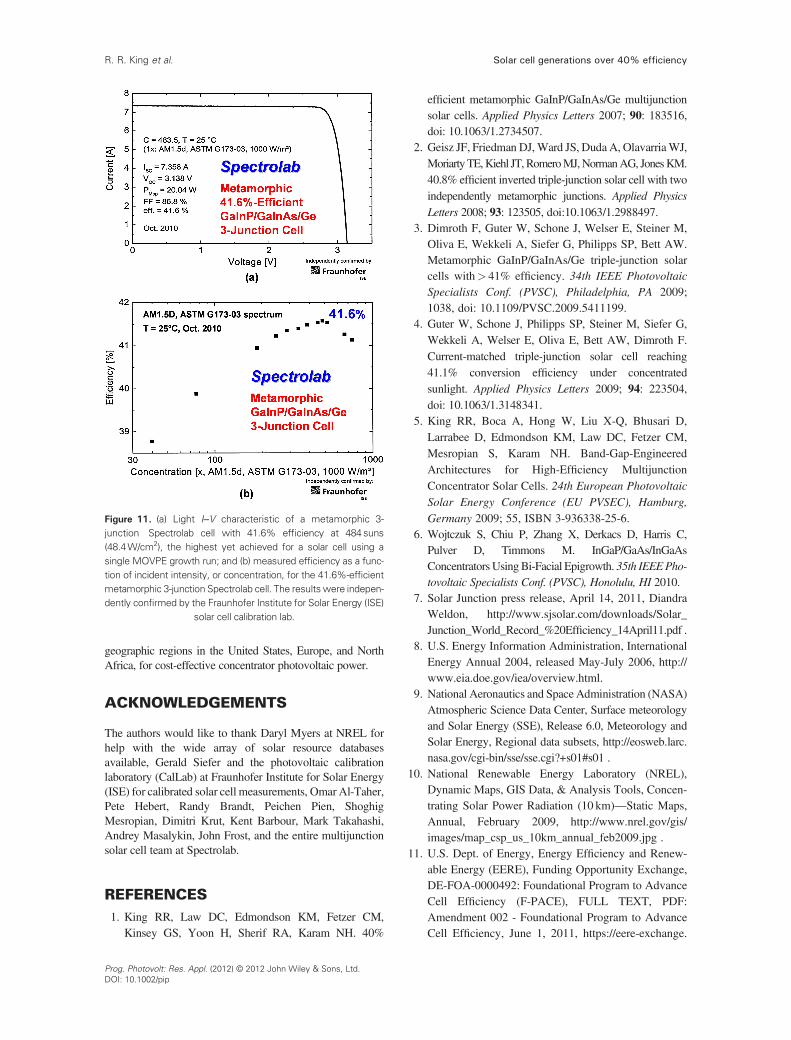
Figure 11. (a) Light I–V characteristic of a metamorphic 3-junction Spectrolab cell with 41.6% efficiency at 484 suns(48.4W/cm2), the highest yet achieved for a solar cell using asingle MOVPE growth run; and (b) measured efficiency as a func-tion of incident intensity, or concentration, for the 41.6%-efficientmetamorphic 3-junction Spectrolab cell. The resultswere indepen-dently confirmed by the Fraunhofer Institute for Solar Energy (ISE)
solar cell calibration lab.
Solar cell generations over 40% efficiencyR. R. King et al.
geographic regions in the United States, Europe, and NorthAfrica, for cost-effective concentrator photovoltaic power.
ACKNOWLEDGEMENTS
The authors would like to thank Daryl Myers at NREL forhelp with the wide array of solar resource databasesavailable, Gerald Siefer and the photovoltaic calibrationlaboratory (CalLab) at Fraunhofer Institute for Solar Energy(ISE) for calibrated solar cell measurements, Omar Al-Taher,Pete Hebert, Randy Brandt, Peichen Pien, ShoghigMesropian, Dimitri Krut, Kent Barbour, Mark Takahashi,Andrey Masalykin, John Frost, and the entire multijunctionsolar cell team at Spectrolab.
REFERENCES1. King RR, Law DC, Edmondson KM, Fetzer CM,
Kinsey GS, Yoon H, Sherif RA, Karam NH. 40%
Prog. Photovolt: Res. Appl. (2012) © 2012 John Wiley & Sons, Ltd.DOI: 10.1002/pip
efficient metamorphic GaInP/GaInAs/Ge multijunctionsolar cells. Applied Physics Letters 2007; 90: 183516,doi: 10.1063/1.2734507.
2. Geisz JF, Friedman DJ,Ward JS, DudaA, OlavarriaWJ,MoriartyTE,Kiehl JT,RomeroMJ,NormanAG, JonesKM.40.8% efficient inverted triple-junction solar cell with twoindependently metamorphic junctions. Applied Physics
Letters 2008; 93: 123505, doi:10.1063/1.2988497.3. Dimroth F, Guter W, Schone J, Welser E, Steiner M,
Oliva E, Wekkeli A, Siefer G, Philipps SP, Bett AW.Metamorphic GaInP/GaInAs/Ge triple-junction solarcells with> 41% efficiency. 34th IEEE PhotovoltaicSpecialists Conf. (PVSC), Philadelphia, PA 2009;1038, doi: 10.1109/PVSC.2009.5411199.
4. Guter W, Schone J, Philipps SP, Steiner M, Siefer G,Wekkeli A, Welser E, Oliva E, Bett AW, Dimroth F.Current-matched triple-junction solar cell reaching41.1% conversion efficiency under concentratedsunlight. Applied Physics Letters 2009; 94: 223504,doi: 10.1063/1.3148341.
5. King RR, Boca A, Hong W, Liu X-Q, Bhusari D,Larrabee D, Edmondson KM, Law DC, Fetzer CM,Mesropian S, Karam NH. Band-Gap-EngineeredArchitectures for High-Efficiency MultijunctionConcentrator Solar Cells. 24th European Photovoltaic
Solar Energy Conference (EU PVSEC), Hamburg,
Germany 2009; 55, ISBN 3-936338-25-6.6. Wojtczuk S, Chiu P, Zhang X, Derkacs D, Harris C,
Pulver D, Timmons M. InGaP/GaAs/InGaAsConcentratorsUsingBi-Facial Epigrowth. 35th IEEEPho-tovoltaic Specialists Conf. (PVSC), Honolulu, HI 2010.
7. Solar Junction press release, April 14, 2011, DiandraWeldon, http://www.sjsolar.com/downloads/Solar_Junction_World_Record_%20Efficiency_14April11.pdf .
8. U.S. Energy Information Administration, InternationalEnergy Annual 2004, released May-July 2006, http://www.eia.doe.gov/iea/overview.html.
9. National Aeronautics and Space Administration (NASA)Atmospheric Science Data Center, Surface meteorologyand Solar Energy (SSE), Release 6.0, Meteorology andSolar Energy, Regional data subsets, http://eosweb.larc.nasa.gov/cgi-bin/sse/sse.cgi?+s01#s01 .
10. National Renewable Energy Laboratory (NREL),Dynamic Maps, GIS Data, & Analysis Tools, Concen-trating Solar Power Radiation (10 km)—Static Maps,Annual, February 2009, http://www.nrel.gov/gis/images/map_csp_us_10km_annual_feb2009.jpg .
11. U.S. Dept. of Energy, Energy Efficiency and Renew-able Energy (EERE), Funding Opportunity Exchange,DE-FOA-0000492: Foundational Program to AdvanceCell Efficiency (F-PACE), FULL TEXT, PDF:Amendment 002 - Foundational Program to AdvanceCell Efficiency, June 1, 2011, https://eere-exchange.
Solar cell generations over 40% efficiency R. R. King et al.
energy.gov/Default.aspx#1767d3fc-9c9e-4c93-bb3e-6d93ecf0105f .
12. Swanson RM. The Promise of Concentrators. Progressin Photovoltaics: Research and Applications 2000; 8:93–111.
13. Green MA. Third generation photovoltaics: ultra-highconversion efficiency at low cost. Progress in Photo-voltaics: Research and Applications 2001; 9: 123,doi: 10.1002/pip.360.
14. Ermer JH, Jones RK, Hebert P, Pien P, King RR,Bhusari D, Brandt R, Al-Taher O, Fetzer C, Kinsey GS,Karam N. Status of C3MJ+and C4MJ ProductionConcentrator Solar Cells at Spectrolab. 37th IEEE Photo-voltaic Specialists Conf. (PVSC), Seattle, Washington2011.
15. King RR, Law DC, Edmondson KM, Fetzer CM,Kinsey GS, Yoon H, Sherif RA, Krut DD, Ermer JH,Hebert P, Pien P, Karam NH. Multijunction SolarCells with Over 40% Efficiency and Future Directionsin Concentrator PV. 22nd European PhotovoltaicSolar Energy Conf., Milan, Italy 2007; 11–15.
16. King RR, Bhusari D, Boca A, Larrabee D, Liu X-Q,Hong W, Fetzer CM, Law DC, Karam NH. Bandgap-voltage offset and energy production in next-generation multijunction solar cells. Progress inPhotovoltaics: Research and Applications 2011; 19:797–812, doi: 10.1002/pip.1044, and 5th World Conf.on Photovoltaic Energy Conversion and 25th Euro-pean Photovoltaic Solar Energy Conf., Valencia,Spain, Sep. 2010, pp. 33–46.
17. King RR, Haddad M, Isshiki T, Colter P, Ermer J,Yoon H, Joslin DE, Karam NH. MetamorphicGaInP/GaInAs/Ge Solar Cells. 28th IEEE Photovol-taic Specialists Conf. (PVSC), Anchorage, Alaska2000; 982–985.
18. King RR, Sherif RA, Law DC, Yen JT, Haddad M,Fetzer CM, Edmondson KM, Kinsey GS, Yoon H,Joshi M, Mesropian S, Cotal HL, Krut DD, ErmerJH, Karam NH. New Horizons in III-V MultijunctionTerrestrial Concentrator Cell Research. 21st EuropeanPhotovoltaic Solar Energy Conf., Dresden, Germany
2006; 124–128.19. U.S. Pat. No. 6,316,715, Multijunction Photovoltaic
Cell with Thin 1st (Top) Subcell and Thick 2ndSubcell of Same or Similar Semiconductor Material.R. R. King, D. E. Joslin, N. H. Karam, filed Mar. 15,2000, issued Nov. 13, 2001.
20. Geisz JF, Friedman DJ, Olson JM, Kurtz SR,Keyes BM, Journal of Crystal Growth 1998; 195: 401.
21. Kurtz SR, Allerman AA, Seager CH, Sieg RM,Jones ED, Applied Physics Letters 2000; 77: 400.
22. Kurtz SR, Allerman AA, Jones ED, Gee JM, Banas JJ,Hammons BE, Applied Physics Letters 1999; 74: 729.
23. Li JZ, Lin JY, Jiang HX, Geisz JF, Kurtz SR, AppliedPhysics Letters 1999; 75: 1899.
24. Kurtz S, Geisz JF, Friedman DJ, Metzger WK,King RR, Karam NH, Journal of Applied Physics2004; 95: 2505.
25. Kurtz S, Geisz JF, Keyes BM,MetzgerWK, FriedmanDJ,Olson JM, PtakAJ, KingRR, KaramNH,Applied PhysicsLetters 2003; 82: 2634.
26. Volz K, Torunski T, Lackner D, Rubel O, Stolz W,Baur C, Muller S, Dimroth F, Bett AW. Material de-velopment for improved 1 eV (GaIn)(NAs) solar cellstructures. Transaction of the ASME 2007; 129: 266.
27. Volz K, Lackner D,Nemeth I, Kunert B, StolzW, Baur C,Dimroth F, Bett AW. Optimization of annealingconditions of (GaIn)(NAs) for solar cell applications.Journal of Crystal Growth 2008; 310: 2222.
28. Jackrel DB, Bank SR, Yuen HB, Wistey MA,Harris JS, Jr., Ptak AJ, Johnston SW, Friedman DJ,Kurtz SR, Journal of Applied Physics 2007; 101: 114916.
29. King RR, Fetzer CM, Edmondson KM, Law DC,Colter PC, Cotal HL, Sherif RA, Yoon H, Isshiki T,Krut DD, Kinsey GS, Ermer JH, Kurtz S, Moriarty T,Kiehl J, Emery K, Metzger WK, Ahrenkiel RK,Karam NH. Metamorphic III-V Materials, SublatticeDisorder, and Multijunction Solar Cell Approacheswith Over 37% Efficiency. Proc. 19th EuropeanPhotovoltaic Solar Energy Conf., Paris, France, June7–11, 2004; 3587–3593.
30. King RR, Law DC, Fetzer CM, Sherif RA,Edmondson KM, Kurtz S, Kinsey GS, Cotal HL,Krut DD, Ermer JH, Karam NH. Pathways to40%-Efficient Concentrator Photovoltaics. Proc.20th European Photovoltaic Solar Energy Conf.,Barcelona, Spain, June 6–10, 2005; 118–123.
31. King RR, Boca A, Hong W, Liu X-Q, Bhusari D,Larrabee D, Edmondson KM, Law DC, Fetzer CM,Mesropian S, Karam NH.. Band-Gap-EngineeredArchitectures for High-Efficiency Multijunction Con-centrator Solar Cells. 24th European Photovoltaic
Solar Energy Conf., Hamburg, Germany, Sep. 21–25,2009; 55–61.
32. Létay G, Baur C, Bett AW. Theoretical Investigationsof III-V Multi-junction Concentrator Cells UnderRealistic Spectral Conditions. 19th European Photo-
voltaic Solar Energy Conf. 2004; 187–190.33. King RR, Sherif RA, Law DC, Yen JT, Haddad M,
Fetzer CM, Edmondson KM, Kinsey GS, Yoon H,Joshi M, Mesropian S, Cotal HL, Krut DD, Ermer JH,Karam NH. New Horizons in III-V MultijunctionTerrestrial Concentrator Cell Research. 21st Euro-pean Photovoltaic Solar Energy Conference(EU PVSEC), Dresden, Germany 2006; 124, ISBN3-936338-20-5.
Prog. Photovolt: Res. Appl. (2012) © 2012 John Wiley & Sons, Ltd.DOI: 10.1002/pip
34. Kinsey GS, Edmondson KM. Spectral response andenergy output of concentrator multijunction solar cells.Progress in Photovoltaics: Research and Applications2009; 17: 279–288, doi: 10.1002/pip.
35. Newman F, Aiken D, Patel P, Chumney D, Aeby I,Hoffman R, Sharps P. Optimization of inverted meta-morphic multijunction solar cells for field-deployedconcentrating PV systems. 34th IEEE PhotovoltaicSpecialists Conference (PVSC) 2009; 1611–1616, doi:10.1109/PVSC.2009.5411385
36. Philipps SP, Peharz G, Hoheisel R, Hornung T,Al-Abbadi NM, Dimroth F, Bett AW. Energy harvestingefficiency of III-V triple-junction concentrator solar cellsunder realistic spectral conditions. Solar Energy Materi-als and Solar Cells 2010; 94: 869–877, ISSN 0927–0248, doi: 10.1016/j.solmat.2010.01.010.
37. Dimroth F, Philipps SP, Peharz G,Welser E, Kellenbenz R,Roesener T, Klinger V, Oliva E, Steiner M, Meusel M,Guter W, Bett AW. Promises of Advanced Multi-junction Solar Cells for the Use in CPV Systems. 35thIEEE Photovoltaic Specialists Conf. (PVSC), Honolulu,HI 2010.
38. Spectrolab data sheet, CPV Point Focus Solar Cells,C4MJ Metamorphic Fourth Generation CPV Technol-ogy, July 12, 2011, http://www.spectrolab.com/Data-Sheets/PV/CPV/C4MJ_40Percent_Solar_Cell.pdf.
39. Verlinden PJ, Lewandowski A, Bingham C, Kinsey GS,Sherif RA, Lasich JB. Performance and Reliability ofMultijunction III-V Modules for Concentrator Dish andCentral Receiver Applications. 4th World Conf. onPhotovoltaic Energy Conversion (WCPEC), Waikoloa,Hawaii 2006.
APPENDIX A
The economic benefits of high-efficiency are straightfor-ward to calculate. In a simplified approach, the system costper unit of generated energy, (C/E)system, is the cost of thesystem per unit module aperture area, divided by theenergy per area generated over a given payback time:
in units of $/kWh of generated electricity, where:
Cmod
Amod¼ Ccell þ Ccell pkg
� �Acell
1Rgeo
� �þ Cmod pkg
Amod(A2)
Psystem; rated ¼ Intinc;ratedZAC;systemAmod (A3)
and:
Ccell = cost of solar cells in systemCcell pkg = cost of cell packaging (excl. cell), e.g.,
ceramic mount, electrical interconnects,bypass diode, secondary concentrator,other elements of receiver package
Cmod pkg = cost of module packaging (excl. cells andcell packaging), e.g., glazing, lenses ormirrors of primary concentrator, encap-sulation, module housing, etc.
Ctracking = cost of tracking mechanismCBOS, area = cost of area-related balance-of-system (BOS)
hardware (excl. tracking and powerconditioning), e.g., support structures, wiring
CIMF = cost of installation, operations andmaintenance, and financing
Cpwr cond/Psystem,rated = cost of power conditioning unit (inverter)
for system, divided by rated poweroutput of system
Acell = aperture area of cells in systemAmod = aperture area of modules in systemRgeo = geometric concentration ratio of
system�Amod/Acell
Intinc,rated = incident intensity of sunlight at whichsystem power is rated, typically 1000W/m2
Intannual avg = intensity of solar resource (direct normal forconcentrator system, global for flat-platesystem) in a given geographic location,typically in units of kWh/(m2 day)
Tpayback = time allotted to pay back capital cost ofsystem, using revenue from power generated
�AC, system = total efficiency of PV system, fromsunlight to AC power.
Equation A1 is the same as Eqn. 1 discussed earlier, butwith greater detail in the costs shown, because CBOS in Eqn
1 is defined to be Ctracking +CBOS, area +CIMF. For a fixed,non-tracking PV system Ctracking = 0.
In terms of cost per watt, or $/W, the system cost perunit rated power is:
C
E
� �system
¼Cmod
Amodþ Ctracking
Amodþ CBOS; area
Amodþ CIMF
Amodþ Cpwr cond
Amod
Intannual avgZAC;systemTpayback
¼Ccell þ Ccell pkg� �
Acell
1Rgeo
� �þ Cmod pkg
Amodþ Ctracking
Amodþ CBOS; area
Amodþ CIMF
Amodþ Cpwr cond
Psystem; rated
� �Intinc;ratedZAC;system
Intannual avgZAC;systemTpayback
(A1)
Solar cell generations over 40% efficiencyR. R. King et al.
Prog. Photovolt: Res. Appl. (2012) © 2012 John Wiley & Sons, Ltd.DOI: 10.1002/pip
C
P
� �system
¼ Cmod þ Ctracking þ CBOS; area þ CIMF þ Cpwr cond
Psystem; rated
¼Cmod
Amodþ Ctracking
Amodþ CBOS; area
Amodþ CIMF
Amodþ Cpwr cond
Amod
Intinc; ratedZAC;system
(A4)such that:
C
P
� �system
¼ C
E
� �system
Intannual avg TpaybackIntinc; rated
� �(A5)
in units of $/W.For the four cases discussed in the text, the cost para-
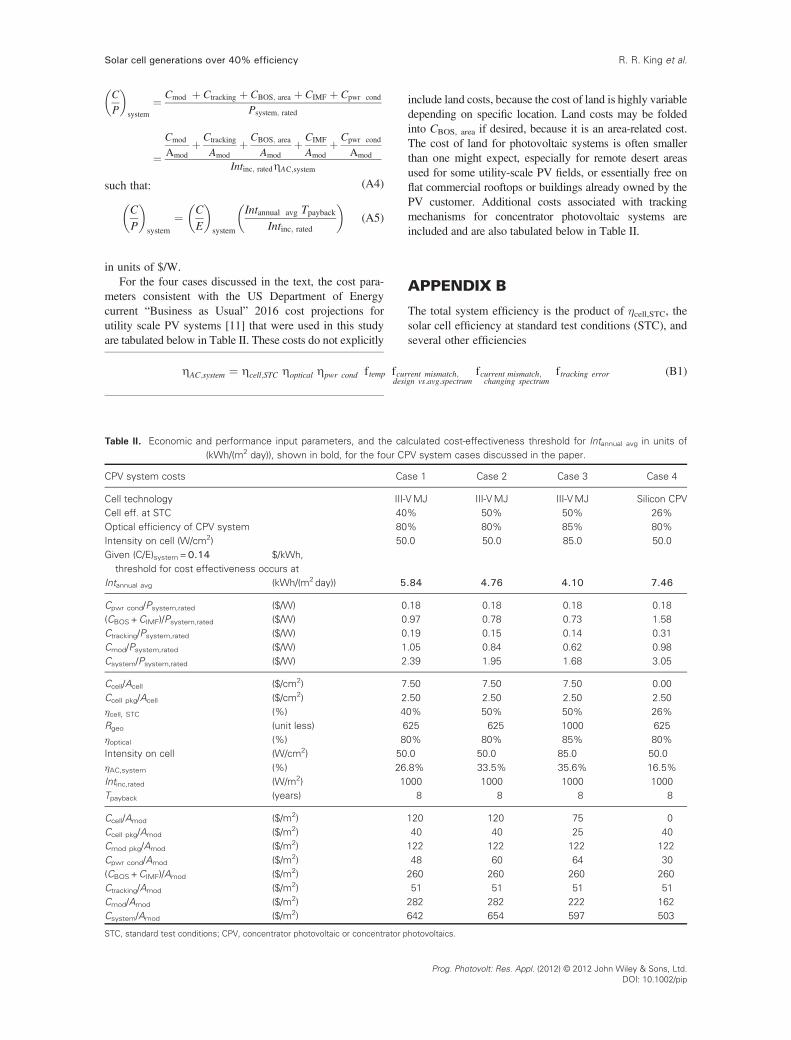
meters consistent with the US Department of Energycurrent “Business as Usual” 2016 cost projections forutility scale PV systems [11] that were used in this studyare tabulated below in Table II. These costs do not explicitly
include land costs, because the cost of land is highly variabledepending on specific location. Land costs may be foldedinto CBOS, area if desired, because it is an area-related cost.The cost of land for photovoltaic systems is often smallerthan one might expect, especially for remote desert areasused for some utility-scale PV fields, or essentially free onflat commercial rooftops or buildings already owned by thePV customer. Additional costs associated with trackingmechanisms for concentrator photovoltaic systems areincluded and are also tabulated below in Table II.
APPENDIX B
The total system efficiency is the product of �cell,STC, thesolar cell efficiency at standard test conditions (STC), andseveral other efficiencies
Table II. Economic and performance input parameters, and the calculated cost-effectiveness threshold for Intannual avg in units of(kWh/(m2 day)), shown in bold, for the four CPV system cases discussed in the paper.
CPV system costs Case 1 Case 2 Case 3 Case 4
Cell technology III-VMJ III-VMJ III-VMJ Silicon CPVCell eff. at STC 40% 50% 50% 26%Optical efficiency of CPV system 80% 80% 85% 80%Intensity on cell (W/cm2) 50.0 50.0 85.0 50.0Given (C/E)system=0.14 $/kWh,
threshold for cost effectiveness occurs atIntannual avg (kWh/(m2 day)) 5.84 4.76 4.10 7.46
Cpwr cond/Psystem,rated ($/W) 0.18 0.18 0.18 0.18(CBOS+CIMF)/Psystem,rated ($/W) 0.97 0.78 0.73 1.58Ctracking/Psystem,rated ($/W) 0.19 0.15 0.14 0.31Cmod/Psystem,rated ($/W) 1.05 0.84 0.62 0.98Csystem/Psystem,rated ($/W) 2.39 1.95 1.68 3.05
Ccell/Acell ($/cm2) 7.50 7.50 7.50 0.00Ccell pkg/Acell ($/cm2) 2.50 2.50 2.50 2.50�cell, STC (%) 40% 50% 50% 26%Rgeo (unit less) 625 625 1000 625�optical (%) 80% 80% 85% 80%Intensity on cell (W/cm2) 50.0 50.0 85.0 50.0�AC,system (%) 26.8% 33.5% 35.6% 16.5%Intinc,rated (W/m2) 1000 1000 1000 1000Tpayback (years) 8 8 8 8
Ccell/Amod ($/m2) 120 120 75 0Ccell pkg/Amod ($/m2) 40 40 25 40Cmod pkg/Amod ($/m2) 122 122 122 122Cpwr cond/Amod ($/m2) 48 60 64 30(CBOS+CIMF)/Amod ($/m2) 260 260 260 260Ctracking/Amod ($/m2) 51 51 51 51Cmod/Amod ($/m2) 282 282 222 162Csystem/Amod ($/m2) 642 654 597 503
STC, standard test conditions; CPV, concentrator photovoltaic or concentrator photovoltaics.
ZAC;system ¼ Zcell;STC Zoptical Zpwr cond f temp fcurrent mismatch;design vs:avg:spectrum
fcurrent mismatch;changing spectrum
f tracking error (B1)
Solar cell generations over 40% efficiency R. R. King et al.
Prog. Photovolt: Res. Appl. (2012) © 2012 John Wiley & Sons, Ltd.DOI: 10.1002/pip

where:
�optical = efficiency of system optics (e.g.,primary and secondary concentrators)
�pwr cond = efficiency of power conditioningunit
ftemp = fraction of power at STC remainingat operating temperature
fcurrent mismatch,
design vs. avg. spectrum
= fraction of power remainingbecause of the differencebetween the standard design solarspectrum and average actualspectrum
fcurrent mismatch,
changing spectrum
= fraction of energy productionremaining because of changes inthe actual spectrum over the dayand year, with respect to theaverage actual spectrum
ftracking error = fraction of energy productionremaining because of tracking errors
For the four cases discussed in the text, the variouscontributions to concentrator photovoltaic (CPV) system effi-ciency that were used in this study are tabulated below inTable III:
Table III. Efficiency and performance factors contributing to overall CPV system efficiency, shown in bold, for the four CPV systemcases described in the text.
CPV system efficiency
Celltechnology
Celleff. at(STC)
Opticalefficiencyof CPVsystem
Intensityon cell(W/cm2)
�AC,
system
�cell,
STC �optical
�pwr
cond ftemp
fcurrent mismatch,
design vs.
avg. spectrum
fcurrent mismatch,
changing spectrum
ftracking
error
Case 1 III-VMJ 40% 80% 50.0 26.8% 40% 80% 97% 0.925 0.99 0.954 0.99Case 2 III-VMJ 50% 80% 50.0 33.5% 50% 80% 98% 0.925 0.99 0.944 0.99Case 3 III-VMJ 50% 85% 85.0 35.6% 50% 85% 98% 0.925 0.99 0.944 0.99Case 4 Silicon CPV 26% 80% 50.0 16.5% 26% 80% 97% 0.825 1.0 1.0 0.99
STC, standard test conditions; CPV, concentrator photovoltaic or concentrator photovoltaics.
For the temperature dependence, a temperature delta of50 �C was assumed between an operating temperature of75 �C and the temperature at STC of 25 �C. The powertemperature coefficient used was �0.15 relative%/�Cfor III-V multijunction cells (�0.06 absolute%/�C inefficiency) [4], and �0.35 relative%/�C for high-efficiencysilicon back contact CPV cells [5]. In practical applications,the spectrum for which the subcells in a multijunction cellare designed to be current matched, the design spectrum,may be somewhat different than the average spectrumunder actual operating conditions, as discussed in [14]. Thiscan reduce the energy production of the multijunction cell andis accounted for in Eqn B1 with the factorf current mismatch;design vs: avg: spectrum . Additionally, the actual spectrum at
any given time is typically different than the average actualspectrum, contributing to current mismatch among subcells,and reducing the overall energy production of themultijunction cell. This effect is quantified by the factorf current mismatch;changing spectrum
in Eqn B1 and was modeled as the
spectrum utilization factor over day in [16], as shown inTable I. Themodeled values for this spectrum utilization factorof 0.954 for a 3-junction cell were used in Case 1 for a 40%efficient cell, and 0.944 for a 5-junction cell was used forCases 2 and 3 for 50% efficient cells, as shown in Table III.
Solar cell generations over 40% efficiencyR. R. King et al.
Prog. Photovolt: Res. Appl. (2012) © 2012 John Wiley & Sons, Ltd.DOI: 10.1002/pip