Embed Size (px)
Citation preview

Solano Community College
Student Equity Plan 2013-2018
ADOPTED BY SCC GOVERNING BOARD ON 9-18-13
4000 Suisun Valley Road
Fairfield, CA 94534-3197


STUDENT EQUITY AT
SOLANO COMMUNITY COLLEGE
The overarching equity goal at Solano Community College is to provide a teaching and learning environment that is welcoming, supportive, and accessible to all participants, regardless of ethnicity, culture, nationality, language, disability, gender, sexual orientation, or religion, and to ensure that all students have an equal opportunity for academic success.
Excerpt from: Student Equity Plan 2013-2018

Student Equity Plan 2013-18
Table of Contents
Certification of the Student Equity Plan
I. Executive Summary…………………………………………………………………………………………………… 1
A. Goals……………………………………..……………………………………………………………………………. 1
B. Student Equity Indicators and Target Groups……………………………………………………… 2
C. Activities…………………….………………………………………………………………………………………. 3
II. Resources for Student Access and Success………………………………………………………………… 4
III. Campus –Based Research…………………………………………………………..……………………………… 7
A. Overview ……………………………………………………………………………….…………….……………. 7
B. Data Analysis Findings ………………………………………………………………………………………… 8 Access…………………………………………………………….……………………………...…………………… 8 Basic Skills and ESL Course Completion…………..……………………………..…………………… 10 Retention and Persistence……………………………………………..……………………………….….. 12 Degree and Certificate Completion ……………………………………………………………………. 13 Transfer...……………………………………………………………………………………………………………. 14
IV. Goals and Activities…………………………………………………………………………………………………... 15
Access…………………………………………........................................................................ 15 Basic Skills and ESL Course Completion……………………………………………………………….. 16 Retention and Persistence………………………………………………………………………………….. 17 Degree and Certificate Completion……………………………………………………………………… 18 Transfer.……………………………………………………………………………………………………………… 19
V. Budget and Sources of Funding…………………………………………………………………………………. 20
VI. Integration of Equity Plan into College Planning………………………………………………………… 20
VII. Evaluation Schedule and Processes ………………………………………………………………………….. 21
Appendix I: SEP Data, Fall 2007-2011 ……………………………………………..…………………………………… 22
Part A. 2010 Census County Data……………………………………………………………………….. 22 Part B. CCCCO/MIS Data…………………….………………………………………………………..…….. 24
Appendix II: SCC Student Success Scorecard, 2006-2012……………………………………………………… 37 Appendix III: Basic Skills Initiative 2011-12 End of Year Report……………………………………….…….. 43 Student Equity Committee Membership 2013-14………………………………………………………..………… 53

Page 1
The Student Equity Plan (SEP) is divided into seven major sections:
I. Executive Summary, II. Resources for Student Access and Success, III. Campus Based Research and Data Analysis, IV. Goals and Activities, V. Budget and Funding Sources, VI. Integration of the Equity Plan into College Planning, and VII. Evaluation Schedule and Processes.
I. Executive Summary
A. Goals
Solano Community College is committed to assuring student equity in all educational programs and
College services (SCCD Policy 5355). We define student equity simply as that condition where, “all
students enjoy the same right and access to education.”
The College serves 9,702 students (Fall 2013 census) at campuses in Fairfield, Vacaville, and Vallejo
and in the surrounding communities including Travis Air Force Base, Winters, Dixon, and Benicia. The
College provides programs and services to ensure that all students have the opportunity to succeed
academically. The overarching equity goal at Solano Community College is to provide a teaching and
learning environment that is welcoming, supportive, and accessible to all participants, regardless of
ethnicity, culture, nationality, language, disability, gender, sexual orientation, or religion, and to
ensure that all students have an equal opportunity for academic success.
The specific goals of the Student Equity Plan are:
1. To provide opportunities for increasing diversity and equity for all students at SCC.
2. To improve student access to SCC programs and services.
3. To close performance gaps for targeted groups, thereby improving the overall success of all
students at Solano Community College.
This 2013-2018 Student Equity Plan is guided by the College’s Mission Statement wherein the
commitment to student equity is inherent:
Solano Community College's mission is to educate a culturally and academically diverse student
population drawn from our local communities and beyond. We are committed to helping our students
achieve their educational, professional, and personal goals centered in basic skills education,
workforce development and training, and transfer-level education. The College accomplishes this
three-fold mission through its dedicated teaching, innovative programs, broad curricula, and services
that are responsive to the complex needs of all students.

Page 2
The SEP was written with contributions from faculty, staff, students, managers, and students. This
2013 update of Solano Community College’s 2005 Student Equity Plan is part of an ongoing
institutional effort underway at Solano Community College to improve proportional student
academic outcomes and to more carefully and formally assess and evaluate student equity
planning. The College recognizes that equity planning and assessment, as well as expansion of its
data collection to further examine the academic needs of an increasingly diverse student population,
is critical to the achievement of student equity and the fostering of academic excellence for all in our
educational programs.
The Solano Community College Student Equity Committee has oversight for the development and
implementation of this Student Equity Plan in accordance with SCCD Board Policy and Procedure
5355. This Committee is composed of faculty, staff, administration, and students. The Committee
made recommendations to appropriate bodies regarding the College’s Student Equity Plan, along
with a host of new student equity recommendations. The 2013-2018 Student Equity Plan was
approved by the SCC Board of Trustees on September 18, 2013 in compliance with Title 5 guidelines
in Section 54220.
B. Student Equity Indicators and Target Groups
We examined student equity at SCC in the context of the following five Student Equity Indicators, as
required by the CA Code of Regulations, Title 5, Section 54220:
1. Access
2. Basic Skills and ESL Course Completion
3. Retention and Persistence
4. Degree and Certificate Completion
5. Transfer
ACCESS —
Indicator: the percentage of each group that is enrolled to the percentage of each group in the adult population of Solano County.
BASIC SKILLS AND ESL COURSE COMPLETION—
Indicator 1: The basic skills and ESL course completion rate for each population group of Solano Community College students.
Indicator 2: Compare the completion rates for students, in each population group, who started in basic skills and completed a college-level course in the same discipline.

Page 3
RETENTION AND PERSISTENCE —
Indicator 1: the percentages of first-time, full-time students who returned one semester later to take at least one class at SCC for each population group.
Indicator 2: The percentage of degree or transfer-seeking students who enrolled in three consecutive terms.
DEGREE AND CERTIFICATE COMPLETION —
Indicator 1: the percentage of students who complete a degree, certificate, or transfer program for each population group during the period 2007-11.
Indicator 2: the percentage of degree and/or transfer-seeking students tracked for six years through 2011-12 who completed a degree, certificate, or transfer-related outcomes.
TRANSFER —
Indicator: the ratio of the number of students by population group who complete 12 credit units and attempted a transfer level math or English course to the number of students in that group who actually transfer after one or more (up to six) years.
A review of District data (See Appendices) for the five Title 5 “student equity indicators” reveals that
specific groups are not achieving at a proportional rate in some areas, and, thus, intervention
strategies and support to achieve equitable outcomes are needed for these target groups: American
Indians or Alaskan natives, African American, White, Hispanic, male, female, Asian Pacific Islander,
ESL, and disabled students. The Student Equity Committee identified areas in the Student Equity Plan
where the above groups are falling behind academically, and have established goals and activities for
the District in order to close performance gaps.
C. Activities
The numerous activities recommended in the Student Equity Plan (SEP) are subject to funding and
staffing availability. These activities are necessary to accomplish the goals specified in the Plan:
Increase Outreach to Target Groups
Enhance Orientation and Counseling Efforts for New and Continuing Students
Continue to Research and Evaluate Student Equity Data Analysis
Increase Commitment to Faculty and Staff Development
Increase and/or Continue Support for Innovative Programs and Services that Focus on
Achieving Student Equity Goals
Analyze and Recommend Specific Activities to support Specific Student Success Initiative (SSI)

Page 4
II. Resources for Student Access and Success
Solano Community College’s strong commitment to student access and success is evidenced by an
array of educational programs and student services at the College that provide necessary student
support pertaining to the fulfillment of educational goals. Through these resources, the College has
successfully implemented innovative programs and services that meaningfully impact the five (Title 5
CCR Sec. 54220) Student Equity Indicators of:
1. Access
2. Basic Skills and ESL
3. Retention and Persistence
4. Degree and Certificate Completion
5. Transfer
Resources at Solano Community College include programs, services, and partnerships, which provide
the necessary support to achieve the goals and objectives identified in this Student Equity Plan and
increase student success. SCC’s current programs include:
Academic Success Center –serves both as a center to encourage and facilitate academic success through support services that include study skills workshops, information about important campus support resources, financial aid, and transfer, as well as to provide high quality faculty development opportunities and instructional resources.
African American Male Trailblazers – provides support to African American males students enrolled at Solano College who have completed a minimum of 21 units. Support includes mentoring, reentry support services, and tutoring.
Basic Skills Initiative (BSI) -- the faculty and staff who serve on this committee are committed to raising English, math, and ESL basic skills through course offerings below the transfer level; providing academic and career counseling; and providing basic skills and ESL students with academic support (See Appendix III).
CalWORKs Program – funded through a County grants, supports students receiving special assistance through educational programming and the provision of childcare assistance.
CARE (Cooperative Agency Resources for Education) Program – provides additional support services such as childcare, transportation, books, and supplies to EOPS students.
Children’s Program – offers full and part-day programs for children (four months to five years) and morning and afternoon preschool programs for 3 and 4-year olds.

Page 5
Community Resource and Health Faire – presents representatives from various community-based health and social services agencies to provide health screening and other services to all students.
DSP (Disability Services Program) – provides support and reasonable accommodations, as defined by state and federal laws, such as readers, note takers, specialized equipment use to students with documented physical, communication, learning, psychological or other medical conditions.
EOPS (Extended Opportunity Programs and Services) – offers grants, counseling, priority registration, and other services to students who are both economically and educationally disadvantaged.
Ethnic Studies Lectures Series – is a series of lectures presented by SCC’s Ethnic Studies Program. The lecture series is open to all students and admission is free to all.
Financial Aid Program – offers financial assistance with educational costs including fee waivers, grants, loans, federal work-study, and a limited number of ASSC (student government) Emergency Book Loans.
First Year Experience (FYE) Program – is a cohort program that provides first-year students with a supportive and structured environment while transitioning to college-level required courses. Students are provided with supplemental experiences such as field trips, community services activities, and team building exercises.
Foster Youth Success Initiative (FYSI) and Youth Empowerment Success Strategies Independent Living (YESS-ILP) Program –identifies youth who currently receive foster youth services as identified through either the County or FAFSA responses and to provide such youth with the programs, services, information, and support necessary to maximize their college options and outcomes.
Honor Societies – presently include Phi Theta Kappa International Honor Society (PTK) and Alpha Gamma Sigma State Honor Society (AGS). Their purpose is to recognize and encourage scholarship and leadership among two-year community college students.
Individualized Learning Labs – personalized assistance in ESL, math, reading, writing, computer programming, and computer applications.
Information Commons, Open Computer Labs, and Kiosks – centralized, open access to computers and access to electronic databases.

Page 6
Learning Communities – courses in which instructors, students, materials, and assignments are combined across disciplines to create a “community” of learners.
Library –features multiple resources and instructional services to support student learning, including: Spanish/English OPAC, multi-language database options, an ESL collection, computer workstations reserved for students with disabilities, and one-on-one library assistance. Library services were expanded at the Vacaville and Vallejo Centers in fall 2012.
MESA (Mathematics, Engineering, and Science Achievement) Program -- provides strong academic assistance to economically disadvantaged students majoring in the areas of mathematics, science, technology, medicine, and engineering.
PUENTE Program -- a one-year writing, counseling, and mentoring program to empower students to transfer four-year colleges and universities.
Student Development/ASSC/Student Clubs and Activities – provide leadership development opportunities through extracurricular student activities, including participation in Associated Students of Solano College (ASSC) student government and over twenty student clubs and organizations. Student activities include involvement with the Civil Rights Tour, Martin Luther King, Jr. “Living the Dream” Annual Celebration, Cinco de Mayo, Asian Pacific Islander History Month, Black History Month, Women’s History Month, and Disability Awareness Month.
Students Helping Students Book Grant Program – provides a limited number of needy students with textbook assistance through a bookstore voucher program and is funded by donations from ASSC, students, and staff.
Transfer Center – allows students to research information about the University of California and California State University as well as campuses and programs through the four-year systems inside and outside California; hosts the annual College and Universities Day and the Historically Black College and Universities Day; meet with university representatives; provides transfer admissions agreement (TAA) programs; and coordinates field trips to four-year colleges and universities.
Tutoring Center -- provides free peer tutoring in most subjects offered at the College
UMOJA Program Scholars (UPS) – provides a variety of strategies toward first-year African American students, to enhance students’ learning potential and ensure a successful transition into college. Strategies include a summer bridge program, learning communities, and supplemental support services.

Page 7
Veterans Affairs Center – serves the needs of qualifying veterans, reservists and dependents of veterans. Students receive counseling services and assistance with filing for benefits and access to educational and community resources. The Center acts as a liaison between the Veterans Administration and the student.
The above programs have an impact on increasing student achievement and student retention, as
well as to provide support to students in overcoming personal and institutional barriers, and
influencing students’ social and emotional well-being.
These programs are address barriers to access and student success which include the need for
financial assistance to cover the costs of education (e.g., tuition, fees, textbooks, and supplies;
childcare services; transportation needs; and overall educational under preparedness.
Nevertheless, as noted in the original (2005) Student Equity Plan, gaps in services and programs
continue to persist with regard to outreach, orientation, tutoring services, counseling, math and
English assessment, transfer guidance, basic skills instruction, and library services.
III. Campus-Based Research and Data Analysis
A. Overview:
Much of the data used in SCC’s Student Equity Plan was provided by the California Community
College Chancellor’s Office, Management Information Systems (CCCCO/MIS) and through local
research by the SCC Office of Institutional Research and Planning and the Basic Skills Initiative
(BSI) Committee.
CCCCO/MIS DATA
The Student Equity Committee initially reviewed data for the period covering Fall 2007 through
Fall 2011 with regard to access, basic skills pass rates, first-time student retention, completion of
degrees and certificates, and transfer rates by ethnicity, gender, ESL status, disabled student
status, and age group. The Student Equity Plan (SEP) data was extracted from CCCC/ MIS data
tables at the start of the Student Equity Plan process in 2011. (See Appendix I: SEP Data). It has
not been updated since. There has been much discussion about the practical use of MIS data
and the fact that since it is always out of date, the data cannot be analyzed in a timely manner.
Work is currently underway to create a equity data report that can be produced annually. This report
will be developed with input from the Student Equity Committee to ensure it meets our
requirements. Ideally, equity data should be “live” so we can review current data at any time and
react to emerging trends more quickly. To that end, SCC’s Institutional Research and Planning Office
is working with our IT department to produce student equity data in a format that is easily extracted

Page 8
from the live Banner system rather than relying on the CCCCO MIS datasets to be posted. We
anticipate this project to be completed by the end of Fall 2013 semester.
CCCCO/STUDENT SUCCESS SCORECARD DATA
In addition, the Student Equity Committee reviewed equity data contained in the California
Community College Chancellor’s Office Student Success Scorecard, first issued in April 2013 for each
of the 112 colleges. See Appendix II.
The Solano Community College Student Success Scorecard, for the 6-year period ending Spring 2012,
details student performance, including certificate and degree attainment, transfer rates to four-year
institutions, persistence rates, and “momentum points,” such as the completion of 30 units, which is
typically the halfway mark to transferring to a four-year institution or completion of an associate
degree.
The Scorecard provides a set of performance metrics, including how effectively Solano Community
College moves students through remedial and career technical education. With clear data regarding
student success by race, ethnicity, gender, and age, the SCC Student Equity Plan Committee also
utilized the Scorecard data to determine the Student Equity and Student Success goals and activities
contained herein.
B. Data Analysis Findings:
In reviewing the data on access, the Study Equity Committee made the following data analysis findings:
ACCESS —
Indicator: Compare the percentage of each group that is enrolled to the percentage of each group in the population of Solano County.
Solano County census data from 2010 were used as a comparison for the “access” indicator because the majority of students served are from Solano County. Findings:
White and Hispanic students, who comprise 30.4% and 20.3% of the SCC student population respectively, are proportionately underrepresented when compared to percentages in the community served. Whites represent 40.8% and Hispanics represent 24% the Solano County population.
Asian and Filipino students, who total 13.5% of the SCC student population and 14.3% of the County population, are also slightly underrepresented.
Page 9
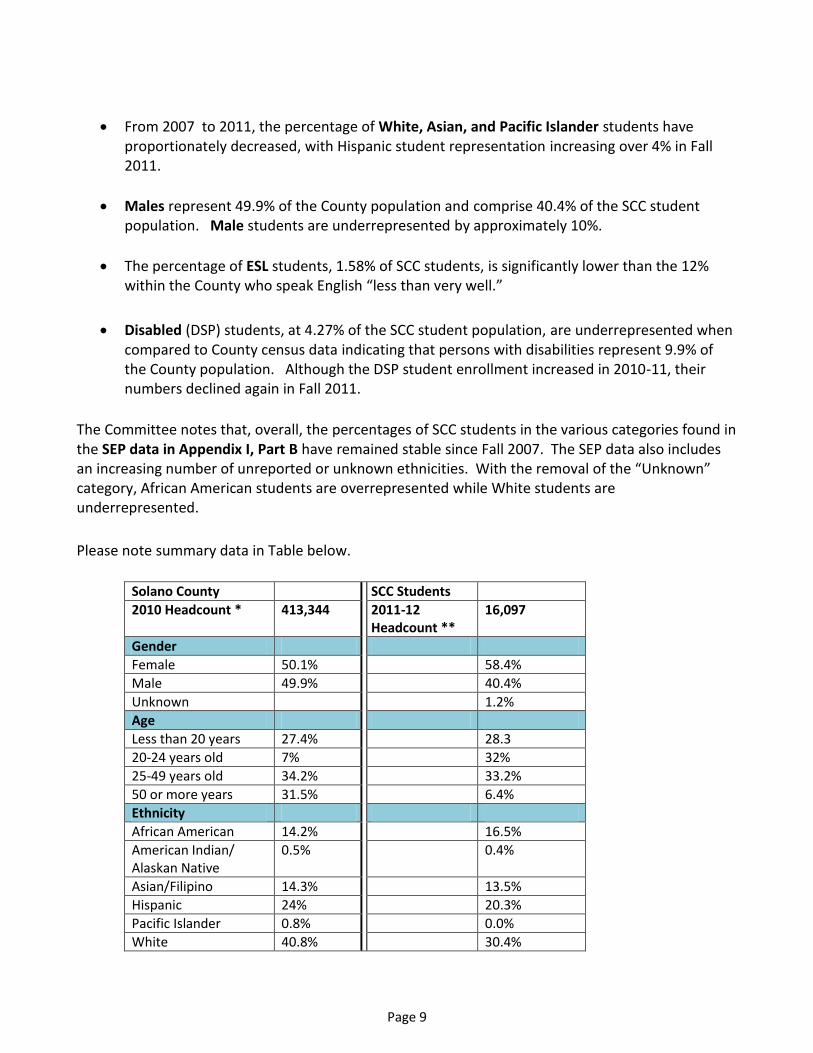
From 2007 to 2011, the percentage of White, Asian, and Pacific Islander students have proportionately decreased, with Hispanic student representation increasing over 4% in Fall 2011.
Males represent 49.9% of the County population and comprise 40.4% of the SCC student population. Male students are underrepresented by approximately 10%.
The percentage of ESL students, 1.58% of SCC students, is significantly lower than the 12% within the County who speak English “less than very well.”
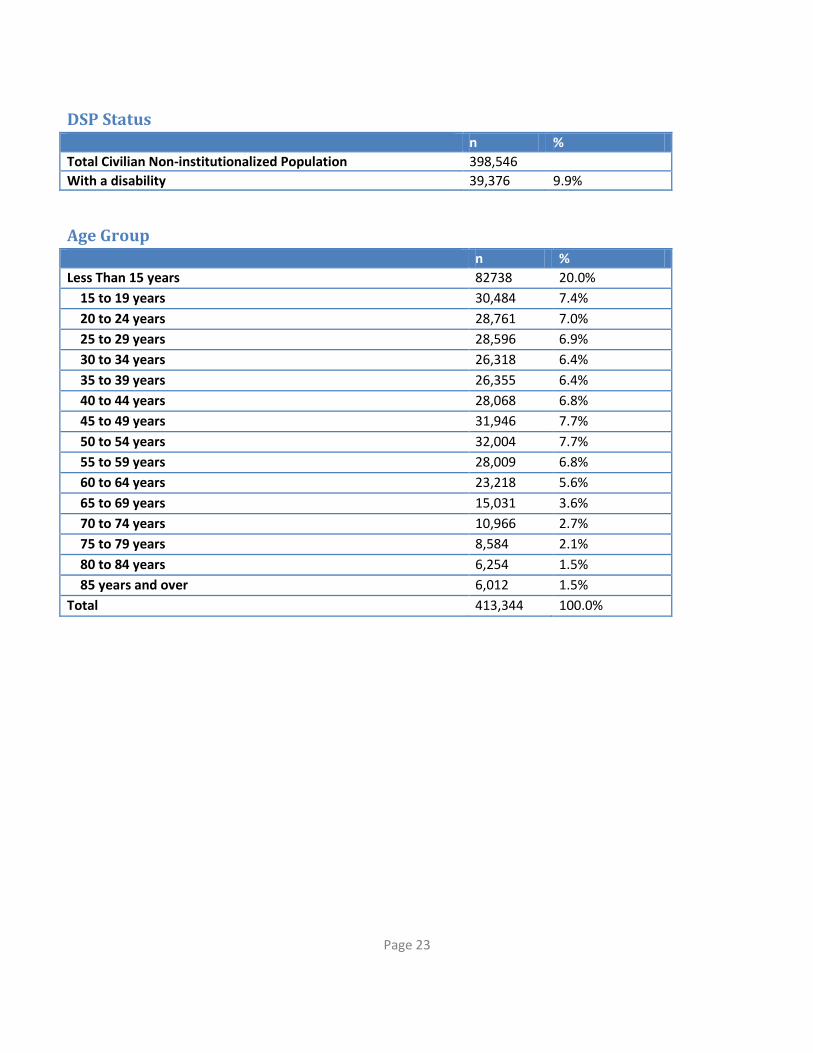
Disabled (DSP) students, at 4.27% of the SCC student population, are underrepresented when compared to County census data indicating that persons with disabilities represent 9.9% of the County population. Although the DSP student enrollment increased in 2010-11, their numbers declined again in Fall 2011.
The Committee notes that, overall, the percentages of SCC students in the various categories found in the SEP data in Appendix I, Part B have remained stable since Fall 2007. The SEP data also includes an increasing number of unreported or unknown ethnicities. With the removal of the “Unknown” category, African American students are overrepresented while White students are underrepresented.
Please note summary data in Table below.
Solano County SCC Students
2010 Headcount * 413,344 2011-12 Headcount **
16,097
Gender
Female 50.1% 58.4%
Male 49.9% 40.4%
Unknown 1.2%
Age
Less than 20 years 27.4% 28.3
20-24 years old 7% 32%
25-49 years old 34.2% 33.2%
50 or more years 31.5% 6.4%
Ethnicity
African American 14.2% 16.5%
American Indian/ Alaskan Native
0.5% 0.4%
Asian/Filipino 14.3% 13.5%
Hispanic 24% 20.3%
Pacific Islander 0.8% 0.0%
White 40.8% 30.4%

Page 10
Two or More Races 5.1% 6.6%
Unknown 11.4%
ESL Status Fall 2011
Identified Status 1.58%
English Only 70%
Language Other than English
30%
Speak English less than “very well”
12%
DSP Status
Total Non-Institutionalized
398,546
BASIC SKILLS AND ESL COURSE COMPLETION—
Indicator 1: Compare the basic skills and ESL course completion rate for each population group of Solano Community College students. Findings:
Basic skills students are defined as those students who are enrolled in below-college level classes in English, mathematics, and ESL. Overall, basic skills students exhibit low success rates.1
Regardless of ethnicity, students in Math basic skills courses have a lower success rate than students in English or ESL basic skills courses.
In English and Math basic skills classes, African American and Hispanic students are less successful than any other student groups.
The gender gap is less evident in basic skills classes, but is becoming more evident in Math basic skills with female students outperforming male students by 8% over the 2007-2011 study period.
The disabled (DSP) student success rate is 11% below the non-DSP success rate.
Although ESL students represent only 1.58% of the total SCC student population, ESL students are more successful than non-ESL students, particularly in Math basic skills.
The course completion rate of Hispanic ESL basic skills students demonstrates an overall increase from Fall 2007 baseline data.

Page 11
Indicator 2: Compare the completion rates for students, in each population group, who started in basic skills and completed a college-level course in the same discipline. The “Remedial” data provided in the SCC Student Success Scorecard, for the 6-year period ending Spring 2012, shows low completion rates for SCC remedial students--who started in basic skills and completed a college-level course in the same discipline—as follows:
26.4% completion by all Basic Skills Math students
45.6% completion by all Basic Skills English students; and
19.6% completion by all ESL students.
African American and Hispanic student success rates are lower than any other group in English and Math basic skills. 22.8% of the tracked African American students and 22.5% of Hispanic students who started in Basic Skills Math complete a college-level Math course. Only 30.2% of African American students and 41.5% of Hispanic students who start in Basic Skills English complete a college-level English course.
Although Asian students outperform all other student groups, including White students, in Basic Skills English, only 20% of Asian students and 22.4% of Filipino students who started in Basic Skills Math complete a college-level Math course.
______ 1 The SCC Basic Skills Initiative 2011-12 End of Year Report, in part states, “interventions” funded by this
committee over the years have made little to no impact on the rates at which students in our Basic Skills
programs reach and complete transfer-level courses in Math and English. Students placing into Math three
levels below transfer passed the transfer level course within 4 years at a rate of 7% in 2007, and do so now at a
rate of just 8%. The larger group of students who start Math two levels below transfer, passed the transfer
level within 4 years at a rate of 15% in Spring 2001 and 18% in Spring 2012 respectively, but since this most
recent cohort has the first success rate over 16%, it’s too soon to know whether this modest gain represents
real change or mere anomaly.
In contrast, we see significant improvement in English completion for students placed two levels below transfer. Transfer-level completion for these students increased from 25%, 23%, and 26% in Spring 2007, ‘08, and ‘09, respectively, to 36%, 37%, and 38%, for the 4-year cohorts finishing in Spring ’10, ’11, and ’12. Unfortunately, these same gains are not matched among the much larger group of students placing one level below transfer, who passed transfer-level English within 4 years at a rate of 53% in Spring ’07 and a rate of 51% in Spring 2012.” (See Appendix III).

Page 12
RETENTION AND PERSISTENCE —
Indicator 1: Compare the percentages of first-time, full-time students who returned one semester later to take at least one class at SCC for each population group.
Findings:
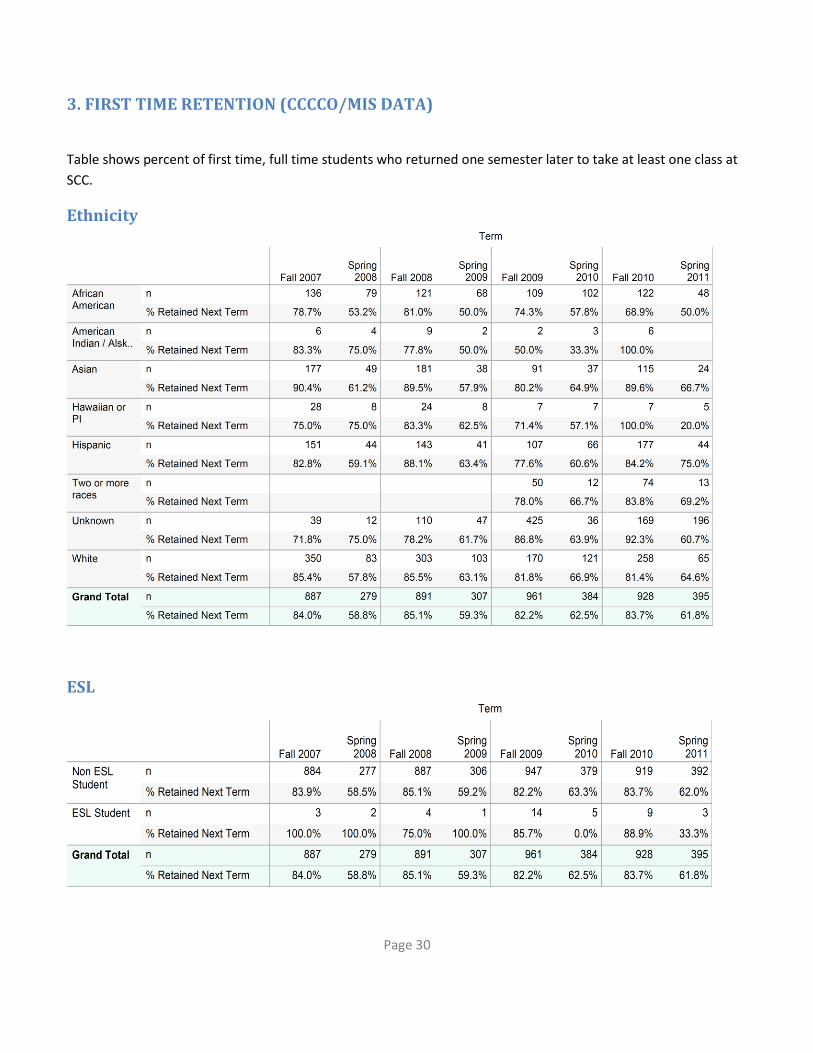
Fall semester retention rates are significantly higher than Spring semester retention rates for
all students.
African American students have the lowest retention rates, with Asian and White students
having the highest rates. In Spring 2011, 50% of first-time African American students returned
one semester later as compared to 66.7% of Asian students and 64.6% of White students.
African American students have experienced a 10% drop in retention between Fall 2007 and
Fall 2010.
The number of full-time Hawaiian/Pacific Islander students has dropped significantly
beginning in Fall 2009.
Male students have a lower retention rate than female students. In Spring 2011, 56.5% of
male students were retained next term as compared to 65.7% of female students.
Students in the 20-24 age group have the lowest rates in the most recent semester, while the
25-29 group shows the biggest decline.
Indicator 2: The percentage of degree or transfer-seeking students who enrolled in three consecutive terms. The “Persistence” data contained the SCC Student Success Scorecard, for the 6-year period ending Spring 2012, reveals the following: Findings:
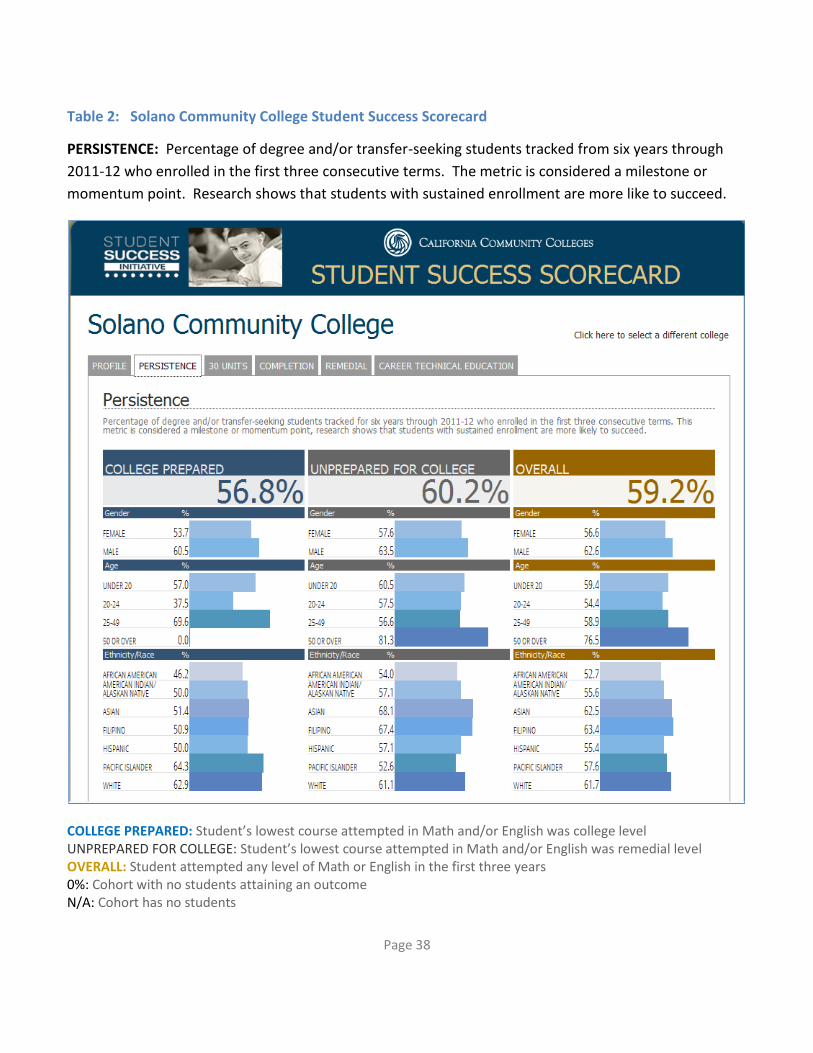
African American student persistence rates (for both college-prepared and under-prepared students) at 52.7% are lower than any other group and lower than the overall persistence rate of 59.2%. College-prepared African American students show a 46.2% persistence rate as compared to the 56.8% rate of all college-prepared students. African American students who are underprepared for college show at 54% persistence rate as compared to the 60.2% rate of all students underprepared for college.
Students, who are college-prepared and in the 20-24 age group, have lower persistence rates than any other age group at 37.5% and in comparison to the 54.4% overall rate of students in the 20-24 age group.

Page 13
DEGREE AND CERTIFICATE COMPLETION —
Indicator 1: Compare the percentage of students who complete a degree, certificate, or transfer program for each population group during the period 2007-11.
Findings:
African American student completion rates for Associate degrees are lower than any other
group. African American graduation rates were 11.21% in 2006-07; decreased to 9.36% in
2008-09, and, notably, increased to 12.83% in 2010-11. However, certificate completion rates
are at a higher proportion than other groups.
Hispanic student completion rates for Associate degrees are at a proportion similar to their
percentage of the student population. Hispanic graduation rates were 15.3% in 2006-07 and
have steadily decreased in subsequent years, to 12.73% in 2010-11. Certificate completion is
at a higher rate than degree completion.
Male student completion rates are lower than female completion rates. Male student
graduation rates have decreased from 36.82% in 2006-07 to 35.83% in 2010-11, as compared
with female graduation rates of 63.18% in 2006-07 and 63.5% in 2010-11.
DSP students, in general, graduate at a higher proportion than their population (7.6% in 2010-
11), although many more earn certificates rather than degrees (88.89% in 2010-11).
Indicator 2: Percentage of degree and/or transfer-seeking students tracked for six years through 2011-12 who completed a degree, certificate, or transfer-related outcomes.
The “Completion” data in the SCC Student Success Scorecard shows the following:
Findings:
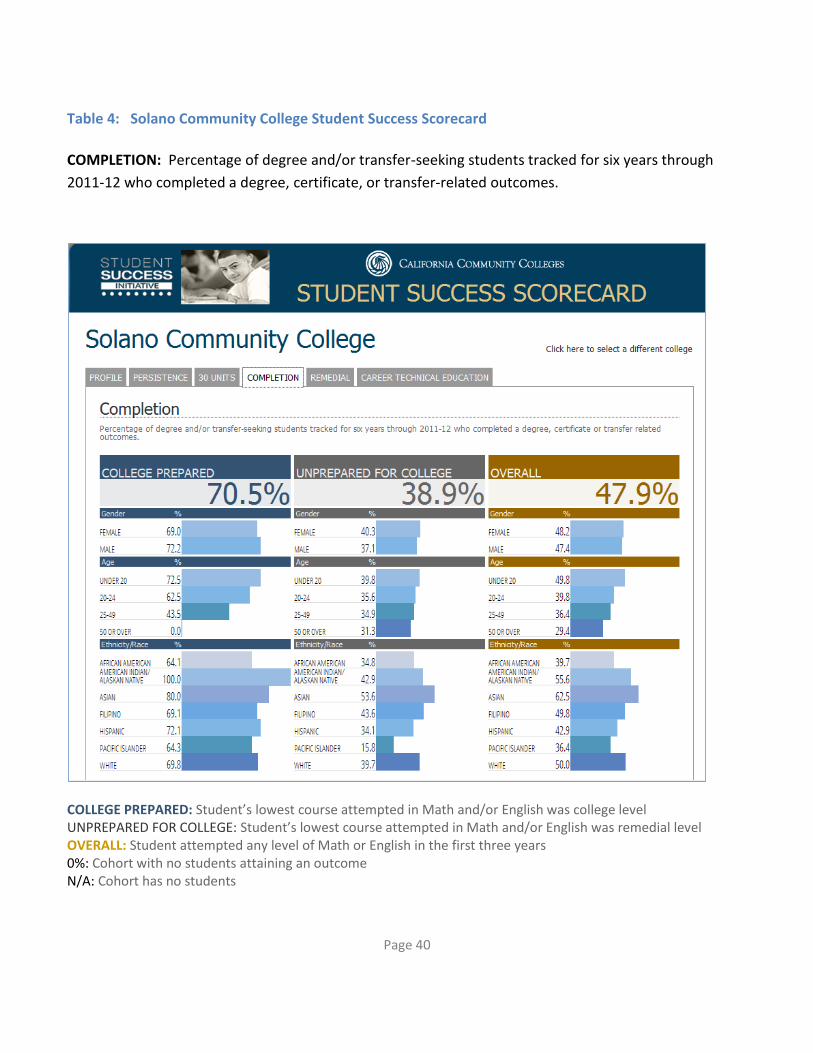
Overall, less than half (49.7%) of the tracked SCC students for the 6-year period ending Spring
2012 earned a degree and/or certificate or transfer to a four-year institution.
Only 38.9 % of our students who were unprepared for college—those who may be
considered basic skills and ESL students—completed a degree, certificate, or transfer course
patterns (i.e. IGETC or CSU General Education courses).
Completion rates of all basic skills students, especially African American and Hispanic
students, are lower than other groups (34.8% for African Americans and 34.1% for Hispanic
students).
Completion rates for White and Filipino students who are unprepared for college are also
unacceptably low, at 39.7% and 43.6% respectively.

Page 14
TRANSFER —
Indicator: The ratio of the number of students by population group who complete 12 credit units and attempted a transfer level math or English course to the number of students in that group who actually transfer after one or more (up to six) years.
Findings:
Students in higher age groups are less likely to transfer, with students in the 18-19 age group
showing the highest transfer rates with 35% transferring within six years. Students in the 30-
34 age group had the lowest transfer rates, with 11% transferring within six years.
Hispanic students, followed by White students, have the lowest transfer rates of the groups,
with 26% and 31% transferring, respectively.
Asian and Filipino students have the highest transfer rate among the groups, with 42% and
39% transferring with six years, respectively.
The “Unknown” category group show high levels of transfer, with 46% of students transferring
within 6 years.

Page 15
IV. Goals and Activities:
GOAL #1: ACCESS
Increase the proportion of underrepresented student enrollment to match or exceed that of the population within the district and community. Note: SSI refers to the Student Success Initiative requirement that is met by implementing the Activity below.
Objective Responsibility Activity Expected Outcome(s) 1.0 Increase White, Asian/ Pacific Islander, disabled, male, and ESL student enrollment.
Outreach and Public Relations Manager, Dean of Research and Planning, and Institutional Effectiveness
(1) Develop a comprehensive plan to better coordinate outreach activities.
(2) Develop outreach materials, to include Non-English materials, to recruit male, Hispanic, Asian, ESL, and disabled students and distribute in the community.
(3) Market and promote evening and online classes to working students, especially males; including veterans and active military at Travis AFB.
(4) Promote career pathways in SCC literature, including non-traditional career fields and training opportunities at SCC
By 2013-14: A coordinated master calendar of events, to, include community and college activities, will be developed and maintained.
By 2014-15, Student Equity planning is integrated into UPDATES to institutional plans, e.g., Educational Master Plan, Student Success and Support (SSS) Program Plan, Enrollment Management, Program Reviews, etc.
By 2014-15: Outreach activities and materials targeting male, White, Asian, ESL, and disabled students will be developed to expand recruitment. 2014-2015.
S-P, IVPAA, Academic Senate President, Outreach and Public Relations Manager
Strengthen High School Partnerships and College Readiness: Strengthen collaborative efforts between the College and 13 feeder high schools in County to: Provide additional outreach to underrepresented
students at the high schools. Collaborate with Academic Senate and local K-12
Districts on Common Core Standards (SSI 1.1)
By 2014-15: Student enrollments from the local high schools demonstrate increased student awareness of postsecondary opportunities at SCC.
By 2014-15: Implement plan to strengthen partnerships with local high schools, placing emphasis on math and English curriculum alignment for strengthening college readiness.
SP, Dean of Students, Dean of Counseling, Director of Financial Aid, Director of Admissions and Records, Chief Information Officer, and Student Services Managers
Enhance and Improve Student Success and Support Programs: Develop SSS Plan, including supporting access to programs and activities such as Counseling, Puente, MESA, EOPS, Cal WORKS, DSP, Learning Communities Tutoring, Academic Success Center Workshops and support programs that target underrepresented groups. Plan to include the exploration of centralized technology solutions to better guide students (SSI 2.3)
Annually, evaluate programs and publicize results.
By 2014-15, Student Success and Support Plan (SB 1457) developed and implemented to, in part, identify and address barriers for White, Asian/PI, disabled, and ESL students.
By 2015-16, Institutional program reviews and Program Learning Outcomes and other assessments demonstrate increased student knowledge and access to support services and programs.

Page 16
GOAL #2: BASIC SKILLS AND ESL COURSE COMPLETION
Increase the number of all students, especially of African American, Hispanic, male, ESL and disabled students, in basic skills and ESL classes who complete a college-level course in the same discipline goal.
Objective Responsibility Activity Expected Outcome(s):
2.0 Implement Basic Skills Initiative 5 year Plan (2013-18) to address those students lacking college readiness.
BSI Coordinator, Basic Skills Coordinators, and Faculty coordinators; VPAA; Outreach and Public Relations Manager
Support cohort-model programs such as Umoja and First Year Experience to offer summer bridge, supplemental instruction, embedded tutoring, and counseling.
Analyze student success data in developing curriculum, materials, labs, and dept.-wide assessments.
Support the growth of the ESL program. Support faculty development in basic skills and ESL best
practices. Explore alternative basic skills curriculum. (SSI 5.1).
Annually, increase the number of basic skills and ESL students who complete a college-level course in the same discipline.
Annually, College basic skills program will implement and evaluate Basic Skills and ESL Plan activities for each particular year, and report findings publicly.
2.1 Provide comprehensive student support resources for entering freshmen.
IVPAA, Dean of Counseling, Dean of Student Services, Director of Admissions and Records, Basic Skills, Coordinators, Academic Success Center Coordinator
Research and identify multiple measures that can be used to develop a college readiness indicator, along with effective practices to assist underprepared students. (SSI 2.4)
Require all students to complete assessment, orientation, and student education plan. (SSI 2.2)
Coordinate basic skills support efforts, including Academic Success workshops aimed at basic skills/ESL students, and support Academic Success workshop attendance (SSI 6.1)
Provide ESL Student training to all Student Services and faculty on annual basis (at Flex Cal).
Develop materials pertaining to college resources and class schedules and publish online and in print (include Spanish and/or other languages).
Coordinate with Academic Success Center to develop a plan for more targeted outreach and workshops specifically addressing student resource needs.
By 2013-14, Academic Success Center plan for targeted outreach and workshops is developed, with annual evaluation and necessary modification for subsequent year.
By 2014-15, College will implement policy to require all students to complete assessment, orientation, and student education plans.
By 2014-15, Flex Cal annual activity includes ESL Student training workshop (attendance sheet indicates wide participation by Student Services staff and faculty).
By 2014-15, bilingual information materials are developed and disseminated online and in print.
By 2015-16, SCC website is redesigned and updated for increased access to college resources and information, including class schedules.

Page 17
GOAL #3: RETENTION AND PERSISTENCE
Increase the percentages of first-time, full-time students who return one semester later to take at least one class and increase the percentage of degree-seeking students who attend for three consecutive semesters, especially African American, Hawaiian or Pacific Islander, and male students, and 20-24 age group students.
Objective Responsibility Activity(ies) Expected Outcome(s)
3.0 Plan and implement Student Success Initiative activities that impact retention and persistence, especially target groups.
IVP of Academic Affairs, Academic Deans, Dean of Counseling, Dean of Students, Director of Admissions and Record, Faculty
Implement SB 1457 Student Success Initiative (SSI) activities such as: Require students to complete assessment, orientation, and
education plan as well as declare a major. (SSI 2.2) Provide incentives such as priority registration to students
who complete above core services. (SSI 3.1) Promote full-time enrollment attendance. (SSI 3.3) Schedule course offerings to meet student needs.(SSI 4.1) , to
include basic skills, IGETC and CSU courses at all 3 campuses
Widely publicize SB 1457 requirements and establish SSI work groups, as needed.
In 2013-14, establish benchmark information and monitor yearly progress. Student success rates for all new students who participate in mandatory services, particularly for underprepared students in target groups, should increase.
3.1 Support programs and activities that focus on retention and persistence, especially target groups.
IVPAA, Program Faculty
Develop, support, and promote programs designed to increase African American, Hawaiian/PI, male, and 20-24 aged students, i.e. Puente and UMOJA Learning Communities, African American Male Scholars, MESA, EOPs, and student clubs. (SSI 2.4).
Annually, evaluate all programs, publicize results, and revise goals and activities as needed.
3.2 Provide faculty and staff professional development training to meet the needs of all students, particularly, underprepared students who are African American, Hispanic, Asian/PI, and DSP students.
IVPAA ,Flex Cal Committee, Basic Skills, Coordinator, Academic Success Center (ASC), and DE Coordinator
Increase support for faculty and staff professional development, topics to include: Student Success Initiative and Basic Skills best practices. Emerging technologies that aid online and face-to-face
teaching. Opportunities that increase cultural competency to address
student success and persistence of target groups. Strategies that foster interactive engagement, particularly for
at-risk students. (SSI 6.1, 6.2)
Evaluate all professional activities annually.
Survey Flexible Calendar activities annually and evaluate effectiveness pertaining to SEP.

Page 18
GOAL #4: DEGREE AND CERTIFICATE COMPLETION
Increase the percentage of degree and/or transfer-seeking students who complete a degree, certificate, or transfer, particularly African American, Hispanic, white male, and Filipino students who are unprepared for college.
Objective Responsibility Activity(ies) Expected Outcome(s) 4.0 Require Declaration of Course of Study (freshmen)
Director of Admissions, Dean of Counseling, Counseling Faculty
Design Student Service policy and procedures that requires incoming students to declare a major.(SSI 2.5)
By 2014-15, 100% of incoming students will declare a degree/certificate/ transfer major goal, to include the evaluation of counseling efforts and to document unmet needs.
4.1 Promote Degree Completion.
Superintendent-President, Deans, Student Services
Managers, Outreach and Public Relations Manager
Publicize importance of declaring a major early on.
Develop publications and/or availability of degree listings and career pathways, to include flyers, signage, and other promotional materials.
Annually, increase completion rates of students, particularly target groups.
4.2 Require all students to complete a Student Education Plan.
Dean of Counseling, Director of Admissions
Provide Student Educational Plan sessions, and where appropriate, in conjunction with assessment testing and orientation for small groups, especially basic skills students.
By 2014-15, 100% of students are provided with course planning and SEPs which lead to increased completion rates. Evaluate annually.
4.3 Require all students with 30+ units to see a counselor.
Dean of Counseling, Deans, Director of Admissions
Counseling and/or each School will contact/email students with 30+ units and/or students in targeted certificate programs early in semester to encourage contact with counselor. Course unit accumulation, specifically 30+, tend to be positively correlated with completion and wage gain. Evaluate early counseling and monitor graduate rates.
By 2015-16, implement and evaluate plan to increase number of graduating students who meet with counselor to review graduation status early.
4.4 Conduct comprehensive degree audits for students.
Director of Admissions and Records, and Director of Information Technology
Implement degree audit (i.e. Degree Works) program for Admissions and Records excluded in existing BANNER system.
By 2014-15, Degree Works is implemented. Annual data reports indicate increased completion rates of underprepared students. Continue to evaluate annually.

Page 19
GOAL #5: TRANSFER
Improve transfer rates of all students, especially African American and Hispanic students.
Objective Responsibility Activity(ies) Expected Outcome(s)
5.1 Increase transfer rates for all students
Dean of Counseling, Academic Success Center Coordinator, Outreach and Public Relations Manager
Provide Counseling and Academic Success Center services targeting underrepresented groups.
Publicize the transfer mission through Counseling and Academic Success Center activities; website home page, catalog cover, schedule cover, mailings to students, press releases, transfer recognition event, posters. Highlight diverse student populations.
Increased numbers of students, especially African American and Hispanic students. Review benchmark data in 2013-2014 and establish measurable goals and evaluation outcomes annually.

Page 20
V. Budget and Sources of Funding
The sources of funding for the proposed activities include both internal and external sources of funding. Funding
resources include:
Categorical funding
Grants
General fund allocations for support programs
General fund allocations for salaries of educational administrators, faculty, and student services and
support staff
General fund allocation for faculty and staff development
Strategic Proposal funding
Solano Community College will use existing resources by shifting emphasis in some programs to accommodate
new Student Equity activities. The College, through its integrated planning process and resource allocation
process, will consider student equity goals in allocating faculty and staff resources and strategic proposal
allocations With regard to external resources; Solano Community College will submit grant applications to address
Student Equity activities. Examples include:
Talent Search Program, U.S. Department of Education
Title III Strengthening Institutions Program, U.S. Department of Education
Title V Hispanic-Serving Institutions Program, U.S. Department of Education
TRIO Student Support Program, U.S. Department of Education
National Science Foundation
CA Community Colleges Chancellor’s Office Grants
VI. Integration of Equity Plan into College Planning
Integration of the Student Equity Plan into the College’s planning processes is an institutional priority.
Outcomes and projects contained in the Student Equity Plan will be recorded by the responsible parties
in the Planning and Assessment Database maintained by the Office of Institutional Research and
Planning, thereby linking these plans to other major College plans.

Page 21
VII. Evaluation Schedule and Process
Evaluation will consist of an annual review cycle involving two components. The first component will be
to evaluate the actual results in implementing all proposed activities. The purpose of this evaluation
component is to ensure that all aspects of the plan are being implemented. On an annual basis,
individuals responsible for each planned activity will submit a report to the Student Equity Coordinator
pertaining to activity results, any barriers to carrying out the activities, and a plan to address barriers.
The second part of the evaluation focuses on assessing the “student equity indicators “of the SEP for
(1) Access, (2) Basic Skills/ESL Course Completion, (3) Retention and Persistence, (4)
Degree/Certificate Completion, and (5) Transfer. The assessment data will become part of the
published Instructional Program Reviews, allowing the widest dissemination to the campus
community and to the public. The Student Equity Committee will review the data, update the Plan,
and submit it to the campus community and Board of Trustees for approval annually and/or as
needed.
Contact Person The contact person for the Solano Community College Student Equity Plan is noted below.
Chief Student Services Officer
Solano Community College
Tel. (707) 864-7159
Email: [email protected]

Page 22
APPENDIX I: Student Equity Plan Data, Fall 2007-Fall 2010.
Prepared by Office of Institutional Research, Solano Community College
Part A. 2010 Census County Data
All data comes from http://www.census.gov/ factfinder pages.
Data for Ethnicity, gender and age group comes file DP1 (2010 Demographic Profile SF), while data for ESL status
and DSP status comes from DP-02 (2010 ACS 1-year estimates).
Ethnicity
n %
Hispanic or Latino 99,356 24.0%
Not Hispanic or Latino 313,988 76.0%
White alone 168,628 40.8%
Black or African American alone 58,743 14.2%
American Indian and Alaska Native alone 1,864 0.5%
Asian alone 59,027 14.3%
Native Hawaiian and Other Pacific Islander alone 3,243 0.8%
Some Other Race alone 1,463 0.4%
Two or More Races 21,020 5.1%
Gender
n %
Male population 206,195 49.9
Female population 207,149 50.1
Total 413,344 100
ESL Status
n %
Population 5 years and over 387,573
English only 271,488 70.0%
Language other than English 116,085 30.0%
Speak English less than "very well" 46,613 12.0%
Page 23
DSP Status
n %
Total Civilian Non-institutionalized Population 398,546
With a disability 39,376 9.9%
Age Group
n %
Less Than 15 years 82738 20.0%
15 to 19 years 30,484 7.4%
20 to 24 years 28,761 7.0%
25 to 29 years 28,596 6.9%
30 to 34 years 26,318 6.4%
35 to 39 years 26,355 6.4%
40 to 44 years 28,068 6.8%
45 to 49 years 31,946 7.7%
50 to 54 years 32,004 7.7%
55 to 59 years 28,009 6.8%
60 to 64 years 23,218 5.6%
65 to 69 years 15,031 3.6%
70 to 74 years 10,966 2.7%
75 to 79 years 8,584 2.1%
80 to 84 years 6,254 1.5%
85 years and over 6,012 1.5%
Total 413,344 100.0%

Page 24
Part B. CCCCO/MIS DATA
Data come from CCCCO Datamart MIS Tables. (Fall 2007- Fall 2011) Tables include ST and SD. ESL
Student is approximated by counting any student that has taken at least 1 ESL class at SCC. Students are
filtered to only include those with a headcount code of A,B,C or F representing those student who
receive apportionment for.
Tables show number for each semester. Second table shows percent.
1. ACCESS (CCCO/MIS DATA)
Ethnicity

Page 25
Gender
ESL Status
DSP Status

Page 26
Age Group

Page 27
2. BASIC SKILLS PASS RATES (CCCCO/MIS DATA)
Tables show percentage of students successful (gain a grade of A, B, C, CR, IA, IB, IC, IPP, P) in groups of basic skills
courses. The colored squares give a visual indication of numbers of students and success rate. The larger the
square the more students in a particular group, while the color shifts from red to green as success rate improves.
Ethnicity
Gender

Page 28
ESL Status
DSP Status

Page 29
Age Group
Page 30
3. FIRST TIME RETENTION (CCCCO/MIS DATA)
Table shows percent of first time, full time students who returned one semester later to take at least one class at
SCC.
Ethnicity
ESL

Page 31
Gender
DSP

Page 32
Age Group

Page 33
4. COMPLETIONS (CCCCO/MIS DATA)
Ethnicity
Gender
DSP Status

Page 34
5. TRANSFER VELOCITY (CCCCO/MIS DATA)
The Transfer Velocity Cohort is created by evaluating all first time freshmen six years after their entry. Those
students who have completed twelve credit units and attempted a transfer level math or English course are
included in the Transfer Velocity Cohort. Transfer rates for years three, four, and five are retrospective and cannot
be reported until the cohort is finalized at the completion of the sixth year after initial enrollment. Students with
multiple college enrollments are reported as members of the Transfer Velocity Cohort for each college attended.
Age Group
Age Group*Transferred
StudentCohort Student Transfer Rate
18 to 19 208 598 35%
20 to 24 22 82 27%
25 to 29 7 34 21%
30 to 34 2 19 11%
35 to 39 2 15 13%
40 to 49 3 24 13%
50 and older 2 13 15%
Less than 18 135 364 37%
Unknown 0
Total 381 1149 33%

Page 35
Ethnicity
Gender
EthnicityTransferred
StudentCohort Student Transfer Rate
African-American Non-
Hispanic48 146 33%
American Indian/Alaskan
Native2 11 18%
Asian 34 81 42%
Filipino 64 166 39%
Hispanic 48 184 26%
Other Non-White 0
Pacific Islander 7 21 33%
Two or More Races 0
Unknown/Non-
Respondent/Declined28 61 46%
White Non-Hispanic 150 479 31%
Total 381 1149 33
GenderTransferred
StudentCohort Student Transfer Rate
Female 230 649 35%
Male 151 500 30%
Other 0
Total 381 1149 33%

Page 36
DSP Status
Primary Disability*Transferred
StudentCohort Student Transfer Rate
Acquired Brain Injury 0 1 0%
Developmentally Delayed
Learner0
Hearing Impaired 0 2 0%
Learning Disabled 1 11 9%
Mobility Impaired 3 10 30%
None 373 1079 35%
Other Disability 4 35 11%
Psychology Disability 0 8 0%
Speech/Language Impaired 0
Visually Impaired 0 3 0%
Total 381 1149 33

Page 37
APPENDIX II:
Solano Community College Student Success Scorecard, 2005-2012
Table 1. COLLEGE PROFILE: Description of the student population and course sections offered in 2011-12
Page 38
Table 2: Solano Community College Student Success Scorecard PERSISTENCE: Percentage of degree and/or transfer-seeking students tracked from six years through
2011-12 who enrolled in the first three consecutive terms. The metric is considered a milestone or
momentum point. Research shows that students with sustained enrollment are more like to succeed.
COLLEGE PREPARED: Student’s lowest course attempted in Math and/or English was college level UNPREPARED FOR COLLEGE: Student’s lowest course attempted in Math and/or English was remedial level OVERALL: Student attempted any level of Math or English in the first three years 0%: Cohort with no students attaining an outcome N/A: Cohort has no students

Page 39
Table 3: Solano Community College Student Success Scorecard THIRTY UNITS: Percentage of degree and and/or transfer seeking students tracked for six years through
2011-12 who achieved at least 30 units. Credit accumulation, 30 units specifically, tend to be positively
correlated with completion and wage gain.
COLLEGE PREPARED: Student’s lowest course attempted in Math and/or English was college level UNPREPARED FOR COLLEGE: Student’s lowest course attempted in Math and/or English was remedial level OVERALL: Student attempted any level of Math or English in the first three years 0%: Cohort with no students attaining an outcome N/A: Cohort has no students
Page 40
Table 4: Solano Community College Student Success Scorecard
COMPLETION: Percentage of degree and/or transfer-seeking students tracked for six years through
2011-12 who completed a degree, certificate, or transfer-related outcomes.
COLLEGE PREPARED: Student’s lowest course attempted in Math and/or English was college level UNPREPARED FOR COLLEGE: Student’s lowest course attempted in Math and/or English was remedial level OVERALL: Student attempted any level of Math or English in the first three years 0%: Cohort with no students attaining an outcome N/A: Cohort has no students

Page 41
Table 5: Solano Community College Student Success Scorecard REMEDIAL: Percentage of credit students tracked for six years through 2011-12 who started below
transfer level in English, mathematics, and/or ESL and completed a college-level course in the same
discipline.
0%: Cohort with no students attaining an outcome N/A: Cohort has no students

Page 42
Table 6: Solano Community College Student Success Scorecard CAREER TECHNICAL EDUCATION: Percentage of students tracked for six years through 2011-12 who
completed several courses classified as career technical education (or vocational) in a single discipline
and completed a career, certificate, or transferred.

Page 43
APPENDIX III:
2011-2012 ESL/Basic Skills Allocation End-of-Year Report
2012-2013 ESL/Basic Skills Allocation Goals/Action Plan October 10, 2012

Page 46
[4a] Long-Term Goals (5 yrs.) for ESL/Basic Skills
Due October 10, 2012 College Name: Solano Community College
Goal ID Long-Term Goal
A The number of students moving from Math 330 through successful completion of Math 104 within 4 years will improve by 2% annually in AY 20-15-16 and AY 2016-17, as compared to the levels achieved by the baseline cohort of F’08-Sp’12.
B By AY 2016-17, the proportion of students with intake placements below transfer in English who pass the transfer-level course within three years will increase by 10% over the proportion of students achieving this result in the Fall 2009- Spring 2012 cohort.
C By AY 2016-2017, 100 students (unduplicated headcount) from our local communities will be enrolled in at least 3 units of for-credit ESL courses each semester, a 50% increase over Fall 2012.
______________________________ ___________ ________________________________ ___________ Signature, Chief Executive Officer Date Signature, Academic Senate President Date

Page 47
[4b] 2012-2013 ESL/Basic Skills Action Plan
Due October 10, 2012 College Name: Solano Community College
Activity Associated Long-Term
Goal ID
Target Date for
Completion
Responsible Person(s)/ Department(s)
Measurable Outcome(s)
Continue to support cohort-model programs such as Umoja and First-Year Experience to offer summer bridge programs, supplemental instruction, and embedded tutoring and counseling services.
A, B May 2013 Program Coordinators, Program Faculty, School Deans, ASC Coordinator, Counseling Dean and faculty, IR Office
Students participating in cohort-model programs will complete and pass Basic Skills courses at rates 5% higher than peers not enrolled in such programs.
Student surveys will be administered to assess the use rate and perceived benefits of SI, tutoring, and counseling services.
Cohort-model programs will be centralized or coordinated to ensure efficient delivery / non-duplication of efforts and services
Continue to support/promote the careful analysis of the impact on student retention, success, and persistence of every component in the developmental English and math sequences: curriculum, materials, assignments, labs, and department-wide assessments.
A, B May 2014 English BS Coordinator, English Dept. Faculty, Lab Staff, Deans of Liberal Arts and Math, IR Office, ASC Coordinator
Faculty will use data and training from Center for Urban Education to develop action plans for closing equity gaps in Math achievement
Math faculty will develop BS Math pathway for non-STEM majors
Math and English faculty will seek to refine intake assessment methods by considering alternatives
Students enrolled in Accelerated English will pass the course and transfer-level course at rates equal to or higher than the rates of students enrolled in the traditional developmental sequence.
English faculty will conduct research comparing different methods of level-advancement assessment: portfolio grade, and CME score, and CME override
Academic Success Center will survey Basic Skills students about needs & interest in supplemental workshops and other kinds of support

Page 48
Support the growth of the ESL program, including advertising, outreach, expansion of services, and development of courses that support students to the threshold of transfer-level reading/comp.
C Aug. 2013 English BS Coordinator, ESL Faculty, Center Deans, Dean of Liberal Arts, Outreach/Marketing
ESL faculty and IR office will design a community needs assessment to discover demand for various kinds of ESL offerings
ESL faculty will partner with Financial Aid, Admissions, Assessment, and CTE to develop and offer a comprehensive, multi-phase orientation to ESL students graduating from Fairfield Adult School
Support faculty professional development in best practices associated with working with students in developmental Reading, English, ESL and Math.
A, B, C Aug. 2013 ASC Coordinator, All BS Coordinators, DE Coordinator, Deans, EVP
Academic Success Center will assist in coordinating CUE workshops in Fall 2012
Academic Success Center will coordinate Student Equity conference for January 2013 FlexCal
6 or more faculty members from any discipline will participate in Reading Apprenticeship training sponsored by 3CSN
6 or more faculty members from Math, English and ESL will attend conferences and/or communities of practice pertaining to Basic Skills research and pedagogy
______________________________ ___________ ________________________________ ___________ Signature, Chief Executive Officer Date Signature, Academic Senate President Date

Page 49
[2]. 2007-2012 Basic Skills Initiative - Narrative Response
Respond to the following question. “Knowing what you know now about basic skills and implementing basic skills interventions on your campus, what would you have done differently over the last five years with regards to your basic skills initiative work?” Campuses throughout the CCC system made different decisions about how to use BSI grant funds. Here at
Solano Community College, we have viewed the grant primarily in two ways: as seed money for pilot
programs which, if successful, we would push forward as sweeping initiatives eligible for general
institutional support; and as incentives to fuel smaller-scale “practitioner projects,” work faculty members
saw the need for and had the will and expertise to carry out. In the first five years of the grant we have
sponsored a wide range of large initiatives and small projects, several of which have appeared to be
successful. Initiatives which began with BSI seed money have included the addition of a library co-requisite
to our freshman English course, the development of the “Umoja” learning community program focused on
African-American student experiences, our current pilot of a first-year experience learning community, and
the hiring of an Academic Success Center Coordinator to initiate development of the ASC. Practitioner
projects have included compensating adjunct faculty to attend level meetings, supplemental instruction in
high-risk courses, a series of Student Success workshops, and the current effort to develop an online
writing lab.
However, while these and other projects have kept the BSI Committee very busy these five years, a quick
set of queries on the Basic Skills Cohort Tracker reveals an unwelcome truth: that the various innovations
and interventions funded by this committee over the years have made little to no impact on the rates at
which students in our Basic Skills programs reach and complete transfer-level courses in Math and English.
Students placing into Math three levels below transfer passed the transfer level course within 4 years at a
rate of 7% in 2007, and do so now at a rate of just 8%. The larger group of students who start Math two
levels below transfer passed the transfer level within 4 years at a rate of 15% in Spring 2001 and 18% in
Spring 2012, but since this most recent cohort has the first success rate over 16%, it’s too soon to know
whether this modest gain represents real change or mere anomaly.
As a bright spot in the data, we see significant improvement in English completion for students placed two
levels below transfer. Transfer-level completion for these students increased from 25%, 23%, and 26% in
Spring 2007, ‘08, and ‘09, respectively, to 36%, 37%, and 38%, for the 4-year cohorts finishing in Spring
’10, ’11, and ’12. Unfortunately, these same gains are not matched among the much larger group of
students placing one level below transfer, who passed transfer-level English within 4 years at a rate of 53%
in Spring ’07 and a rate of 51% in Spring 2012. We remain hopeful that these numbers may improve in the
near future, as we have made some big changes to our transfer-level English pathway, focusing on the
elimination of the “exit points” which cost us students between levels. New offerings include English 380, a
class 1 level below transfer with no lab component, which began in in Fall 09; and English 348G, an open-
access, accelerated class 1 level below transfer, which began in Fall 2011. While it is too early to have 4-
year cohort data to compare with prior years, we are optimistic these classes may “move the needle”
somewhat.

Page 50
With the above results in mind, we’re now asked to reflect on what we would have done differently these
first five years of the BSI grant. The most glaring and obvious answer is that we would have begun with
specific, quantifiable targets for improvement, backwards-designed our projects to meet those targets, and
measured our progress toward those goals each year. At the same time, though, as mentioned above with
the case of the recent changes to developmental English offerings, cohort data to analyze the results of
courses developed in the early years of the BSI grant are not yet available. We began five years ago with
research-based notions of “best practices” in supporting the success of underprepared students, and did
our best to create these support systems in the projects we designed and funded. However, it is only now,
five years in, that we’re even beginning to be in a position to evaluate whether those efforts have paid off
for our students.
Another challenge we’d undo if we could has been inconsistency in institutional/administrative support for
our efforts. When the committee has exerted sustained efforts at broader changes requiring support
beyond the means of our budget, we have run into roadblocks up the line. One example of this has been
the hiring of the Academic Success Center Coordinator, which was the committee’s top priority for at least
two years. But as our committee does not have control over campus hiring, and had planned to fund just
40% of the cost of this position, we could not make it happen without approval from the Vice President and
President of the College. The position was finally hired last summer, and we see steady progress now
toward the creation of a Student Success Center. This experience teaches us that we need to communicate
our priorities early and often to stakeholders and decision-makers at all levels of the College to ensure that
our plans are well-aligned with overarching Institutional plans and goals.
Further to the need for broadened communication, five years into this work our committee has come to a
new appreciation of the need for broader cross-campus coalition-building and professional development.
Our work to date has consisted primarily of changes to curriculum in the Basic Skills English and Math
sequences, but perhaps we haven’t focused enough on rigorous, transformative professional development
for the people who offer this instruction. Nor have we persuaded the faculty at large of their shared stake
in improving Basic Skills completion rates. Many faculty remain unaware of the vast numbers of students
who are barred from degree or transfer completion for failing to meet their English and/ or Math
requirements. Our current contract with the Center for Urban Education and the steps taken toward
developing an Academic Success Center represent our first forays into trying to suggest a campus-wide
conversation, about students, learning, and teaching. Transforming the campus culture and faculty
assumptions about our own roles and responsibilities in the student success equation will be a far more
ambitious undertaking than curricular modifications in our own few disciplines, but has the potential to
achieve more sweeping and lasting change if we’re successful.
In sum, we have learned much from our first five years’ worth of experiences with the BSI grant. We are
poised now to move forward with a heightened awareness of the need for specific targets framed in terms
of student outcomes, initiatives designed with a clear line to those targets, continuous data analysis to
monitor progress toward those targets, and increased communication to gain institutional support for our
initiatives. With these adjustments, we believe over the next five years we’ll see measurable
improvements in our basic skills students’ progress to and through their transfer-level work.

Page 51
[3]. Data Analysis using the Basic Skills Cohort Progress Tracking Tool After exploring the data available through the Basic Skills Cohort Progress Tracking Tool, describe in 500 words (or fewer) the sample data for one cohort and what issues the data raise for you. (NOTE: There is no form for this section.) In the description, you need to provide the subject area (e.g. mathematics, English, ESL), the dates of the cohort (beginning and ending terms), the special characteristics of the cohort, and the data that are of particular interest to you. The Basic Skills Cohort Tracking Tool allows us to examine how ESL students fare when they transition to
the mainstream English Comp sequence. Two levels below transfer we offer English 350, “Fundamentals of
Composition for ESL students”. Depending on faculty availability, English 350 is offered either as a stand-
alone section, or cross-listed with the equivalent mainstream level of Engl 355. In the latter case, the
course is taught by a mainstream English instructor and the “350” course number becomes a way to track
students more than a real indicator of differentiated ESL instruction.
We used the cohort tracker to look at the success of a cohort of English 350 students who enrolled in the
stand-alone Engl 350 in Fall 2009. Of these 18 students, 14 passed the course (78%) and 12 of them (86%)
persisted. Eleven enrolled in Engl 370 (the next sequential course), and one went directly to Engl 001 (the
transfer-level course) as determined by their results on the department-wide level-advancement exam.
The 11 students who progressed to Engl. 370 made 14 attempts at the course, for an average of 1.27
attempts. Nine passed, and it appears that all 9 progressed to Engl 001, making a total of 10 of the original
18 students (55%) who persisted to the Eng 001 level. While most of these students had to repeat Eng. 001
at least once, as indicated by 20 attempts for just 10 students, 9 of the 10 had passed the transfer-level
course by Spring 2012.
In these results, we see that 50% (9) of the 18 students who enrolled in Engl 350 in Fall 2009 had passed
Engl 001 by Spring 2012.
For comparison, we tracked a second cohort over the same time period: the 87 students who started Engl
355, the mainstream Engl Comp course two levels below transfer, in Fall 2009.
In the mainstream sequence, 63 of the original 87 students (72%) passed ENGL 355 but only 43 of those
who passed, persisted (68%). Twenty-nine of them enrolled in the 370 level, while 14 appear to have
skipped directly to Engl 001 by their results on the exam mentioned above. In this mainstream group, too,
repetition at the transfer level was common, with 43 students making 76 attempts for an average of 1.76
attempts. Ultimately, 33 students, just shy of 38% of the original cohort, had passed Engl 001 by Spring
2012.
From these data, we see that ESL students who self-select into the ESL-designated section of ENGL 350 pass
Engl 001 at slightly higher rates than the general population of students who began in the equivalent level
mainstream course. We note, too, that in semesters in which Engl 350 is not offered as a stand-alone
course, fewer students self-select the 350 course number. In three recent semesters with only cross-listed
350/355 sections, the starting 350 cohorts were 10, 6, and 10 students, respectively. Though there is no
way to disaggregate results in the 355 course for ESL students who choose the mainstream course number,

Page 52
the moderately higher success of 350 students relative to the overall success of 355 students suggests that
ESL students are better served by a designated section, clearly identified as such, and truly tailored to their
needs by a TESOL specialist.
Page 53
Acknowledgements
Student Equity Planning Committee Members Dr. Shirley Lewis, Chair, Dean of Student Services
Dr. Jose Ballesteros, Interim Director of Student Development and MESA
Peter Cammish, Dean of Research & Planning and Institutional Effectiveness
Dr. Annette Dambrosio, Accreditation Coordinator and English/Reading Faculty
Dr. Lily Espinoza, Dean, Human Performance and Development
Luis Garcia, Associated Students of Solano College (ASSC)
Dr. Karen McCord, Social Science Faculty/Ethnic Studies Coordinator
Marcie McDaniels, Counseling Faculty
Dr. Maurice McKinnon, Interim Dean of Health Sciences
Carolyn Moore, Disability Services Specialist
Maire Morinec, Dean, Applied Technology and Business, Vacaville Center & Travis AFB
Jocelyn Mouton, Counseling Faculty/CalWORKs Coordinator
Dr. Joel Powell, Political Science Faculty
Melissa Reeve, Basic Skills Initiative Coordinator & English/ESL Faculty
Genele Rhoads, Mathematics Faculty
Cynthia Simon, EOPS and CARE Coordinator
Diane White, Interim Vice President of Academic Affairs