Embed Size (px)
Citation preview
SOLA, 2012, Vol. 8, 045-048, doi:10.2151/sola.2012-012
2012 Mar 23 13:01:27 /home/viper/hayasaki/paper/submit/20110815_spring_rain_cyclone/script/cyclone/passing_cyclone/total_passing_Asia_suppl.gmt
Lat/lon SLP data were interpolated on the Equal Area Scalabel Earth (EASE) grid.
"ftp://ftp.cdc.noaa.gov/Datasets.other/map/storm/" made by M. C. Serreze
Brown line: topography (2000 m)
(a) Nov: track freq. (shade) & SST (gray line)
EASE grid = 145 * 145 grids on polar stereographic projection (125 km interval)
Short-living cyclones ( < 2 day) are omitted
Search range: 4grid; pdiff = 0.5
M. HAYASAKI
120˚E
150˚E
30˚N
40˚N
50˚N
280 K280 K
290 K
290 K
300 K300 K
0.2
0.4
0.6
0.8
1.0
month-1
120˚E
150˚E
30˚N
40˚N
50˚N
2012 Apr 24 16:01:31 /home/viper/hayasaki/paper/submit/20110815_spring_rain_cyclone/script/cyclone/growth_rate/Asia_EGR_SST_clim_suppl.gmt
120˚E
150˚E
30˚N
40˚N
50˚N
280 K280 K
284 K
284 K
288 K
288 K
292 K
292 K
296 K
296 K
300 K300 K
HH
HH
H
HHHH
H
HH
HH
0.8
0.8
0.8
0.8
0.8
0.8
0.8
0.8
0.8
0.80.8
0.8
0.8
0.8
0.8
0.8
0.81
1
2
4
|∇(SST)|
120˚E
150˚E
30˚N
40˚N
50˚N
(b) Nov: Eady growth rate (blue); SST (gray), |∇(SST)| (shade)
[K/100km]
2012 Mar 22 19:37:24 /home/viper/hayasaki/paper/submit/20110815_spring_rain_cyclone/script/cyclone/passing_cyclone/total_passing_Asia_suppl.gmt
Lat/lon SLP data were interpolated on the Equal Area Scalabel Earth (EASE) grid.
"ftp://ftp.cdc.noaa.gov/Datasets.other/map/storm/" made by M. C. Serreze
Brown line: topography (2000 m)
(c) Dec: track freq. (shade) & SST (gray line)
EASE grid = 145 * 145 grids on polar stereographic projection (125 km interval)
Short-living cyclones ( < 2 day) are omitted
Search range: 4grid; pdiff = 0.5
M. HAYASAKI
120˚E
150˚E
30˚N
40˚N
50˚N
280 K
280 K
290 K
290 K
0.2
0.4
0.6
0.8
1.0
month-1
120˚E
150˚E
30˚N
40˚N
50˚N
2012 Apr 24 16:01:42 /home/viper/hayasaki/paper/submit/20110815_spring_rain_cyclone/script/cyclone/growth_rate/Asia_EGR_SST_clim_suppl.gmt
120˚E
150˚E
30˚N
40˚N
50˚N
280 K
280 K
284 K
284 K
288 K
288 K
292 K
292 K
296 K296 K
HH
HH
HH
HH
HH
HH
0.8
0.8
0.8
0.8
0.8
0.8
0.8
0.8
0.8
0.8
0.8
0.8
0.8
0.8
0.8
0.8
1
1
1
1
1
2
4
|∇(SST)|
120˚E
150˚E
30˚N
40˚N
50˚N
(d) Dec: Eady growth rate (blue); SST (gray), |∇(SST)| (shade)
[K/100km]
2012 Mar 22 19:37:29 /home/viper/hayasaki/paper/submit/20110815_spring_rain_cyclone/script/cyclone/passing_cyclone/total_passing_Asia_suppl.gmt
Lat/lon SLP data were interpolated on the Equal Area Scalabel Earth (EASE) grid.
"ftp://ftp.cdc.noaa.gov/Datasets.other/map/storm/" made by M. C. Serreze
Brown line: topography (2000 m)
(e) Jan: track freq. (shade) & SST (gray line)
EASE grid = 145 * 145 grids on polar stereographic projection (125 km interval)
Short-living cyclones ( < 2 day) are omitted
Search range: 4grid; pdiff = 0.5
M. HAYASAKI
120˚E
150˚E
30˚N
40˚N
50˚N
280 K
280 K
290 K
290 K
0.2
0.4
0.6
0.8
1.0
month-1
120˚E
150˚E
30˚N
40˚N
50˚N
2012 Apr 24 15:59:36 /home/viper/hayasaki/paper/submit/20110815_spring_rain_cyclone/script/cyclone/growth_rate/Asia_EGR_SST_clim_suppl.gmt
120˚E
150˚E
30˚N
40˚N
50˚N
276 K
276 K
280 K
280 K
284 K
284
K
288 K
288 K
292 K292 K
296 K296 K
HH
HH
HH
HH
0.8
0.8
0.8
0.8
0.8
0.8
0.8
0.8
0.8
0.8
0.8
0.8
0.8
0.8
1
1
1
1
1
2
4
|∇(SST)|
120˚E
150˚E
30˚N
40˚N
50˚N
(f) Jan: Eady growth rate (blue); SST (gray), |∇(SST)| (shade)
[K/100km]
2012 Mar 22 19:37:34 /home/viper/hayasaki/paper/submit/20110815_spring_rain_cyclone/script/cyclone/passing_cyclone/total_passing_Asia_suppl.gmt
Lat/lon SLP data were interpolated on the Equal Area Scalabel Earth (EASE) grid.
"ftp://ftp.cdc.noaa.gov/Datasets.other/map/storm/" made by M. C. Serreze
Brown line: topography (2000 m)
(g) Feb: track freq. (shade) & SST (gray line)
EASE grid = 145 * 145 grids on polar stereographic projection (125 km interval)
Short-living cyclones ( < 2 day) are omitted
Search range: 4grid; pdiff = 0.5
M. HAYASAKI
120˚E
150˚E
30˚N
40˚N
50˚N
280 K
280 K
290 K
290 K
0.2
0.4
0.6
0.8
1.0
month-1
120˚E
150˚E
30˚N
40˚N
50˚N
2012 Apr 24 15:59:48 /home/viper/hayasaki/paper/submit/20110815_spring_rain_cyclone/script/cyclone/growth_rate/Asia_EGR_SST_clim_suppl.gmt
120˚E
150˚E
30˚N
40˚N
50˚N
276 K
276 K
280 K
280 K
284 K
284 K
288 K
288 K
292 K292 K
296 K296 K
HH
HH
HH
HH
0.8
0.8
0.8
0.8
0.8
0.8
0.8
0.8
0.8
0.8
0.8
0.8
1
1
1
1
1
1
2
4
|∇(SST)|
120˚E
150˚E
30˚N
40˚N
50˚N
(h) Feb: Eady growth rate (blue); SST (gray), |∇(SST)| (shade)
[K/100km]
Supplement 1: Monthly climatology of cyclone track frequencies (shade in left column. unit: count/month) and horizontalsea surface temperature (SST) gradient (shade in right column. |∇SST| ≥ 1.0 K (100 km)−1) for a cold half year (Nov–Apr) in 1982–2009. Thick blue lines in right column show the maximum Eady growth rate (σ ≡ 0.31 f |∂V /∂z|N−1;σ ≥ 0.8 day−1. See Hoskins and Valdes, 1990). Triangles represent primary path of cyclones that is determined by the gridwith the largest frequency inside the search area (surrounded by dashed line in (a)) along row direction of the EASE grid(approximately northwest-southeast direction around Japan). Thin solid lines show climatological SST (2 K interval).
Hayasaki and Kawamura, Cyclone activities for springtime heavy rain episodes in Japan
2012 Mar 22 19:37:39 /home/viper/hayasaki/paper/submit/20110815_spring_rain_cyclone/script/cyclone/passing_cyclone/total_passing_Asia_suppl.gmt
Lat/lon SLP data were interpolated on the Equal Area Scalabel Earth (EASE) grid.
"ftp://ftp.cdc.noaa.gov/Datasets.other/map/storm/" made by M. C. Serreze
Brown line: topography (2000 m)
(i) Mar: track freq. (shade) & SST (gray line)
EASE grid = 145 * 145 grids on polar stereographic projection (125 km interval)
Short-living cyclones ( < 2 day) are omitted
Search range: 4grid; pdiff = 0.5
M. HAYASAKI
120˚E
150˚E
30˚N
40˚N
50˚N
280 K
280 K
290 K 290 K
0.2
0.4
0.6
0.8
1.0
month-1
120˚E
150˚E
30˚N
40˚N
50˚N
2012 Apr 24 15:59:59 /home/viper/hayasaki/paper/submit/20110815_spring_rain_cyclone/script/cyclone/growth_rate/Asia_EGR_SST_clim_suppl.gmt
120˚E
150˚E
30˚N
40˚N
50˚N
276 K
276 K
280 K
280 K
284 K
284 K
288 K
288 K
292 K292 K
296 K296 K
HH
HH
H
HH
H
0.8 0.8
0.8
0.8
0.8
0.8
0.8
0.8
0.8
0.8
1
1
1
11
1.2
1.21.2
1
2
4
|∇(SST)|
120˚E
150˚E
30˚N
40˚N
50˚N
(j) Mar: Eady growth rate (blue); SST (gray), |∇(SST)| (shade)
[K/100km]
2012 Mar 22 19:37:44 /home/viper/hayasaki/paper/submit/20110815_spring_rain_cyclone/script/cyclone/passing_cyclone/total_passing_Asia_suppl.gmt
Lat/lon SLP data were interpolated on the Equal Area Scalabel Earth (EASE) grid.
"ftp://ftp.cdc.noaa.gov/Datasets.other/map/storm/" made by M. C. Serreze
Brown line: topography (2000 m)
(k) Apr: track freq. (shade) & SST (gray line)
EASE grid = 145 * 145 grids on polar stereographic projection (125 km interval)
Short-living cyclones ( < 2 day) are omitted
Search range: 4grid; pdiff = 0.5
M. HAYASAKI
120˚E
150˚E
30˚N
40˚N
50˚N
280 K
280 K
290 K
290 K
0.2
0.4
0.6
0.8
1.0
month-1
120˚E
150˚E
30˚N
40˚N
50˚N
2012 Apr 24 16:00:11 /home/viper/hayasaki/paper/submit/20110815_spring_rain_cyclone/script/cyclone/growth_rate/Asia_EGR_SST_clim_suppl.gmt
120˚E
150˚E
30˚N
40˚N
50˚N
276 K
276 K
280 K
280 K
284 K
284 K
288 K
288 K
292 K
292 K
296 K296 K
296 K296 K
HH
HH
HH
HH
H
0.8
0.80.8
0.8
0.8
0.8
0.8
0.8
1
1
1
1
1.2
1.2
1.2
1.4
1.41.4
1
2
4
|∇(SST)|
120˚E
150˚E
30˚N
40˚N
50˚N
(l) Apr: Eady growth rate (blue); SST (gray), |∇(SST)| (shade)
[K/100km]
Supplement 1: (Cont.)
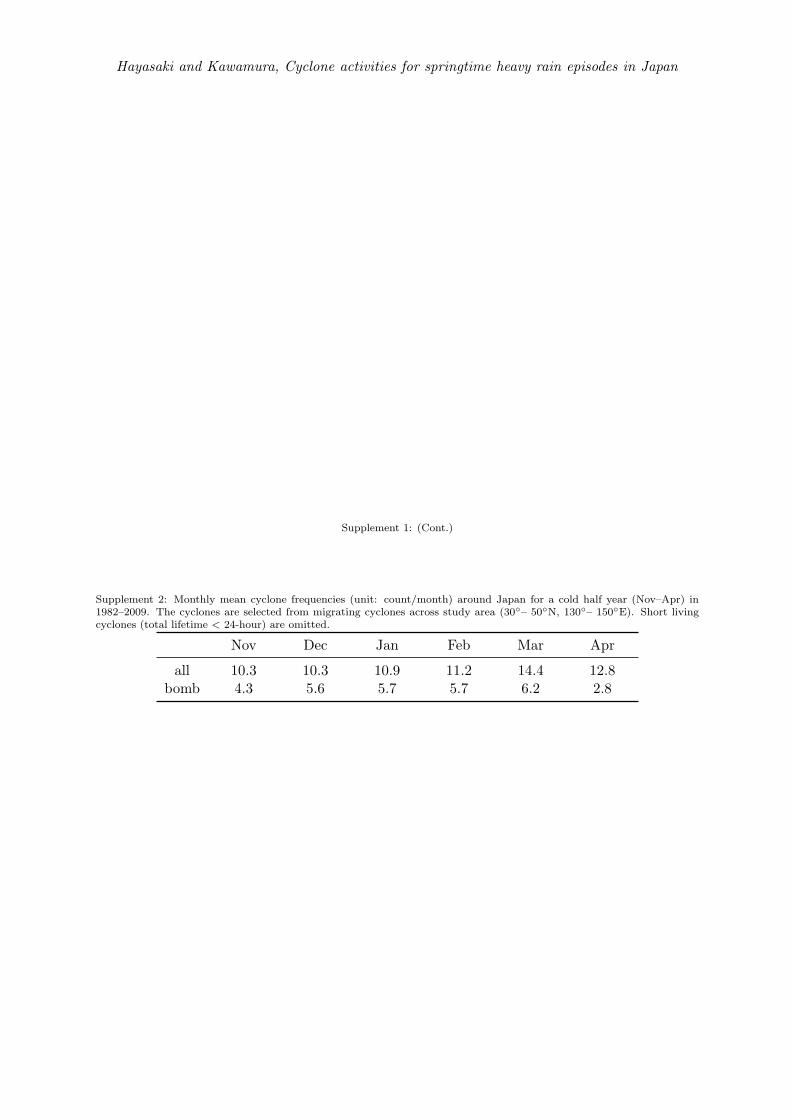
Supplement 2: Monthly mean cyclone frequencies (unit: count/month) around Japan for a cold half year (Nov–Apr) in1982–2009. The cyclones are selected from migrating cyclones across study area (30◦– 50◦N, 130◦– 150◦E). Short livingcyclones (total lifetime < 24-hour) are omitted.
Nov Dec Jan Feb Mar Apr
all 10.3 10.3 10.9 11.2 14.4 12.8bomb 4.3 5.6 5.7 5.7 6.2 2.8