Embed Size (px)
Citation preview

Journal of Membrane Science, 94 (1994) 85-102 Elsevier Science B.V., Amsterdam
85
Sol-gel strategies for controlled porosity inorganic materials
C.J. BrinkeFb**, R. Sehgalb, S.L. Hietalab, R. Deshpandeb,‘, D.M. Smithb, D. Lop and C.S. Ashley” “Sandia National Laboratories, Advanced Materials Laboratory 1001 University blvd. SE, Albuquerque, NM 87106 (USA) bThe UNM/NSF Center for Micro-Engineered Ceramics, University of New Mexico, Albuquerque, NM 87131 (USA)
(Received March 11,1993; accepted in revised form July 27,1993)
Abstract
The porosity (i.e., pore volume, pore size, and surface area) of ceramic materials prepared by sol-gel processing depends on the size and structure of primary particles or polymers formed by condensation reactions, the organization of these structures, often by aggregation, to form a gel, and the collapse of the gel by drying. This paper reviews these ideas in the context of the formation of thin films suitable for inorganic membranes and introduces a number of specific strategies designed to control pore sizes in the range appropriate for gas separation: ( 1) aggregation of fractals; (2 ) management of capillary pressure, (3) control of condensation rate, and (4) the use of organic or microporous templates in composite thin film structures. These strategies are contrasted with the more traditional particle packing approach to preparing controlled porosity materials.
Key words: inorganic membranes; composite membranes; gas separations; glass membranes; microporous and porous membranes
1. Introduction
Thermally, chemically, and mechanically stable materials with controlled porosities are required in such technology areas as gas sepa- ration, catalysis, membrane reactors, sensors, and adsorbents. Often such applications re- quire rather exquisite control of pore size and
*To whom correspondence should be addressed: The UNM/ NSF Center for Micro-Engineered Ceramics, University of New Mexico, Albuquerque, NM 87131, USA. Fax: 505-272- 7304. ‘Currently at Armstrong Research and Development, Lan- caster, PA 17604, USA. Fax: 505-272-7304.
pore size distribution combined with process- ability, e.g., the ability to prepare ultrathin supported films within tubular supports [ 11.
Although zeolites exhibit reasonable stability and unimodal pore sizes in the 0.4 to 1.0 nm range appropriate for gas separations, they suf- fer from poor processability. This has moti- vated many researchers to explore liquid-based processing of inorganic materials generally re- ferred to as sol-gel processing [2]. This paper briefly describes sol-gel processing of both bulk and thin film materials, using silica as a typical example. We then review several strategies de- signed to control the pore size, pore volume, and
0376-7366/94/$07.00 0 1994 Elsevier Science B.V. All rights reserved, SSDI 0376-7388(93)E0129-8

86 C.J. Brinker et al. /J. Membrane Sci. 94 (1994) 85-102
surface area of both bulk and thin film specimens
2. Sol-gel processing
2.1. Sol-gel chemistry
The sol-gel process uses inorganic or metal organic precursors. In aqueous or organic sol- vents the precursors are hydrolyzed and con- densed to form inorganic polymers composed of M-O-M bonds. The most commonly used organic precursors are metal alkoxides tM(OR),I, where R is an alkyl group (C,Hz,+r ) [ 2 1. Normally the alkoxide is dis- solved in alcohol and hydrolyzed by the addi- tion of water under acidic, neutral or basic con- ditions. Hydrolysis replaces an alkoxide ligand with a hydroxyl ligand:
M(OR),+H,O
*M(OR),_,(OH) +ROH (1)
Condensation reactions involving the hydroxyl ligands produce polymers composed of M-O- M or M-OH-M bonds plus, in most cases, the by-products water or alcohol as shown below for silicate condensation:
Si(OR),OH+Si(OR),
ti (RO),Si-0-Si(OR), +ROH (2)
2Si(OR)30H
* (RO),Si-0-Si(OR),+H,O (3)
The reverse of reactions 2 and 3, viz. siloxane bond alcoholysis and siloxane bond hydrolysis, promote bond breaking and reformation pro- cesses that, if extensive, permit complete re- structuring of the growing polymer.
Since metals or metalloids of interest for membrane and catalyst formation (Si, Al, Ti, etc. ) have coordination numbers (CN) 3 4, complete condensation would lead to compact, particulate oxides. In fact, for electropositive
metals such as Ti and Zr, it is difficult to avoid particle formation unless the alkoxide precur- sor is modified, e.g., chelated with slowly hy- drolyzing multidentate ligands such as acetyl- acetonate (acac ) [ 31 or alcohol amines [ 4,5], to reduce both the effective functionality [3] and the rates of hydrolysis and condensation [ 3,5]. The metalloid, silicon, however, is sub- stantially less electropositive. Hydrolysis and condensation of silicon alkoxides occur at much lower rates, and the condensation pathway can be more easily influenced by steric and chemi- cal factors such as the steric bulk of the alkox- ide ligand, the concentration of the acid or base catalyst, the molar ratio (r) of H,O : M in eqn. (l),ortheagingtimes (seeFigs.land2) [6,7].
There is a considerable body of evidence based on 2gSi NMR [B-lo] and small-angle X- ray scattering (SAXS) [ 11-131 data indicat- ing that, depending on the synthesis condi- tions, a wide spectrum of structures ranging from weakly branched polymers to fully con- densed particles may be prepared from silicon
Fig. 1. Possible condensation pathways for silica polymer- ization. Aqueous conditions (or for metal alkoxides, high HzO/Si), high pH and/or high temperature promote the formation of compact, particulate structures. Low H,O/Si, moderately acidic conditions and low temperatures lead to more extended structures characterized by a mass fractal dimension D, perhaps via reaction-limited cluster aggre- gation, RLCA.

C.J. Brinker et al. /J. Membrane Sci. 94 (1994) 85-102 87
Fig. 2. Average condensation rates, estimated as l/t,,, for silicates prepared from tetraethoxysilane (top) or from aqueous silica sols (bottom) [6]. Data in the top figure are from Coltrain et al. [ 71 where p-TSA is p-toluenesulfonic acid, HOAc is acetic acid, and TFA is trifluoroacetic acid. In the bottom figure, A and B represent regions of high and low sticking probability, respectively.
alkoxides. The distinction between polymers and particles can be made by “Si NMR spec- troscopy on the basis of the distribution of Si (OR), (OH),, ( OSi ) ,, species, or Q” distribu- tion where n = 4 -x-y. Fully condensed parti- cles are characterized by a prominent Q” reso- nance, whereas polymers exhibit primarily Q” and Q3 resonances. The prevalence of &l-Q” species over Q” species in Fig. 3 [2] indicates that, for a wide range of processing conditions, polymers rather than particles are the products of silicate condensation.
The distinction between polymers and par- ticles can also be made from SAXS studies that probe structure on the N 0.5-50 nm length scale. The Porod slope, P, of a plot of log scattered intensity versus log scattering wave vector, K= (4n/A)sin(8/2), is related to the mass fractal dimension, D, and the surface fractal di- mension, D,, by [ 121:
P=D,-20 (4)
For uniform (non-fractal) objects such as par-
(d) 04 OR
A I
02: sio-si-0%
i
1 STEP ACID r=2
-SO -80 -100
PPM -120 -140
Fig. 3. Comparison of ?Si NMR spectra of silicate sols pre- pared from tetraethoxysilane (TEOS) to that of a com- mercial aqueous silicate sol (Ludox HS40). (a) Acid-cat- alyzed TEOS sol (H,O/Si= 2) after 3 hr at room temperature; (b) two-step acid-catalyzed TEOS sol ( HzO/ Si=5); at t/tpl=0.9; (c) multicomponent silicate sol (H,O/Si=5) agedfortwoweeksat 323KandpH -3; (d) Ludox HS40. The Q” notation refers to the number of - OSi bonds surrounding the silicon nucleus of interest.
titles, D=3 and D,=2, P reduces to -4. For mass fractal objects, D = D, and P= -D. For surface fractal objects, D= 3 and P= D,- 6. Porod plots of a variety of silicates prepared from metal alkoxides are compared with the Porod plot of a particulate silica sol in Fig. 4 [ 131. It is generally believed [ 21 that the prev- alence of fractal silicates over a wide range of processing conditions is a consequence of ki- netically limited growth mechanisms such as reaction-limited cluster-cluster aggregation (RLCA) [14].
The mass fractal dimension D relates an ob- ject’s mass M to its radius F, [ 151:
M-F? (5)
where for mass fractal objects, D is less than the embedding dimension of space d; for our

C.J. Brinker et al. /J. Membrane Sci. 94 (1994) 85-102
’ BASE -2.8
K (r/A, K = (41-t/h) sin (O/2)
Fig. 4. Porod plots (log scattered intensity versus log scat- tering wave vector K [where K= (4n/l)sin(0/2) 1) ob- tained by SAKS for a variety of silica ~01s. (A) Two-step acid-catalyzed TEOS sol (H,O/Si = 5)) (B ) two-step acid/ base-catalyzed TEOS (H,O/Si=3.8), (C) one-step base- catalyzed TEOS (H,O/Si=l), (D) one-step base-cata- lyzed TEOS (H,O/Si=2), and (E) commercial particu- late silicate sol (Ludox SM ) . From Shaefer and Keefer [ 13 1.
purposes, d = 3. The surface fractal dimension D, relates an objects area, A, to its size [ 151:
AC@ (6)
where for d = 3,2 < D, < 3. Since in three dimensions, D < 3, the density
of a mass fractal cluster decreases with dis- tance from its center of mass:
pcC 1/r;3-D’ (7)
Because density is inversely related to porosity, this relationship requires that, unlike Euclid- ean objects, fractal objects become more porous as their size increases. We will show that this property may be exploited to tailor the pore structure of films deposited from fractal precursors.
2.2. Bulk versus thin film processing
The inorganic sols described above may be
processed in a variety of forms. Bulk materials useful for adsorbents or catalyst supports are commonly prepared by allowing the sol to gel in a sealed container followed by aging and drying to form a porous dry gel or xerogel [ 21. Alternatively, thin films useful for membranes, sensors, and membrane reactors are formed from the fluid sol normally by a simple proce- dure involving slip-casting followed by dip- coating (see Fig. 5). During thin film forma- tion by this method, the sol is concentrated by slip-casting followed by evaporation, leading to the formation of an ill-defined physical or chemical gel. This rather concentrated gel is dried by further evaporation to form a xerogel film [16].
For both bulk and thin film specimens, the final porous microstructure is established by drying [ 171. The drying process is composed of two successive stages (see Fig. 6). In the first stage, referred to as the constant rate period, the loss of pore fluid is accommodated by shrinkage of the gel, causing the liquid-vapor interface to remain at the exterior gel surface. The driving force for this shrinkage is the cap- illary tension P developed in the liquid by the radius of curvature of the meniscus r,:
p= - 2YLvlrm (8)
where yLv is the liquid-vapor interfacial en- ergy. Assuming for simplicity cylindrical pores, r, is related to the cylindrical pore radius rP by:
r, = -r,/cos(O) (9)
where 0 is the contact angle. Combining eqns. (8) and (9) we arrive at the familiar Kelvin equation:
P=2yLvcos(8)/r, (10)
For wetting fluids (8~ 90” ) , the meniscus is concave, causing the liquid to be in tension (positive P): in essence the reduced volume of liquid must stretch to cover the solid surface and avoid the creation of higher energy solid-

C.J. Brinker et al. /J. Membrane Sci. 94 (1994) 85-102 89
COLLAPSE AND/ ORE FORMATION
AGGREGATION
ALCOHOL/WATER EVAPORATION
PORE SIZE CONTROLLED BY:
- SIZE, STRUCTURE, COMPOSITION
- RATES OF CONDENSATION/ EVAPORATION/FLOW
DILUTE SOL - AGING
- CAPILLARY PRESSURE
Fig. 5. Steady-state film deposition profile during dip-coating a porous support. The support is withdrawn from the sol at a constant speed U,. The entrained sol thins by gravitational draining and evaporation accompanied by flow into (or out of the porous support). Increasing sol concentration leads to aggregation and gelation. At the final stage of the deposition process the gel film is collapsed by the capillary pressure P, establishing the final pore size rp. Double arrows signify liquid flow into/exchange with that in support.
vapor interfaces. This tension in the liquid is supported by the gel network causing it to con- tract [ 21. Initially the gel network is quite com- pliant. Shrinkage occurs, easily maintaining a relatively flat meniscus. However, the contrac- tion of the network promotes further conden- sation as reactive terminal hydroxyl species are brought into closer contact. Eventually the contracting network becomes sufficiently stiff that it can resist any further compaction due to the capillary tension. At this point, referred to as the critical point, shrinkage ceases, and the capillary tension is maximized. Any further evaporation of liquid causes the meniscus to re- cede into the gel interior. This constitutes the beginning of the falling rate period of drying
[171-
It is the shrinkage of the solid network at the critical point that establishes the final pore vol- ume, pore size, and surface area of the dry gel or xerogel. Therefore, many strategies designed to tailor the porosity of either bulk or thin film xerogels rely on controlling the extent of shrinkage. The extent of drying shrinkage de- pends on the balance between the magnitude of the capillary pressure that collapses the gel and the stiffness of the gel that provides resistance to collapse. This balance depends in turn on the characteristic time scale of the drying process. For bulk gels, long pathways for flow and dif- fusion require drying to occur slowly (hours to days), especially if cracking is to be avoided (2,171. For films, vigorous evaporation over- laps the complete deposition process (Fig. 5).

90 C.J. Brinker et al. /J. Membrane Sci. 94 (1994) 85-102
a) INITIAL CONDITION 3. Strategies for control of the porous microstructure
b) CONSTANT RATE PERIOD
EVAPORATION
rm I)
SHRINKAGE
p = -3yLv
rm
rm
Sol-gel processing of silicates, as well as many other oxides of interest for membranes, sen- sors, etc., produces amorphous or nanocrystal- line material. Porosity is generally not defined by a spatially extensive crystalline lattice as in zeolites, thus strategies designed to control po- rosity often rely on managing the packing effi- ciency of polymers or particles during gelation and aging and their extents of collapse upon drying. In this section we present several strat- egies to control porosity based on the underly- ing physics and chemistry of sol-gel processing.
cl FALLING RATE PERIOD
3.1. Particle packing
Fig. 6. Schematic illustration of drying process. (a) The network is initially compliant and little stress is needed to keep it submerged in the liquid, (b) as the network stiffens, capillary tension is developed as the liquid flows to prevent exposure of solid phase by evaporation, and r, decreases. At the critical point, r,,, becomes equal to the pore radius rp, ending the constant rate period and the liquid recedes into the gel (c) From Scherer [ 181.
Within seconds the entrained sol is concen- trated and dried to form an extremely thin solid film (typically 10 to 300 nm) . This short char- acteristic time of the thin film deposition pro- cess represents the time for continued conden- sation reactions to occur. Thus, compared to bulk gels, films are less highly condensed prior to the critical point and hence suffer greater collapse during drying. This has the synergistic effect of reducing the pore size, increasing P (eqn. 10) and promoting greater collapse of the network. Consequently, films are characterized by lower pore sizes, pore volumes and surface areas than their bulk counterparts.
Virtually all particle packing concepts utilize particles that are packed together to create po- res of a size related to the primary particle size [ 19-211. Ideally if monosized particles could be assembled into a colloidal crystalline lattice, it would be possible to mimic the performance of zeolites. Unfortunately, it is not yet possible to avoid some distribution of particle sizes, so the hopes of forming a spatially extensive colloidal crystalline film have been thwarted. The cur- rent state of the art is to prepare particles with quite narrow particle size distributions that are more or less randomly close-packed into a membrane configuration without aggregation (which would create a second class of larger po- res) . The advantage of this approach is that the porosity of the membrane (which dictates its flux) is independent of the particle size. For ex- ample, random dense packing of monosized spherical particles always results in about 33% porosity. Particle packing is the basis of the y- A1203 Knudsen separation membranes cur- rently supplied by U.S. Filter with nominal pore diameters of 4.0 nm corresponding to the thick- ness of y-A1203 platelets comprising the mem- brane. In this case the porosity of the mem-
C.J. Brinker et al. /J. Membrane Sci. 94 (1994) 85-102 91
brane is reported to be in the range 40-45%, presumably due to electrostatic interactions associated with the plate-like shape of the pri- mary particles.
To arrive at smaller pore sizes appropriate for gas separation applications, it is necessary to prepare smaller particles. Although the syn- thesis of appropriately small particles has been demonstrated [ 221, they have proven to be dif- ficult to process into supported membranes due primarily to problems with cracking. Avoid- ance of cracking, which is essential for mem- brane performance, may be a fundamental lim- itation of the particle approach to the preparation of gas separation membranes based on the following discussion.
Most commonly, in order to avoid aggrega- tion, an electrostatic double layer is erected around each particle. If, according to DLVO theory, we use the Debye-Hiickel screening length l/~ to judge the thickness of the double layer [23]:
(11)
where F is Faraday’s constant, E, is the permit- tivity of vacuum, E is the dielectric constant of the solvent, and ci and zi are the concentration and valence of counterions of type i, we see that l/it does not depend directly on particle size. This is problematic when using very small par- ticles, since, as the particle size is diminished, the tightly bound solvent layer comprises an ever increasing volume fraction f, of the depos- iting film at the instant it gels. The removal of this liquid during subsequent drying creates a tensile stress (a) within the plane of the mem- brane that results in cracking [ 241:
o=[El(l-lJ)l t(f*--fr)/31 (12)
where E is Young’s modulus (Pa), v is Pois- son’s ratio, fs is the volume fraction solvent at the gel point, and f, is the residual solvent (if any) in the fully dried film. From eqn. (12) we see that Q is directly proportional to f,. The re-
sult is that cracking is more likely to occur in particulate membranes as the particle size is reduced [25]. This is problematic when at- tempting to prepare membranes for gas sepa- ration where cracks must be rigorously avoided.
There are two other potential problems as- sociated with the particle approach. First, many of the particles currently used (Ti02, A1203, ZrO,, AlOOH, etc.) undergo phase transfor- mations and/or grain growth at relatively low temperatures, causing the microstructure to coarsen significantly [ 261. Second, as the par- ticle radius a is reduced the particle solubility S increases according to the Ostwald- Freundlich equation:
S=S,exp(2ysLV,JRTa) (13)
where S, is the solubility of a flat plate, ysL is the solid-liquid interfacial energy, and V,,, is the molar volume of the solid phase. As the particle size is reduced below 5 nm, S increases dramat- ically. Thus in many liquid environments na- nosized particulate films are inherently unstable.
3.2. Aggregation of fractals
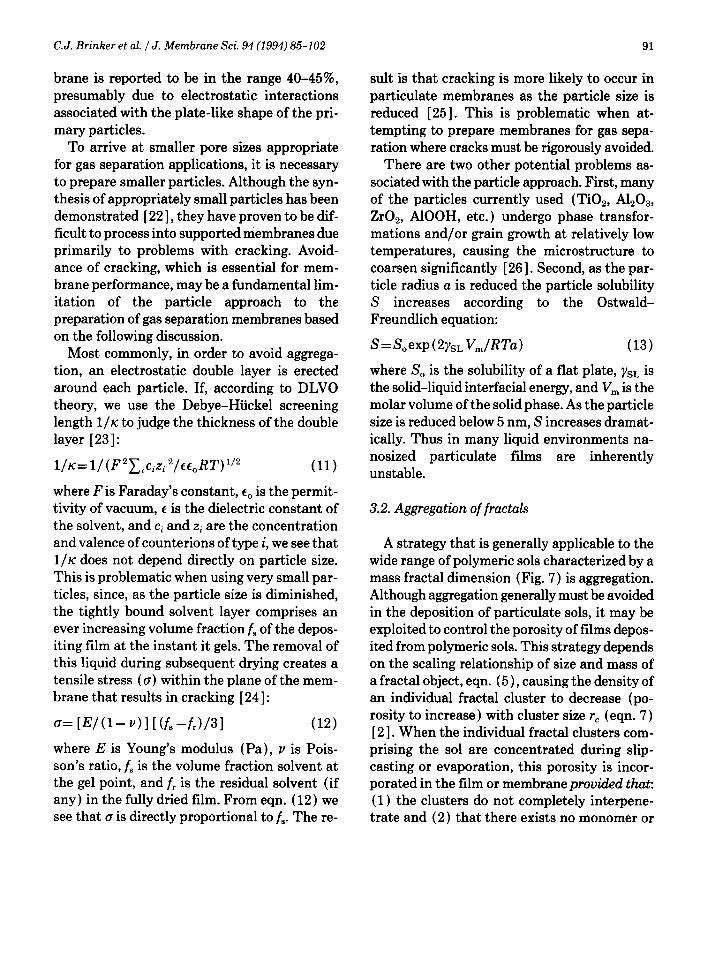
A strategy that is generally applicable to the wide range of polymeric sols characterized by a mass fractal dimension (Fig. 7) is aggregation. Although aggregation generally must be avoided in the deposition of particulate sols, it may be exploited to control the porosity of films depos- ited from polymeric ~01s. This strategy depends on the scaling relationship of size and mass of a fractal object, eqn. (5), causing the density of an individual fractal cluster to decrease (po- rosity to increase) with cluster size rC (eqn. 7) [ 21. When the individual fractal clusters com- prising the sol are concentrated during slip- casting or evaporation, this porosity is incor- porated in the film or membrane provided that:
(1) the clusters do not completely interpene- trate and (2) that there exists no monomer or
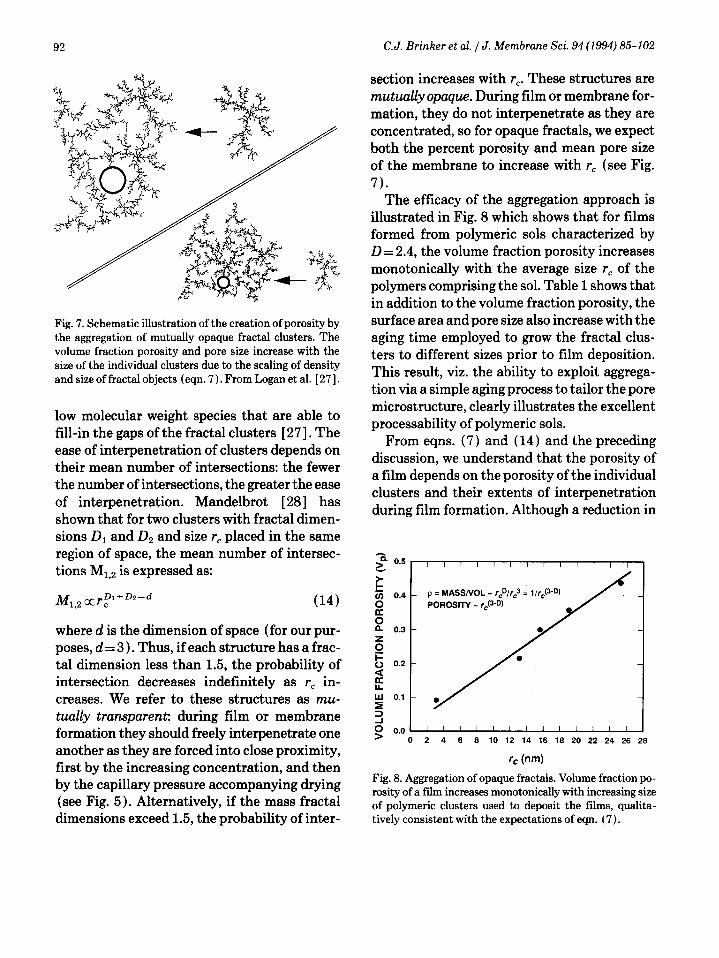
Fig. 7. Schematic illustration of the creation of porosity by the aggregation of mutually opaque fractal clusters. The volume fraction porosity and pore size increase with the size of the individual clusters due to the scaling of density and size of fractal objects (eqn. 7). From Logan et al. [ 271.
low molecular weight species that are able to fill-in the gaps of the fractal clusters [ 271. The ease of interpenetration of clusters depends on their mean number of intersections: the fewer the number of intersections, the greater the ease of interpenetration. Mandelbrot [28] has shown that for two clusters with fractal dimen- sions II1 and DZ and size r, placed in the same region of space, the mean number of intersec- tions Ml,z is expressed as:
MI 2 KrD1+Dz--d . c (14)
where d is the dimension of space (for our pur- poses, d= 3). Thus, if each structure has a frac- tal dimension less than 1.5, the probability of intersection decreases indefinitely as r, in- creases. We refer to these structures as mu- tually transparent: during film or membrane formation they should freely interpenetrate one another as they are forced into close proximity, first by the increasing concentration, and then by the capillary pressure accompanying drying (see Fig. 5). Alternatively, if the mass fractal dimensions exceed 1.5, the probability of inter-
C.J. Brinker et al. /J. Membrane Sci. 94 (1994) 85-102
section increases with r,. These structures are mutually opaque. During film or membrane for- mation, they do not interpenetrate as they are concentrated, so for opaque fractals, we expect both the percent porosity and mean pore size of the membrane to increase with r, (see Fig.
7). The efficacy of the aggregation approach is
illustrated in Fig. 8 which shows that for films formed from polymeric sols characterized by D = 2.4, the volume fraction porosity increases monotonically with the average size rc of the polymers comprising the sol. Table 1 shows that in addition to the volume fraction porosity, the surface area and pore size also increase with the aging time employed to grow the fractal clus- ters to different sizes prior to film deposition. This result, viz. the ability to exploit aggrega- tion via a simple aging process to tailor the pore microstructure, clearly illustrates the excellent processability of polymeric ~01s.
From eqns. (7) and (14) and the preceding discussion, we understand that the porosity of a film depends on the porosity of the individual clusters and their extents of interpenetration during film formation. Although a reduction in
= F 0.5
g o.4
is n. 0.3
ti
5 0.2
&
w 0.1
5 c 0.0 -
p = MASS/VOL - r,D/r,3 = 1/r,(3-D)
POROSITY - r&3-D)
0 2 4 6 8 10 12 14 16 16 20 22 24 26 26
rc (W
Fig. 8. Aggregation of opaque fractals. Volume fraction po- rosity of a film increases monotonically with increasing size of polymeric clusters used to deposit the films, qualita- tively consistent with the expectations of eqn. (7).

C.J. Brinker et al. /J. Membrane Sci. 94 (1994) 85-102
TABLE 1
93
Summary of film porosities as a function of sol aging times, obtained using a SAW technique. Aging serves to grow the polymers prior to their deposition on the substrate
Sample aging Refractive times” index
Unaged 1.45
Porosityb (%)
0
Median pore radius’ (nm )
(0.2
Surface areab
1.2-1.9
Applications
dense protective, electronic and optical films
O-3 Days microporous films for sensors and membranes
3 Days 1.31 16 1.5 146 films for sensors, membranes, catalysts, optics
1 Week 1.25 24 1.6 220 2 Week 1.21 33 1.9 263 3 Week” 1.18 52 3.0 245
’ Aging of dilute sol at 50°C and pH 3 prior to film deposition. b Determined from N, adsorption isotherm. ’ The 3 week sample gelled. It was re-liquefied at high shear rates and diluted with ethanol prior to film deposition.
D increases the porosity of a cluster according to eqn. (7)) it also facilitates interpenetration according to eqn. (14). Thus highly porous films require an intermediate value of D: generally 2.0 <D < 3.0 ‘.According to eqn. (7), low values of D promote interpenetration of polymers during film formation. Interpenetration can completely mask the porosity of the individual polymers. For example, for D < 2, quite dense films ( N 5 ~01% porosity) with small pores ( < 1.0 nm) are prepared over a wide range of aging times [2], i.e., there is no dependence of the film porosity on polymer size. This situa- tion is beneficial for the preparation of ultra- thin membranes on porous supports, because aging can be employed to grow polymers large
‘Although eqn. (14) indicates that interpenetration is in- hibited when D exceeds 1.5, this equation assumes condi- tions chemically equivalent to an infinite condensation rate. Finite condensation rates require D>2 to practically achieve conditions of mutual opacity. See discussion in the following section.
enough to be trapped on the support surface without suffering an increase in pore size [ 291.
3.3. Rate of condensation
The criterion for opaque or transparent frac- tals established by eqn. (14) is based on the assumption that instantaneous and irreversi- ble reaction or sticking occurs at each point of intersection. Thus, as the points of intersection are reduced, the polymers more easily inter- penetrate one another - they become transpar- ent to one another. Polymer transparency is also promoted by reducing the probability of sticking at each point of intersection. Chemi- cally this is achieved by reducing the conden- sation rate. Instantaneous and irreversible sticking is chemically equivalent to an infinite reaction (condensation) rate. Of course in reality the probability of sticking is much less than unity and is influenced by catalyst con- centration, temperature, and reactivity of the

94 C.J. Brinker et al. /J. Membrane Sci. 94 (1994) 85-102
Fig. 9. Cross-sectional TEM image of a microporous silica membrane layer deposited on a U.S. Filter@ y-A&O3 membrane support. Region A indicates the y-AlP03 support layer (pore size = 4.0 nm). Region B is the deposited SiOp layer.
terminal ligands. For example, for silicate poly- mers prepared from tetraethoxysilane by a sol- gel process, the condensation rate is strongly dependent on the sol pH as estimated by the reciprocal gel times (see Fig. 2) [6,7]. If the condensation rate is reduced, the probability of sticking at each point of intersection is re- duced. This promotes polymer interpenetra- tion, leading to denser films with smaller pore sizes.
An additional (and perhaps more influen- tial) consequence of the condensation rate is that it largely dictates the stiffness of the net- work and thus its extent of collapse during drying. A reduction in the condensation rate causes the network to be more compliant fos- tering its collapse in response to the capillary pressure created at the final stage of drying (see, for example, Fig. 5 ) .
The influence of the condensation rate on the porosity of thin silica membranes prepared on porous ~-A1~0~ supports (see Fig. 9) is illus- trated in Figs. 10 and 11 [ 301. In Figure 10 re- ciprocal gel times are used to establish the min- imum condensation rate of a silica sol prepared from tetraethoxysilane using a two-step acid- catalyzed hydrolysis process [ 291. Compari- sons of the helium and nitrogen permeance measurements of the corresponding mem- branes (see, for example, Fig. 11) showed that only membranes prepared from the sol repre- senting the minimum condensation rate (A2** in Fig. 10) exhibited He/N2 separation factors exceeding the theoretical Knudsen value (Ta- ble 2 ) consistent with some size exclusion of Nz relative to He. Analysis of the permeance of the other membranes prepared from sols A2 and A2* [29] indicates that, although the pore di-

C.J. Brinker et al. /J. Membrane Sci. 94 (1994) 85-102
HCI NORMALITY (N)
3.0 1.0 0.3 0.1 0.03 0.01
0.00 1 I I 1
0.5 1.0 1.5 2.0 2.5 3.0
CALCULATED pH
Fig. 10. Reciprocalgel times (proportional to condensation rate) versus calculated pH for a series of two-step acid- catalyzed sols where HCl of the corresponding normality was used for each of the two hydrolysis steps. Sols A2, A2*, and A2** were used to prepare supported inorganic mem- branes. From Sehgal [30].
1
2 E Y 0.1
3
@k
t-s E 0.01 2
b
3 0.001 I
El P
10'
I 1 I I
COATING SOL t/tee, = 0.24
10 20 30 40 50 60
AVERAGE PRESSURE ACROSS SUPPORT (PSIA)
Fig. 11. He and Nz permeance of support layers or respac- tive support layers plus two coats of either A2 or A2** ~01s. Corresponding selectivity factors are listed in Table 2. From Sehgal [ 301.
ameters must be less than about 1.0 nm, the pore size is not small enough to achieve any ef-
95
feet of molecular sieving [31] 3. Since the Q distributions determined from 2gSi NMR and the Guinier radii and fractal dimensions deter- mined from SAXS were comparable for sols A2 and A2** when compared at the same relative gel times t/tge, [ 301, we conclude that the pri- mary effect of the condensation rate is not to alter the polymer structure but rather to influ- ence the extent of polymer interpenetration and collapse during membrane deposition.
From the above discussion it is clear that a reduction in the condensation rate promotes the collapse of the structure during drying. For films it is possible to achieve pore sizes in the range appropriate for separations based on size ex- clusion. Such extensive collapse of the gel net- work has not been observed for bulk specimens. Although the condensation rate can be mini- mized, the considerably longer processing times associated with bulk xerogel formation allow considerably more condensation to take place, leading to stiffer structures that resist collapse.
3.4. Capillary tension
The preceding section discusses a strategy for control of porosity based in part on controlling the stiffness of the network to modulate its ex- tent of collapse in response to a particular cap- illary pressure P. An alternative to this ap- proach is to manage the capillary pressure applied to the network through control of the liquid-vapor interfacial energy yLv, the wetting angle #, and the pore radius rP. According to the Kelvin equation (eqn. 10) a reduction in yLv leads to a corresponding reduction in P. This should reduce the extent of collapse of the gel leading to greater pore volumes and larger pore sizes. A familiar example of this concept is the
3Based on models utilizing cylindrical capillaries and spherical gas molecules Fain [ 311 has shown that a N,/He separation factor of 7 corresponds to a pore diameter of 0.7 nm.

96
TABLE 2
C.J. Brinker et al. /J. Membrane Sci. 94 (1994) 85-102
Permeance, normalized permeance reduction ratio (relative to the uncoated support) and separation factors for uncoated supports and corresponding membranes prepared from two-step acid-catalyzed silica sols (A2 or A2**) aged for identical relative times (t/tee,= 0.24) prior to membrane deposition. Ideal He/N2 Knudsen separation factor CQ_,~_~~ = 2.65
He Support A2 N2 Support A2
He 2 Coatings A2 N2 2 Coatings A2
He Support A2** N2 Support A2**
He 2 Coatings A2** N2 2 Coatings A2**
Permeance Normalized (cm3/cmZ-see-cmHg) reduction ratio
0.1031 1.0 0.0605 1.0
0.0198 5.2 0.0107 5.7
0.0891 1.0 0.0364 1.0
0.0027 33 0.0004 92
Separation factor (a~,-, 1
1.70
1.35
2.45
6.9
production of very low density aerogels through removal of the pore fluid above its critical point where yLv=O [ 21. For bulk materials it is pos- sible to exchange the pore fluid prior to drying in order to manage the capillary pressure and hence the extent of collapse of the gel network. Figure 12 shows the hydrodynamic radii of two series of silica xerogels prepared by exchange of the pore fluid with a variety of aprotic sol-
FwREHpJO
APRDTK SOL”ENTS/ETHOXYLATED SURFACE > a 01 I I I I
0 20 40 60 60
SURFACE TENSION [dyne/cm]
Fig. 12. Average pore radius determined by N, sorption versus surface tension of pore fluid used during drying for a series of two-step acid-base catalyzed silica gels. Prior to drying the pore surfaces were treated to create primarily hydroxylated surfaces or primarily ethoxylated surfaces. From Deshpande et al. [ 32 1.
vents followed by drying [ 321. For both series of gels, the pore size is diminished with increas- ing surface tension as expected due to greater collapse of the gel network (a similar effect is observed for pore volume and surface area). However, for the same surface tension the ex- tent of collapse depends on the nature of the surface ligands. As discussed in the previous section this reflects differences in the corre- sponding condensation rates. Since the rate of the alcohol-producing condensation reaction is less than that of the water producing conden- sation reaction (eqns. 2 and 3) [ 21, and, at room temperature, the rate of the ether-producing condensation reaction (ROR) is zero [2], ethoxylated surfaces inhibit condensation compared to hydroxylated surfaces. Thus after the same period of drying, the gel prepared with ethoxylated surfaces will be less highly con- densed, causing it to collapse more in response to the capillary tension exerted by the pore fluid.
From Fig. 12 we observe that when water is used as the pore fluid, the pore radius does not follow the trend established by the aprotic sol- vents. Water is not simply a solvent, it has the effect of stiffening the gel network, greatly re-

C.J. Brinker et al. /J. Membrane Sci. 94 (1994) 85-102
ducing its extent of collapse during drying and hence establishing a larger pore size. A similar effect is seen for both the pore volume and sur- face area [ 321.
Based on eqn. (lo), another means of man- aging the capillary pressure is to alter the wet- ting angle 8. As 13 is increased toward 90”, the capillary pressure is reduced toward zero. Deshpande and co-workers [ 33,341 have shown that materials structurally identical to conven- tional aerogels can be prepared at ambient temperature and pressure by appropriate mod- ification of the gel surface prior to drying. Fig- ure 13 compares the pore volume and density of so-called ambient pressure aerogels to those of the same original gels dried by either super- critical extraction of ethanol or CO,. Not only are the pore volumes and densities virtually identical, but the ambient pressure aerogels have the advantage of being hydrophobic [33,34].
Management of the capillary pressure is more difficult for films. Since for dip-coating, the drying stage completely overlaps the deposi- tion, aging, and gelation stages (see Fig. 5)) it is not possible to interrupt the process in order to exchange the pore fluid or modify the surface chemistry. It seems obvious that various sol- vent mixtures could be used to systematically vary the pore fluid surface tension; however preferential evaporation of one solvent from a
2
1 Y 3 P ,
B 6%
0
Fig. 13. Comparison of porosities of aerogels prepared by conventional routes to those of the corresponding ambient pressure aerogel, prepared with organically-modified sur- faces, and silica xerogel, prepared by evaporation without prior organic-modification of the pore surfaces. From Smith et al. [33].
91
solvent mixture can significantly alter the composition of the pore fluid at the drying line (x= 0 in Fig. 5) where the maximum capillary pressure is developed [ 161. For example, for ethanol/water mixtures preferential evapora- tion of ethanol enriches the pore fluid in water, causing the pore fluid composition at the drying line to be 100% water when the original volume fraction water exceeds N 510% [ 351. In order to control the pore fluid composition and hence its surface tension, it will be necessary to use solvent mixtures corresponding to evaporation azeotropes, i.e., mixtures whose composition represents the highest vapor pressure phase, thus avoiding preferential evaporation of any of the fluid components. This strategy has not yet been employed for sol-gel processing.
3.5. Use of templates
As described in Sections 3.2-3.4, small pore sizes are created in films and membranes de- posited from polymeric sols by promoting col- lapse of the gel structure. This causes a reduc- tion in both the pore size and the pore volume, so selectivity improvements of a membrane are achieved at the expense of flux. One means of de-coupling pore size and pore volume is to cre- ate pores within a dense matrix by the removal of a pore template [ 361. With this strategy the pore size and shape depends on that of the tem- plate, while the pore volume and connectivity depend on the volume fraction of the template phase. Conceivably the template could be de- signed to mimic the size and shape of a specific target molecule to achieve molecular recogni- tion capabilities or it might be designed to mimic a transition state of a desired reaction to achieve a catalytic function [ 371.
In order to demonstrate this strategy in the fabrication of thin films useful for membranes and sensors, we have co-condensed tetraeth- oxysilane [ Si ( OEt ), ] with 4,4’ -his (tri-

98 C.J. Brinker et al. /J. Membrane Sci. 94 (1994) 85-102
ethoxysilyl)biphenyl (Fig. 14) [ 381 and have prepared thin films from the resulting ~01s. The idea (see Fig. 15) is to embed the organic tem- plate (biphenyl) in a dense silica matrix. Re- moval of the template, for example by thermal oxidation or ozonolysis, then creates a pore the size of the biphenyl spacer. In order to achieve connectivity of the pores, we must exceed the percolation threshold of the templates or per- haps rely on phase separation.
Table 3 lists values of the refractive index measured by ellipsometry for silica films con- taining either 0, 10, or 25 ~01% of the biphenyl spacer after deposition at room temperature and after heating to either 400 or 500°C. We ob- serve that for samples containing biphenyl spacers, the refractive index is reduced upon
8.7 A
10.1 h
Fig. 14. A series of aryl-bridged silsesquioxanes appropri- ate for molecular engineering of microporosity. Dimen- sions refer to the size of the pore created by the removal of the phenyl spacer group (9). From Shea et al. [ 371.
RO OR RO OR 1 ./
ROISI-~-SI=_OR + ,SI\ -
RO’ OR RO OR
COPOLYMER
v///////////////////: ///////////////A THIN FILM DEPOSlTlON HYDROLYSIS PYROLYSIS
OR PHOTOLYSIS OF ORGANIC TEMPLATE
Fig. 15. Schematic illustration of molecular engineering of porosity in silica films using organic templates. Removal of the template creates a pore that mimics the size and shape of the organic ligand.
TABLE 3
Effects of template concentration and calcination temper- ature on the refractive indices of composite silica/4,4- bis (triethoxysilyl ) biphenyl films prepared on silicon waf- ers. Corresponding TGA shows that the biphenyl ligands are removed between 400 and 500°C. Percent porosities of the films heated to 500°C were calculated from the refrac- tive index values (see text). Heating rates were 1 “C/min
Temperature Vol% biphenyl spacers in silica thin film (l”C/min) matrix
0% 10% 25%
As-deposited 1.437 1.485 400°C 1.419 1.615 2.115 500°C 1.421 1.388 1.313
( u 9% porosity) ( * 28% porosity)
heating to 500°C by which temperature corre- sponding TGA shows the biphenyl groups to be removed. Using the Lorentz-Lorenz model and assuming the refractive index of dense vitreous silica to be 1.45, values of the refractive index were used to calculate the ~01% porosities of the films created by removal of the spacer groups. From Table 3 we see that the ~01% porosities correspond approximately to the ~01% of the added spacers. From this observation we can conclude that template removal is not accom- panied by collapse of the surrounding matrix. This is a necessary but not sufficient condition to verify the feasibility of this approach.
To evaluate the corresponding pore size and connectivity, companion thin film samples were prepared on surface acoustic wave (SAW) sub- strates [ 391. Figure 16a and b plot the N, and partial CO, isotherms acquired at 77 and 273 K, respectively, obtained for N 1 cm2 areas of the deposited films. The N, isotherm is of Type 2 characteristic of adsorption on a nonporous solid, while the limited CO, isotherm is clearly of Type 1, indicative of the presence of micro- porosity. Since the kinetic diameters of N, and CO2 are quite similar, this apparent discrep- ancy suggests that at 77 K transport into the

C.J. Brinker et al. /J. Membrane Sci. 94 (1994) 85-102
- lo (a) I I I I % 0 0‘ 0 ADSORPT,ON E s- o DEsoRPT,oN 2
9 9 6-
8 9 4-
g s”
3 2- 0
B a 00 0 0 l 0 l ,,@mIq I
0.0 0.2 0.4 0.6 0.6 1.0
0.6
PIP,
Fig. 16. Sorption isotherms, obtained using SAW tech- niques, of composite silica (A2 ) / 4,4’ -his (tri- ethoxysilyl)biphenyl films containing 25 ~01% of the bi- phenyl spacer ligand and calcined to 500” C (773 K ) . (a) Nitrogen sorption at 77 K shows a Type 2 isotherm indic- ative of a nonporous film. (b ) The partial carbon dioxide isotherm at 273 K of the same film shows a Type 1 iso- therm indicative of microporosity, seen more clearly in the expanded scale of the inset figure. The y-axis represents the volume of gas adsorption per area of the coated substrate.
micropores is kinetically unfavorable, i.e., gas transport in microporous channel systems is strongly thermally activated.
Based on the combined ellipsometry and ad- sorption results, several important conclusions can be drawn: (1) heat treatments that pyro- lyze the biphenyl template create porosity in the film; (2) the volume fraction porosity cor-
99
responds approximately to the volume fraction of the template phase; (3) a continuous micro- porous network is created by template removal (isolated pores would not give rise to a Type 1 isotherm); (4) from the complete N, isotherm we see no evidence of the creation of mesopo- rosity; and (5) the steepness of the CO2 iso- therm and the absence of adsorption within the film at 77 K are both suggestive of very small pores consistent with the removal of the bi- phenyl template ( rP < 0.5 nm). Unfortunately, there is not yet appropriate theory to allow us to calculate the surface area and pore size of the film based on the CO, sorption data.
3.6. Composites
The previous section discussed a composite approach in which pores of controlled size are created by removal of the dispersed organic phase. An alternate composite structure that permits the introduction of pores of a well-con- trolled size is one in which the dispersed phase is itself microporous, for example zeolites [ 401 or imogolites [ 411. The idea is to embed the structurally microporous phase in a dense sol- gel matrix forcing adsorption/transport to oc- cur exclusively within the well-defined channel structures of the crystalline lattice. For exam- ple, by appropriate choice of the zeolite, pore diameters ranging from 0.5 to over 1.2 nm can be obtained.
One example of this approach shown sche- matically in Fig. 17 is a ZSM-5 zeolite/sol-gel composite film deposited on a SAW sensor sur- face by dip-coating a suspension of zeolite mi- crocrystals dispersed within a silica sol. The composite coating was designed to impart chemical selectivity to the device by size exclu- sion or molecular sieving. The frequency shifts of the SAW device when exposed to vapors of methanol, propanol, or iso-octane (0.1% satu- ration at 23 o C ) are listed in Table 4 along with calculated values of the corresponding mass

100 C.J. Brinker et al. /J. Membrane Sci. 94 (1994) 85-102
Fig. 17. Schematic diagram of a sensor prepared from zeo- lite/gel composite deposited on a SAW device. Inset shows idealized cross section of device where (a) are the embed- ded zeolite crystals (ZSM-5, pore size: 5.5x6.0 A’), (b) is the embedding matrix, and (c) is the piezo-electric sub- strate. From Bein et al. [ 401.
TABLE 4
SAW frequency shifts and corresponding mass changes of composite zeolite/silica films deposited on SAW sub- strates and exposed to methanol, ethanol, or iso-octane. Iso-octane, which exhibits a kinetic diameter greater than the zeolite channel dimension, is excluded from the film
Adsorbed species SAW response to vapor
Kinetic Frequency Mass diameter shift
(A)
change (Hz) (ng/cm’ )
Methanol -3.8 -6530 540 Propanol -4.7 - 10200 840 Iso-octane -6.2 74 -6.1
Conditions: vapor, 0.1% saturated; temperature, 23°C; pore size, 5.5X6.0 2. Source: T. Bein, G.C. Frye and C.J. Brinker, J. Am. Chem. Sot., 111 (1989) 7640-7641.
changes. For the molecules methanol and pro- panol whose kinetic diameters are less than the -0.6 nm pore diameter of ZSM-5, we observe a frequency shift of the device that corresponds to an increase in mass consistent with adsorp- tion. For iso-octane, whose kinetic diameter is 0.2 A larger than the pore diameter, there is es- sentially no frequency change. This behavior is consistent with practically complete exclusion of iso-octane from the pore channels. Such ability to discriminate molecules on the basis of size is important to both sensors and mem- branes. The challenge for zeolite-based mem- branes is to achieve both high selectivity and high flux. Using this composite design, high flux
requires large volume fractions of very small zeolite crystals ( ~0.1 mm). High selectivity requires there to be no leaks (for example, be- tween the zeolite and the embedding matrix), while at the same time avoiding pore plugging of the zeolite channel system. This is the sub- ject of current investigations.
4. Conclusions
The sol-gel process affords many strategies for the preparation of inorganic materials with pore sizes in the range appropriate for mem- branes and sensors, and allows thin films to be fabricated using simple procedures. Although the deposition of particulate sols appears well- suited to the preparation of Knudsen mem- branes, problems associated with cracking, phase transitions, and grain growth so far have thwarted attempts to prepare defect-free, sup- ported membranes with the small pore sizes re- quired to achieve molecular sieving. Using po- lymeric sols, the pore size is established by the structure of the gel and its extent of collapse during drying. The gel structure depends on the polymer size, structure (D), and condensation rate. The extent of collapse during drying de- pends on the magnitude of the capillary pres- sure and the strength of the gel network. Under conditions where polymer interpenetration and collapse are promoted, it is possible to create sufficiently small pores that molecular sieving effects are observed. When the capillary pres- sure is minimized by either elimination of sur- face tension or surface modification, little shrinkage occurs, resulting in highly porous aerogels. In order to independently control pore size and pore volume, it is possible to introduce sacrificial organic templates into a sol-gel ma- trix. The oxidative removal of these templates creates pores that appear to reproduce the size and volume fraction of the added template phase. An alternate composite approach to produce microporous films is to embed struc-

C.J. Brinker et al. /J. Membrane Sci. 94 (1994) 85-102
turally microporous templates such as zeolites within a dense sol-gel matrix.
Acknowledgments
Portions of the work were supported by the Electric Power Research Institute, the Na- tional Science Foundation, the Gas Research Institute and the Department of Energy-Mor- gantown Energy Technology Center. In addi- tion, we are grateful to T.J. Headley of Sandia National Laboratories for the TEM sample preparation and analysis. Sandia National Laboratories is a U.S. Department of Energy facility supported by DOE Contract Number DE-AC04-76-DP00789.
References
A.J. Burggraaf, J. Charpin and L. Cot (Eds.), Inor- ganic Membranes, ICIMx-91, Trans Tech Publica- tions, Zurich, 1991. C.J. Brinker and G.W. Scherer, Sol-Gel Science, Ac- ademic Press, San Diego, 1990. J. Livage, M. Henry and C. Sanchez, Sol-gel chemis- try of transition metal oxides, Prog. Solid State Chem., 18(1988)259-342. J.L. Hall, W.E. Dean and E.A. Pacofsky, Metal che- lates of alkanol-substituted amines, J. Am. Chem. Sot., 82 (1960) 3303. Y. Takahashi and Y. Wada, Dip-coating of Sb-doped SnOx films by ethanolamine-alkoxide method, J. Electrochem. Sot., 137 (1990) 267-272. R.K. Iler, The Chemistry of Silica, Wiley, New York, 1978. B.K. Coltrain, S.M. Melpolder and J.M. Salva, Effect of hydrogen ion concentration on gelation of tetra- functional silicate sol-gel systems, in D.R. Uhlmann and D.R. Ulrich (Eds.), Ultrastructure Processing of Advanced Materials, Wiley, New York, 1992, pp. 69- 76. L.W. Kelts and N.J. Armstrong, Molecular building blocks in low pH silicon sol-gels: A silicon-29 NMR study, Mater. Res. Sot. Symp. Proc., 121 (1988) 519. J.L. Lippert, S.B. Melpolder and L.W. Kelts, Raman spectroscopic determination of the pH dependence of intermediates in sol-gel silicate formation, J. Non- Cryst. Solids, 104 (1988) 139-147.
10
11
12
13
14
15
16
17
18
19
20
21
22
23
24
25
26
27
101
L.W. Kelts, N.J. Effinger and S.M. Melpolder, Sol-gel chemistry studied by ‘H and *‘Si nuclear magnetic resonance, J. Non-Cryst. Solids, 83 (1986) 353-374. J.E. Martin and A.J. Hurd, Scattering from fractals, J. Appl. Cryst., 20 (1987) 61-78. D.W. Schaefer, Fractal models and the structure of materials, MRS Bull., 13 (1988) 22-27. D.W. Schaefer and K.D. Keefer, Structure of random silicates: polymers, colloids and porous solids, in L. Pietronero and E. Tosatti (Eds. ) , Fractals in Physics, North-Holland, Amsterdam, 1986, pp. 39-45. P. Meakin, Formation of fractal clusters and networks by irreversible diffusion-limited aggregation, Phys. Rev. L&t., 51 (1983) 1119. B.B. Mandelbrot, The Fractal Geometry of Nature, Freeman, San Francisco, 1982. C.J. Brinker, A.J. Hurd, P.R. Schunk, G.C. Frye and C.S. Ashley, Review of sol-gel thin film formation, J. Non-Cryst. Solids, 147/148 (1992) 424-436. G.W. Scherer, Recent progress in drying of gels, J. Non-Cryst. Solids, 147/148 (1992) 363-374. G.W. Scherer, Theory of drying, J. Am. Ceram. sot., 73 (1990) 3-14. A.F.M. Leenars, K. Keizer and A.J. Burggraaf, The preparation and characterization of alumina mem- branes with ultra-fine pores, Part 1: Microstructural investigations on non-supported membranes, J. Ma- ter. Sci., 10 (1984) 1077-1088. A. Larbot, J.A. Alary, J.P. Babre, C. Guixard and L. Cot, Microporous layers from sol-gel techniques, Ma- ter. Res. Sot. Symp. Proc., 73 (1986) 659. M.A. Anderson, M.J. Gieselman and Q. Xu, Titania and alumina ceramic membranes, J. Membrane Sci., 39 (1988) 243-258. C. Sanchez and M. In, Molecular design of alkoxide precursors for the synthesis of hybrid organic-inor- ganic gels, J. Non-Cryst. Solids, 147/148 (1992) l- 12. G.D. Parfitt, Fundamental aspects of dispersion, Dis- persion of Powders in Liquids, 3rd edn., Applied Sci- ence, London, 1981, pp. l-50. S.G. Kroll, The origin of residual internal stress in solvent-cast thermoplastic coatings, J. Appl. Polym. Sci., 23 (1979) 847. T.J. Garino, Patterning, Drying, Sintering of Particle Films on Rigid Substrates, Ph.D. Dissertation, MIT, Cambridge, MA, 1986. B.E. Yoldas, A transparent porous alumina, Am. Ce- ram. Sot. Bull., 54 (1975) 286-288. D.L. Logan, C.S. Ashley and C.J. Brinker, Sol-gel films with tailored microstructures, Mater. Res. Sot. Symp. Proc., 271 (1992) 541-546.
102 C.J. Brinker et al. /J. Membrane Sci. 94 (1994) 85-102
28 B.B. Mandelbrot, Fractals, Form, and Chance, Free- man, San Francisco, 1977.
29 C.J. Brinker, T.L. Ward, R. Sehgal, N.K. Raman, S.L. Hietala, D.M. Smith, D.-W. Hua and T.J. Headley, Ultramicroporous silica-based supported inorganic membranes, J. Membrane Sci, 77 (1993) 165-179.
30 R. Sehgal, Preparation and Characterization of Ultra- thin Sol-Gel Derived Silica Membranes for Gas Sep- aration Applications, M.S. Thesis, UNM, Albuquer- que, NM, 1993.
31 D.E. Fain, Technical and economic aspects and pros- pects for gas separation with inorganic membranes, Key Eng. Mater., 61/62 (1991) 327-336.
32 R. Deshpande, D.-W. Hua, D.M. Smith and C.J. Brinker, Pore structure evolution in silica gel during aging/drying: III. Effects of surface tension, J. Non- Cryst. Solids, 144 (1992) 32-44.
33 D.M. Smith, R. Deshpande and C.J. Brinker, Prepa- ration of low-density aerogels at ambient pressure, Mater. Res. Sot. Symp. Proc., 271 (1992) 567-572.
34 R. Deshpande, D.M. Smith and C.J. Brinker, Prepa- ration of high porosity xerogels by chemical surface modification, U.S. Patent Appl., June 1991.
35 F. Nishida, B. Dunn, J.M. McKiernan, J.I. Zink, A.J. Hurd and C.J. Brinker, In situ fluorescence imaging
of sol-gel thin film deposition, J. Sol-Gel Sci. Tech., (1993) in press.
36
37
38
D.A. Loy, R.J. Buss, R.A. Assink, G. Beaucage, K.J. Shea and H. Oviatt, Porous materials by design. Plasma oxidation of hydrocarbon templates in poly- silsesquoxanes., Polym. Prepr. Am. Chem. Sot. Div. Polym. Chem., 34 (1993) 244-245. K.J. Shea and D.Y. Sasaki, On the control of microen- vironment shape of functionalized network polymers prepared by template polymerization, J. Am. Chem. Sot., 111 (1989) 3442-3444. K.J. Shea, D.A. Loy and 0. Webster, Arylsilsesquiox- ane gels and related materials. New hybrid of organic and inorganic networks, J. Am. Chem. Sot., 114 (1992) 3700-6710.
39
40
41
G.C. Frye, A.J. Ricco, S.J. Martin and C.J. Brinker, Characterization of the surface area and porosity of sol-gel films using SAW devices, Mater. Res. Sot. Symp. Proc., 121 (1988) 349-354. T. Bein, K. Brown, G.C. Frye and C.J. Brinker, Mo- lecular Sieve sensors for selective detection at nano- gram level, J. Am. Chem. Sot., 111 (1989) 7640-7641. V.C. Farmer, M.J. Adams, A.R. Fraser and F. Palmi- eri, Synthetic imogolite: properties, synthesis, and possible applications, Clay Miner., 18 (1983) 459-472.