Embed Size (px)
Citation preview
3/8/2017
1
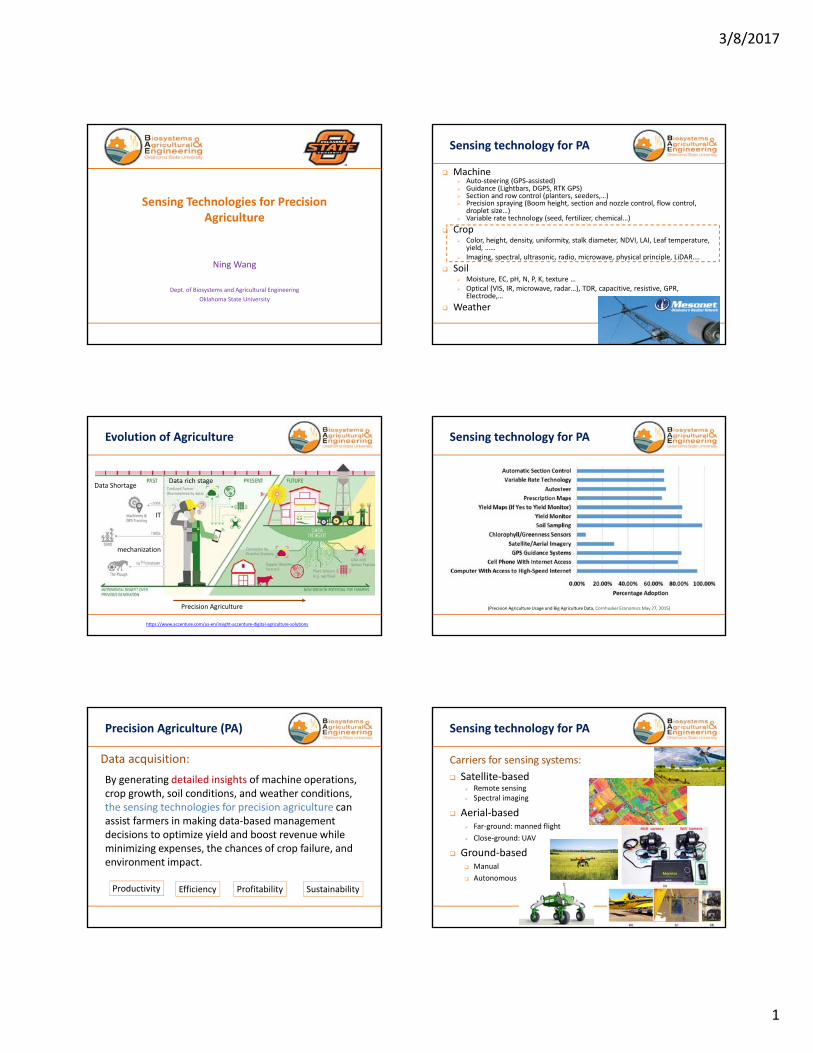
Ning Wang
Dept. of Biosystems and Agricultural Engineering
Oklahoma State University
Sensing Technologies for Precision Agriculture
Evolution of Agriculture
https://www.accenture.com/us‐en/insight‐accenture‐digital‐agriculture‐solutions
mechanization
IT
Data ShortageData rich stage
Precision Agriculture
Precision Agriculture (PA)
By generating detailed insights of machine operations, crop growth, soil conditions, and weather conditions, the sensing technologies for precision agriculture can assist farmers in making data‐based management decisions to optimize yield and boost revenue while minimizing expenses, the chances of crop failure, and environment impact.
Productivity Efficiency Profitability Sustainability
Data acquisition:
Sensing technology for PA
Machine Auto‐steering (GPS‐assisted) Guidance (Lightbars, DGPS, RTK GPS) Section and row control (planters, seeders,…) Precision spraying (Boom height, section and nozzle control, flow control,
droplet size…) Variable rate technology (seed, fertilizer, chemical…)
Crop Color, height, density, uniformity, stalk diameter, NDVI, LAI, Leaf temperature,
yield, …… Imaging, spectral, ultrasonic, radio, microwave, physical principle, LiDAR….
Soil Moisture, EC, pH, N, P, K, texture … Optical (VIS, IR, microwave, radar…), TDR, capacitive, resistive, GPR,
Electrode,…
Weather
Sensing technology for PA
(Precision Agriculture Usage and Big Agriculture Data, Cornhusker Economics May 27, 2015)
Carriers for sensing systems:
Satellite‐based Remote sensing Spectral imaging
Aerial‐based Far‐ground: manned flight
Close‐ground: UAV
Ground‐based Manual
Autonomous
Sensing technology for PA
3/8/2017
2
Sensing technology for PA
Applications
In‐field crop production
Speed, Portability, Robustness
Cost
Off‐line for crop production
Accuracy, time
Breeding (small plot, high accuracy, high throughput)
Phenotyping systemo Speed, high accuracy, repeatability, tolerance of interference…
o Multi‐sensor fusion, data integration, data interpretation…
Research Projects
• Precision Agriculture Application– By‐plant sensing and control (Ground sensing)
– UAV (preliminary)– Crop characteristics
• Wireless sensor network (WSN) applications– Precision agriculture – Environmental monitoring – Precision livestock – Study on critical issues on WSN applications
• Food Security– Animal Behavior monitoring (Precision Livestock)– Sensor and control systems for phenotyping applications
• Food Safety– Hand Hygiene Compliance
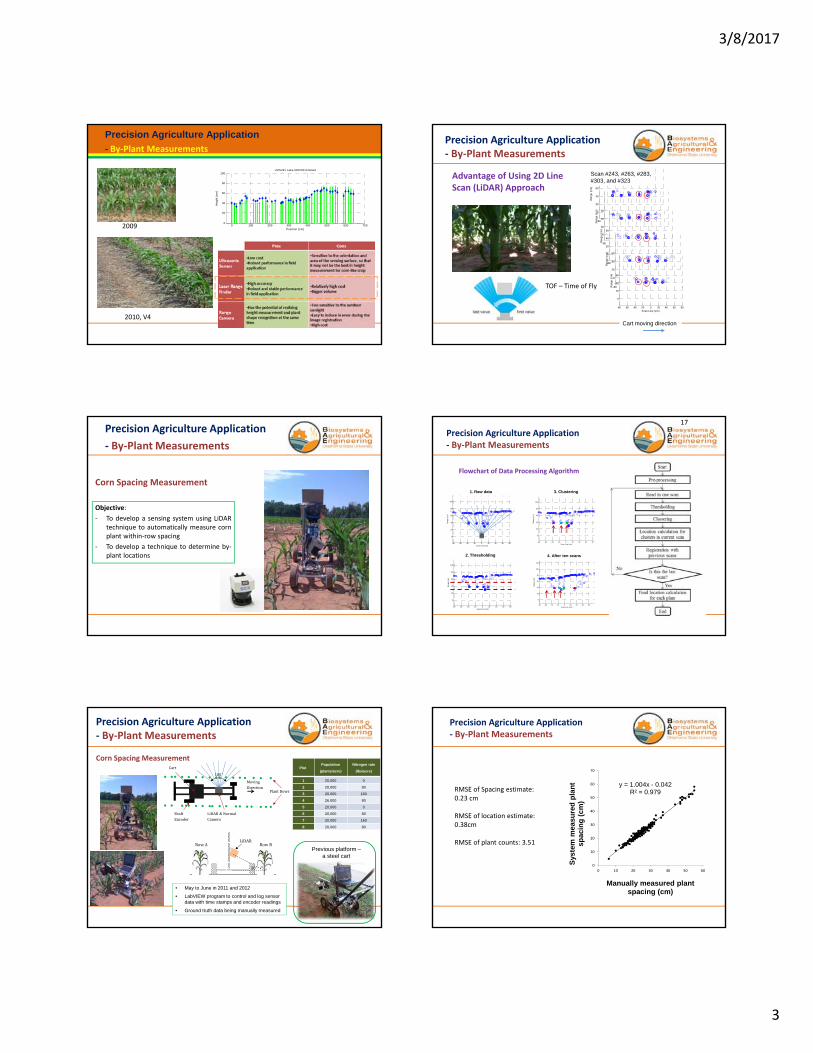
NDVI and plant height is a good predictor of in‐season corn forage biomass and forage yield
Stock diameter is another useful indicator of plant growth and health situation.
Precision Agriculture Application
‐ By‐Plant Measurements
Traditional single-rate N application causes 33% of nitrogen use efficiency (NUE) in world cereal production
A 1% increase of NUE worldwide could save $234,658,462
Research shows that yield of crop is varied by plant.
http://nue.okstate.edu/Index_Resolution.htm
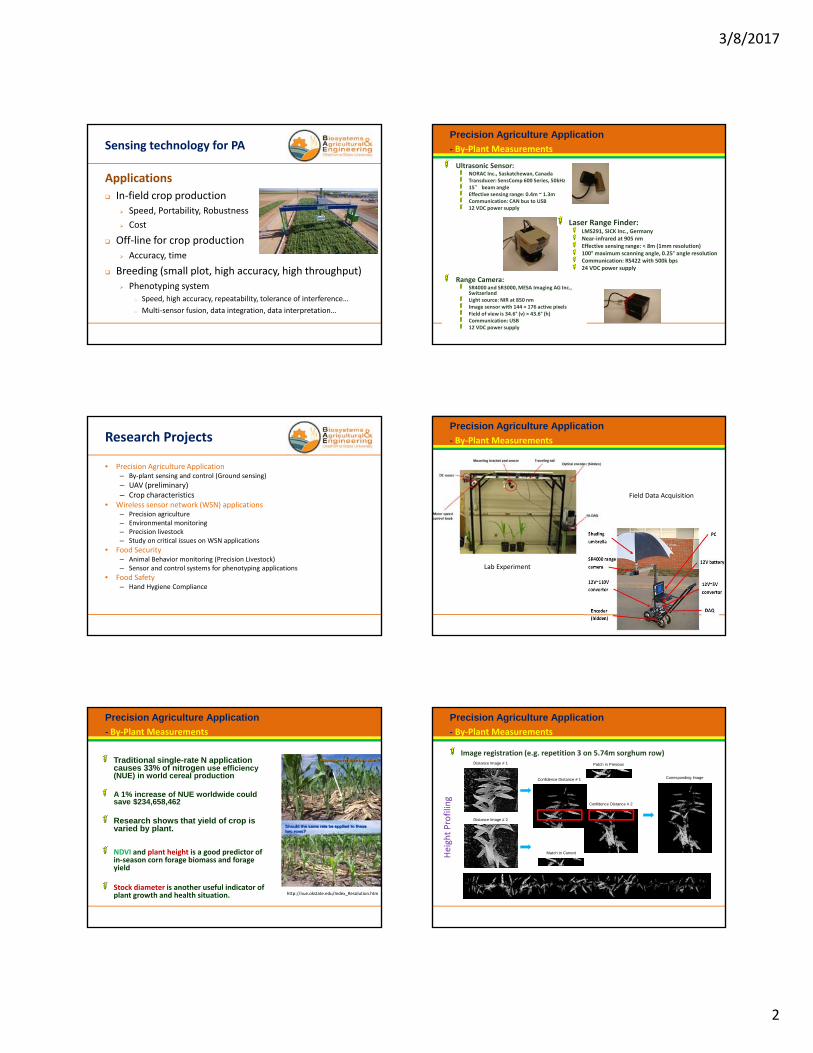
Ultrasonic Sensor:NORAC Inc., Saskatchewan, CanadaTransducer: SensComp 600 Series, 50kHz15° beam angleEffective sensing range: 0.4m ~ 1.3mCommunication: CAN bus to USB12 VDC power supply
Laser Range Finder:LMS291, SICK Inc., GermanyNear‐infrared at 905 nmEffective sensing range: < 8m (1mm resolution)100° maximum scanning angle, 0.25° angle resolutionCommunication: RS422 with 500k bps24 VDC power supply
Range Camera:SR4000 and SR3000, MESA Imaging AG Inc., SwitzerlandLight source: NIR at 850 nmImage sensor with 144 × 176 active pixelsField of view is 34.6° (v) × 43.6° (h)Communication: USB12 VDC power supply
Precision Agriculture Application
‐ By‐Plant Measurements
Lab Experiment
Field Data Acquisition
Precision Agriculture Application
‐ By‐Plant Measurements
Image registration (e.g. repetition 3 on 5.74m sorghum row)Distance Image # 1
Distance Image # 2
Match in Current
Patch in Previous
Corresponding ImageConfidence Distance # 1
Confidence Distance # 2
Precision Agriculture Application
‐ By‐Plant Measurements
Height Profiling
3/8/2017
3
2009
2010, V4
0 100 200 300 400 500 600 7000
20
40
60
80
100
Position (cm)
Hei
ght
(cm
)
LMS291 Lake 06222010 Row4
Precision Agriculture Application
‐ By‐Plant Measurements
Precision Agriculture Application
‐ By‐Plant Measurements
Objective:
‐ To develop a sensing system using LiDARtechnique to automatically measure cornplant within‐row spacing
‐ To develop a technique to determine by‐plant locations
Corn Spacing Measurement
Precision Agriculture Application‐ By‐Plant Measurements
PlotPopulation
(plants/acre)
Nitrogen rate
(lbs/acre)
1 20,000 0
2 20,000 80
3 20,000 160
4 26,000 80
5 20,000 0
6 20,000 80
7 20,000 160
8 26,000 80
LiDAR &NormalCamera
ShaftEncoder
Cart
PlantRows
MovingDirection
100°
RowA RowB
30°
LiDAR
Previous platform –a steel cart
• May to June in 2011 and 2012
• LabVIEW program to control and log sensor data with time stamps and encoder readings
• Ground truth data being manually measured
Corn Spacing Measurement
Advantage of Using 2D Line Scan (LiDAR) Approach
-80 -60 -40 -20 0 20 40 60 80
0
20
40
60
Scan Line (cm)
Ran
ge (
cm)
-80 -60 -40 -20 0 20 40 60 80
0
20
40
60
Scan Line (cm)
Ran
ge (
cm)
-80 -60 -40 -20 0 20 40 60 80
0
20
40
60
Scan Line (cm)
Ran
ge (
cm)
-80 -60 -40 -20 0 20 40 60 80
0
20
40
60
Scan Line (cm)
Ran
ge (
cm)
-80 -60 -40 -20 0 20 40 60 80
0
20
40
60
Scan Line (cm)
Ran
ge (
cm)
Scan #243, #263, #283, #303, and #323
Cart moving direction
Precision Agriculture Application‐ By‐Plant Measurements
TOF – Time of Fly
Precision Agriculture Application‐ By‐Plant Measurements
17
-80 -60 -40 -20 0 20 40 60 80
0
20
40
60
80
100
Scan Line (cm)
Ran
ge (
cm)
Copyof601
1.xlsx scan # 1281. Raw data
-80 -60 -40 -20 0 20 40 60 80
0
20
40
60
80
100
Scan Line (cm)
Ran
ge (
cm)
Copyof601
1.xlsx scan # 1282. Thresholding
-80 -60 -40 -20 0 20 40 60 80
0
20
40
60
80
100
Scan Line (cm)
Ran
ge
(cm
)
Copyof601
1.xlsx scan # 128
3. Clustering
-80 -60 -40 -20 0 20 40 60 80
0
20
40
60
80
100
120
Scan Line (cm)
Ran
ge
(cm
)
Copyof601
1.xlsx scan # 1384. After ten scans
Flowchart of Data Processing Algorithm
Precision Agriculture Application‐ By‐Plant Measurements
y = 1.004x - 0.042R² = 0.979
0
10
20
30
40
50
60
70
0 10 20 30 40 50 60
Sys
tem
mea
sure
d p
lan
t sp
acin
g (
cm)
Manually measured plant spacing (cm)
RMSE of Spacing estimate: 0.23 cm
RMSE of location estimate: 0.38cm
RMSE of plant counts: 3.51
3/8/2017
4
Precision Agriculture Application‐ By‐Plant Measurements
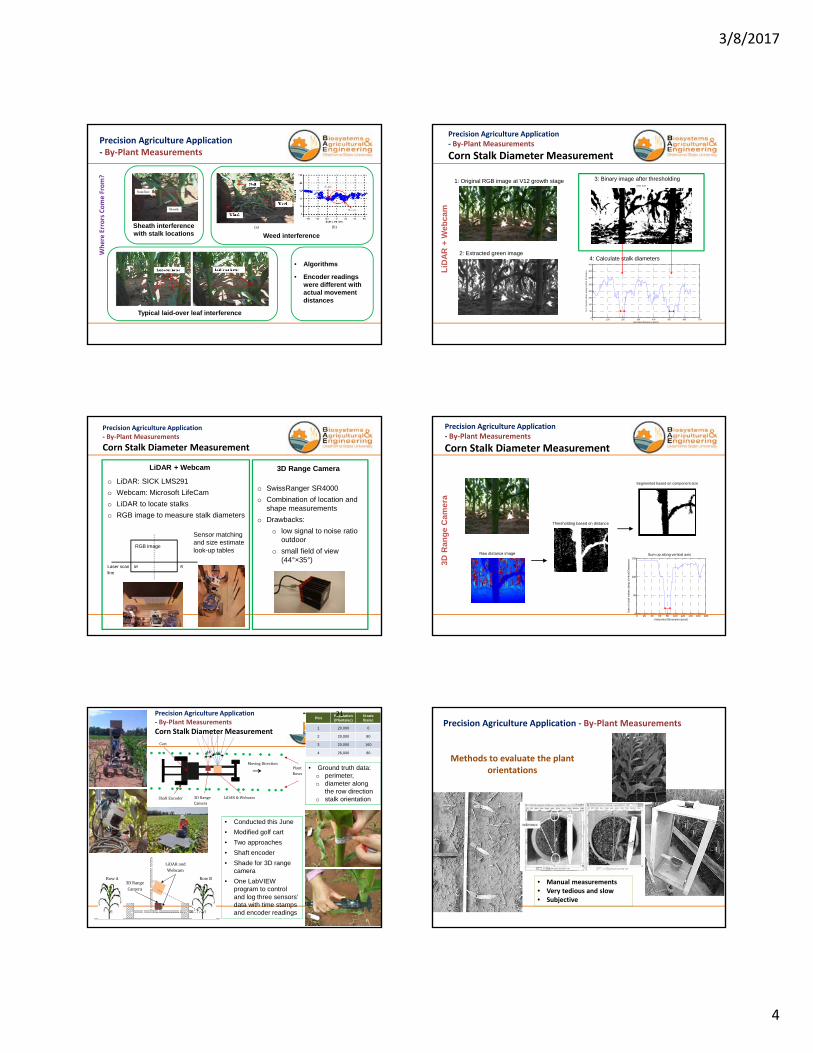
Sheath interference with stalk locations Weed interference
(a) (b)
Typical laid-over leaf interference
• Algorithms
• Encoder readings were different with actual movement distances
Where Errors Come From?
Precision Agriculture Application‐ By‐Plant Measurements
Corn Stalk Diameter Measurement
LiDAR + Webcam 3D Range Camera
Laser scan line
RGB image
M N
Sensor matching and size estimate look-up tables
o LiDAR: SICK LMS291
o Webcam: Microsoft LifeCam
o LiDAR to locate stalks
o RGB image to measure stalk diameters
o SwissRanger SR4000
o Combination of location and shape measurements
o Drawbacks:
o low signal to noise ratio outdoor
o small field of view (44°×35°)
PlotPopulation (Plants/ac)
N-rate lbs/ac
1 20,000 0
2 20,000 80
3 20,000 160
4 26,000 80
Precision Agriculture Application‐ By‐Plant Measurements
Corn Stalk Diameter Measurement
3/8/2017 21
LiDAR &WebcamShaftEncoder
Cart
PlantRows
MovingDirection
3DRangeCamera
60°44°
RowA RowB
30°
LiDAR andWebcam
3DRangeCamera
• Ground truth data: o perimeter, o diameter along
the row direction o stalk orientation
• Conducted this June
• Modified golf cart
• Two approaches
• Shaft encoder
• Shade for 3D range camera
• One LabVIEW program to control and log three sensors’ data with time stamps and encoder readings
Precision Agriculture Application‐ By‐Plant Measurements
Corn Stalk Diameter Measurement
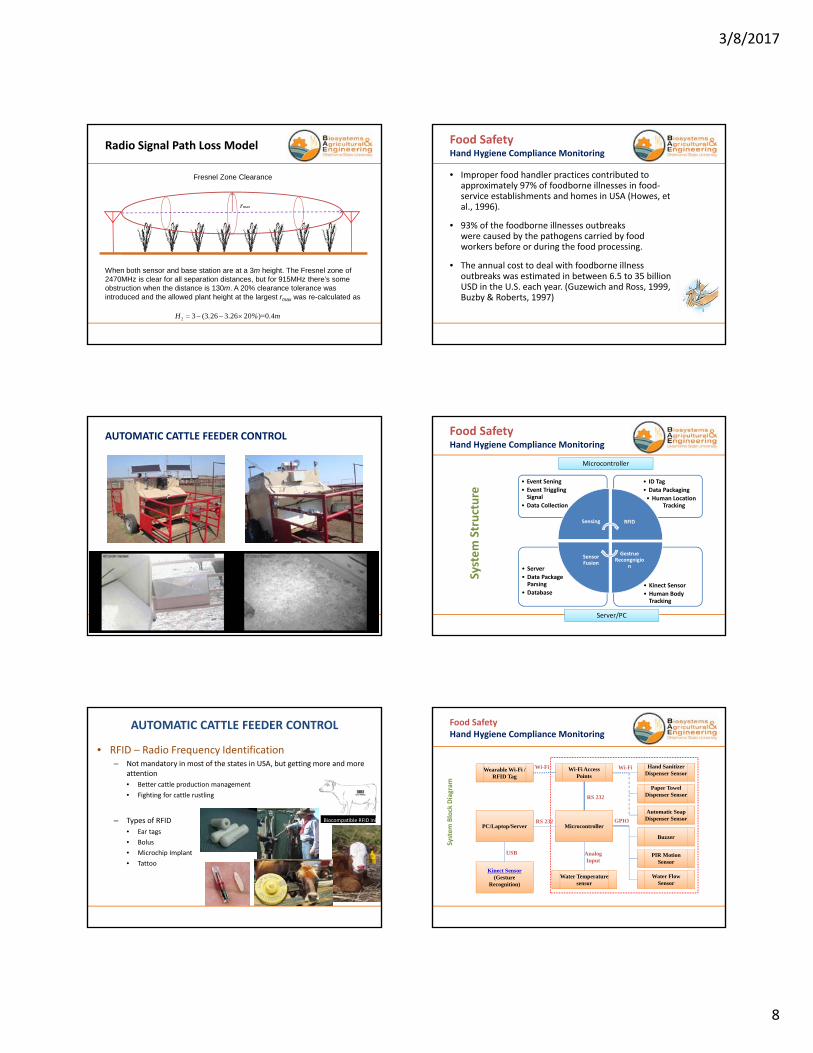
1: Original RGB image at V12 growth stage
Green layer2: Extracted green image
0 100 200 300 400 500 600 7000
50
100
150
200
250
300
350
400Sum of binary values along vertical axis
Horizontal Dimension (pixel)
Sum
of
pixe
l val
ues
alon
g V
ertic
al D
imen
sion
4: Calculate stalk diameters
thres 0.25
3: Binary image after thresholding
LiD
AR
+ W
ebca
m
Precision Agriculture Application‐ By‐Plant Measurements
Corn Stalk Diameter Measurement
Raw distance image
Thresholding based on distance
Segmented based on component size
0 20 40 60 80 100 120 140 160 1800
50
100
150Sum of binary values along vertical axis
Horizontal Dimension (pixel)
Sum
of
pixe
l val
ues
alon
g V
ertic
al D
imen
sion
Sum up along vertical axis
3D R
ang
e C
ame
ra
Precision Agriculture Application ‐ By‐Plant Measurements
Methods to evaluate the plant orientations
• Manual measurements• Very tedious and slow• Subjective

3/8/2017
5
Principles of leaf
orientation extraction process
Original picture Plant
identification
Regression analysis
Calculation of leaf orientation
Results:
Orientation = 51°
R2 = 0.78
Precision Agriculture Application
‐ By‐Plant Measurements
Evaluation leaf orientation
Precision Agriculture Application
‐ By‐Plant Measurements
Evaluation leaf orientations
Peanut Plant Canopy Characterization
Breeding process needs high‐throughput field sensing to assess plant traits for growth, tolerance, resistance, yield canopy profile, plant coverage, compactness, stem diameter, height, width; color, leaf area index, leaf angle; chlorophyll content, temperature, humidity
Automatic sensing greatly accelerates breeding evaluation process
Peanut Plant Canopy Characterization
Peanut Growth habits
Canopy traits such as density and upright growth habit contribute to host resistance by creating environments less conducive to disease or by reducing opportunities for contact with infested soil.
SWR G04
Peanut Plant Canopy Characterization
Bermudagrass Phenotyping

3/8/2017
6
Guide to NTEP Turfgrass Ratings
Trait Criteria (rating from 1 – 9 in visual inspection by trained evaluator)
3D Imaging ?
Measuredvalue
Genetic Color 1‐ light green; 9‐ dark green Y Color
Winter Color 1 ‐ straw brown or no color retention; 9 ‐ dark green Y Color
Spring Greenup 1‐ straw brown; 9‐completely green. Y Color
Leaf Texture 1 – coarse; 9 – fine Possible Color
Density and vertical growth 1 – min density; 9 ‐max density Y Color, Height
Living Ground Cover and vertical growth
surface area covered by the originally planted species Y Color, Height
Seedling Vigor/Establishment and vertical growth
1 – min vigor; 9 – max vigor Y Color, Height, Cover
Disease or Insect Damage 1 ‐ no resistance or 100% injury; 9 ‐ complete resistance or no injury Possible Color
Drought Tolerance 1‐ complete wilting, 100% leaf firing, complete dormancy or no plant recovery; 9 ‐ no wilting, no leaf firing, 100% greenno dormancy, or 100% recovery.
Possible Color
Frost Tolerance 1 ‐ 100% leaf injury; 9 ‐ no injury. Possible Color
Traffic Tolerance 1 ‐ no tolerance or 100% injury; 9 ‐ completetolerance or no injury
Possible Color
Thatch Accumulation Measured values Possible Color
Seedhead 1‐ max seedhead; 9‐ no seedheads. Possible Color
Mowing Quality 1 ‐ poorest mowing quality/most steminess and 9 ‐ cleanest cut /no steaminess
Possible Color
Sensor– Microsoft Kinect for Windows V2
• RGB images
• Infrared images
• Depth images (distance)
Software– A Visual Studio program to capture RGB,
infrared and depth images.
– A set of MATLAB scripts to extract useful information related to plant characteristics from the collected images.
• Moving platform– Movable carts for taking images in the field
Kinect v2 ($150)
Bermudagrass Phenotyping
Parameter to be extracted from collected:
RGB images: 2448 x 3264
‐ Size (green area in an image)
‐ Color (levels of greenness)
Depth images: 512 x 424
‐ Height
‐ Uniformity (smoothness)
Bermudagrass Phenotyping
Plant Color
Plant height
Bermudagrass Phenotyping
• UAV for a large scale scouting (12/03/2015)
190 175 230 255 185 235
255 224 232 187 183 220
235 189 152 162 217235
226 218 253 235 241 215
213
255
Green values
UAV can be used as a platform to provide a large scale scouting and comparison.
Bermudagrass Phenotyping
植物根系的无损检测
USDA ARS – Lubbock, TX
Long‐term soil C storage increase crop root input and/or rooting depth enhance root phenotype

3/8/2017
7
Research on WSN
First generation of WSN (2007‐2008)
•Soil Moisture monitoring
•Tmote system
Second generation of WSN (2008‐2010)
•Soil property monitoring (Soil MC, EC, Temp)
•Crossbow system
Wireless camera sensor network (2008‐2013)
•Pecan weevil population monitoring
•Janic system
Radio propagation model for WSN used in crop field (2009‐2013)
•Second generation WSN
•Wheat field
Cattle monitoring (2005‐2013)
•Grazing activity
Sediment monitoring (2008‐2013)
•Collaboration with KSU
•Webserver and database
Soil Moisture Monitoring System
Structure:Star-topology with 10 Sensor Nodes, one Central Node and one Base Node
First Generation
Second Generation
The WSN Conceptual ModelThe WSN Conceptual Model
INSECT MONITORING
OSU OSU Fact Sheet EPP-7190
Autonomous monitoring has potential to cut significant time and expense for growers.
INSECT MONITORING
Radio Signal Path Loss Model
Transmitter ReceiverRadio wave
hthr
hp
d
Sketch map of plant influences on radio wave propagation inside wheat field, ht and hr are transmitter and receiver height, hp is plant
height and d is the separation distance
In the field, wheat canopy is the major reflection surface and obstacle along the transmission path, attenuation introduces by plant height
3/8/2017
8
Radio Signal Path Loss Model
rmax
Fresnel Zone Clearance
When both sensor and base station are at a 3m height. The Fresnel zone of 2470MHz is clear for all separation distances, but for 915MHz there’s some obstruction when the distance is 130m. A 20% clearance tolerance was introduced and the allowed plant height at the largest rmax was re-calculated as
2 3 (3 26 3 26 20 )=0.4H . . % m
AUTOMATIC CATTLE FEEDER CONTROL
AUTOMATIC CATTLE FEEDER CONTROL
• RFID – Radio Frequency Identification– Not mandatory in most of the states in USA, but getting more and more
attention
• Better cattle production management
• Fighting for cattle rustling
– Types of RFID
• Ear tags
• Bolus
• Microchip Implant
• Tattoo
Biocompatible RFID ink
• Improper food handler practices contributed to approximately 97% of foodborne illnesses in food‐service establishments and homes in USA (Howes, et al., 1996).
• 93% of the foodborne illnesses outbreaks were caused by the pathogens carried by food workers before or during the food processing.
• The annual cost to deal with foodborne illness outbreaks was estimated in between 6.5 to 35 billion USD in the U.S. each year. (Guzewich and Ross, 1999, Buzby & Roberts, 1997)
Food SafetyHand Hygiene Compliance Monitoring
Food SafetyHand Hygiene Compliance Monitoring
System Structure
• Kinect Sensor
• Human Body Tracking
• Server
• Data Package Parsing
• Database
• ID Tag
• Data Packaging
• Human Location Tracking
• Event Sening
• Event TrigglingSignal
• Data Collection
Sensing RFID
Gestrue Recongnigio
n
Sensor Fusion
MicrocontrollerMicrocontroller
Server/PCServer/PC
Food SafetyHand Hygiene Compliance Monitoring
MicrocontrollerMicrocontroller
Paper Towel Dispenser Sensor
Paper Towel Dispenser Sensor
Automatic Soap Dispenser SensorAutomatic Soap Dispenser Sensor
Water Temperature sensor
Water Temperature sensor
BuzzerBuzzer
Wi-Fi Access Points
Wi-Fi Access Points
Wearable Wi-Fi / RFID Tag
Wearable Wi-Fi / RFID Tag
PIR Motion Sensor
PIR Motion Sensor
Water Flow Sensor
Water Flow Sensor
Hand Sanitizer Dispenser SensorHand Sanitizer
Dispenser Sensor
Kinect Sensor(Gesture
Recognition)
Kinect Sensor(Gesture
Recognition)
PC/Laptop/ServerPC/Laptop/Server
RS 232
RS 232
USB AnalogInput
GPIO
Wi-FiWi-Fi
System
Block Diagram
3/8/2017
9
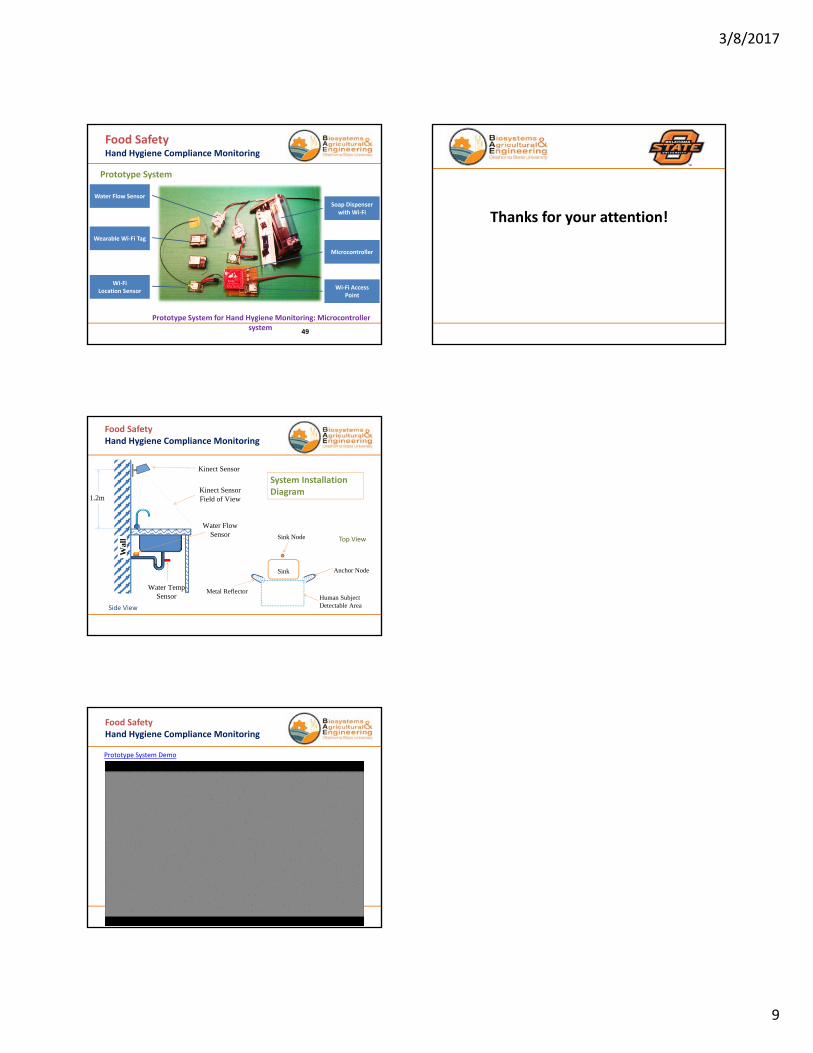
Prototype System
49
Prototype System for Hand Hygiene Monitoring: Microcontroller system
Soap Dispenser with Wi‐Fi
Microcontroller
Wi‐Fi Access Point
Wi‐Fi Location Sensor
Wearable Wi‐Fi Tag
Water Flow Sensor
Food SafetyHand Hygiene Compliance Monitoring
Food SafetyHand Hygiene Compliance Monitoring
Kinect Sensor
Kinect Sensor Field of View1.2m
Wal
l
Water Temp Sensor
Water FlowSensor
Sink Anchor Node
Metal Reflector
Sink Node
Human Subject Detectable Area Side View
Top View
System Installation Diagram
Food SafetyHand Hygiene Compliance Monitoring
Prototype System Demo
Thanks for your attention!