Embed Size (px)
Citation preview
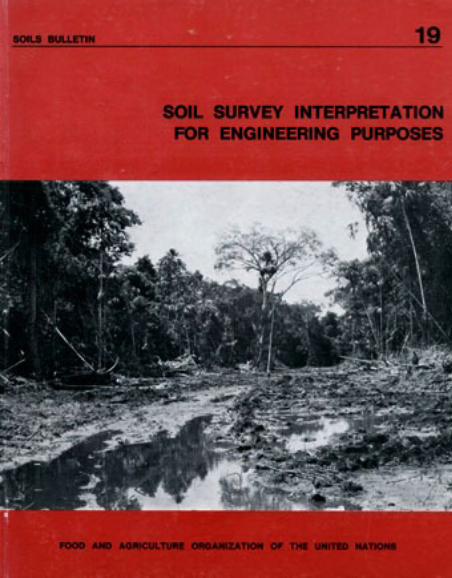
SOIL SURVEY INTERPRETATIONFOR ENGINEERING PURPOSES
Mt 111161616iiM
-111 7,11.111F000 ILKO ALOMICULTWIE ONOALINZATION 09 TSB UNITED NATIONS
SOIL3 BULLETIN 19
Acknowledgement
This document was prepared by Dr. Gerald W. Olson, AssoniateProfessor of Soil Science, Cornell University, in the course of aconsultant assignment to the Soil Institute, Teheran, Iran, whichhe undertook on behalf of the Food and Agriculture Organization ofthe United Nations. Appreciative acknowledgement is made of theextent to which the present document has been permitted to draw uponthe valuable publications prepared by the Soil Survey Staff of theSoil Conservation Service of the Department of Agriculture of theUnited States of America and, in particular, upon their publication"Guide for Interpreting Engineering Uses of Soils" (1971). Alsoacknowledged is the contribution of Professor Olson's Iranian colleagueswho in discussions guided him in the selection of material for thisdocument.
TABLE OF CONTENTS
Page
LIST OF FIGURES vi
LIST OF TABLES vi
INTRODUCTION 1
LIQUID LIMIT OF SOIL 2
PLASTIC LIMIT OF SOIL 3
PLASTICITY INDEX OF SOIL 4
UNIFIED SOIL CLASSIFICATION SYSTEM 4
RATINGS OF SOILS FOR DIFFERENT USES 9
AGGREGATE SOIL MATERIAL 10
SECONDARY ROADS ON SOILS11
BUILDING FOUNDATIONS IN SOILS 13
HUMAN WASTE DISPOSAL IN SOILS 15
TRANSPORTE!) PLANT MEDIUM (ARTIFICIAL SOIL) 17
SHRINK-SWELL POTENTIAL OF SOILS18
EMBANKMENTS OF SOIL MATERIALS19
CONCRETE DETERIORATION IN SOILS20
UNCOATED STEEL CORROSIVITY IN SOILS21
IRRIGATION OF SOILS22
DRAINAGE OF SOILS23
RECOMMENDATIONS23
24REFERENCES

LIST OF FIGURES
Abstract of Title
Figure 1. Comparison of particle sizes of soils in pedological andengineering systems
Figure 2. Groupings of soils in unified system, liquid limit, and 9
plasticity index
LIST OF TABLES
Abstract of Title
Table 1. Percentage of soil material passing specified sieve sizes 8
Table 2. Typical names and symbols of the unified soil classification system 9
Table 3. Soil ratings and properties for engineering uses 10
Table 4. Ratings of %oils as sources of aggregate material 12
Table 5. Ratings of soils for secondary roads 14
Table 6. Ratings of soils for buildings 15-16
Table 7. Ratings of soils for human waste disposal 18
Table 8. Ratings of disturbed soils for growing plants 19
Table 9. Characteristics of soil materials for embankments 22
Page
7
INTRODUCTION
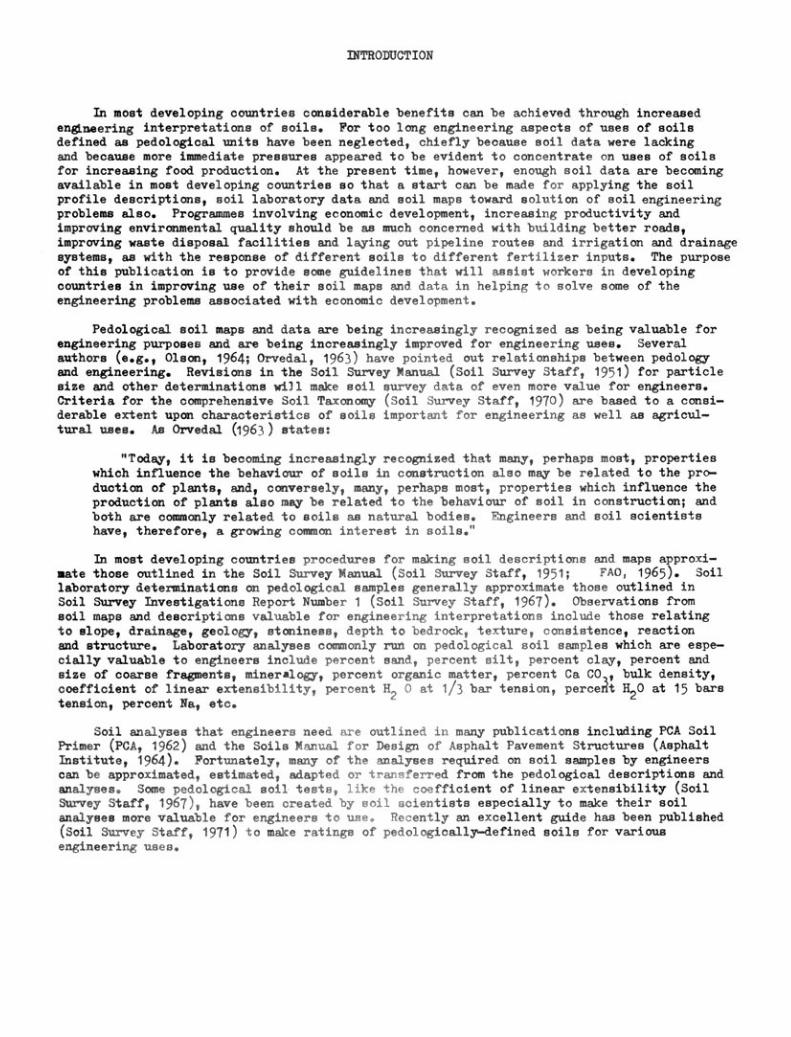
In most developing countries considerable benefite can be achieved through increasedengineering interpretations of soils. Por too long engineering aspects of uses of soiledefined as pedological units have been neglected, chiefly because soil data were lackingand because more immediate pressures appeared to be evident to concentrate on uses of soilsfor increasing food production. At the present time, however, enough soil data are becomingavailable in most developing countries so that a start can be made for applying the soilprofile descriptions, soil laboratory data and soil mapa toward solution of soil engineeringproblems also. Programmes involving economic development, increasing productivity andimproving environmental quality should be as much concerned with building better roads,improving waste disposal facilities and laying out pipeline routes and irrigation and drainagesystems, as with the response of different soils to different fertilizer inputs. The purposeof this publication is to provide some guidelines that will assist workers in developingcountries in improving use of their soil maim and data in helping to solve some of theengineering problems associated with economic development.
Pedological soil maps and data are being increasingly recognized as being valuable forengineering purposes and are being increasingly improved for engineering uses. Severalauthors (e.g., Olson, 1964; Orvedal, 1963) have pointed out relationships between pedologyand engineering. Revisions in the Soil Survey Manual (Soil Survey Staff, 1951) for particlesize and other determinations will make soil survey data of even more value for engineers.Criteria for the comprehensive Soil Taxonomy (Soil Survey Staff, 1970) are based to a consi-derable extent upon characteristics of eoils important for engineering as well as agricul-tural uses. As Orvedal (1963) states:
"Today, it is becoming increasingly recognized that many, perhaps most, propertieswhich influence the behaviour of soils in construction also may be related to the pro-duction of plants, and, conversely, many, perhaps most, properties which influence theproduction of plants also may be related to the behaviour of soil in construction; andboth are commonly related to soils as natural bodies. Engineers and soil scientistshave, therefore, a growing common interest in soils."
In most developing countries procedures for making soil descriptions and maps approxi-mate those autlined in the Soil Survey Manual (Soil Survey Staff, 1951; FAO, 1965). Soil
laboratory determinations an pedological samplee generally approximate those outlined inSoil Survey Investigation° Report Number 1 (Soil Survey Staff, 1967). Observations fromsoil maps and descriptions valuable for engineering interpretatione include those relatingto elope, drainage, geology, stoninese, depth to bedrock, texture, consistence, reactionand structure. Laboratory analyses commonly run on pedological soil samples which are espe-cially valuable to engineers include percent sand, percent silt, percent clay, percent andsize of coarse fragments, mineralogy, percent organic matter, percent Ca CO), bulk density,coefficient of linear exteneibility, percent H2 0 at 1/3 bar tension, percerit 520 at 15 barstension, percent Na, etc.
Soil analyses that engineers need are outlined in many publications including PCA SoilPrimer (PCA, 1962) and the Soils Manual for Design of Asphalt Pavement Structures (AsphaltInstitute, 1964). Fortunately, many of the analyses required on soil samples by engineerscan be approximated, estimated, adapted or trarsferred from the pedological descriptions andanalyses. Some pedological soil tests, like the coefficient of linear extensibility (SoilSurvey Staff, 1967), have been created by soil acientists especially to make their soilanalyses more valuable for engineers to use. Recently an excellent guide has been published(Soil Survey Staff, 1971) to make ratings of pedologically-defined soils for variousengineering uses.
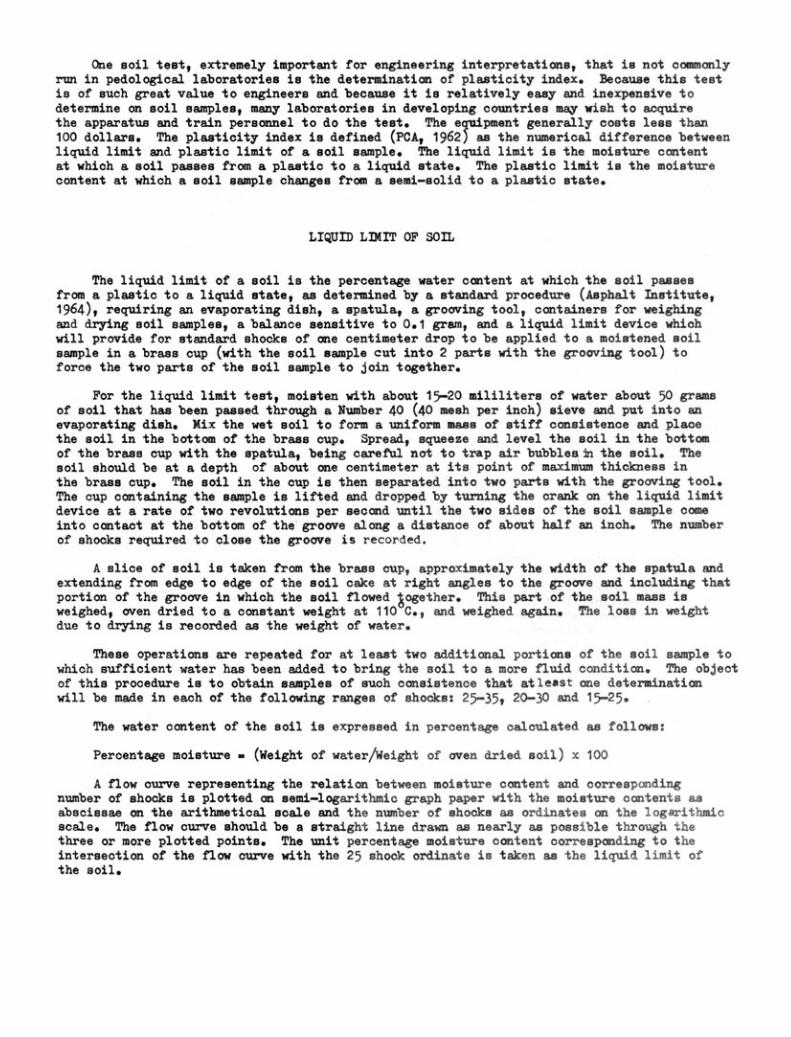
One soil test, extremely important for engineering interpretatione, that is not commonlyrun in pedological laboratories is the determination of plasticity index. Because this testis of euch great value to engineers and because it is relatively easy and inexpensive todetermine on soil samples, many laboratories in developing countries may wish to acquirethe apparatus and train personnel to do the test. The equipment generally costs less than100 dollars. The plasticity index is defined (PCA, 1962) as the numerical difference betweenliquid limit and plastic limit of a soil sample. The liquid limit is the moisture contentat which a eoil passes from a plastic to a liquid state. The plastic limit is the moisturecontent at which a aoil sample changes from a semisolid to a plastic state.
LUID LIMIT OF SOIL
The liquid limit of a soil is the percentage water content at which the soil passesfrom a plastic to a liquid state, as determined by a standard procedure (Asphalt Institute,1964), requiring an evaporating dish, a spatula, a grooving tool, containers for weighingand drying soil samples, a balance sensitive to 0.1 gram, and a liquid limit device whichwill provide for standard shocks of ane centimeter drop to be applied to a moiatened soilsample in a brass cup (with the soil sample cut into 2 parts with the grooving tool) toforce the two parts of the soil sample to join together.
For the liquid limit test, moisten with about 15-20 mililiters of water about 50 gramsof soil that has been passed through a Number 40 (40 mesh per inch) sieve and put into anevaporating dish. Mix the wet soil to form a uniform MRAB of stiff consistence and placethe soil in the bottom of the brass cup. Spread, squeeze and level the eoil in the bottomof the brass cup with the spatula, being careN1 not to trap air bubbles in the soil. Thesoil ehould be at a depth of about ane centimeter at its point of maximum thickness inthe brass cup. The soil in the cup is then separated into two parts with the grooving tool.The cup containing the sample is lifted and dropped by turning the crank on the liquid limitdevice at a rate of two revolutions per second until the two sides of the soil sample comeinto contact at the bottom of the groove along a distance of about half an inch. The numberof shocks required to close the groove is recorded.
A slice of soil is taken from the brass cup, approximately the width of the spatula andextending from edge to edge of the soil cake at right angles to the groove and including thatportion of the groove in which the soil flowed pgether. This part of the soil mane isweighed, oven dried to a constant weight at 110 C., and weighed again. The loes in weightdue to drying is recorded as the weight of water.
These operations are repeated for at least two additional portions of the soil sample towhich sufficient water has been added to bring the soil to a more fluid condition. The objectof this procedure is to obtain samples of such conaistence that atleast ane determinationwill be made in each of the following ranges of shocks: 25-35, 20-30 and 15-25.
The water content of the soil is expressed in percentage calculated as follows:
Percentage moisture . (Weight of water/Weight of oven dried soil) x 100
A flow curve representing the relation between moisture content and correspondingnumber of shocks ie plotted an semilogarithmic graph paper with the moisture contents asabscissae an the arithmetical scale and the number of shocks as ordinates an the logarithmicscale. The flow curve should be a straight line drawn as nearly as possible through thethree or more plotted points. The unit percentage moisture content corresponding to theintersection of the flow curve with the 25 shock ordinate is taken as the liquid limit ofthe soil.
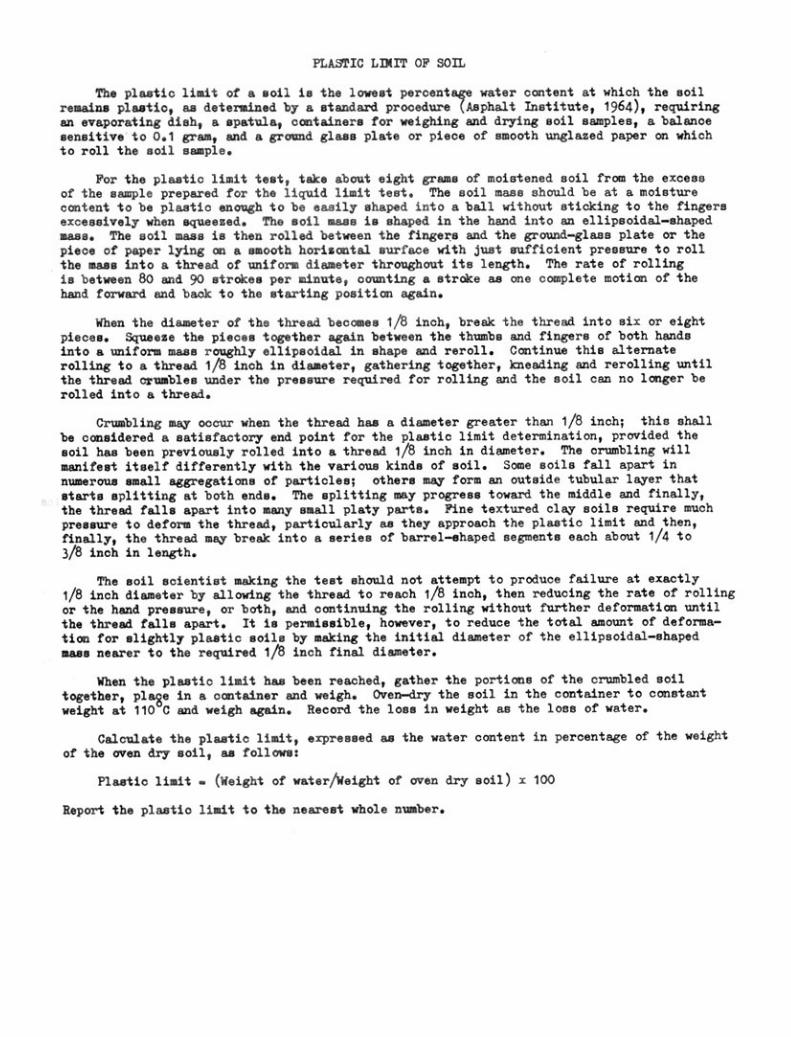
PLASTIC LIMIT OF SOIL
The plastic limit of a soil is the lowest percentw water content at which the soilremains plastic, as determined by a standard procedure (Asphalt Inutitute, 1964), requiringan evaporating dish, a spatula, containers for weighing and drying aoil samplee, a balancesensitive to 0.1 gran, and a ground glass plate or piece of smooth unglazed paper on whichto roll the soil sample.
For the plastic limit test, take about eight grams of moiatened soil from the excessof the sample prepared for the liquid limit test. The soil mass should be at a moisturecontent to be plastic enough to be easily shaped into a ball without sticking to the fingersexcessively when squeezed. The soil mass is shaped in the hand imito an ellipsoidalshapedmasa. The soil mass is then rolled between the fingers and the groundglass plate or thepiece of paper lying on a smooth horizontal surface with just sufficient preesure to rollthe mase into a thread of uniform diameter throughout its length. The rate of rollingis between 80 and 90 strokes per minute, counting a streke as one complete motion of thehand forward and back to the etarting position again.
When the diameter of the thread becomes 1/8 inch, break the thread into six or eight
pieces. Squeeze the pieces together again between the thumbe and fingers of both handsinto a uniform mass roughly ellipsoidal in shape and reroll. Continue this alternaterolling to a thread 1/8 inch in diameter, gathering together, kneading and rerolling untilthe thread crumbles under the proseure required for rolling and the soil can no longer berolled into a thread.
Crumbling may occur when the thread has a diameter greater than 1/8 inch; this ehall
be considered a satisfactory end point for the plastic limit determination, provided thesoil has been previously rolled into a thread 1/8 inch in diameter. The crumbling will
manifest iteelf differently with the various kinde of soil. Some soils fall apart in
numerous small aggregations of particles; others may form an outside tubular layer that
starts splitting at both ende. The splitting may progress toward the middle and finally,
the thread falls apart into many small platy parts. Fine textured clay soils require muchpressure to deform the thread, particularly as they approach the plastic limit and then,
finally, the thread may break into a series of barrelehaped segments each about 1/4 to3/8 inch in length.
The soil scientist making the test should not attempt to produce failure at exactly1/8 inch diameter by allowing the thread to reach 1/8 inch, then reducing the rate of rollingor the hand pressure, or both, and continuing the rolling without further deformation untilthe thread falle apart. It is permissible, however, to reduce the total amount of deforma-tion for elightly plastic soils by making the initial diameter of the ellipsoidalshapedmass nearer to the required 1/8 inch final diameter.
When the plastic limit has been reached, gather the portions of the crumbled soiltogether, plage in a container and weigh. Ovendry the soil in the container to constantweight at 110 C and weigh again. Record the loas in weight as the lose of water.
Calculate the plastic limit, expreseed as the water content in percentage of the weightof the oven dry soil, as follow:
Plastic limit (Weight of water/Weight of oven dry soil) x 100
Report the plastic limit to the nearest whole number.
Pusvicrry INDEX OF son
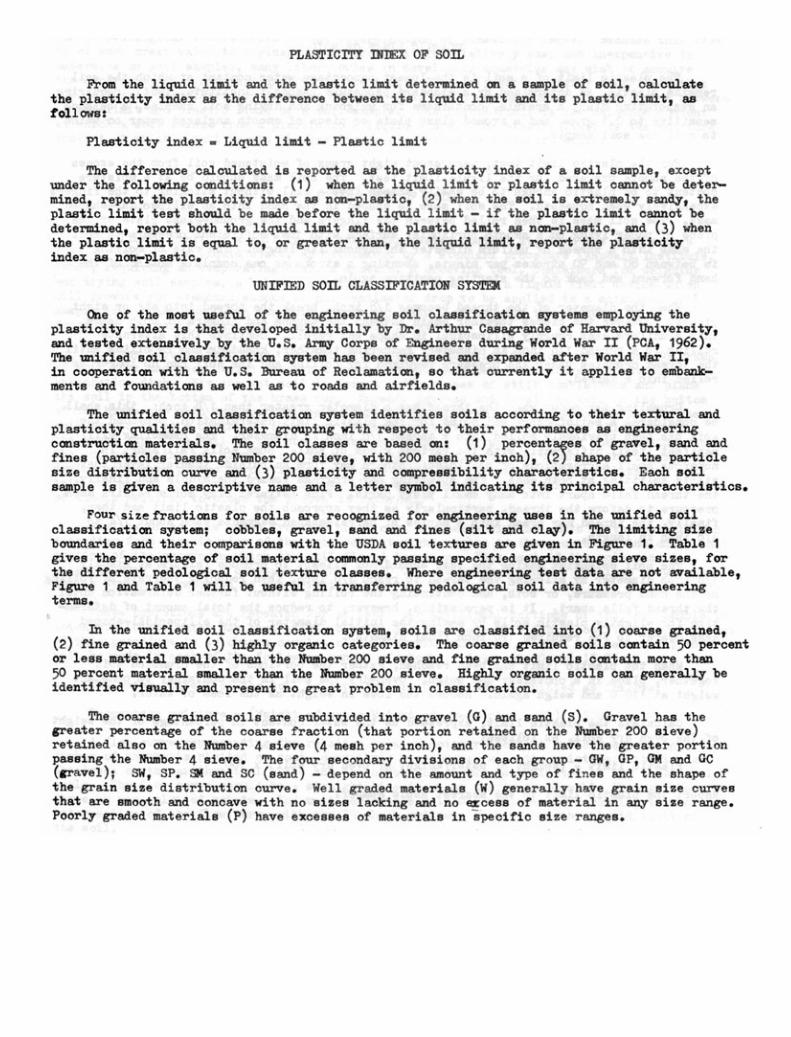
From the liquid limit and the plaatic limit determined on a sample of soil, calculatethe plasticity index as the difference between its liquid limit and its plastic limit, asfollows:
Plasticity index . Liquid limit Plastic limit
The difference calculated is reported as the plasticity index of a soil sample, exceptunder the following conditions: (1) when the liquid limit or plastic limit cannot be deter-mined, report the plasticity index as nonplastic, (2) when the soil is extremely sandy, theplastic limit test should be made before the liquid limit if the plaatic limit cannot bedetermined, report both the liquid limit and the plastic limit as nonplastic, and (3) whenthe plastic limit is equal to, or greater than, the liquid limit, report the plasticityindex as nonplastic.
UNIFIED SOIL CLASSIFICATION SY3TO11
One of the most usefUl of the engineering soil classification systems employing theplaaticity index is that developed initially by Dr. Arthur Casagrande of Harvard University,and tested extensively by the U.S. Army Corps of Engineers during World War II (PCA, 1962).The unified soil classification system has been revised and expanded after World War II,in cooperation with the U.S. Bureau of Reclamation, so that currently it applies to embank-ments and foundations as well as to roads and airfields.
The unified soil classification system identifies soils according to their textural andplasticity qualities and their grouping with respect to their performances as engineeringconstruction materials. The soil classes are based on: (1) percentages of gravel, sand andfines (particles passing Number 200 sieve, with 200 mesh per inch), (2) shape of the particlesize distribution curve and (3) plasticity and compressibility characteristics. Each soilsample is given a descriptive name and a letter symbol indicating its principal characteristics.
Four size fractions for soils are recognized for engineering uses in the unified soilclassification system; cobbles, gravel, sand and fines (silt and clay). The limiting sizeborundaries and their comparisons with the USDA soil textures are given in Figure 1. Table 1gives the percentage of soil material commonly passing specified engineering sieve sizes, forthe different pedological soil texture classes. Where engineering test data are not available,Figure 1 and Table 1 will be uaefb1 in transferring pedological soil data into engineeringterms.
In the unified soil classification system, soils are classified into (1) coarse grained,(2) fine grained and (3) highly organic categoriee. The coarse grained soils contain 50 percentor less material smaller than the NuMber 200 sieve and fine grained soils contain more than50 percent material smaller than the Number 200 sieve. Highly organic soils can generally beidentified visually and present no great problem in classification.
The coarse grained soils are subdivided into gravel (G) and sand (S). Gravel has thegreater percentage of the coarse fraction (that portion retained on the Number 200 sieve)retained also on the Number 4 sieve (4 mesh per inch), and the sands have the greater portionpassing the Number 4 sieve. The four secondary divieinna of each group GW, GP, GM and GC(gravel); SW, SP. 3* and SC (sand) depend on the amount and type of fines and the shape ofthe grain size distribution curve. Well graded materials (VI) generally have grain size curvesthat are smooth and concave with no sizes lacking and no ercees of material in any size range.Poorly graded materials (P) have excesses of materials in -specific size ranges.
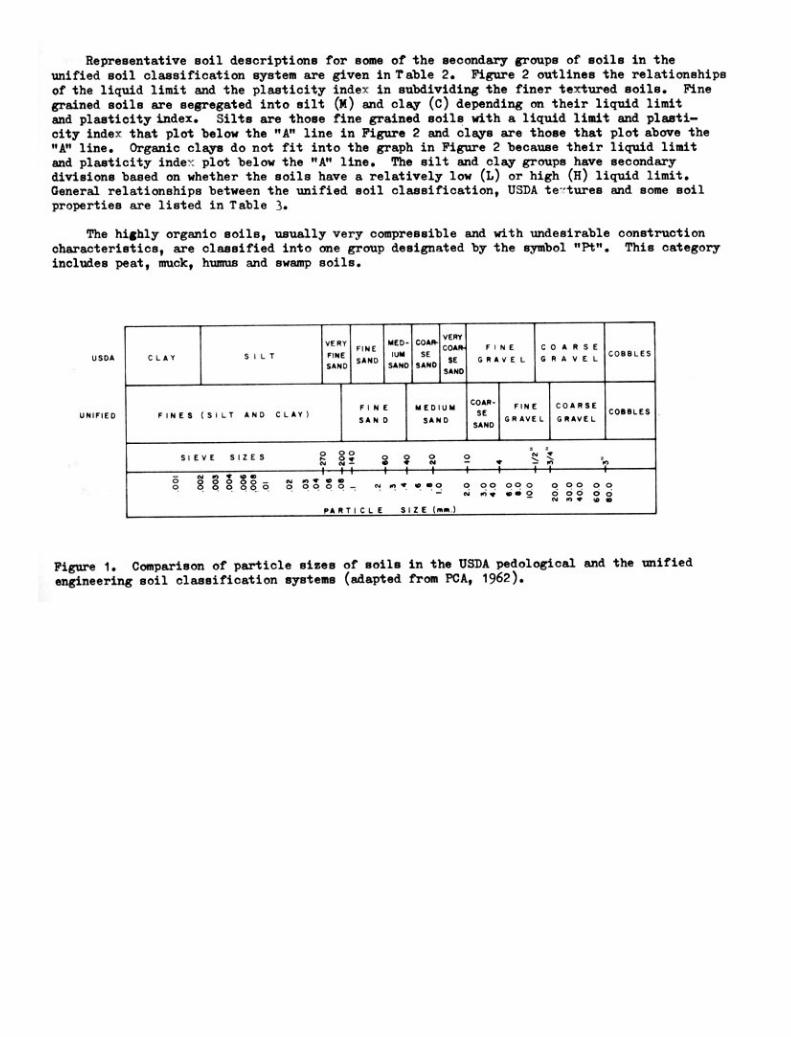
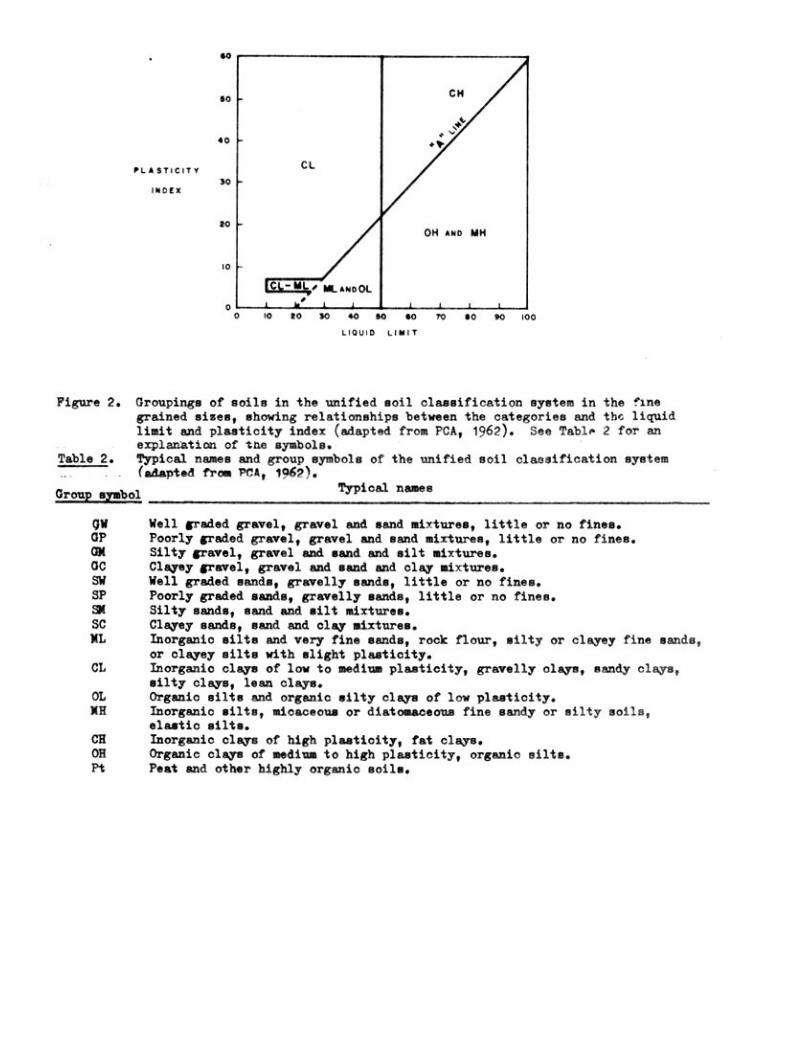
Representative eoil descriptions for soma of the secondary groups of soils in theunified soil classification system are given in Table 2. Figure 2 outlines the relationshipsof the liquid limit and the plasticity indel. in subdividing the finer textured soils. Fine
grained soils are segregated into silt (M) and clay (C) depending an their liquid limitand plasticity index. Silts are those fine grained soils with a liquid limit and plasti-city index that plot below the "A" line in Figure 2 and clays are those that plot above the"A" line. Organic clays do not fit into the graph in Figure 2 because their liquid limitand plasticity inde.: plot below the "A" line. The silt and clay groups have secondarydivisions based on whether the soils have a relatively low (L) or high (H) liquid limit.General relationships between the unified soil classification, USDA te-tures and some soilpropertiee are listed in Table 3.
The highly organic eoils, usually very compressible and with undesirable constructioncharacteristics, are claseified into one group designated by the symbol "Pt". This categoryincludes peat, muck, hums and swamp soils.
USDA
UNiFIED
Figure 1. Comparison of particle sizes of Boils in the USDA pedological and the unified
engineering soil classification systems (adapted from PCA, 1962).
CLAY SiLTvERyFINE
SAND
FINESANO
MED-RA
SANO
COAS-
SE
sAND
vERYcwt.
SE
SANO
F 1 N E
GRAVEL
,
COARSEGRAVEL COBBLES
FINES (sILT ND CLAY1 FINESAN D
mEDiUblSAND
COAR-
SE
SAND
FINEG R AvE L
COPSEGRAvE L
COBBLES
SIEVE SIZES P. 8 7N Mt ,
S .7,
0 . .I' 4$ 1
§',2:72,§ 6f $4 f t I I 4
CI SI ii:; 8 8 _ N wi. .0 o o oo 000 000 o o. . .. .
cv 01. so co 0 ó o o o 0N on V ko le
ARTICL E SIZE (RUM)
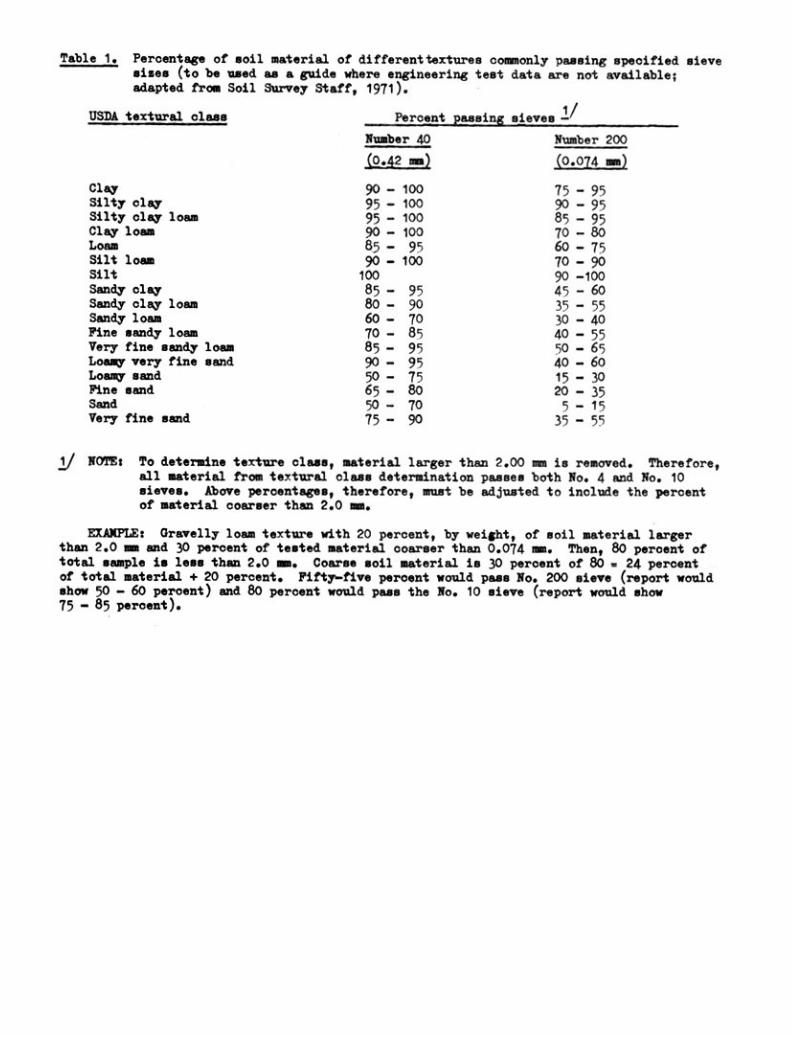
Table 1. Percentage of soil material of differenttexturee commonly paasing specified sievesises (to be used as a guide where engineering test data are not available;adapted from Soil Survey Staff, 1971).
USDA textural claas 1
Percent paasing sieves /Number 40 Number 200
(0.42 mm) (0.)4 sm)
Clay 90 100 75 95
9 : ;
Silty clay 95 100
3° 99Silty clay loam 95 100Clay loam90 100 70 80Loam 85 19 60 75Silt loam 90 100 70 90Silt 100 90 100Sandy clay 85 95 45 60Sandy clay loam 80 90 35 55Sandy loam 60 70 30 40Fine sandy loam70 85 40 55Very fine sandy loam 85 95 90 65Loamy very fine sand 90 95Loamy sand 50 75 105 : 1gFine sand 65 80 20 35Sand 50 70 5-15Very fine sand 75 90 35 59
1/ NOTE: 'Po determine texture class, material larger than 2.00 mm is removed. Therefore,all material from textural class determination passes both No. 4 and No. 10sieves. Above percentages, therefore, must be adjusted to include the percentof material coarser than 2.0 mm.
EXAXPLE: Gravelly loam texture with 20 percent, by weight, of soil material largerthan 2.0 mm and 30 percent of tested material coarser than 0.074 mm. Then, 80 peroent oftotal sample is less than 2.0 mm. Coarse soil material is 30 percent of 80 . 24 percentof total material + 20 percent. Fiftyfive percent would pass No. 200 sieve (report wouldshow 50 60 percent) and 80 percent would pass the No. 10 sieve (report would show75 85 percent).
PL A STiC1T?
SO
90
40
50
10
10
ICL- ML, ha_ ArdoOL
o L ht
o 10 10 SO 40 SO 40 70 S 0 90 100
LIQUID LIMIT
Figure 2. Groupings of soils in the unified soil classification eystem in the finegrained sisee, showing relationships between the categories and th,-. liquidlimit and plasticity index (adapted from PCA, 1962). See Table 2 for anexplanation of te symbols.
Table 2. Typical names and group symbols of the unified soil classification aystem(adapted from 15(A, 190).
Group eymbolTypical names
QW Well graded gravel, gravel and sand mixtures, little or no fines.OP Poorly graded gravel, gravel and sand mixtures, little or no fines.OW Silty gravel, gravel and sand and silt mixtures.OC Clayey gravel, gravel and sand and clay mixtures.SW Well graded sands, gravelly sands, little or no fines.SP Poorly graded sands, gravelly sands, little or no fines.SX Silty sands, sand and ilt mixtures.SC Clayey sands, sand and clay mixtures.XL Inorganic silts and very fine sands, rock flour, ilty or clayey fine sands,
or clayey eilts with slight plasticity.CL Inorganic clays of low to medium plasticity, gravelly olayr, sandy clays,
silty clays, lean clays.OL Organic elite And organic silty clays of low plasticity.NH Inorganic 'ditty, micaceous or diatomaceous fine sandy or Rilty soils,
elastic silts.CR Inorganic clays of high plasticity, fat clays.OH Organic clays of medium to high plasticity, organic silts.Pt Peat and other highly organic soils.
CH
CL
OH AND MH
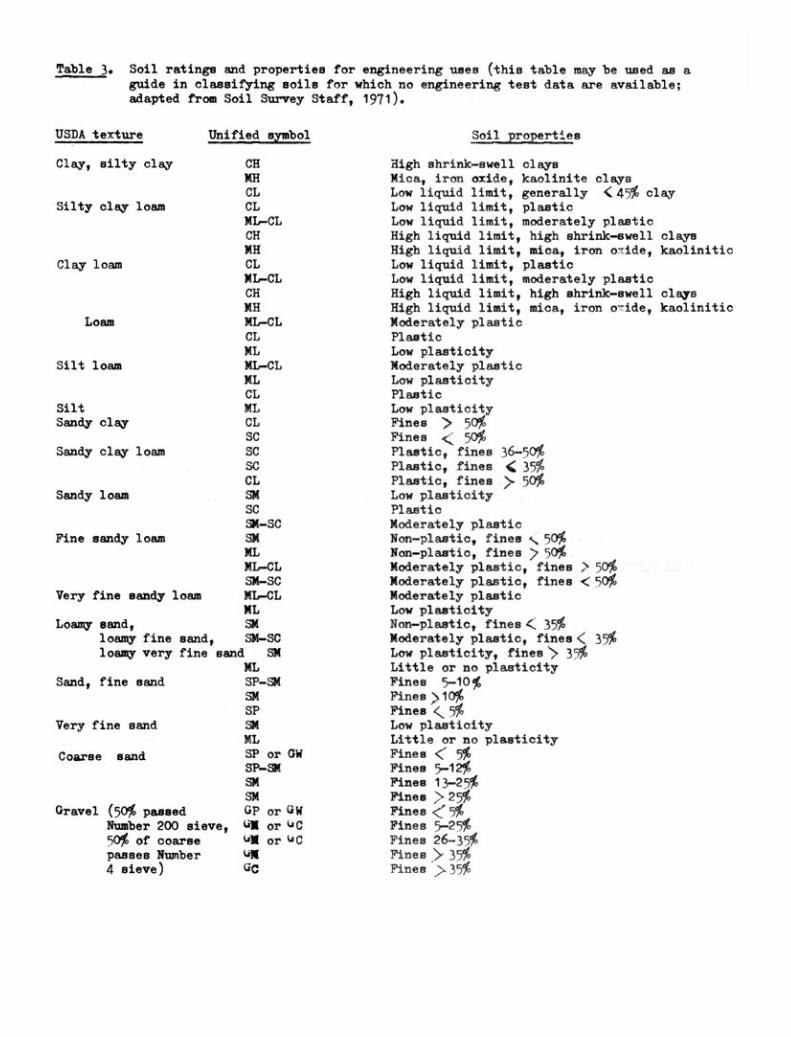
Table 3. Soil rating'', and properties for engineering uses (this table may be used as aguide in classifying soils fnr which no engineering test data are available;adapted from Soil Survey Staff, 1971).
USDA texture Unified symbol
Clay, silty clay CHMMCL
Silty clay loam CLML-CLCHMM
Clay loan CLML-CLCHMM
Loam ML-CLCLML
Silt loam ML-CLMLCL
Silt MLSandy clay CL
SC
Sandy clay loam SC
SC
CLSandy loam SX
SC
SM-SCFine sandy loam SM
MLML-CLSK-SC
Very fine sandy loam ML-CLML
Loamy sand, Sid
loamy fine sand, SK-SCloamy very fine sand SM
XLSand, fine sand SP-SM
SM
SPVery fine sand SM
ML
Coarse sand SP or 014
SP-SMSM
SM
Gravel (50% passed GP orNumber 200 sieve, UM or uC50% of coarse or uCpasses Number ug4 sieve) GC
Soil properties
High shrink-swell claysMica, iron oxide, kaolinite claysLow liquid limit, generally <45% claYLow liquid limit, plasticLow liquid limit, moderately plasticHigh liquid limit, high shrink-swell claysHigh liquid limit, mica, iron oxide, kaoliniticLow liquid limit, plasticLow liquid limit, moderately plasticHigh liquid limit, high shrink-swell claysHigh liquid limit, mica, iron o-ide, kaoliniticModerately plasticPlasticLow plasticityModerately plasticLow plasticityPlasticLow plasticityFines > 50%Fines < 90%Plastic, fines 36-50%Plastic, fines < 39%Plastic, fines > 50%Low plasticityPlasticModerately plasticNon-plastic, fines c 50%Non-plastic, fines 50%Moderately plastic, fines 510%Moderately plastic, fines <50%Moderately plasticLow plasticityNon-plastic, fines< 39%Moderately plastic, fines< 39%Low plasticity, fines> 39%Little or no plasticityFines 5-10%Fines >10%Fines < 9%Low plasticityLittle or no plasticityFines <- 5%Fines 5-12%Fines 13-29%Fines >25%Fines <:5%Fines 5-29%Fines 26-35%Fines> 39%Fines >39%
:IATINGS OF SOILS FOR DIFFERENT USES
On the basis of soil propertiee, mapped and described in the field and analyzed in thelaboratory, and on the basis also of acquired experience in measurement and observation ofperformances of various soils when subjected to engineering loads or other engineering uses,soils may be rated into simple groupings which will help people to decide whether or not agiven soil at a given location is likely to be good or poor for a specific use. In moat
cases, of course, eapecially for very expensive engineering structures, it is necesearyalso to conduct extensive onsite engineering tests and deep borings in addition to evalu-ation of the pedological soil data, before construction starts. Pedological soil data usedfor engineering purpoees, however, can be extremely valuable to engineers in deciding whereto make deeper borings, and many engineerine construction sites can be tentatively acceptedor rejected on the basic of pedological soil maps and data. The pedological information canalso be used by engineers to determine the likely soil conditions that may need to be modifiedfor construction, like leveling of sloping sites, draining wet soil areas, etc. The value
of the pedological data to engineers, of course, is dependent upont the scale and detail ofthe soils maps and upon the quantity and quality of the pedolo;ical soil data available.
Soils generally can be grouped into about three categories to provide useful firstapproximations for engineering purpoaes, based on pedological information. Most soils canbe rated good, moderate, or poor for most engineering uses; more refined groupings, ofcourse, can be made where it is necessary and when more data are available. Sometimes itis useful to have categories of soils that are "unsuited" for a specific use; sometimes
categories can be devised to show likely soil performance with respect to shrinkswellpotential or corrosivity in terms like low, moderate and high. Most engineering performancesof most soils, however, can be evaluated in soil groupings or terms like good, moderate, orpoor.
Soils rated good for engineering constructions have properties favourable for the rateduse. The degree of limitation is minor and can be overcome easily. Good performances and
low maintenance costs can be expected.
Soils rated moderate for engineering constructions have properties moderately favourablefor the rated use. This degree of limitation can be overcome or modified by special planningdesign, or maintenance. During some part of the year the performance of the structure orother planned use is somewhat less desirable than for soils rated good. Some soils rated
moderate require treatment such as runoff control to reduce erosion, extra excavation,artificial drainage, extended sewage absorption fields, or some other modification of cer-tain features through manipulation of the soil. For these soils, modification is neededfrom those construction plans for soils rated good. Modifications mAy include specialfoundations, extra reinforcement of structures, sump pumps, etc.
Soils rated poor for engineering constructions have one or more pronerties unfavourablefor the rated use, such as steep slopes, bedrock near the soil surface, flooding hazard,high shrinkswell potential, a seasonally high water table, or low bearing strength. This
degree of limitation generally requires major soil reclamation, special design, or intensivemaintenance«Some ofthese soils can be improved by reducing or removing the soil featurethat limits use, but in most eituations it is difficult and costly to alter the soil or
to design a structure so as to compensate for a severe degree of limitation.
AGGREGATE SOIL MATERIAL
For road construction and other engineering work in developing countries, soils assources of aggregate material (sand and gravel) are extremely important. Aggregate materialis generally used as a base for hard surfacing on roads, or as a surfacing an roads whereasphalt or concrete is not applied. Aggregate material is commonly used as fill wherenatural soils are unsuitable for subgrade for roads or where natural soils may be unstalqeas a base for other engineering structures. Because aggregate soil materiale are bulkyand expensive to transport, soil maps can be very ueeful to engineers in finding localsources. Soils that are good to moderate sources need to have layers of sand or gravel thatare at leastone metre thiCk.
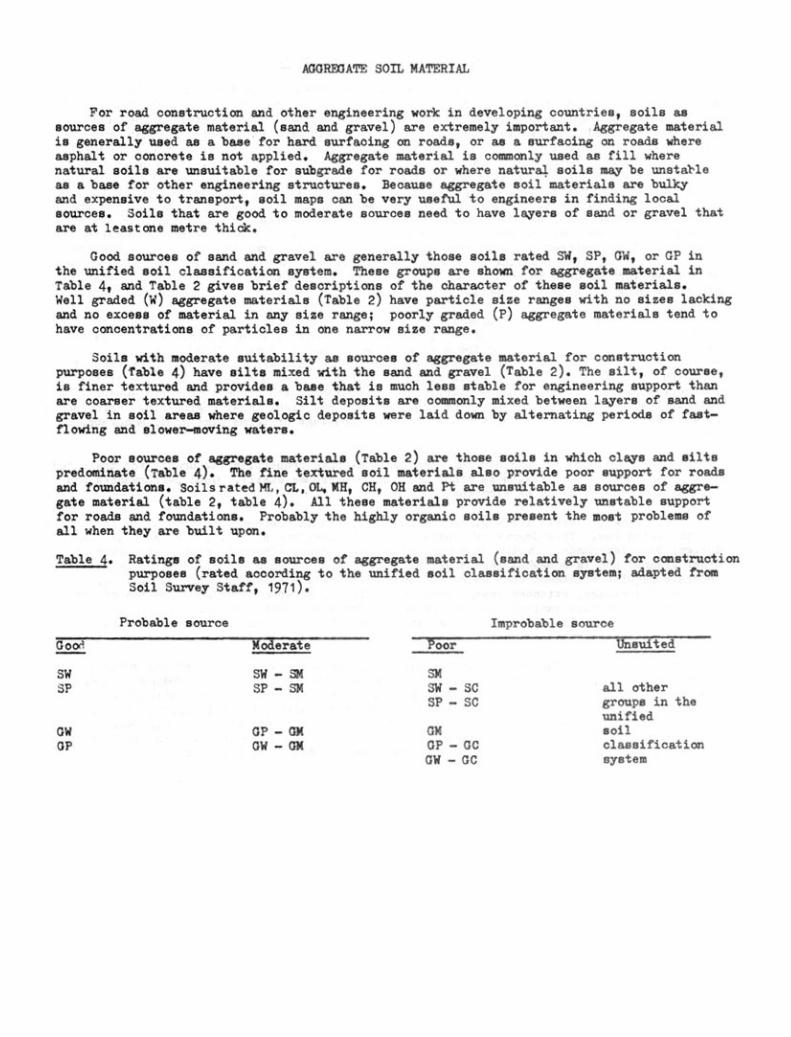
Good sources of sand and gravel are generally those soils rated SW, SP, GW, or GP inthe unified soil classification system. These groups are shown for aggregate material inTable 4, and Table 2 gives brief descriptions of the character of these soil materials.Well graded (W) aggregate materials (Table 2) have particle size ranges with no sizes lackingand no excess of material in any size range; poorly graded (P) aggregate materials tend tohave concentrations of particles in one narrow size range.
Soils with moderate suitability as sources of aggregate material for constructionpurposes (Table 4) have eilts mixed with the sand and gravel (Table 2). The silt, of couree,is finer textured and provides a base that is much less stable for engineering support khanare coarser textured materials. Silt deposits are commonly mixed between layers of sand andgravel in soil areas where geologic deposite were laid down by alternating periods of fast-flowing and slowermoving waters.
Poor sources of aggregate materials (Table 2) are those soils in which clays and siltspredominate (Table 4). The fine textured soil materials also provide poor eupport for roadsand foundations. SoilsratedM,CL, OL, MH, CH, OH and Pt are unsuitable as sources of aggre-gate material (table 2, table 4). All these materials provide relatively unstable supportfor roads and foundations. Probably the highly organic soils present the most problema ofall when they are built upon.
Table 4. Ratings of soils as sources of aggregate material (sand and gravel) for constructionpurposes (rated according to the unified soil classification system; adapted fromSoil Survey Staff, 1971).
Probable source Improbable source
Good Moderate Poor Unsuited
SW SW SM SM
SP SP SM SW SCSP SC
all othergroups in theunified
GW GP GM GM soil
GP GW GM GP GCGW CC
classificationeyetem
SECONDARY ROADS ON SOILS
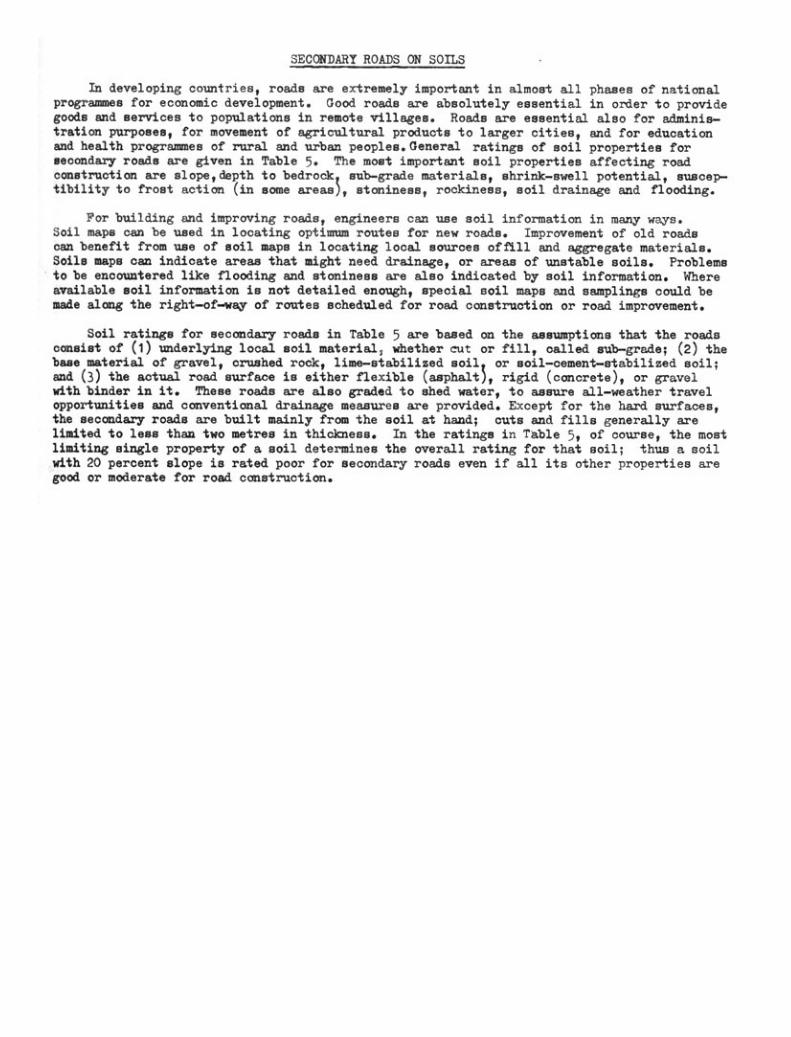
In developing countries, roads are extremely important in almost all phases of nationalprogrames for economic development. Good roade are absolutely essential in order to providegoods and services to populations in remote villages. Roads are essential also for adminis-tration purposes, for movement of agricultural products to larger cities, and for educationand health programmes of rural and urban peoples. General ratings of soil properties forsecondary roads are given in Table 5. The most important soil properties affecting roadconstruction are slope,depth to bedrock, subgrade materials, shrinkswell potential, suscep-tibility to frost action (in some areas), stoniness, rockiness, soil drainage and flooding.
For building and improving roads, engineers can use soil information in many ways.Soil mapa can be used in locating optimum routee for new roads. Improvement of old roadscan benefit from use of soil maps in locating local sources offill and aggregate materials.Soile mapa can indicate areas that might need drainage, or areas of unstable soils. Problemsto be encountered like flooding and stoninees are also indicated by soil information. Whereavailable soil information is not detailed enough, special soil mapa and samplingn could bemade along the rightofway of routes scheduled for road construction or road improvement.
Soil ratings for secondary roado in Table 5 are based on the assumptions that the roadsconsist of (1) underlying local soil material, whether cut or fill, called subgrade; (2) thebase material of gravel, crushed rock, limestabilized soil, or soilcementstabilized soil;and (3) the actual road eurface is either flexible (asphalt), rigid (concrete), or gravelwith binder in it. These roads are also graded to shed water, to assure allweather travelopportunitiee and conventional drainage measures are provided. Except for the hard surfaces,the secondary roads are built mainly from the soil at hand; cuts and fills generally arelimited to less than two metres in thidkness. In the ratings in Table 5, of course, the mostlimiting single property of a soil determines the overall rating for that soil; thus a soilwith 20 percent slope is rated poor for secondary roads even if all its other properties aregood or moderate for road construction.
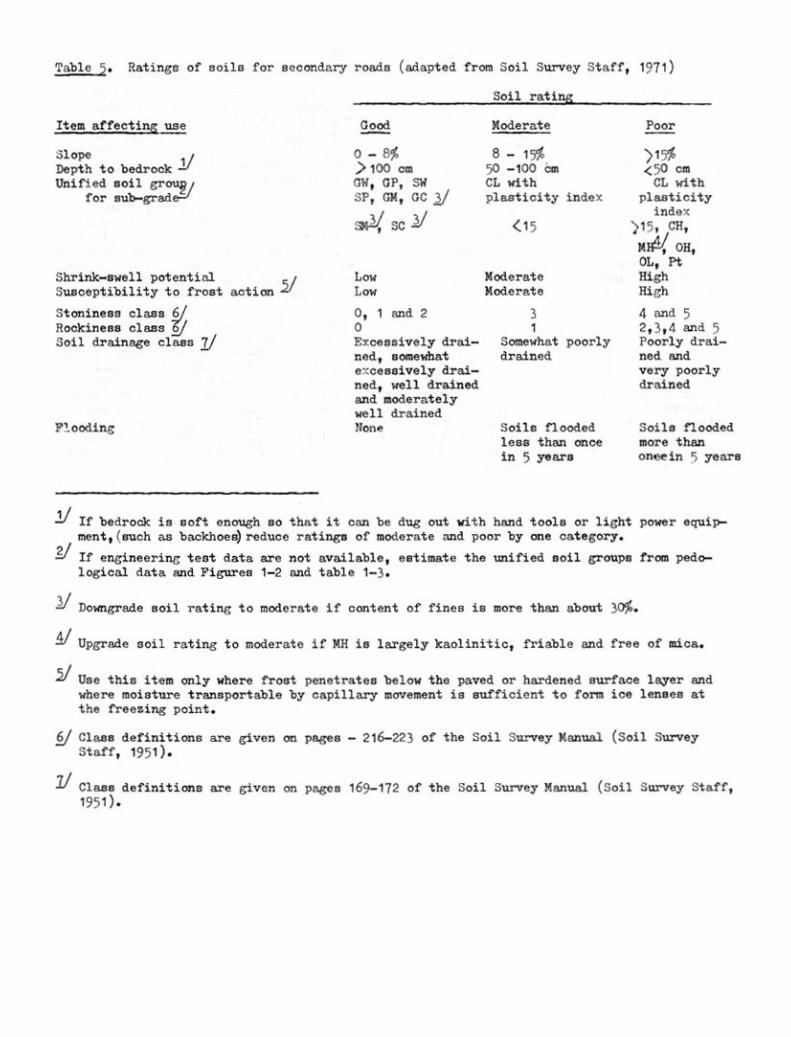
Stoniness classRockiness classSoil drainage class 7/
Flooding
0, 1 and 2oExcessively drai-ned, aomewhate7cessive1y drai-ned, well drainedand moderatelywell drainedNone
3
Somewhat poorlydrained
Soils floodedless than oncein 5 years
4 and 52,3,4 and 5Poorly drai-ned andvery poorlydrained
Soils floodedmore thanoneein years
If bedrodk is soft enough so that it can be dug out with hand tools or light power equip-ment,(auch as backhoes)reduce ratings of moderate and poor by one category.
If engineering test data are not available, estimate the unified soil groupa from pedo-logical data and Figuren 1-2 and table 1-3.
11 Downgrade soil rating to moderate if content of fines is more than about 30%.
1/ Upgrade soil rating to moderate if MH ie largely kaolinitic, friable and free of mica.
Use this item only where frost penetratea below the paved or hardened surface layer andwhere moisture transportable by capillary movement ie eufficient to form ice lenses atthe freezing point.
Clase definitions are given an pages - 216-223 of the Soil Survey Manual (Soil SurveyStaff, 1951).
Class definitions are given on pageo 169-172 of the Soil Survey Manual (Soil Survey Staff,1951).
Table 5. atings of soils for secondary roads (adapted from Soil Survey Staff,
Soil rating
1971)
Item affecting use Good Moderate Poor
3lope o - 8% 8 - 15% >1%Depth to bedrock >100 cm 50 -100 cm <50 cmUnified soil group/ GW, GP, SW CL with CL with
for sub-grade-i SP, GM, GC 1/ plasticity index plasticityindex34 SC Y <15 ;15, CH,
M , OH,
OL, Ft
Shrink-swell potential Low Moderate HighSusceptibility to frost action 2 Low Moderate High
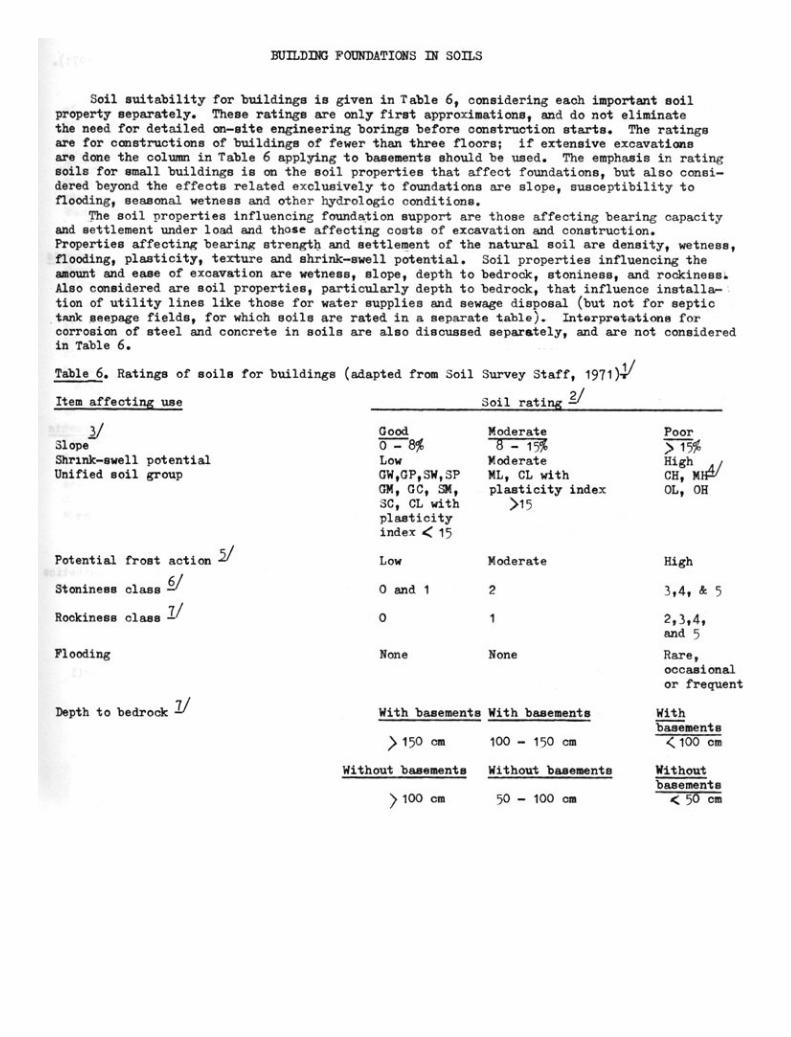
Soil suitability for buildings is given in Table 6, considering each important soilproperty separately. These ratings are only first approximations, and do not eliminatethe need for detailed on-site engineering borings before construction starts. The ratingsare for constructions of buildings of fewer than three floors; if extensive excavationsare done the column in Table 6 applying to basements should be used. The emphasis in ratingsoils for small buildings is on the soil properties that affect foundations, but also consi-dered beyond the effects related exclusively to foundations are slope, susceptibility toflooding, seasonal wetness and other hydrologic conditions.
The soil properties influencing foundation support are those affecting bearing capacityand settlement under load and those affecting coste of excavation and construction.Properties affecting bearing strength and settlement of the natural soil are density, wetness,flooding, plasticity, torture and shrink-swell potential. Soil properties influencing theamount and ease of excavation are wetness, slope, depth to bedrock, stoniness, and rockiness.Also considered are soil properties, particularly depth to bedrock, that influence installa-tion of utility lines like those for water supplies and sewage disposal (but not for septictank seepage fields, for which soils are rated in a separate table). Interpretations for
Depth to bedrock 2/
BUILDING FOUNDATIONS IN SOILS
>150 cm
Without basements
>100 cm
With basements With basements
100 - 150 cm
Without basements
50 - 100 cm
Withbasements<100 cm
Withoutbasements
< 50 cm
corrosion of steel and concrete in soilsin Table 6.
Table 6. Ratings of soils for buildings
are also discussed separately, and are not
(adapted from Soil Survey Staff, 1971)4/
Soil rating
considered
Item affecting WIC
Good Moderate PoorSlope 8 - 15% > 15%Shrink-swell potential Low Moderate High A/Unified soil group GW,GP,SW,SP ML, CL with CH, MP/
GM, GC, SM,SC, CL withplasticityindex 4; 15
plasticity index>15
OL, OH
Potential frost action Low Moderate High
Stoniness class 0 and 1 2 1,4, & 5
Rockiness class 2/ 0 1 2,3,4,and 5
Flooding None None Rare,occasionalor frequent
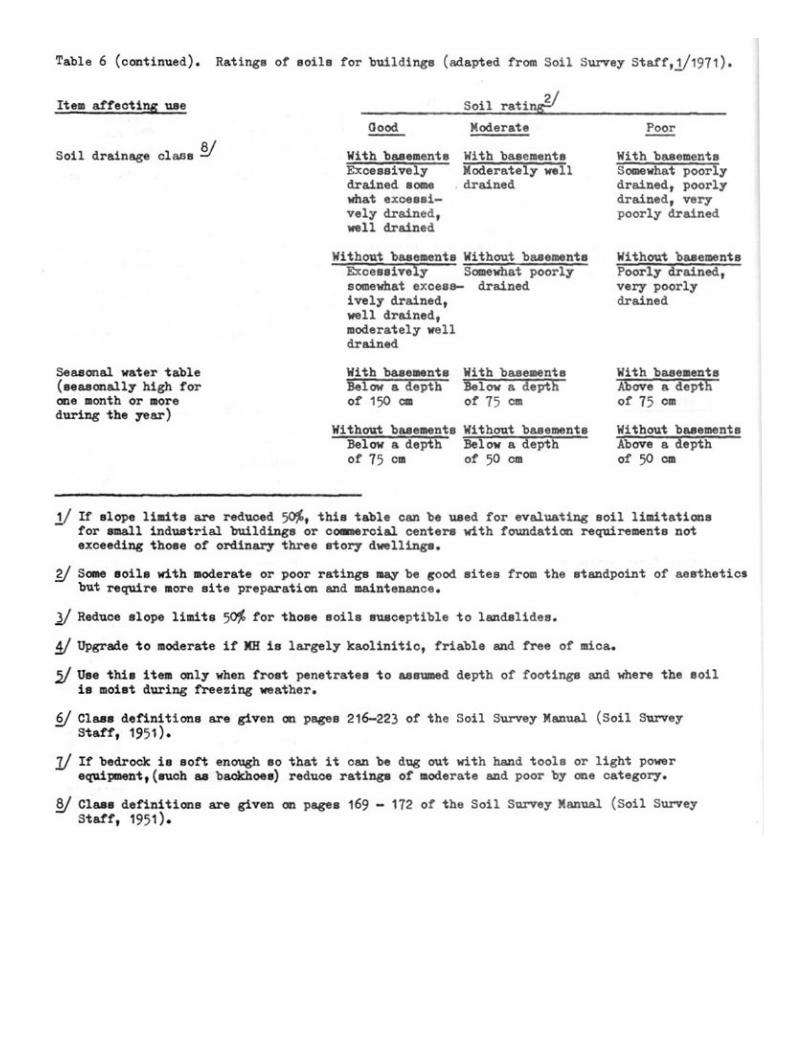
Table 6 (continued). Ratings of eoile for buildings (adapted from Soil Survey Staff, 1/1971).
Soil drainage clans With basements With basementsExcessively Moderately welldrained some drainedwhat exceasi-vely drained,well drained
Without basements Without basementsExcessively Somewhat poorlysomewhat exceaa drainedively drained,well drained,moderately welldrained
With basementsSomewhat poorlydrained, poorlydrained, verypoorly drained
Without basementsPoorly drained,very poorlydrained
1/ If elope limite are reduced 544, this table can be used for evaluating soil limitationsfor small industrial buildings or comercial centers with foundation requirementa notexceeding those of ordinary three story dwellings.
Some soils with moderate or poor ratings may be good sites from the standpoint of aestheticsbut require more site preparation and maintenance.
3/ Reduce slope limits 50% for those soils susceptible to landslidee.
41/ Upgrade to moderate if MH is largely kaolinitic, friable and free of mica.
V Use this item only when frost penetrates to assumed depth of footings and where the soilis moist during freezing weather.
Clase definitiona are given an pages 216-223 of the Soil Survey Manual (Soil SurveyStaff, 1951).
If bedrock ia soft enough so that it can beequipment,(such as baakhoes) reduce ratings
8/ Clasp's definitions are given an pages 169Staff, 1951).
dug out with hand tools or light powerof moderate and poor by ane category.
172 of the Soil Survey Manual (Soil Survey
Seasonal water table With basements With basemente With basements(seasonally high for Below a depth Below a depth Above a depthone month or more of 150 cm of 75 cm of 75 cmduring the year)
Without basements Without basements Without basementsBelow A depth Below a depth Above a depthof 75 cm of 50 cm of 50 cm
Item affecting use Soil ratingg/
Good Moderate Poor
HUMAN WASTE DISPOSAL IN SOILS
Many of the health problems in developing countries are calmed by inadequate disposalof human waste. Water supplies and food supplies may be contaminated with desease-producing organisms, due to lack of adequatewaste disposal facilities. Soils can beexcellent media for receiving and filtering human waste materials, if the volumes of thesoils receiving the materials are not averloaded and if the properties of the soils are goodor moderate for receiving sewage affluent. It must be pointed out that adequatewsstedisposal is as important to the health and wellbeing of populations in developing countriesas is adequate food production; uses of soils for waste disposal should be as importantin planning economic development programmes as plans for use of soils for farming.
Septic tank systems provide for solid settlement of human waste and digestion inemanaerobic tank, with the effluent (liquid) passing out of the tank into a seepage fieldwhere it is filtered through the soils. Designe for many different systems have beenextensively tested, and are available in a number of publications (Olson, 1964). Criteriafor rating soils for human waste disposal in Table 7 are based on the ability of the soilsto filter effluent. Some important factors influencing the capacity of a soil to filtereffluent are (1) design, load and maintenance of the en&ineering aspects of the disposalsystem, (2) permeability of the subsoil and substrata, (3) depth to consolidated rock orother impervious layers, (4) flooding, (5) seasonal and annual groundwater level and (6)slope.
Soils for sewage disposal, of course, should have relatively rapid permeability, butthe effluent should not run through the soil so fast or in such large volumes that itcontaminates the groundwater. Soils subject to more than rare flooding are rated poor,because floodwaters interfere with the proper functioning of the seepage field. Steepslopes cause mechanical problems for layout and construction of tile linee for effluentfiltration and effluent seepage downslope may contaminate water supplies. Septic tankseepage fields properly installed and maintained in suitable soils can contribute a greatdeal toward improved health conditions in many parte of developing countries, especiallywhere population densities are not too great.
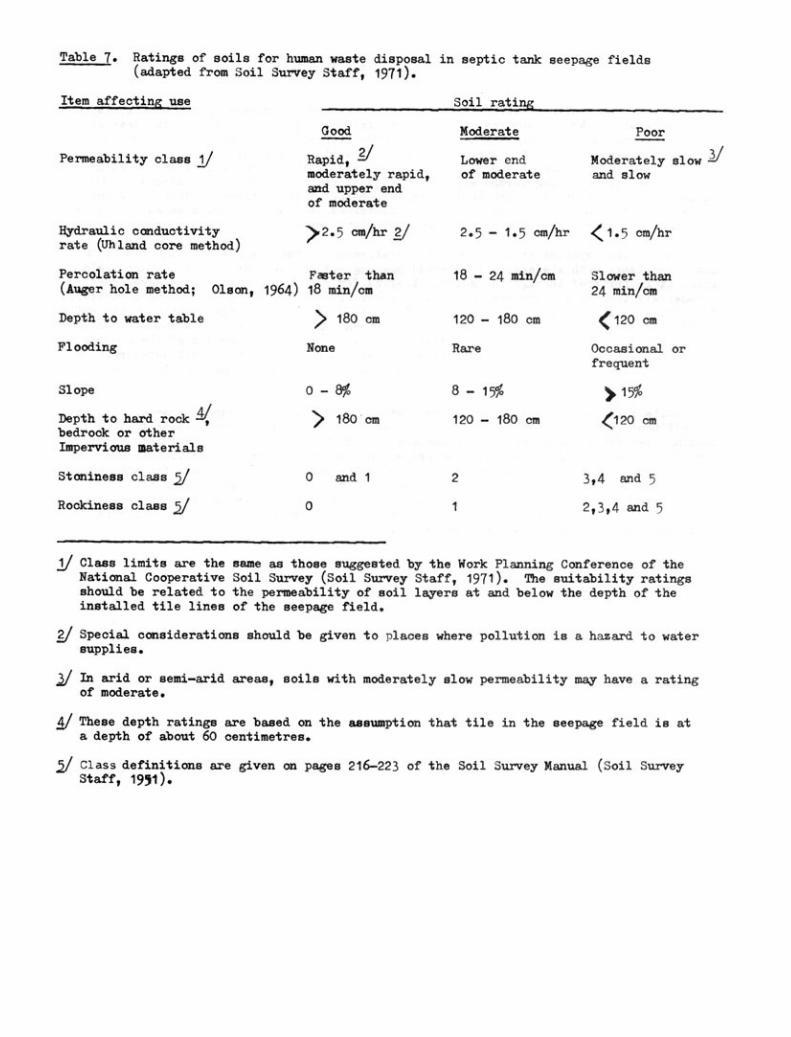
Table 7. Ratings of soils for human waste disposal in septic tank seepage fields(adapted from Soil Survey Staff, 1971).
Item affecting use Soil rating
Permeability class 1/
Good Moderate Poor
Rapid,Lower end Moderately slow 2/moderately rapid, of moderate and slowand upper endof moderate
Hydraulic conductivity >2.5 cm/hr 2/ 2.5- 1.5 cm/hr <1.5 cm/hrrate (Uhland core method)
Percolation rate Faster than 18 - 24 min/cm Slower than(Auger hole method; Olson, 1964) 18 min/cm 24 min/cm
Depth to water table > 180 cm 120 - 180 cm <120 cm
Flooding None Rare Occaaional orfrequent
Slope 0 - a% 8 - 15% >15%
..4/Depth to hard rock , > 180 cm 120 - 180 cm <120 cmbedrock or otherImpervious materials
Stoniness class 5/ 0 and 1 2 3,4 and 5
Rockiness class 5/ 0 1 2,3,4 and 5
1/ Class limits are the same as those suggested by the Work Planning Conference of theNational Cooperative Soil Survey (Soil Survey Staff, 1971). The suitability ratingsshould be related to the permeability of soil layers at and below the depth of theinstalled tile lines of the seepage field.
2/ Special considerations should be given to places where pollution is a hazard to watersupplies.
In arid or semi-arid areas, (mile with moderately slow permeability may have a ratingof moderate.
These depth ratings are based on the aaeumption that tile in the seepage field is ata depth of about 60 centimetres.
51 Class definitions are given on pages 216-223 of the Soil Survey Manual (Soil SurveyStaff, 1951).
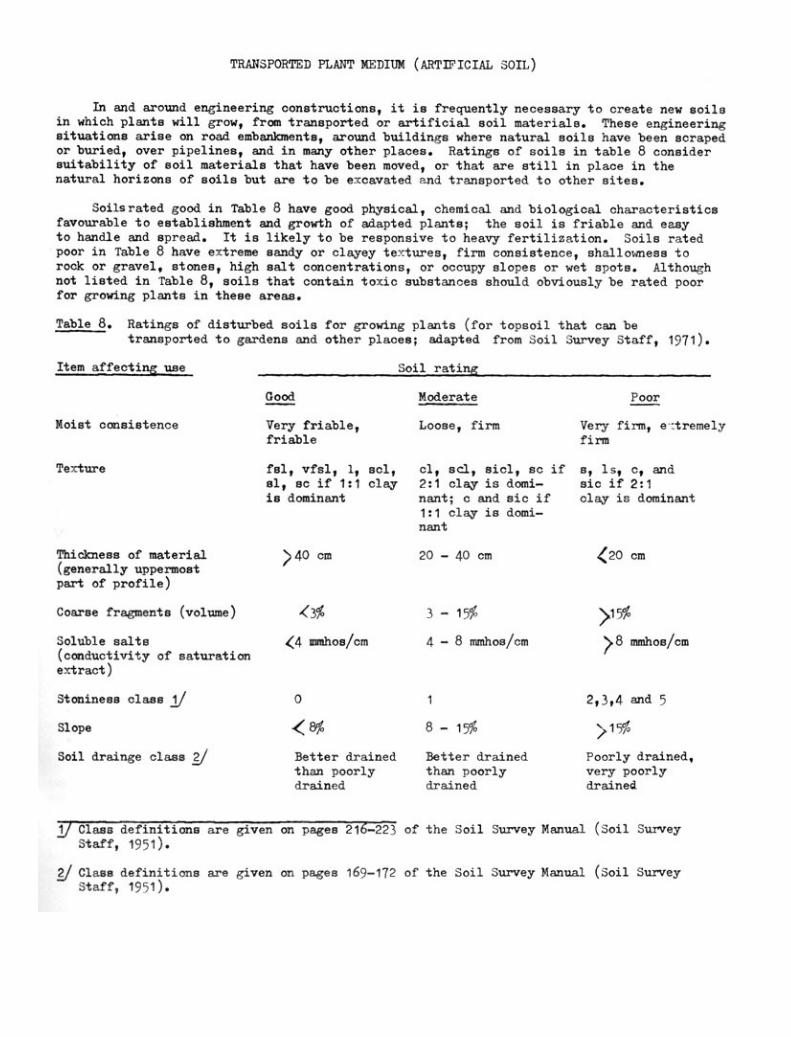
In and around engineering constructions, it is frequently necessary to create new soilein which plante will grow, from transported or artificial soil materiale. These engineeringsituations arise on road embankments, around buildings where natural soils have been scrapedor buried, over pipelines, and in many other places. Ratings of soils in table 8 considersuitability of soil materials that have been moved, or that are still in place in thenatural horizons of soils but are to be excavated and transported to other sites.
Soilsrated good in Table 8 have good physical, chemical and biological characteristicsfavourable to establishment and growth of adapted plants; the soil is friable and easyto handle and spread. It is likely to be responsive to heavy fertilization. Soils ratedpoor in Table 8 have extreme sandy or clayey textures, firm consistence, shallowness torock or gravel, stones, high salt concentrations, or occupy slopes or wet spots. Althoughnot listed in Table 8, soils that contain toxic substances should obviously be rated poorfor growing plants in these areas.
Table 8. Ratings of disturbed soils for growing plants (for topsoil that can betransported to gardens and other places; adapted from Soil Survey Staff, 1971).
Item affecting use Soil rating
Texture
TRANSPORTED PLANT MEDIUM (ARTIFICIAL SOIL)
Moist consistence Very friable, Loose, firm Very firm, e.tremelyfriable firm
fel, vfsl, 1, scl, cl, sci, sic, sc if s, ls, c, andsi, ec if 1:1 clay 2:1 clay is domi sic if 2:1is dominant nant; c and sic if clay is dominant
1:1 clay is domi-nant
1/ Class definitions are given on pages 216-221 of the Soil Survey Manual (Soil SurveyStaff, 1951).
Claim definitions are given on pages 169-172 of the Soil Survey Manual (Soil SurveyStaff, 1951).
Thickness of material(generally uppermostpart of profile)
>40 cm 20 40 cm 4:20 cm
Coarse fragments (volume) 3 15% >15%
Soluble salts(conductivity of saturationextract)
<4 mmhos/cm 4 8 mmhos/cm mmhos/cm
Stoniness class y 0 1 2,3,4 and 5
Slope <8% 8 15% >15%
Soil drainge class 2/ Better drainedthan poorly
Better drainedthan poorly
Poorly drained,very poorly
drained drained drained
Good Moderate Poor
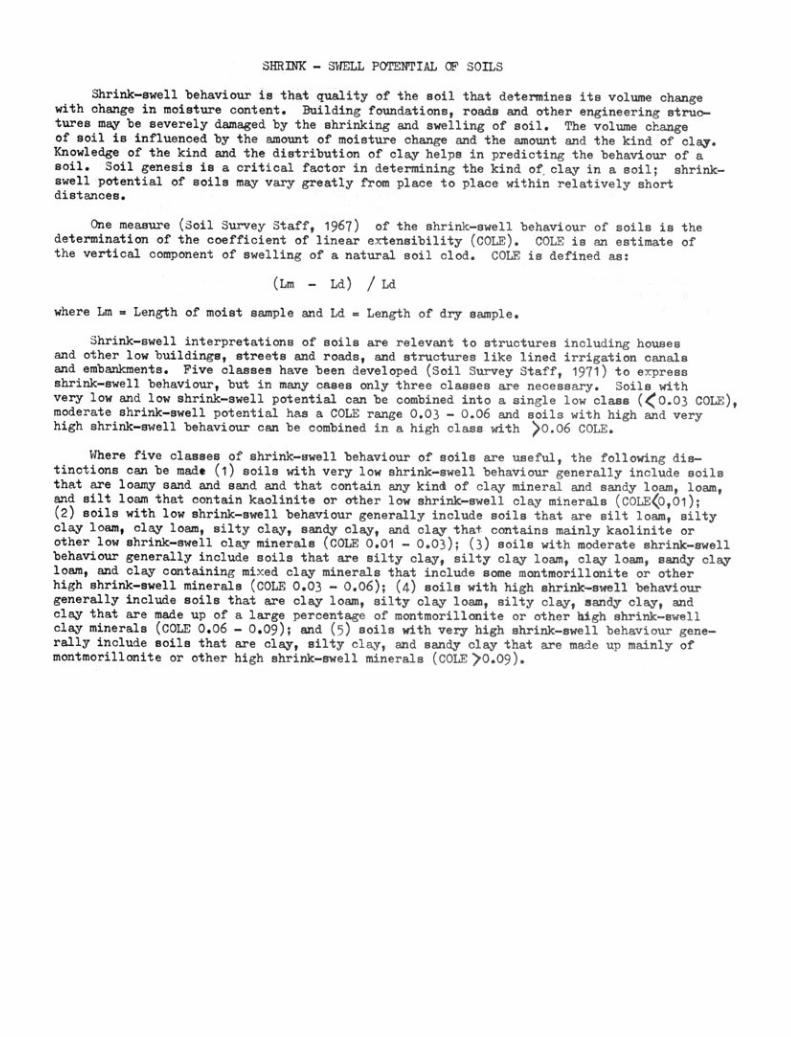
SHRINK SWELL POTENTIAL OF SOILS
Shrinkswell behaviour is that quality of the soil that determines its volume changewith change in moisture content. Building foundations, roads and other engineering struc-tures may be severely damaged by the shrinking and swelling of soil. The volume changeof soil is influenced by the amount of moisture change and the amount and the kind of clay.Knowledge of the kind and the distribution of clay helps in predicting the behaviour of asoil. Soil genesis is a critical factor in determining the kind of clay in a soil; shrink-swell potential of soils may vary greatly from place to place within relatively shortdistances.
One measure (Soil Survey Staff, 1967) of the shrinkswell behaviour of soils is thedetermination of the coefficient of linear extensibility (COLE). COLE is an estimate ofthe vertical component of swelling of a natural soil clod. COLE is defined as:
(Lía Ld) / Ld
where Lm . Length of moist sample and Ld . Length of dry sample.
Shrinkswell interpretations of soils are relevant to structures including housesand other low buildings, streets and roads, and structures like lined irrigation canalsand embankments. Five classes have been developed (Soil Survey Staff, 1971) to erpressshrinkswell behaviour, but in many cases only three classes are necessary. Soils withvery low and low shrinkswell potential can be combined into a single low clame (<0.03 COLE),moderate shrinkswell potential has a COLE range 0.03 0.06 and soils with high and veryhigh shrinkswell behaviour can be combined in a high class with >0.06 COLE.
Where five classes of shrinkswell behaviour of soils are useful, the following dis-tinctions can be mad (1) soils with very low shrinkswell behaviour generally include soilsthat are loamy sand and sand and that contain any kind of clay mineral and sandy loam, loam,and silt loare that contain kaolinite or other low shrinkswell clay minerals (COLE(0,01);(2) soils with low shrinkswell behaviour generally include soils that are silt loam, siltyclay loam, clay loan, silty clay, sandy clay, and clay that contains mainly kaolinite orother low shrinkswell clay minerals (COLE 0.01 0.03); (3) soils with moderate shrinkswellbehaviour generally include soils that are silty clay, silty clay loam, clay loam, sandy clayloam, and clay containing mixed clay minerals that include some montmorillonite or otherhigh shrinkswell minerals (COLE 0.03 0.06); (4) soils with high shrinkswell behaviourgenerally include soils that are clay loan, silty clay loam, silty clay, sandy clay, andclay that are made up of a large percentage of montmorillonite or other high shrinkswellclay minerals (COLE 0.06 0.09); and (5) soils with very high shrinkswell behaviour generally include soils that are clay, silty clay, and sandy clay that are made up mainly ofmontmorillonite or other high shrinkswell minerals (COLF>0.09).
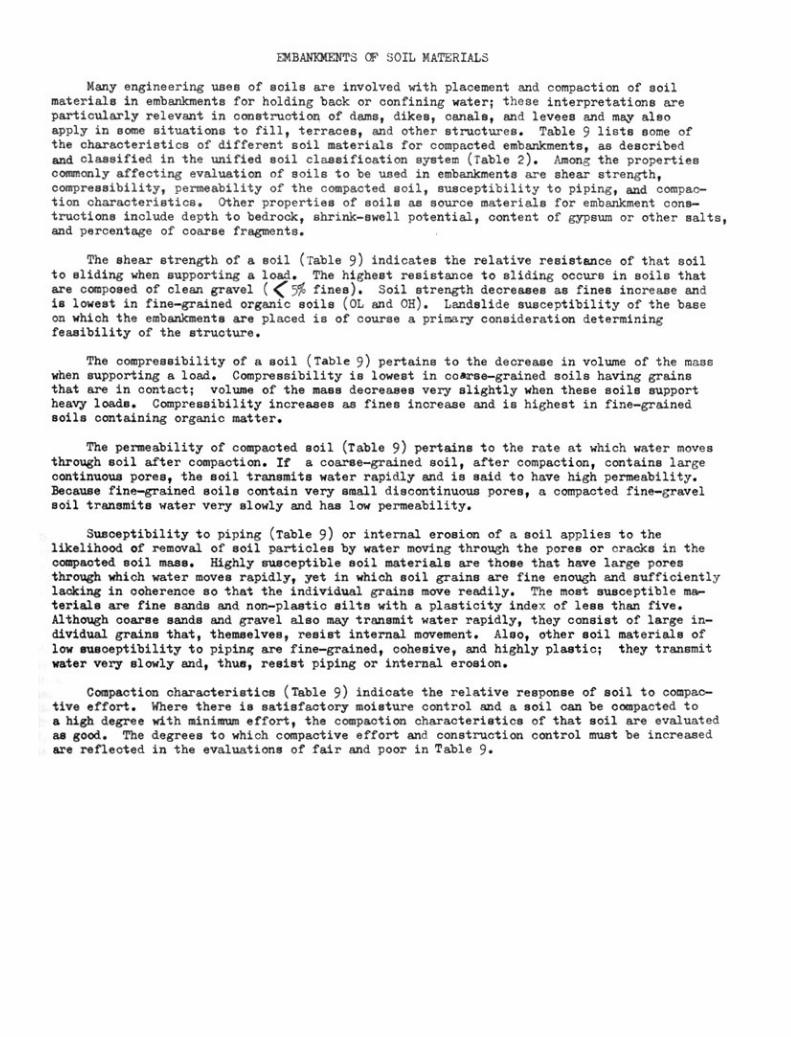
EMBANKMENTS OF SOIL MATERIALS
Many engineering uses of soils are involved with placement and compaction of soilmaterials in embankments for holding back or confining water; these interpretations areparticularly relevant in construction of dams, dikes, canale, and levees and may aleoapply in eome situationu to fill, terraces, and other structures. Table 9 liste some ofthe characteristics of different soil materials for compacted embankments, as describedand claseified in the unified soil classification system (Table 2). Amon7 the propertiescommonly affecting evaluation of soils to be used in embankments are shear strength,compressibility, permeability of the compacted soil, susceptibility to piping, and compac-tion characteristics. Other properties of soils as source materials for embankment cons-tructions include depth to bedrodk, shrink-swell potential, content of gypsum or other salts,and percentage of coarse fragments.
The shear strength of a soil (Table 9) indicates the relative resistance of that soilto sliding when supporting a load. The highest resistance to sliding occurs in soils thatare composed of clean gravel (<5% fines). Soil strength decreases as fines increase andis lowest in fine-grained organic soils (OL and OH). Landslide susceptibility of the baseon which the embankments are placed is of course a primary consideration determiningfeasibility of the structure.
The compreseibility of a uoil (Table 9) pertains to the decrease in volume of the masswhen eupporting a load. Compressibility is lowest in coarse-grained soils having grainsthat are in contact; volume of the mass decreases very slightly when these soils supportheavy loada. Compressibility increases as fines increase and is highest in fine-grainedsoils containing organic matter.
The permeability of compacted soil (Table 9) pertains to the rate at which water movesthrough soil after compaction. If a coarse-grained soil, after compaction, contains largecontinuous pores, the soil transmits water rapidly and is said to have high permeability.Because fine-grained Boils contain very small discontinuous pores, a compacted fine-gravelsoil transmits water very slowly and has low permeability.
Susceptibility to piping (Table 9) or internal erosion of a soil applies to thelikelihood of removal of soil particles by water moving through the pores or cradke in thecompaoted soil mass. Highly susceptible soil materials are those that have large poresthrough which water moves rapidly, yet in which soil grains are fine enough and sufficientlyladking in ooherence so that the individual grains move readily. The most susceptible ma-terials are fine sands and non-plastic silts with a plasticity index of less than five.Although coarse sands and gravel also may transmit water rapidly, they consist of large in-dividual grain° that, themselves, resist internal movement. Also, other eoil materials oflow susoeptibility to piping are fine-grained, cohesive, and highly plastic; they transmitwater very slowly and, thus, resist piping or internal erosion.
Compaction characteristics (Table 9) indicate the relative response of soil to compac-tive effort. Where there is satisfactory moisture control and a soil can be compacted toa high degree with minimum effort, the compaction characteristics of that soil are evaluatedas good. The degrees to which compactive effort and construction control must be increasedare reflected in the evaluations of fair and poor in Table 9.
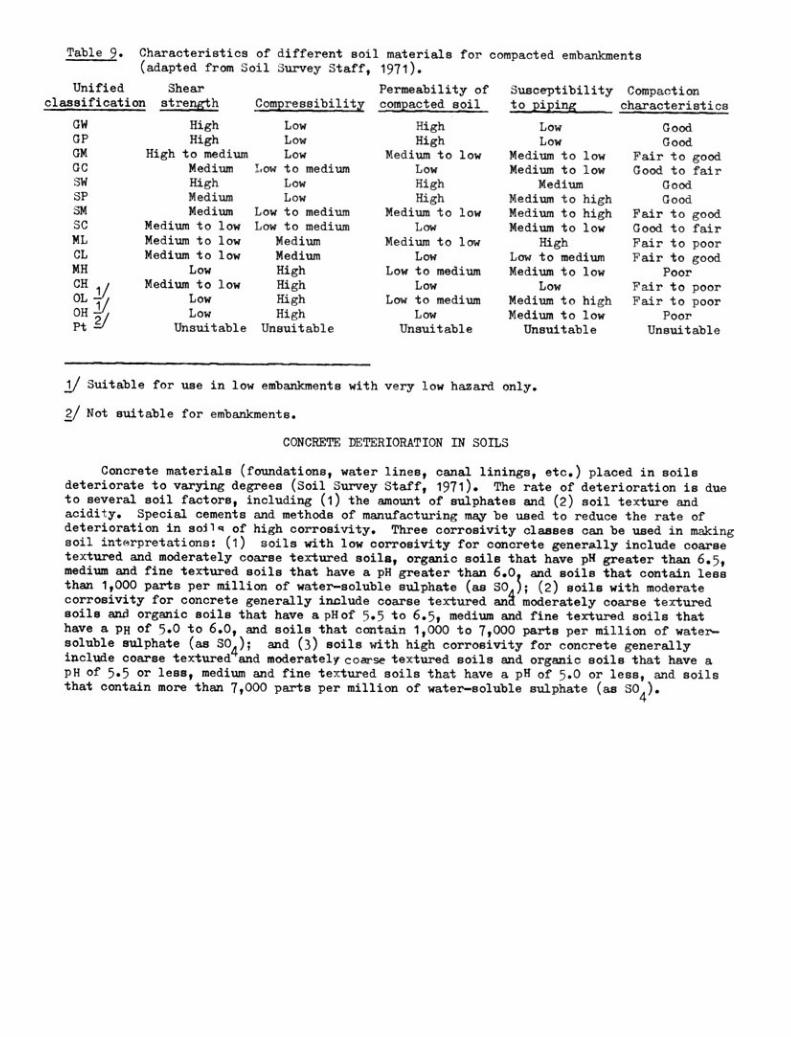
1/ Suitable for use in low embankmente with very low hazard only.
2/ Not suitable for embankments.
CONCRETE DETERIORATION IN SOILS
Concrete materials (foundations, water lines, canal linings, etc.) placed in soilsdeteriorate to varying degrees (Soil Survey Staff, 1971). The rate of deterioration is dueto several soil factors, including (1) the amount of sulphates and (2) Roil texture andacidity. Special cements and methods of manufacturing may be used to reduce the rate ofdeterioration in soilq of high corrosivity. Three corrosivity classes can be used in makingsoil interpretations: (1) soils with low corrosivity for concrete generally include coarsetextured and moderately coarse textured soils, organic soils that have pH greater than 6.5,medium and fine textured soils that have a pH greater than 6.0, and soils that contain lessthan 1,000 parts per million of watersoluble sulphate (as SOA); (2) soils with moderatecorrosivity for concrete generally inzlude coarse textured ana moderately coaree texturedsoils and organic soils that have a pHof 5.5 to 6.5, medium and fine textured soils thathave a pH of 5.0 to 6.0, and soils that contain 1,000 to 7,000 parts per million of watersoluble sulphate (as SO4')- and (3) soils with high corrosivity for concrete generallyinclude coarse textured and moderately coarse textured soils and organic soils that have apH of 5.5 or less, medium and fine textured soils that have a pH of 5.0 or less, and soilsthat contain more than 7,000 parts per million of watersoluble sulphate (as
304).
Table 9. Characteristics of different soil materials for compacted embankmentsfrom Soil Survey Staff, 1971).
Shear Permeability of Susceptibility Compactionstrength Compressibility compacted soil to piping characteristics
(adapted
Unifiedclassification
GN High Low High Low GoodGP High Low High Low GoodGM High to medium Low Medium to low Medium to low Fair to goodGC Medium Low to medium Low Medium to low Good to fairSW High Low High Medium GoodSP Medium Low High Medium to high GoodSM Medium Low to medium Medium to low Medium to high Fair to goodSC Medium to low Low to medium Low Medium to low Good to fairML Meiium to low Medium Medium to low High Fair to poorCL Medium to low Medium Low Low to medium Fair to goodMH Low High Low to medium Medium to low Poor
Medium to low High Low Low Fair to poorCT 1/w" Low High Low to medium Medium to high Fair to poorOH ---// Low High Low Medium to low PoorPt Unsuitable Unsuitable Unsuitable Unsuitable Unsuitable
UNCOATED STEEL CORROSIVITY IN SOILS
Rusting and corrosion of pipelines, cables and other uncoated steel structures insoils are a complex process only partially understood at present. Corrosion of uncoatedsteel is generally considered to be a physicalbiochemical process that converts ironinto its ions (Soil Survey Staff, 1971). Before corrosion can take place, soil moistureis necessary to form solutions of soluble salts. Any factors that influence the soilsolution or the oxidationreduction reactions taking place in the soil also influence theoperation of the corrosion cell (steel in soil). Some of the soil environment factorsaffecting corrosion are the amount of water in the soil, the conductivity of the soilsolution, the hydrogen ion activity in the soil solution (pH), the oxygen concentration(aeration), and the activity of organisms capable of causing oxidationreduction reactions.
The estimation of corrosivity for untreated steel pipe is commonly based on (1)resistance to flow of electrical current, (2) total acidity (Soil jurvey Staff, 1967),(3) soil drainage, (4) soil texture, and (9) conductivity of the saturation extract ofthe soil. Criteria for classes are based on unpublished and published research data(Soil Survey Staff, 1971).
Soils generally are assigned to one of three classes of corrosivity; low, moderate orhigh. Criteria can be given for five classes, but the five classes should be used only ifknowledge of a specific soil warrants the finer distinctions for proper interpretation. Inthe classes commonly used, low and high are combined with very low and very high, respectively.
Soils with very low corrosivity for uncoated steel generally include somewhat excessi-vely drained to excessively drained coarse textured soils that have little clay in thecontrol section. Water and air move through these soils rapidly or very rapidly. The totalacidity is below 4.0 meq per 100 grams of soil, or electrical resistivity of the soil atmoisture equivalent (Soil Survey Staff, 1967) is above 10,000 ohmcm at 60°F, or electricalconductivity of pe saturation extract (Soil Survey Staff, 1967) is less than 0.1 mmho percentimetre at 25 C, (noncorrosive).
Soils with low corrosivity for uncoated steel generally include well drained soilsthat have a moderately coarse textured and medium textured control section and somewhatpoorly drained soils that have a coarse textured control section. Theee soils are moderatelypermeable or rapidly permeable. Their total acidity ranges from 4.0 to 8.0 meq per 100 gramsof soil, electrical resistivity at moisture equivalent is 5,000 to 10,000 ohmcm at 60° F,orelectrical conductivity of the saturation extract is 0.1 to 0.2 mho per centimetre at25°C, (slightly corrosive).
Soils with moderate corrosivity for uncoated steel generally include well drained soilsthat have a moderately fine textured control section and moderately well drained soils thathave a medium textured control section. The moderate category also includes somewhat poorlydrained soils that have a moderately coarse textured control section, and very poorly drainedsoils (including peats and mucks) in which the water table remains at the surface throughoutthe year. Permeability of these soils is moderately slow to slow. The total acidity rangesfrom 8.0 to 12.0 meg per 100 grams of soil, electrical resistivity at moisture equivalent is2,000 to 5,000 ohmcm at 60° F, or electrical conductivity of the saturation extract is 0.2to 0.4 mho per centimetre at 250 C, (moderately corrosive).
Soils with high corrosivity for uncoated steel generally include well drained and mode-rately well drained fine textured soils; moderately well drained, moderately fine texturedsoils; somewhat poorly drained soils that have medium textured and moderately fine texturedcontrol sections; and poorly drained soils that have coarse textured to moderately fine tex-tured control sectione. Very poorly drained soils are included when their water tablefluctuates within 10 centimetres of the surface at some time during the year. The totalacidity ranges from 12.0 to 16.0 meg per ,100 grame of soil, electrical resistivity at moistureequivalent is 1,000 to 2,000 ohmcm at 60 F, or electrical conductivity of the saturationextract is 0.4 to 1.0 mmho per centimetre at 25° C, (severely corrosive).
Soils with very high corrosivity for uncoated steel generally include somewhat poorlydrained to very poorly drained fine textured soils. Mucks and peate that have a fluctuating
water table are included. Total acidity is greater than 16meq per 100 grams of soils,electrical resistivity at moisture equivalent is below 1,000 ohm-cm at 60° F, or electrical
conductivity of the saturation evtract is greater than 1.0 mmho per centimetre at 2';° C,
(very severely corrosive).
Becauee soil reaction (pH) correlates poorly with corrosion potential, pH is notincluded in the preceding features. Yet, there are some significant exceptions. A pH of4 or less, almost without exception, indicates a high or very high soil corroeion potential.The most favourable pH for sulphate-reducing bacteria is 7; progressive departures ineither direction indicate less and lees favourable pH conditions. In wet or moist soilswith anaerobic conditions, especially in claya that contain some organic matter and sulphur,
a pH of about 7 is corroborating evidence for a rating of high or very high ratings thatsuch soils would also receive on the basis of drainage and texture.
Ratings based on a single soil property or quality that place eoile in relativecorrosivity classes must be tempered by knowledge of other properties and qualities thataffect corrosion. A study of soil properties in relation to local experience° with soilcorrosivity helpa soil scientists and engineers in making soil interpretations. Specialattention should be given to those soil properties that affect the access of oxygen andmoisture to the metal, the electrolyte, the chemical reaction in the electrolyte, and theflow of current through the electrolyte. A constant watch should be maintained for thepresence of sulphides or of minerals such as pyrite that can be weathered readily, thuscalming a high degree of corrosion in metals.
Using soil corrosivity internretations without considering the size of the metallicstructure or the differential effects of using different metals may lead to wrong conclusions.Construction, paving, fill and compaction, surface additions, and other factors that alterthe soil can increase probability of corrosion by creating an oxidation cell that accele-rates corrosion. Mechanical agitation or excavation that result in aeration and in non-uniform mixing of soil horizons may also accelerate the probability of corrosion. The
probability of corrosion is greater for extensive installations that intersect soilboundaries or soil horizons than for installations that remain in one soil series or in onesoil horizon.
IRRIGATION OF SOILS
Engineering interpretation of soils for irrigation projects in developing countries isusually a complicated and involved procese, involving placement of dama, canals, and otherstructures as well as soils conditions. In many places adaptations of the U.S. Bureau ofReclamation procedures are used in selection and classification of irrigable land. Maletioand Hutchings (1967) have given an excellent general review of the USN/ land classificationfor irrigation in the comprehensive boek edited by Hagan et at (1967). Oleon (1972) hasreviewed some of the aspects of interpretive land classification in English-speaking countries.For the purpoees of this publication, only a list will be given of the soil features andqualitiee important for consideration in determining suitable irrigation practices for asoil. These are (Soil Survey Staff? 1971); (1) available water capacity, (2) depth ofsoil as related to rooting zone, (3) slope determining method of application of water andaffecting hazards of erosion, (4) rate of water intake? (5) need for drainage and depth towater table, (6) susceptibility to stream overflow, (7) ealinity and alkalinity, (8) stoni-ness, (9) hazards of aoil blowing, (10) presence of hardpan or other restrictive layers,(11) permeability below the surface layer, and (12) hazards of water erosion.
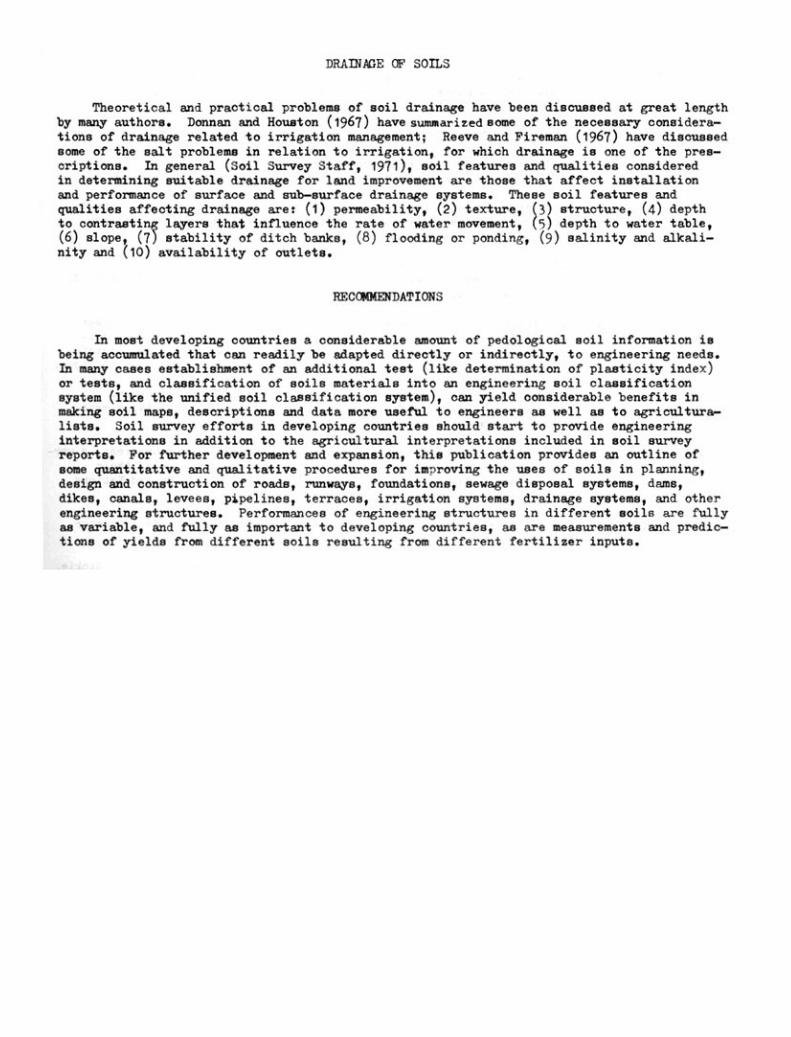
DRAINAGE CF SOILS
Theoretical and practical problems of soil drainage have been discussed at great lengthby many authors. Donnan and Houston (1967) have summarized some of the necessary considera-tions of drainage related to irrigation management; Reeve and Fireman (1967) have discussedsome of the ealt problemo in relation to irrigation, for which drainage is one of the pres-criptions. In general (Soil Survey Staff, 1971), soil features and qualities consideredin determining suitable drainage for land improvement are those that affect installationand performance of surface and subsurface drainage systems. These soil features andqualities affecting drainage are: (1) permeability, (2) texture, p) structure, (4) depthto contrasting layers that influence the rate of water movement, 5) depth to water table,(6) slope, (7) stability of ditch banks, (8) flooding or ponding, (9) salinity and alkali-nity and (10) availability of outlets.
RECOMMENDATIONS
In most developing countries a considerable amount of pedological soil information isbeing accumulated that can readily be adapted directly or indirectly, to engineering needs.In many cases establishment of an additional test (like determination of plasticity index)or tests, and claseification of soils materials into an engineering soil claseificationsystem (like the unified soil classification system), can yield considerable benefits inmaking soil maps, descriptions and data more useful to engineers as well as to agriculturaliste. Soil survey efforts in developing countries should start to provide engineeringinterpretatione in addition to the agricultural interpretatione included in soil surveyreporto. For further development and expansion, this publication provides an outline ofsome quantitative and qualitative procedures for imnroving the uses of soils in planning,design and construction of roads, runwaye, foundations, aewage disposal systems, dams,dikes, canals, levees, pipelines, terraces, irrigation systeme, drainage systems, and otherengineering otructures. Performances of engineering structures in different soils are fullyas variable, and fully as important to developing countries, as are measurements and predic-tions of yields from different soils resulting from different fertilizer inputs.
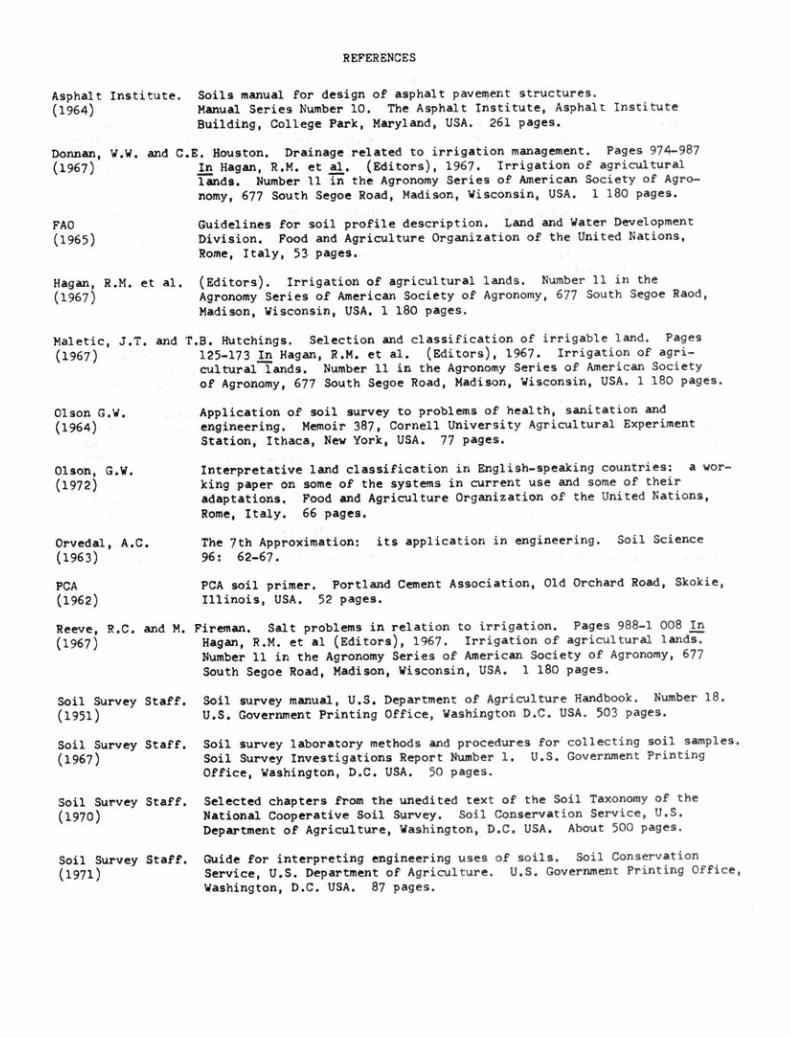
Asphalt Institute. Soils manual for design of asphalt pavement structures.
(1964) Manual Series Number 10. The Asphalt Institute, Asphalt InstituteBuilding, College Park, Maryland, USA. 261 pages.
Donnan, W.W. and C.E. Houston. Drainage related to irrigation management. Pages 974-987
(1967) In Hagan, R.M. et al. (Editors), 1967. Irrigation of agricultural
lands. Number 11 in the Agronomy Series of American Society of Agro-nomy, 677 South Segoe Road, Madison, Wisconsin, USA. 1 180 pages.
FAO Guidelines for soil profile description. Land and Water Development
(1965) Division. Food and Agriculture Organization of the United Nations,
Rome, Italy, 53 pages.
Hagan, R.M. et al. (Editors). Irrigation of agricultural lands. Number 11 in the
(1967) Agronomy Series of American Society of Agronomy, 677 South Segoe Raod,Madison, Wisconsin, USA. 1 180 pages.
Maletic, J.T. and T.B. Hutchings. Selection and classification of irrigable land. Pages
(1967) 125-173 In Hagan, R.M. et al. (Editors), 1967. Irrigation of agri-
cultural lands. Number 11 in the Agronomy Series of American Societyof Agronomy, 677 South Segoe Road, Madison, Wisconsin, USA. 1 180 pages.
REFERENCES
Application of soil survey to problems of health, sanitation andengineering. Memoir 387, Cornell University Agricultural ExperimentStation, Ithaca, New York, USA. 77 pages.
Interpretative land classification in English-speaking countries: a wor-
king paper on some of the systems in current use and some of theiradaptations. Food and Agriculture Organization of the United Nations,
Rome, Italy. 66 pages.
Orvedal, A.C. The 7th Approximation: its application in engineering. Soil Science
(1963) 96: 62-67.
PCA PCA soil primer. Portland Cement Association, Old Orchard Road, Skokie,
(1962) Illinois, USA. 52 pages.
Reeve, R.C. and M. Fireman. Salt problems in relation to irrigation. Pages 988-1 008 In
(1967) Hagan, R.M. et al (Editors), 1967. Irrigation of agricultural lands.
Number 11 in the Agronomy Series of American Society of Agronomy, 677South Segoe Road, Madison, Wisconsin, USA. 1 180 pages.
Soil Survey Staff. Soil survey manual, U.S. Department of Agriculture Handbook. Number 18.
(1951) U.S. Government Printing Office, Washington D.C. USA. 503 pages.
Soil Survey Staff.(1967)
Soil Survey Staff.(1970)
Soil Survey Staff.(1971)
Soil survey laboratory methods and procedures for collecting soil samples.Soil Survey Investigations Report Number 1. U.S. Government Printing
Office, Washington, D.C. USA. 50 pages.
Selected chapters from the unedited text of the Soil Taxonomy of theNational Cooperative Soil Survey. Soil Conservation Service, U.S.
Department of Agriculture, Washington, D.C. USA. About 500 pages.
Cuide for interpreting engineering uses of soils. Soil ConservationService, U.S. Department of Agriculture. U.S. Government Printing Office,
Washington, D.C. USA. 87 pages.
01son G.W.(1964)
Olson, G.W.(1972)