Embed Size (px)
Citation preview

Miscellaneous Paper No. 7
Soil Salinity Survey of the South Clarendon Plains
Clarendon, Jamaica (1:50,000)
Soil Survey Staff (July, 1988)
MINISTRY OF AGRICULTÜRE Rural Physical Planning Division Jamaica Soil Survey Project
Scanned from original by ISRIC - World Soil Information, as ICSU World Data Centre for Soils. The purpose is to make a safe depository for endangered documents and to make the accrued information available for consultation, following Fair Use Guidelines. Every effort is taken to respect Copyright of the materials within the archives where the identification of the Copyright holder is clear and, where feasible, to contact the originators. For questions please contact [email protected] indicating the item reference number concerned.
L"..3 f t . " ' il!
Forevord
As part of the Government's policy to put under-utilized lands into agricultural production as well as optimize use of arable land, the Rural Physical Planning Division •as given the respon si bility to carry out physical and natura! resource inventories in order to evaluate the productive potential/capacity of all land in the Island. To carry out that task more effectively. the Government of Jamaica through its Rural Physical Planning Division of the Ministry of Agriculture, initiated tvo complementary pro je ets, the Comprehensive Resource Inventory and Evaluation Project and the Soil Survey Project, vbich were co-funded by the United States Agency for International Development and the Directorate General for International Development Cooperation of the Government of the Ne th er lands respectively.
As part of the assignment, the Rural Physical Planning Division carried out a soil and vater inventory of the St Catherine and Clarendon Plains during 1984-85 This report, "Saiinity Survey of the South Clarendon Plains (1985)". vas researched and vritten by Dr. Hu go A de Wit, a Soil Scientist attached to the Soil Survey Project from 1982 to 1986, in cooperation vith the staf f of the Rural Physical Planning Division. The report is of significant importance because it identifies. quantifies and qualifies one of the major physical and chemical soil constraints to productive agriculture in the Southern Clarendon Plains, Soil Saiinity. This report not only points to the likely causes of saiinity, vhich are mainly "man-made," but it also gives guidelines for redamation and management of saline soils
The Division is grateful for Dr. de Wits valuable contributions.
Richard C Harrison, Directer, Rural Physical Planning Division June 1988
—This report was word processed by Miss Ruth Virgo. The maps accompanying this report were drawn by Dr. Hugo de Wit and computerized by Miss Diana Gruber and Messrs. Stafford Mitchell and Paul Johnson Editing was done by Robert H. deKruyff and Vincent A. Campbell.
1 n508
Acknovledge ments
I would like to thank the Governments of Jamaica and the Netheriands for giving me the opportunity to carry out this study and for their cooperation and support during the time I worked in Jamaica as a member of the Soil Survey Project Team.
Special thanks should go to Mr. Everton Medley who took care of the selection of sites in the field and the soil sampling; also to the staff of the laboratory of the Soil Survey Unit of the Rural Physical Planning Division of the Ministry of Agriculture for timely providing the analytical results and finally to the Jamaican and Dutch colleagues for their criticism and support.
de Wit
Wageningen, The Netheriands, July 1987 Kingston, Jamaica, November 1987
ii
CONTENTS PAGE
Foreward i Acknowledgements ii 1. Introduction 1 2. Field Work and Methods 4
2.1 Field Work 4 2.2 Laboratory 5
3. Interpretation and Use of Analytical Data 6 3.1 Accuracy of Analytical Results 6 3.2 Interpretation of Analytical Results 6 3.3 The Maps 11
4. Description of the Land Salinity Classes (Degree and Type of Salinization) 13 4.1 Ciass 4 Land 13
4.1.1 Occurrence 13 4.1.2 Salinization Pattern and Degree of Salinity 14 4.1.3 Sall Composition 14
4.2 Class 3 Land 14 4.2.1 Occurrence 14 4.2.2 Salinization Pattern and Degree of Salinity 15 4.2.3 Salt composition 16
4.3 Class 2 Land 16 4.3.1 Occurrence 16 4.32 Salinization Pattern and Degree of Salinity 17 4.3.3 Salt Composition 17
4.4 Class 2B Land 17 4.4.1 Salinization Type and Degree of Salinity 18 4.4.2 Salt Composition 18
4.5 Class 1 Land and Class IS Land 18 4.5.1 Occurrence 19 4.52 Salinization Type 19 4.53 Salt Composition 19
5. Discussion, Conclusions and Recommendations 20 6. Recommendations on the Use of Land Salinity Gasses Distinguished
and on the Improvement of their Present Salinity Status 25 6.1 Class 1 Land 25 6.2 Class IS Land 25 6.3 Gass 2 Land 25 6.4 Gass 3 Land 26 6.5 Gass 4 Land 27
iii
References 28
Appendices
Appendii 1. Conversion of EC2.5 to ECe-values (mS/cm) 29 Appendii 2. Chemical Data of Land Salinity Classes 31
Table 1. Characterization of Degrees of Salinity 7 Table 2. Salinization Type, Pattern and Degree 8 Table 3. Potential Effects of Soil Salinity on Land Use 10 Table 4. Salinity Levels of Cockpit Spring and Cockpit Canal 21
Map 1. Site locations, salinization types - Clarendon Plains; scale 1:50,00
Map 2. Land salinity classes - Clarendon Plains; scale 1:50,00
iv

1. INTRODUCTION
The South Clarendon Plains, located in the South Central part of Jamaica, form one of the major areas for agricultural production and can be compared in this respect with the St. Catherine Plains. Irrigated sugar cane is the main erop (e.g. Monymusk Estate) and irrigated vegetables and bananas have also become of economie importance recently.
The soils in the Plains are mainly of alluvial origin. Recent survey results, provided by the Jamaica Soil Survey Project (1984-87), have shown that the greater part of the plains nas crack ing clay soils which are derived from Old Alluvium. The Old Alluvium consists of eitensive flat plains and some older terraces along the major rivers in the area, viz. the Rio Minho and the Milk River. Many of the soils can be classified as Vertisols, which are characterized by strong cracking and hard soil structures in the dry season, and swelling accompanied by poor internal drainage in the wet season or during rainy periods. Near the coast the Old Alluvium generally has a nearly flat topography, whereas further inland at elevation over 50 to 100 feet, these deposits are slightly dissected. This has resulted in a gently undulating topography in some places. The latter especially applies to the older terraces mentioned earlier.
Agualta Clay - map symbol (ms) 104 in "Soil and Land-use Surveys No.7, Jamaica" (Finch, 1959) - is the major soil developed in the Old Alluvium and covers the greater part of the southern half of the Plains. Other important Old Alluvial soils are Four Paths Clay (ms 203) and Rhymesbury Clay (ms 113, 114) in Hayes Savannah. It should be noted that in the "Soil and Land-use Survey No.7, Jamaica" (Finch, 1959) Agualta Gay has been defined as "soils over recent alluvium." This
1
seems to be incorrect in view of recent soil descriptions and other data obtained. Recent alluvium is found along the major rivers, eg. New Yarmouth Loam and Qay Loam (ms 111, 112), Mears Sandy Loam (ms 101), St. Toolies Qay (ms 118) and Agualta Loam (ms 103).
Finch (1959), who gives a broad characterization of the soils in the Parish of Garendon, mentioned the widespread occurrence of soil salinity in Rhymesbury Gay and Agualta Gay, which was not mapped in view of the scale used. He also stated that" salinity has been partly or completely removed by irrigation in many cases". Other soils said to have been affected by salinization are Lodge Gay Loam (saline phase, ms 212) and Bodles Gay Loam (ms 217) along the Garendon-St. Catherine Parish border. This has been confirmed by recent studies on the Soils of the St. Catherine Plains (Campbell et al.. 1986).
Shaw (1982) conducted special research on salinity in the South Garendon Plains on behalf of the Sugar Industry Research Institute (S.I.R.I.) in Mandeville (Jamaica). He found that salinity in very fine textured soil viz. Agualta Gay, increased appreciably over the last 15 years (i.e. 1967 - 1982), averaging 1.5-2.0 percent per year. The quality of the irrigation water also deteriorated, while sugar cane yields were reduced during these years.
Investigations and observations made during 1985-1987 in the south-eastern corner of the Garendon Plains (e.g. around Mitchell Town, Lionel Town and in parts of the Monymusk Estate) have shown that serious salinity problems exist in these areas (F. Chanduvi of S.I.R.I., Mandeville, personal communication 1985 and preliminary results from field data from Soil Survey Project, 1985). It was therefore feit necessary to make a comprehensive assessment of the (present) salinity status in the South Garendon Plains.
2

This study provides an inventory of the present salinity status (1984-1987) and indicates where salinity hazard eiists or may exist in the future. In view of the dynamic character of the salinization process, this study should be considered as one step of an ongoing monitoring program me to be updated very regularly. In this way it may be possible to estabiish or predict future changes in the salinity status of the soils and to judge which methods or measures may be applied to prevent deterioration of the present soil status.
3

2. FIELD WORK AND METHODS
2.1 Fieldwork
The area was surveyed during September 1984 (observation sites 1-28) and in 1985. between April and August (observation sites 29-273). It covers approiimately 37,400 ha (92,400 acres). It eitends to the South of the Old Harbour - May Pen - Toll Gate Main Road and lies between the May Day Mountains in the west and the Braziletto Mountains/Harris Savannah in the east. A narrow strip near Tarentum bordering the parish of St. Catherine was included. The survey was carried out similarly to the one undertaken before in the St. Catherine Plains (de Wit, 1985). The locations of observation and sampling sites were basically chosen according to a grid system. In total 274 sites were selected and sampling was done at depths of 0-20, 40-60 and 80-100 cm for most sites. An Edelman type soil auger was used for this purpose. On the date of compiling this report 252 site locations were known. The distribution of the sites throughout the Plains was uneven. In the southern half of the survey location there were 180 observation sites, covering approiimately 21,000 ha. (i.e. 1 observation site per 117 ha or about 1 observation site per sq. kilometre), whereas in the northern half. covering approi. 16,400 ha, there were 72 observation sites (i.e. 1 observation site per 2.25 sq. kilometre). The lower density in the northern half was practiced in anticipation of either lower salinity levels due to higher elevation of the area or favourable drainage conditions (due to the gentle undulating topography) compared with the more level and imperfectly to poorly drained conditions in the southern half.
4
2.2 Laboratory
The following are short descriptions of the analytical soil analyses carried out in the Soils Laboratory of the Soil Survey Unit (SSU), Rural Physical Planning Division (RPPD), Ministry of Agriculture (MINAG) for the Southern Garendon Salinity Survey.
- Pre-treatment of samples: soil samples were dried at 105 °C for at least 24 hours and crushed afierwards.
- pH measurement in 1: 2.5 soil-water suspension; readings in 0.01 pH units, using a Schott C G 711 pH/mV metre and Schott combination electrode (types N 42 A and N 61).
- EC2.5 electrical Conductivity (mS/cm at 25 °C) was measured in the 1.2.5 soil-water shaking eitract1, with readings in mmho/cm (mS/cm at 25 °C). Initially, a YSI modei-30 conduaivity metre and Barnstead conduaivity cell No.E 341 were used, and afterwards a Phoi portable conduaivity metre, type 52 with a Standard conduaivity cell was used.
- Soluble Salts: d e ter mine d in the 1:2.5 soil-water shaking eitraa; analysis results in milliequivalents per 100 g of soil (meq/100 g).
- Sodium and Potassium: by flame photo metre (EEL, Corning Model 405) with filters at 589 and 768 mm respeaively; calcium and magnesium by Atomic Absorption Spearophotometry (Baird AAS model A 5100); chloride by titration with AgNC>3 and £20*204 as indicators. To save time and costs, no other anions were determined. Amounts of sulphate • bicarbonate were estimated by subtracting the amount of chloride from the sum of soluble cations.
—For an assessmenl of the soil salinity . EC2.5 -values thus obtained have been converted to ECg -values (see Chapter 3.2)
5
3. INTERPRETATION AND USE OF ANALYTICAL DATA
Analytical results were obtained for 259 observation sites. Because of uncertainty of some locations, the results of 252 observation sites were used for interpretation of analytical data and compilation of the salinity maps. The analytical results were listed on laboratory sheets which are available for consultation at the Soil Survey Unit of the Rural Physical Planning Division of the Ministry of Agriculture.
3.1 Accuricy of Analytical Results
In the analytical results of many samples a discrepancy was found between the sum of cations (meq/100 g soil) and the EC2.5-values, measured in the same extract. The concentrations of the total amount of cations in the shaking extract (meq/litre) should correspond with 4 times the sum of cations per 100 g of soil. The latter value and the EC2.5 should be roughly related as follows:
(sum cations/100 g soil) 1 meq/1 (1:2.5 extract) 110 1 EC2.5
For the majority of the analytical results the sum of cations appeared to be too low in comparison with the EC2.5 values, whereas the opposite was only occasionally the case. This may indicate a systematic inaccuracy in the measuring procedures, too low readings for the cations Na, Ca, and/or Mg (K-concentrations were generally very low), and/or too high EC2.5 readings. Differences between 4 times the sum of cations and EC2.5 °^ i e s s l*ian Ï0X are acceptable.
3.2 Interpretation of Analytical Results
The degree of salinity of the soil profile layers sampled and that of the salinization type (distribution of salts throughout the profile) were considered. Assessment of the degree of soil salinity can best be made on the basis of ECe-values (Electrical Conductivity of the saturation
extract in mS/cm at 25 °C).
6

Richards (1954) indicated that good relationshlps exist between salinity eipressed by ECe-values on the one hand and erop response on the other hand. Using ECe-values, he characterized degrees of salinity as shown in Table 1.
Table 1. Characterization of Degrees of Salinity
Non-saline soil : ECg less than 4.0 mS/cm 2
Slightly saline soil : ECe between 4.0 and 8.0 mS/cm Moderately saline soil: ECe between 8.0 and 16.0 mS/cm Strongly saline soil : ECe over 16.0 mS/cm
Most crops, apart from salt tolerant varieties or species, show a yield reduction of up to 50% or more at ECe-values ranging between 4.0 and 8.0 mS/cm (i.e. slightly saline soils). Sensitive crops such as fruits and some vegetables have a relative productivity of 50% or less at ECe-values 4.0 mS/cm. Few crops give satisfactory yield at salinity levels of over 8.0 mS/cm. Since for the Clarendon Plains samples, only EC2.5-values were obtained, these values have been converted into ECe-values by using a multiplication factor^ varying between 5x and 2x, depending on the salt concentration and composition. For samples of low concentrations and with relatively high amounts of chloride a factor of 5i was generally used. For cases where calcium, magnesium and sulphate ions formed an important part of the salt concentration factors of 4x or 3x were used. For gypsiferous samples the ECe w a s estimated
on the basis of the chloride concentration. Taking into account both the degree of salinization and the salinization pattern (judged from the three layers sampled), six (6) salinization types have been distinguished (see Table 2). These are similar to the salinization patterns which were found in the St. Catherine Plains (de Wit, 1985).
mS/cm • milli Siemens/cm - mmho/cm Appendix 1 gives some information on hov the conversion factors vere calculated.
7

Table 2. Salinization Type. Pattern and Degree
Salinization Type Salinization pattern/Degree of salinity based on estimated ECe-Values
1 Non-saline 0-100 cm depth or more
2 Non-saline 0-60 (-80) cm, slightly to strongly saline below 60 (-80) cm depth
3 Slightly saline 0-20 (-60) cm, non-saline below 20 to 60 cm depth
4 Non-saline 0-20 (-40)cm, slightly to strongly saline below 20 to 40 cm depth
5 Slightly to moderately saline 0-100 cm
6 As type 5, but strongly saline in some parts of the profile within 100 cm depth
Salinization type 1 represents non-saline soils, i.e. soils in which estimated ECe-values do not eiceed 4.0 mS/cm at 25 °C Although non-saline, many of the soils and especially the old alluvial ones, have estimated ECe-values up to 4.0 mS/cm and were often found transitional to, or to occur in association with soils belonging to salinization types 2 and 3. For a number of the non-saline soils it was therefore considered appropriate to indicate whether a salinization hazard exists in a particular profile. For this purpose a lower limit of 2.5 mS/cm (ECe ) was used. This value corresponds with EC2.5-values of approiimately 0.5 mS/cm. On map 1 (site locations and salinization types) the part of the profile (topsoil, deep subsoil, or throughout), in which values between 2.5 and 4.0 mS/cm were found has been indicated by a symbol in
8
red colour on the original map4. After all analytical results were studied it appeared that for a few situations a separate salinization type could be distinguished; viz. profiles having a moderately to strongly saline topsoil (ECe between 8.0 and 16.0 mS/cm) and a non-saüne deep
subsoil (80-100 cm), e.g. sites 5 and 230 and possibly 13. The salinization patterns of these soils co m par e rather well with salinization type 3 and salinity is likely to have also originated as a result of poor quality irrigation water or poor irrigation management. However, in view of the high topsoil salinity found for the above mentioned three sites, it would have been incorrect from an agricultural point of view, to include them in the slightly salt affected class 3. Generally, the six salinization types distinguished for the St. Catherine Plains (de Wit, 1985) were also adequate to characterize the great majority of salinization patterns in soil profiles of the South Clarendon Plains.
For the assessment of the potential effects of a salinization on land use, five (5) major land salinity classes have been distinguished on the basis of the 6 salinization types and the presence of salinization hazard (see Tab Ie 3). It should be noted that the latter factor was not taken into account in the salinity survey in the St. Catherine Plains.
4 --A summary of the symbols and codes used to identify the sii salinization types and salinization hazards are given on the Land Salinity Class map enclosed in this report.
9
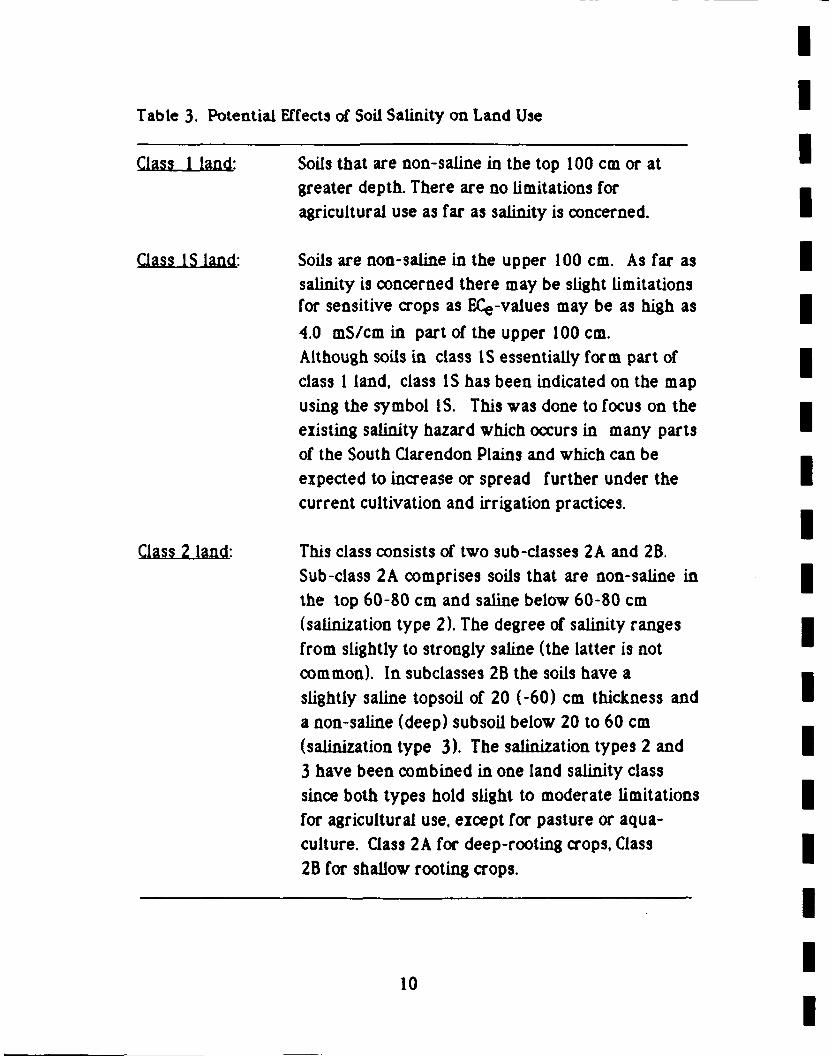
Table 3. Potential Effects of Soil Salinity on Land Use
Class 1 land: Soils that are non-saline in the top 100 cm or at greater depth. There are no limitations for agricultural use as f ar as salinity is concerned.
Class IS land: Soils are non-saline in the upper 100 cm. As f ar as salinity is concerned there may be slight limitations for sensitive crops as ECe-values may be as high as
4.0 mS/cm in part of the upper 100 cm. Although soils in class IS essentiaily form part of class 1 land, class IS has been indicated on the map using the symbol IS. This was done to focus on the eiisting salinity hazard which occurs in many parts of the South Garendon Plains and which can be expected to increase or spread further under the current cultivation and irrigation practices.
Class 2 land: This class consists of two sub-classes 2A and 2B. Sub-class 2A comprises soils that are non-saline in the top 60-80 cm and saline below 60-80 cm (salinization type 2). The degree of salinity ranges from slightly to strongly saline (the latter is not common). In subclasses 2B the soils have a slightly saline topsoil of 20 (-60) cm thickness and a non-saline (deep) subsoil below 20 to 60 cm (salinization type 3). The salinization types 2 and 3 have been combined in one land salinity class since both types hold slight to moderate limitations for agricultural use, eicept for pasture or aqua-culture. Class 2A for deep-rooting crops, Class 2B for shallow rooting crops.
10
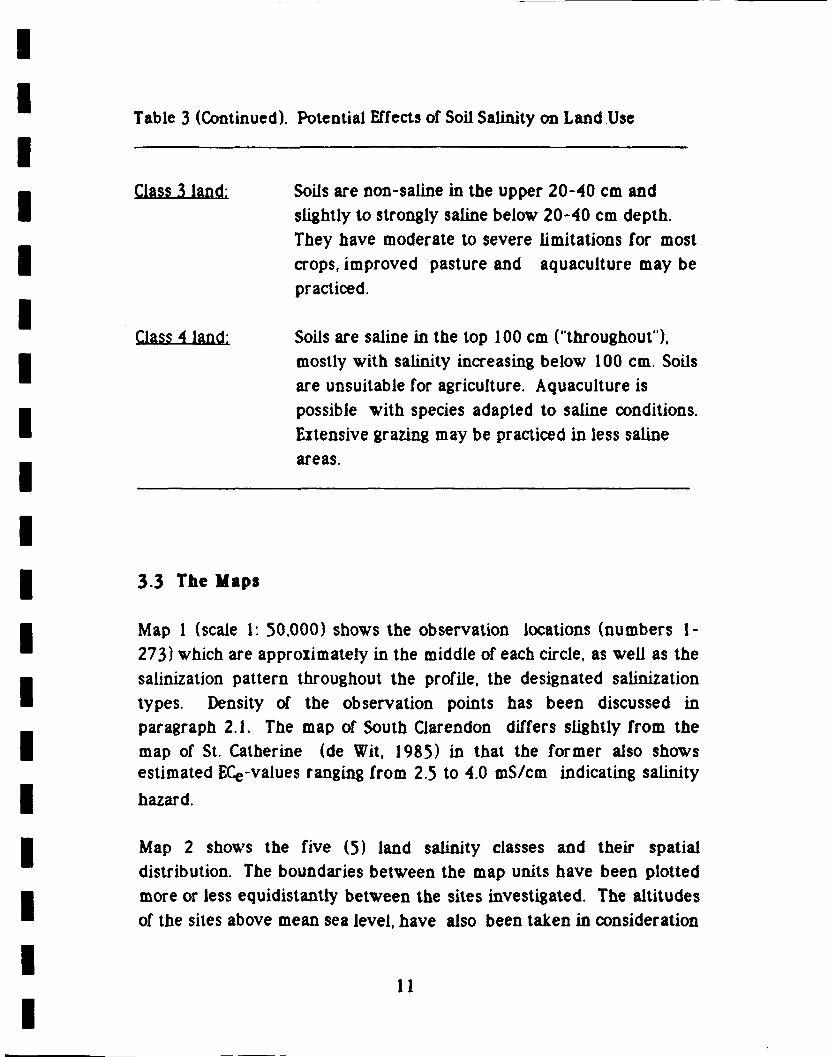
Tab Ie 3 (Continued). Poten ti al Effects of Soil Salinity on Land Use
Qass 3 land: Soils are non-saline in the upper 20-40 cm and slightly to strongly saline below 20-40 cm depth. They have moderate to severe limitations for most crops, improved pasture and aquaculture may be practiced.
Qass 4 land: Soils are saline in the top 100 cm ("throughout"), mostly with salinity increasing below 100 cm. Soils are unsuitable for agriculture. Aquaculture is possible with species adapted to saline conditions. Eztensive grazing may be practiced in less saline are as.
3.3 The Ifaps
Map 1 (scale 1: 50,000) shows the observation iocations (numbers 1-273) which are approiimately in the middle of each circle, as well as the salinization pattern throughout the profile, the designated salinization types. Density of the observation points has been discussed in paragraph 2.1. The map of South Clarendon differs slightly from the map of St. Catherine (de Wit, 1985) in that the former also shows estimated ECe-values ranging from 2.5 to 4.0 mS/cm indicating salinity
hazard.
Map 2 shows the five (5) land salinity classes and their spatial distribution. The boundaries between the map units have been plotted more or less equidistantly between the sites investigated. The altitudes of the sites above mean sea level, have also been taken in consideration
11
in plotting the boundaries by using the 30, 100 and 230 ft contours, the latter forming the boundary between the plains and the hilly uplands. More accurate and more reliable boundaries might have been drawn on the basis of 1:12,500 topographic maps. These were unfortunately not available at the time (1986). The upgraded soil map would have been helpful but it is still in preparation (Semi-detailed Soil Survey of Southern Clarendon in preparation). The boundaries shown on Map 2 should be therefore considered as tentative and limited in their degree of accuracy.
12
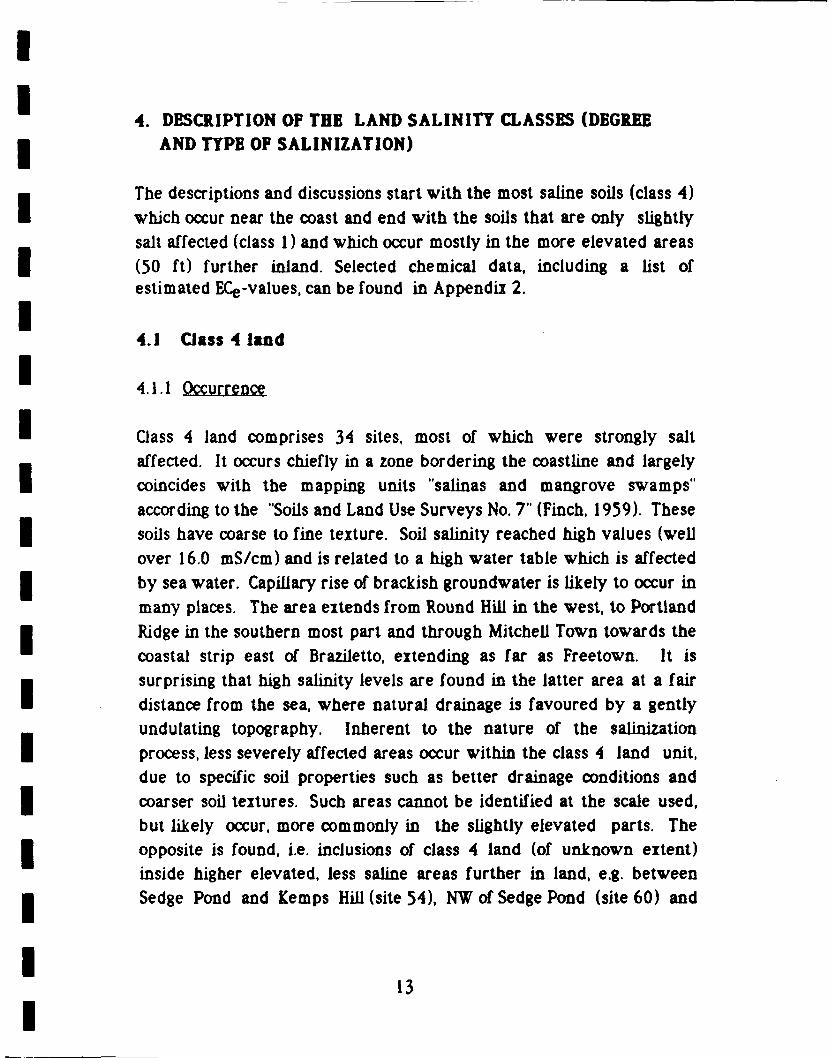
4. DESCRIPTION OF THE LAND S AL IN ITT CLASSES (DEGREE AND TYPE OF SALINIZATION)
The descriptions and discussions start with the most saline soils (class 4) which occur near the coast and end with the soils that are only slightly salt affected (class 1) and which occur mostly in the more elevated areas (50 ft) further inland. Selected chemical data, including a list of estimated ECe-values, can be found in Appendix 2.
4.1 Class 4 land
4.1.1 Occurrence
Class 4 land comprises 34 sites, most of which were strongly salt affected. It occurs chiefly in a zone bordering the coastline and iargely coincides with the mapping units "salinas and mangrove swamps" according to the "Soils and Land Use Surveys No. 7" (Finch, 1959). These soils have coarse to fine teiture. Soil salinity reached high values (well over 16.0 mS/cm) and is related to a high water table which is affected by sea water. Capillary rise of brackish groundwater is likely to occur in many places. The area eitends from Round HUI in the west, to Portland Ridge in the southern most part and through Mitchell Town towards the coastal strip east of Braziletto, eitending as far as Freetown. It is surprising that high salinity levels are found in the latter area at a fair distance from the sea, where natural drainage is favoured by a gently undulating topography. Inherent to the nature of the salinization process, less severely affected areas occur within the class 4 land unit, due to specific soil properties such as better drainage conditions and coarser soil teitures. Such areas cannot be identified at the scale used, but likely occur, more commonly in the slightly elevated parts. The opposite is found, ie. inclusions of class 4 land (of unknown eztent) inside higher elevated, less saline areas further in land, e.g. between Sedge Pond and Kemps Hill (site 54), NW of Sedge Pond (site 60) and
13
west of Sandy Gully (site 166). Gass 4 land may also occur in other places, namely where poor quality irrigation water is used, e.g. Cockpit Spring/Canal water which has EC-values of over 2000 mS/cm (Tollenaar, 1985).
4.1.2 Salirmatirm pattern and Deeree of Salinitv
In 16 out of 33 profiles, saiinity was found to increase with depth, in 12 profiles saiinity decreased with depth, while in 5 profiles there was no clear pattern. Fifteen profiles belonged to salinization type 5 and 18 profiles to salinization type 6. Four (4) profiles were only slightly saline throughout (ECe 4.0-8.0 mS/cm). In the other profiles saiinity reached moderate to strong levels (ECe o v e r 80 *&& M>.0 mS/cm respectively) at some depth, often in association with a slightly saline topsoil. In two profiles (sites 5 and 230) a non saline deep subsoil (ECe l e s s l n a n 5-0 mS/cm) occurred in combination with a moderately to strongly saline top layer of 60-80 cm thickness. On the basis of the salinization pattern these 2 profiles might be arranged under class 2B. However, the high saiinity of the topsoil and its consequences for agricultural use justifies the inclusion of the profiles in class 4.
4.1.3 Salt Composition
Sulphate plus bicarbonate occurred in the deep subsoil. Some of the soil layers contained appreciable amounts of gypsum, viz., sites 1, 108, 133, 216B, 233 and 271.
4.2 Class 3 land
4.2.1 Occurrence.
The number of profiles with a non-saline topsoil of 20-40 cm thickness totalled 39. They are mainly found further inland (adjacent to the class 4 land zone) where drainage conditions are somewhat better ie., between LionelTown and Mitchell Town, extending south and also
14

south westwards; also along the Milk River extending from the coast northwards as f ar as Cherry HUI and finally in the area north of the line Springfield - Kemps Hill as f ar as Sandy Gully. Most of the soils of class 3 land are heavy cracking clay soils, such as Agualta Clay (ms 104; Finch, 1959) which is the dominant map unit in the southern part of the South Clarendon Plains.
Salinization is likely to have been caused by a combination of factors, viz. poor internal drainage of the soils and high water tables. The poor internal drainage may be favoured by the occurrence of sodic sub soils in places. The use of poor quality irrigation water (e.g. Cockpit Spring) may have contributed to salinization more recently. Continued use will certainly further deteriorate the present situation.
4.2.2 Saliniyation Pattern and Deeree of Salinity
Salinization throughout the soil profiles can be characterized as salinization type 4. Estimated ECe-values in the 0-20 cm layer varied between 0.95 and 4.05 mS/cm. In the top layer of 12 profiles ECe-values were between 2.50 and 4.05 mS/cm (5 profiles near and in the coastal zone and 7 profiles further inland) indicating a pronounced salinity hazard. Sub soil salinity mostly increased with depth, with the highest ECe-values in the 80-100 cm layer (25 profiles) or in the 40-60
cm layer (11 profiles). It should be noted that the actual salinity patterns may be somewhat different as no data for the 20-40 and 60-80 cm layer(s) were available. In the subsoil ECe-values varied between
4.0 toover 16.0 mS/cm (in 20 profiles 4.0-8.0 mS/cm; in 15 profiles 4.0, 8.0-16.0 mS/cm; in 4 profiles equal to or over 16.0 mS/cm). The highest subsoil salinity (over 16.0 mS/cm) was found in the coastal zone at elevations below 50 ft, adjacent to class 4 land. Moderately and slightly saline subsoils appeared to be distributed rather equaily between the coastal zone and the areas further inland at elevations over 50 ft.
15

4.2.3 Salt Composition
Sodium was the dominant cation (i.e. over 50% of the sum of cations) throughout 26 out of 39 profiles and was also generally dominant in the saline subsoils of the other 13 profiles. Calcium and magnesium were dominant throughout in profile 258, in which also gypsum was found. Calcium and magnesium were also dominant in the top 20 cm of 6 profiles and in the 80-100 cm layer of 4 profiles. Chloride was dominant throughout 3 profiles only (61, 118. 150). while chloride dominance was also found in 19 profiles below a depth of 40 cm. In 9 profiles suiphate plus bicarbonate were dominant throughout. Gypsum was found in 5 profiles, below 40 or 80 cm depth, in both "coastal zone" (C) and "inland" soils (I).
4.3 Class 2 land
In land salinity class, two (2) sub-classes have been recognized based on the two different salinization types:
2A: Subsoil salinization: top 0-60 (-80) cm non-saline; deep subsoil saline (ECe over 4 mS/cm); salinization type 2 (26 sites).
2B: Tonsnil saliniy.atinn: top 0-20 (-60) cm salt affected (ECe over 4.0 mS/cm); non-saline below these depths; salinization type 3(12 sites).
4.3.1 Occurrence
Class 2A land occurs in some areas adjacent to the coastal zone, e.g. where the Rio Minho flows into the sea, west of the Alley, in several places at the front of the Braziletto Mountains (Raymonds - Hayes), north east of Mumby and much further inland, along the Jacks or St. Anne's Guliy.
16
4.3.2 Salinization Pattern and Deeree of Saiinity
Most profiles showed ECe-values to increase over 4.0 mS/cm in the 80-100 cm layer only. However, there were a few circumstances, in which the salinization patterns might have been included in type 3 (e.g. site 40), or in type 1 (e.g. sites 95, 167). It is clear that within class 2 land, inclusions of class 1 or class IS occur, and vice versa. Topsoil saiinity ranged between 0.40 and 355 (to 4.50) mS/cm. ECe-values between 2.50 and 4.0 mS/cm were found in 3 topsoils only. In the deep subsoil (80-100 cm) estimated ECe-values varied between 4.0 and 9.15 mS/cm unlike to the circumstances in class 3 - where moderately to strongly saline subsoils are found, the "moderately saline" level occurred in 3 profiles only.
433 Salt Composition
In 7 out of 26 profiles sodium was the dominant cation throughout. In mosi of the other profiles sodium was dominant below 40 cm depth; calcium and magnesium were dominant between 0 and 60 cm in 12 profiles. Generally, sulphate and bicarbonate were the dominant anions. Chloride was of much less importance than in class 3 soils of land saiinity class. In 5 profiles, chloride dominated below 40 cm in association with reiativeiy high sodium concentrations.
4.4 Class 2B land
Whereas in the St. Catherine Plains salinization type 3 was found at a few sites only, it appeared to be more common in the South Clarendon Plains (12 profiles). It occurs both "inland" in better drained places, as well as in poorly drained coastal areas.
Salinization type 3 is likely to have been caused by the use of poor quality irrigation water as there is no evident reason for topsoil salinization, e.g. as a result of capillary rise of water with reiativeiy high
17
conductivities in association with high water tables. Also, the better drainage conditions, which eiist in the areas where type 3 is found, support this view. Under these conditions, salts are more likely to be washed out from the surf ace layers rather than accumulate.
4.4.1 Salinization Tvpe and Degree of Salinitv
In all profiles the highest estimated ECe-values were found in the top 0-60 cm,ranging from 4.0 to 565 mS/cm, whereas deep subsoil conductivities were between 0.55 and 3.85 mS/cm. In 8 subsoils out of 12, salinization hazard was established (EQ between 2.5 and 4.0 mS/cm).
4.4.2 Salt Composition
Sodium was the dominant cation throughout in 6 out of the 12 profiles. In 2 (or 3) profiles calcium plus magnesium was dominant (99, 100 and 197). Chloride was dominant throughout 2 profiles (116 and 140). Chloride concentrations were higher than in the soils of class 2A. Gypsum occurred in 3 profiles (26, 99, 146) in the 40-60 cm and 0-20 cm layers (2x). The latter was rather exceptional, indicating that the salinization process in these profiles is different from the situation elsewhere in the Plains, where gypsum is normally found in the (deep) subsoil.
4.5 Class 1 land and class IS land
As the soii profiles of class 1 land have been defined as non-saline throughout, they would have been left out of the discussion. However, contrary to class 1 land in St. Catherine, salinity hazard has been recorded frequently in South Qarendon. For this reason class 1 has been divided into class 1 (non-saline throughout, ECe-values less than 2.5 mS/cm and class IS (non-saline throughout, ECe-values between 2.5 and 4.0 mS/cm in some part of the profile but within 100 cm depth).
18

4.51 Occurrence
Tbe major areas in which class 1 land occurs are in tbe zone parallel to tbe coast, between the Milk River and Mumby, and a large area around Lionel Town, eïtending north towards to the Braziletto Mountains. Elsewhere in the Plains class IS profiles occur scattered and alternate with class 1 and 2 profiles. A number of IS profiles are found in the Lime Savanna in the northern part of the Plains adjacent to the Jack's or St. Anne's Gully area in which mainly class 2 profiles are located. The class IS profiles with salinization hazard in the top 20 cm were concentrated in the area between Lionel Town and the Braziletto Mountains, in association with a number of class 2B profiles (salinization type 3). As for the origin of the salinity in class IS land, irrigation practices are to be regarded as the major cause since most of the class IS profiles are found at elevations over 50 ft where ground water is deep.
4.5.2 Salinization tvpe
In 28 profiles, the highest ECe-values were found in the topsoil with ECe decreasing with depth. In 25 profiles ECe-values increased downwards, while in 2 profiles there was no clear trend.
4.5.3 Salt Composition
Sodium was the dominant cation in 15 profiles throughout and in 21 profiles below 40 cm depth appeared to be more often dominant than in class 2A profiles. Generally, bicarbonate and sulphate were the dominant anions in most profiles. However, chloride was dominant in 24 profiles at some depth between 0 and 100 cm. In three profiles chloride was dominant throughout (7, 114 and 129) in association with dominance of sodium. Chloride appeared to be more important in class IS land than in class 2A land, which again supports the idea that salinization hazard in class IS is a reality in certain areas and that utmost care is required with irrigation practices, i.e. avoiding the use of poor quality water.
19
5. DISCUSSION. CONCLUSIONS AND RECOMMENDATION
From the descriptions of the 5 salinity land classes (1, IS. 2A, 2B, 3, 4) it appears that salinization in the South Clarendon Plains has to be considered as a serious constraint to agricultural production. Out of 252 sites investigated 166 (approiimately 66%) appeared to be salt-affected to a greater or lesser extent. The most strongly affected soils, which are saline throughout, have been grouped in land salinity class 4 (34 sites, approximately 13% of the total number of sites). Class 3 comprised soils with a salt-free topsoil of 20-40 cm thickness (39 sites. 15%). Class 2 soils were less strongly affected and were marked by either a 0-60 (-80) cm thick non-saline topsoil (class 2A. 26 sites. 10%) or a saline topsoil of 20-60 cm thickness with a non-saline sub-soil (class 2B, 12 sites 4%). Class IS which has salinity hazards, has been recognized at 55 sites, (22%). Finatly, there was no salinity hazard (class 1) in 34% of the area.
In the preceding chapters some references were made to the factors which may be responsible for salinization in the Clarendon Plains. Whereas in class 4 and part of class 3 lands, the sea may have an influence on the salinization process (brackish ground water at shallow depth), this factor is likely to be of less importance or no importance at all for soils further inland at elevations above 50 ft where drainage conditions are somewhat better. Due to the occurrence of salinization hazard, one can conclude that other factors must be responsible, namely the use of poor quality irrigation water. Shaw (1982) also mentions this fact as a cause for the increase in salinization observed in the area. He also considers that the number of dry years during the 1970's had favoured salinization. Heavy rainfall would have had a desalinization effect, especially in the topsoil.
Tollenaar (1985) gives data about salinity of the Cockpit Spring and Cockpit Spring Canal; this water is used at present for irrigation in the south-east of the Clarendon Plains.
20
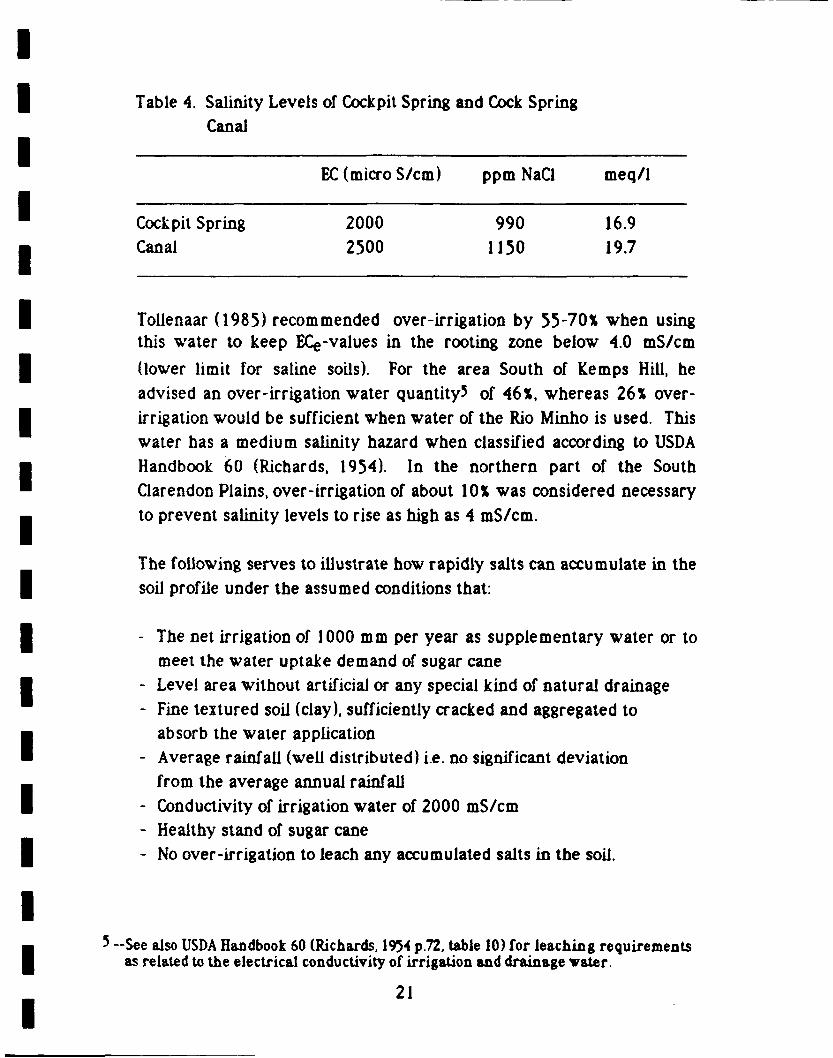
Table 4. Salinity Levels of Cockpit Spring and Cock Spring Canal
EC (micro S/cm) ppm NaCl meq/1
Cockpit Spring Canal
2000 2500
990 1150
16.9 19.7
Tollenaar (1985) recommended over-irrigation by 55-70% when using this water to keep ECe-values in the rooting zone below 4.0 mS/cm
(lower limit for saline soils). For the area South of Kemps Hill, he advised an over-irrigation water quantity5 of 46%, whereas 26% over-irrigation would be sufficiënt when water of the Rio Minho is used. This water has a medium salinity hazard when classified according to USDA Handbook 60 (Richards, 1954). In the northern part of the South Clarendon Plains, over-irrigation of about 10% was considered necessary to prevent salinity levels to rise as high as 4 mS/cm.
The foilowing serves to illustrate how rapidly salts can accumulate in the soii profiie under the assumed conditions that:
- The net irrigation of 1000 mm per year as supplementary water or to meet the water uptake demand of sugar cane
- Level area without artificiai or any special kind of natural drainage - Fine textured soil (clay), sufficiently cracked and aggregated to
absorb the water application - Average rainfall (well distributed) i.e. no significant deviation
from the average annual rainfall - Conductivity of irrigation water of 2000 mS/cm - Heaithy stand of sugar cane - No over-irrigation to leach any accumulated salts in the soil.
5 -See also USDA Handbook 60 (Richards, 1954 p.72, table 10) for leaching requirements as related to the electrical conductivity of irrigation and drainage vater.
21

A conductivity of 200 micro S/cm corresponds approximately with a salt concentration of 1,000 mg NaCl/litre -1 gram/1 (as NaCi). For 1.000 mm irrigation water per square metre this means that 1,000 grams of salt are to be absorbed per 1 ffi2. If the salts are evenly distributed throughout the upper 150 cm of the profile (which is unlikely), and the bulk density of the soil is 1.4 g/cm3, this would result in 1,000 g salt per 2,100 kg of soil, i.e. approximately 0.5 g of salt per kg soil which equal 0.05 % (by weight). After 10 years, the amount of salts accumulated would theoretically amount to 0.5%. At a saturation percentage of 50% by weight (which is very high) this would result in a conductivity of the saturation eitract of the soil (ECe) of approximately 16.0 mS/cm, i.e.
strongly saline (see Richards 1954, p.17). At lower saturation percentages, eg. 30-40% (weight), which are more realistic, the ECe
would even be higher. Of course, rainfall and irrigation water applied will wash the salt partlv down. Also, natural drainage will contribute to the removal of salts. However, because of the evapo-transpiration of the soil and erop, an important part of the accumulated salts will stay in the upper 150 cm of the profile and will rather accumulate near the surf ace than at greater depth. This is due to the (net) upward flow of the soil moisture caused by evapo-transpiration from soil and erop. During rainy periods the moisture movement may be downwards again. During the dry season the movement will be upwards most of the time and accu mulation of salts in the upper layer of the profile will take place again. An excess of good quality irrigation water will be needed to leach the salts and to keep them at a lower level in the profile where they can be carried further downwards by unsaturated moisture transport. The ieaching or washing-out process in the heavy cracking clay soils of South Garendon (e.g. Agualta clay) should take place when the soil has sufficiently dried out and has cracked to depths of 50 cm or more. Salts tend to accumulate along the cracks and can be washed down efficiently when water is applied. When this soil is moist, its internal drainage is very slow because most of the larger cracks and pores are closed due to the swelling of the soil aggregates/material. The latter will be even more pronounced if the soil has a high percentage of exchangeable sodium
22

(sodic soiJ) and if the exchangeable sodium percentage (ESP) amounts to 15 or more. The latter can be eipected to occur in many places in salinity land classes 3 and 4, although the pH-values measured were mostly not indicative of high ESP-values6- The shrinkage and swelling of the clayey soil material is unfavourable for leaching many of the soils in South Qarendon. Once they have become moist and the surface layer has swoilen, the subsoil wili only be partiy wet by rain, floods or irrigation water. This means that soils with saline sub soils are hard to reclaim. If the salt concentrations are high (e.g. ECe-values over 16.0
mS/cm) the use of good quality irrigation water or the penetration of rain water may cause swelling. To improve the soil structure (and the permeability), gypsum should be added to the irrigation water, especially if high ESP-values occur. The best way of managing the heavy clay soils is therefore to prevent them from becoming saline. This means that no irrigation water should be used with EC-values over 750 micro S/cm. Over-irrigation should be applied with proper drainage infrastructure in place. It should be of first priority to maintain the very low salinity status of the non-saline soils (land salinity class 1 and IS) and special attention should be paid to the soils with a "salinity hazard' (ECe-values between 2.5 and 4.0 mS/cm). It should be
emphasized that "problem soils," as far as salinity is concerned, are generally the (very) fine teitured soils (often Vertisols) which belong to the oid alluvial deposits. The strongly saline soils of the salinas and swamps
6 — Earlier studies made of comparable soils in St. Catherine indicated that high ESP values were not accompanied by high pH-vaiues (over 8.5). which is normally the case in sodic soils. Both in the St Catherine Plains and in the South Clarendon Plains pH-values over 9.0 were found to be relatively rare.
23
cannot be considered as "problem soils" in this sense as they cannot economicaily be used for agriculture7 and are difficult to reclaim. The recent alluvia] soils which are found along the rivers do not have the unfavourable internal drainage characteristics of the old alluvial, cracking clay soils. They are also less fine textured and well drained, most of the time. They are, for the greater part, non-saline and are likely to remain like that if ground water tables are kept sufficiently low and adequate drainage is put in place and over-irrigation is done.
7 —Certain types of aquaculture such as shrimp cuitivation in brackish vater do of course. oot fali under this category.
24

6. RECOMMENDATIONS ON THE USE OF THE LAND SALINITT CLASSES DISTINGUISHED AND ON THE IMPROVEMENT OF THEIR PRESENT SALINITY STATUS
6.1 Class 1 land
As far as salinity is concerned, the land is suitable for most crops. Irrigation water should be of good quality (EC-values less than 750 (-1000) micro S/cm). If the EC-values are near the upper limit (i.e. 1000 micro S/cm) an over irrigation of about 20% should be applied and an adequate drainage system should be in place or be implemented (open drains).
6.2 Class IS land
Although this land is very slightly salt-affected in some part of profiles, most crops that are not sensitive to chloride or sodium can be grown satisfactorily. As far as irrigation is concerned, the same rem ark s can be made as those for class 1, however, more over-irrigation will be necessary. Drainage conditions are more critical than for class 1 land, especiaily near the coast.
6.3 Class 2 land
Soils in this class have some constraints for many crops. Yield reductions up to 50% may occur for deep rooted crops (class 2A. deep subsoii salinization) and for shaliow rooted crops, such as vegetables (class 2B, topsoil salinization). Further increase of salinization should be prevented. The cost of prevention may be considerable. However, economie return in the long run should justify the expenditure. Quality of the irrigation water should be good, with EC-values preferably below 750 micro S/cm in order to improve the soil by adequate over-irrigation.
25

Additional over-irrigation will be required at EC-values of 750- micro S/cm to maintain the present salinity status. SAR-values8 should be low (less than 10) to prevent sodification and indirectly, lower permeability of the soils.
Over-irrigation should be applied to deeply cracked soils to ensure sufficiënt wetting throughout the profile. When properly managed, class 2A and 2B land of recent alluvial soils can easiiy be improved; however, for the heavy clayey, old alluvial soils this will be a more difficult and prolonged process. Under the present circumstances erop varieties or grass species that have medium salt tolerance should be selected.
6.4 Class 3 land
Soils in this class are seriously salt-affected. For the use of these lands two management choices may be made, viz:
(a) Prevent further deterioration- that is to keep the upper 20-40 cm of the soii non-saline. Use of irrigation water with EC-values over 1500 micro S/cm has to be avoided. Shallow-rooted or salt- tolerant crops (e.g. cotton, coconut) should be grown or land put in pasture (cattie ranching/ eitensive grazing).
(b) lm prove the present salinity status- intensive leaching accompanied by adequate drainage would be required. Irrigation water should be of acceptabie quality (EC less than 2000 micro S/cm) and be available in sufficiënt quantities at the right time. This may be a problem for certain areas. The drainage system (open drains) should be in place or constructed, which is costly. Soils with a very strong subsoil salinization may be improved step-wise; first by leaching soils with poor quality water, preferably with gypsum added accompanied by effective drainage to remove the excess of salts and to improve the soii structure. This will also lower any possible high ESP-values. Later on,
SAR x Sodium Absorption Ration - Na* x KCa2* • Mg2*)/21 - 1 / 2 . vith Na, Ca and Mg io meq/litre
26

after the ECe-values in the soil have reached acceptable values (below 8.0 mS/cm) better quality irrigation water if available, should be used to irrigate and to adequately over-irrigate, based on leaching requirements. This process should be monitored.
The reclamation process will be costly and require much time. Economie prospects to use this land should be favourable. Without any improvement measures, the clayey soils can be used for fish or shrimp ponds (salt tolerant species).
6.5 Class 4 land
üass 4 land is generally unsuitable for agricuiture except for better drained, less saline inclusions. Extensive grazing can be practised in areas wilh slightly salt-affected topsoil. Aquaculture can be practised for salt tolerant species. Desalinization and desodification will be hard to achieve and can only be done by stepwise and prolonged leaching. Reclamation of recent alluvial soils will be relatively easy. For old alJuvial soils this seems not feasible from an economie point of view. In the latter case drainage will be the most serious constraint.
Considering the remarks on soil salinity in the South Clarendon Plains which were made by Finch (1959) and Shaw (1982), one will notice that the salinity status in this area has not improved since. A further increase of salinity seems to take place. It is therefore recommended that another salinity survey should be undertaken in a few years' time, e.g. in 1989 or 1990 to establish a time series for proper monitoring. The network of observation points should be eitended or intensified, especially in the northern part of the Plains where irrigation will strongly influence the future salinity status. Finally, it should be interesting to assess the effect of f loods (e.g. June 1986, October 1987) on the desalinization of the clayey soils in order to establish the depth to which the soils have become non-saline. A limited number of well selected sites may already give some insight.
27

REFERENCES
Campbell. V.A.. Commissaris. A.T.L.M., and de Wit. H.A. 1986. Soil and Land-Use Survey of the Coastal Plains of St. Catherine, Jamaica. Rural Physical Planning Division (RPPD), Ministry of Agriculture, Jamaica.
de Wit. H.A. 1985- Preliminary results of a salinity survey carried out in the St. Catherine Plains. Internal report (memorandum), Rural Physical Planning Division, Ministry of Agriculture, Jamaica.
Finch. T.F., 1959. Soil and Land-use Survey No. 7, Jamaica, Parish of Clarendon. The Regional Research Centre - Imperial College of Tropical Agriculture, Trinidad, W.I.
Richards, L.A. (Ed), 1954. Diagnosis and improvement of saline and alkali soils. Agricultural Handbook 60. United States Dept. of Government Printing Office, Washington D.C., U.S.A.
Shav. M.E.A. 1982. As peet s of the management of salinity on swelling clay soils in Jamaica. Tropical Agriculture (Trinidad) Vol. 59 (2): 167-172.
Tollenaar. P. 1985- Quality of irrigation water in St. Catherine and Clarendon Plains. Internal report, R.P.P.D. Ministry of Agriculture, Jamaica.
Tollenaar. P. 1984. Cockpit Springs irrigation water. Internal report (memorandum), R.P.P.D., Ministry of Agriculture, Jamaica.
28
Appendix 1
Conversion Qf EC2.5 IQ ECg-values (mS/cm).
To arrive at the conversion factors for recalculating EC2.5 to ECe-values, the folioving applies:
Most soils in the survey area have fine clayey teiture and a bulk density of approiimately 1.50 g/cm3. The soils are assumed to contain about 40% moisture by weight at saturation, or approiimately 60% by volume. A 1:25 soil/water volume ratio was applied, which represents a 6.25 times dilution when compared with the moisture content at saturation. The decrease in salt concentration by dilution is more or less proportional to the rate of dilution, if the solubility of the salts present is not affected by the moisture content. Not considering the aaivity coefficients of the ions present - which is allowed at low concentration -this rule will apply to highly soluble chloride salts; therefore a conversion factor of 6 may be applied. At higher salt concentration, e.g. with ECe-values exceeding 4.0 mS/cm, the activity coefficients of the
ions and solubility of the salts present should be taken into consideration. The conversion factor will therefore be lower, especially if calcium and magnesium are present along with bicarbonate and sulphate ions. Conversion of EC2.5 to ECe-values requires special
attention in case of gypsiferous soils, as the solubility of pure gypsum (CaS04. 2H2O) is limited to 20-30 meq/1 corresponding with ECe-values
of 1.5-25 mS/cm.
These values are irrespective of the shaking ratio (within certain limits and without taking into account the presence of other salts, namely chlorides). In the latter case, the conversion factor will strongly depend on the concentration of other ions in solution. For the South Clarendon salinity survey, conversion factors were established for each individual sample analyzed and the above was taken into account.
29
Generally a faaor 5 times was used for samples with low EC25-values (e.g. 0.5 -1.5 mS/cm) provided the soil was f ree of gypsum; chloride and/or sodium formed the dominant anion and cation respectively. At higher EC2.5-values, the factors applied varied between 5 times and 2.5
times, depending on the amount of chloride present and the occurrence of gypsum. The ECe-values thus obtained have been indicated as "Estimated ECe-values."
30

Appendix 2
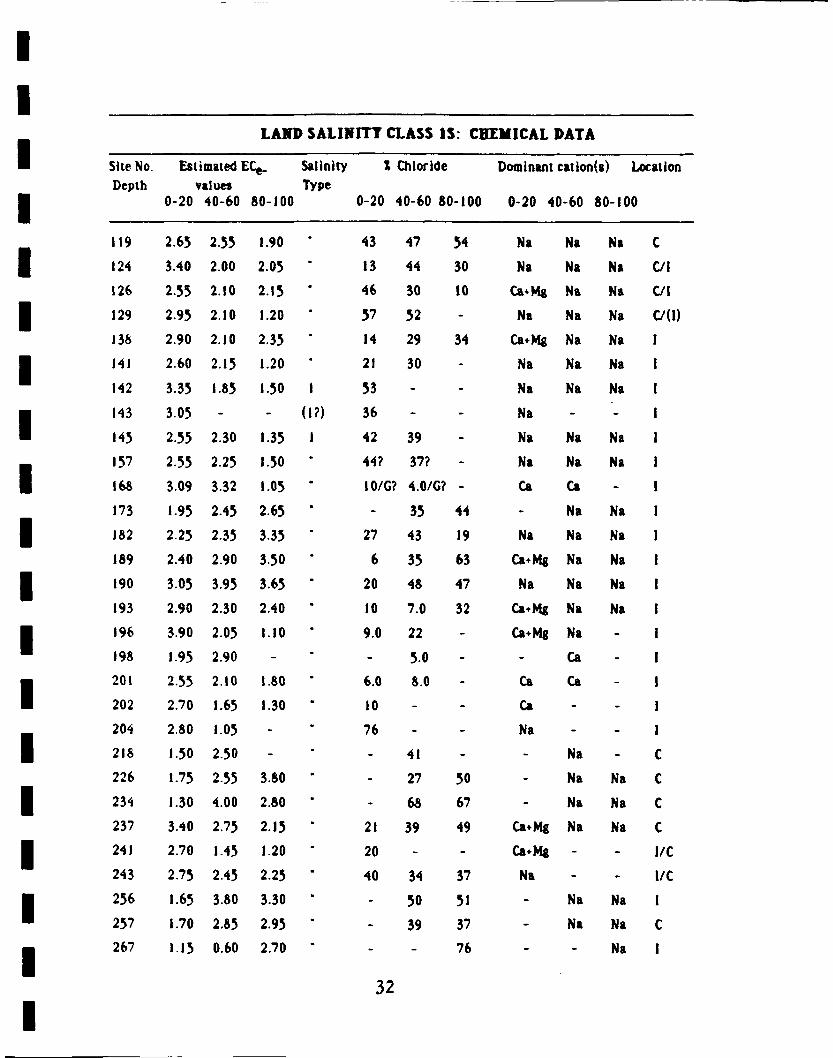
LAHD SALIMITT CLASS IS: CHEMICAL DATA
Site No. Estimated ECg. S&linity X Chloride Dominant cation(«) Locatioo Depth values Type
0-20 40-60 80-100 0-20 40-60 80-100 0-20 40-60 80-100
7 3.65 2.70 2.55 1 65 64 65 Na Na Na I
17 2.80 2.00 1.80 28 37 - Ca+Mg Na — C/(I)
18 1.40 2.40 3.45 - 24 53 - Na Na C/(I)
20 1.30 150 2.85 " - - 50 - - Na c 35 2.85 1.80 1.60 50 33 33 Na Na Na c 42 3.40 2.75 2.70 51 54 47 Na Na Na l/C
44 2.30 2.10 2.90 50 34 23 Na Na Na c 47 2.30 3.30 3.70 45 68 59 Na Na Na c 48 2.75 2.60 3.00 55 53 48 Na Na Na 1/(0
49 2.05 2.05 2.80 59 36 26 Ca*Mg Na Na 1/(C)
51 1.60 2.20 335 38 46 40 Ca* Mg Na Na l/C
52 3.90 3.30 1.70 48 62 58 Na Na Na l/C
53 3.60 150 1.20 14 30 19 Ca+Ms Na Na 1/(0
63 2.10 2.80 360 16 38 46 Ca Na Na 1
71 350 1.65 155 47 34 76 Ca+Mg Na Na 1
75 1.85 1.75 2.55 27 38 49 Ca* Mg Na Na I
78 2.60 2.45 2.70 69 36 14 Ca* Mg Na Na 1
83 2.40 2.60 3.85 25 23 39 Na Na Na 1
85 1.65 2.05 2.80 18 35 34 Ca* Mg Na Na l
86 1.60 1.70 3.05 11 17 24 Ca Na Na I
88 3.80 3.15 3.05 24 57 58 Na Na Na 1
104 2.65 3.00 360 30 31 36 Ca* Mg Na Na I/C
110 1.90 3.20 3.25 26 35 40 Ca* Mg Na Na c 114 3.55 2.65 3.25 56 50 53 Na Na Na c 115 2.65 2.35 115 43 43 70 Ca* Mg Ca* Mg Na c
I— I: Inland (usually above 50 feet)
C : Coasul zone (belov 50 feet)
31
LAND SALINITT
Site No. Estimaied ECg. Salioity ! Depth values Type
0-20 40-60 80-100 0-20
119 2.65 2.55 1.90 43
124 3.40 2.00 2.05 " 13
126 2.55 2.10 2.15 46
129 2.95 2.10 1.20 ' 57
138 2.90 2.10 2.35 14
141 260 2.15 1.20 21
142 3.35 1.85 150 53
143 3.05 - (1?) 36
145 2.55 2.30 1.35 42
157 2.55 2.25 1.50 44?
168 309 3.32 105 10/G?
173 195 2.45 2.65 -
182 2.25 2.35 3.35 27
189 2.40 2.90 3.50 6
190 3.05 3.95 365 20
193 2.90 2.30 2.40 10
196 3.90 2.05 1.10 90
198 195 2.90 - "
201 2.55 2.10 1.80 6.0
202 2.70 1.65 1.30 10
204 2.80 105 - 76
218 1.50 250 - "
226 1.75 255 3.80 "
234 1.30 4.00 2.80 "
237 3.40 2.75 2.15 21
241 2.70 145 1.20 20
243 2.75 2.45 2.25 40
256 1.65 3.80 3.30 "
257 1.70 2.85 2.95 "
267 1.15 0.60 2.70 "
32
LASS IS: CHEMICAL DATA
Chloride Dominant cation(s) Location
40-60 80-100 0-20 40-60 80-100
47 54 Na Na Na C
44 30 Na Na Na C/l
30 10 Ca* Mg Na Na C/I
52 - Na Na Na C/(I
29 34 Ca+Mg Na Na
30 - Na Na Na
- - Na Na Na
- - Na - -
39 - Na Na Na
37? - Na Na Na
4.0/G? - Ca Ca -
35 44 - Na Na
43 19 Na Na Na
35 63 Ca+Mg Na Na
48 47 Na Na Na
7.0 32 Ca* Mg Na Na
22 - Ca+Mg Na -
5.0 - - Ca -
8.0 - Ca Ca -
- - Ca - -
- - Na - -
41 - - Na - C
27 50 - Na Na C
68 67 - Na Na c 39 49 Ca*Mg Na Na c
- - Ca*Mg - - I/C
34 37 Na - - l/C
50 51 - Na Na 1
39 37 - Na Na c _ 76 - - Na I

LAND SALINITT CLASS 2 SITES: CHEMICAL DATA
Site No. Estimaied Ecc-values Salioity X Chloride Dominant cation(s) Location Depth Type
0-20 40-60 80-100 0-20 40-60 80-100 0-20 40-60 80-100
8 4.45 3.45 3.05 3 32 63 70 Na Na Na I/C
26 5.00 6.00 3.85 3 61 15/G 48 Na Ca Na I/C
27 4.80 2.90 2.05 3 48 35 26 Na Na Na 1/(0
28 1.50 2.10 6.04 2 - 39 3.5/C - Na Ca C/I
33 1.50 3.15 565 2 35 54 46 Na Na Na I/C
40 4.50 2.40 7.55 2/3 68 34 49 Na Ca* Mg Na I
45 0.90 1.40 6.85 2 9 22 46 Ca* Mg Na Na C
46 2.95 5.65 1.45 3 42 39 39 Na Na Ca* Mg C
55 3.20 5.20 3.00 3 33 75 32 Na Ca* Mg Na I
64 1.60 2.60 5.43 2 19 29 4.0/C Ca*Mg Na Ca I
90 1.50 195 515 2 7 15 32 Ca*Mg Na Ca 1
95 1.75 2.75 4.10 2 29 45 47 Na Na Na I
96 1.40 3.40 555 2 21 43 64 Ca*Mg Ca*Mg Na I
97 2.35 3.00 4.10 2 36 34 34 Na Ca*Mg Na C/l
99 >4.0 2.15 0.95 3 7.0/C 34 11 Ca Ca*Mg Ca* Mg C
100 1.70 1.75 >4.0 2 16 17 3.0/G Ca Ca* Mg Ca C
106 1.85 3.90 7.65 2 30 72 82 Ca* Mg Na Na C
116 5.45 4.90 3.75 3 100? 62 65 Na Na Na I/C
130 5.40 4.05 3.70 3 69 55 44 Na Na Na C
131 4.10 4.45 2.65 3 59 54 24 Na Na Na C
139 2.40 2.70 4.25 2 39 45 41 Na Na Na
140 4.35 3.25 4.30 3 60 68 73 Na Na Na
144 1.55 3.15 11.4 2 - 34 26/C - Na Ca
146 4.71 3.45 2.70 3 21 18 56 Ca* Mg Na Na
149 2.10 <4.0 - 2 23 32 - Ca*Mg Na -
167 2.10 1.85 4.15 2 13 - 41 Ca+Mg Ca*Mg Na
171 1.95 3.90 8.35 2 - 47 58 Ca* Mg Na Na
180 1.85 2.80 7.35 2 - 37 61 Ca*Mg Na Na
184 2.05 3.80 4.10 2 11 33 33 Ca Na Na
191 2.20 4.00 5.40 2 22 58 51 Na Na Na
33

LAXD SALINITT CLASS 2 SITES: CHEMICAL DATA
Site No. Estiiiuted Ece-values Salioity t Chloride Dominant cation(s) Location Depth Type
0-20 40-60 80-100 0-20 40-60 80-100 0-20 40-60 80-100
192 2.55 310 9.15 2 23 40 59 Ca* Mg Na Na
194 2.65 3.85 4.70 2 16 39 65 Ca* Mg Na Na
197 >4.0 115 0.55 3 25? - - Ca* Mg - -
205 0.40 4.70 3.95 2 - 75? 34 - Na Na
212 1 10 2.50 545 2 - 44? - - Ca* Mg? -
227 2.45 395 4.65 2 17 52 61 Na Na Na C/l
229 2.40 4.55 2.95 2/3 50 79 80 Na Na Na C/(I)
235 215 4.65 3.80 2/3 27 69 59 Na Na Na C/(I)
34
* ï
1/) IA < mi U
E mm mi <
s
8 3
~ «o
a o o -X»
1
9 ? < a
< § -20
O O e
_ o
•"• «O
5 o 6 ^
2= o.
3£
l O J » «O U o
•I
o z a>
i/5
— O <J O u u C) ^ ^ ^ O O O N J O N J O O
f 3E cd + a t a l a t a t g * t * a t a t a i a * o t < d a * a t a t
z £ z £ z z z z z z z z z z z z z z z
— <J O O O —i —
2 «d at rt 'T <d at
Z Z • Z i Z Z
z z z z z z z z z z z z z z M 06 cd 00
z z z z 2
, ? z z
f z z z
a t a t a t t d a t c a c d c d c d c d
z z z z z z z z z z
cd cd at at • at at Z Z Z Z ,3 Z Z
«d X at *d at Z *
- *_ «3 z — -«3 «3 «3
NO «o CM f^ — i r t < o i r t r > > A s o > A « o < « r i r t i r i s A r ^ — -ar ON
c r N . c M c M N D e r t O r ^ l ^ c M O N O r ^ o O - T C ' C i O N C O N O O O N —< r » - r * r > - i r s « * « C a o » o r » i r > r ^ i r > É r > * A ^ \ » f i i ^ r ~ f o > * « M
r- — <M «O
%*> r- r-r- <M f\
•x> « ' » c » « c « « » ï ' « r t « > i A T c > t , c r » o , q " » - , T ' « r i r » c > « ' < r « o
C l CO «A «O O CO — •«• «o r» «o c* w \ <«•
— o r» ON *o co. r* * IT| N V M « -
•<r
a o o o •r* i r » M-\ «r» i r » •r» •r» i r \ X o IT» O i r »
o O r̂ « r t v © s O <«•> s D o r» ÊT\ N O —• o N 0 CM i r \ «r\ X « 0 N O ao o O CM
— N © < M r» O •«r O N C ON i r » r» r>- NO •r» •er •er -<r •r\ r- 0 0 0 0 ^ N ON 1 N O N C — > i
*" ^ *™ mam "̂ •V T»? "̂ O CM o o o o O o o «r\ *-\ O l T \ O O O O
« 0 •er o « • • •«r «P» r* r- NO « 0 O » f » V CN ON ON o «o o tr> N O *r —• -^ N C o ON — < M w » r- | T \ N O v N A ON « 0 •«r •<r N 0 • « • T •O" o •r» — > « • <£> •er ' T o i r » O o •cr sO
*" • ^ ^ ^
O | T \ •r> •r» o i r » O •r» u\ o <=> • T N r\ e •r» o o M-\ «r\ «r\ o l T \ o «r\ i r » I T \ >r\ »T\ CM O o* r* r» CM ON ON o ON T\ 0 0 ON T ON *-\ ~ I T \ i r \ CM *« ^» T »o CM -* -cf 0 0
« M — — — — <M — — -er — CM CM < M CM «— « • > CM « • > — CM <M „ 0 " > CO. CM CM f O r*» CM
O C M T — r - » O N — C M O N C 3 - T r o * o « o - c r i r » i r > N C N o r » o o o o
QQ c M i r i O N c o g o o — N r r ~ - o o o c M i r t N O « r \ « r i

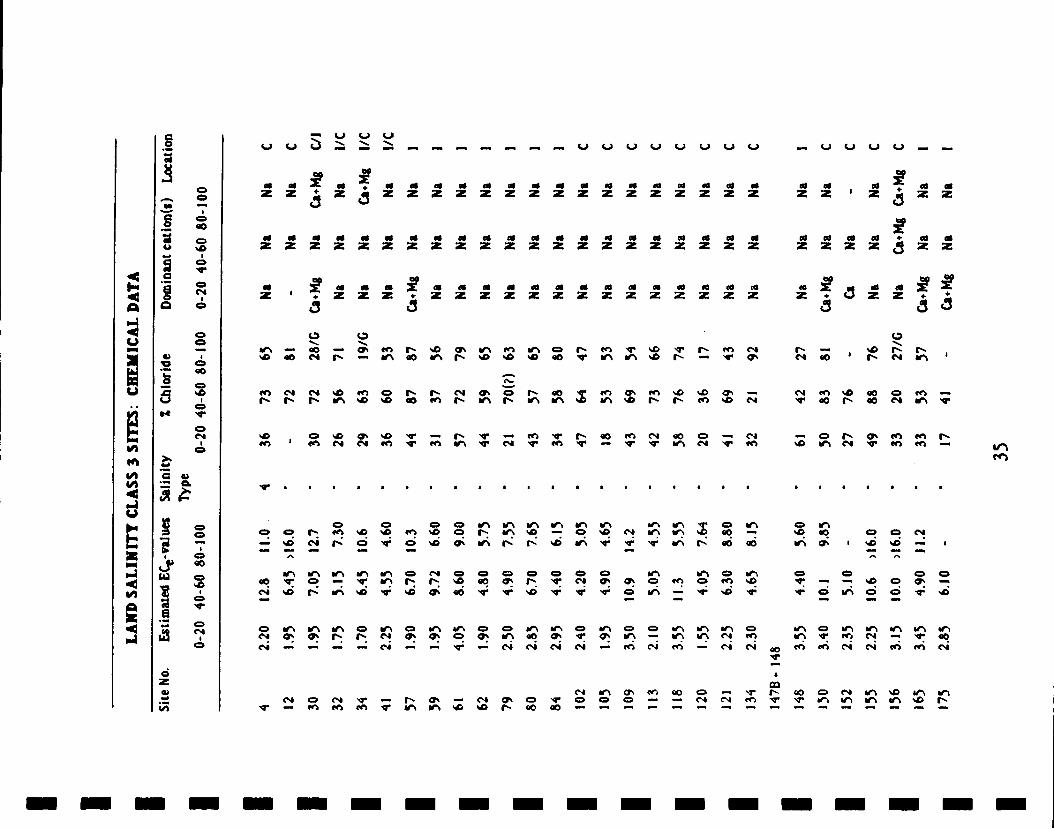
LAMD SALIMITT CLASS 3 SITES: CBEM ICAL PATA
Site No. Estimated EC^-values Depth
0-20 40-60 80-100
178 2.20 4.60 6.10
185 2.15 4.50 4.10
186 2.15 4.60 4.90
219 2.70 <I6.0 13.7
221 1.10 4.45 9-24
224 1.70 4.65 565
238 2.25 <16.0 11.2
254 125 4.45 >8.0
258 150 >4.0 >4.0
269 3.70 6.12 4.52
Salinity X Chloride Type
0-20 40-60 80-100
15 33 38
13 I9(?) 20
19 68 58
33 56 84
- 59 37
- 67 76
21 69 80
- 47 1 l/G
- 5.0/G 5.0/G
45? 30? 37?
Dominant catlon(s) Localion
0-20 40-60 80-100
Na Na Na 1
Na Na Na I
Na Na Na I
Na Na Na C/l
- Na Na 1
- Na Na C
Na Na Na c - Na Na I
Ca*Mg? Ca Ca c Na? Na? Na? 1
36
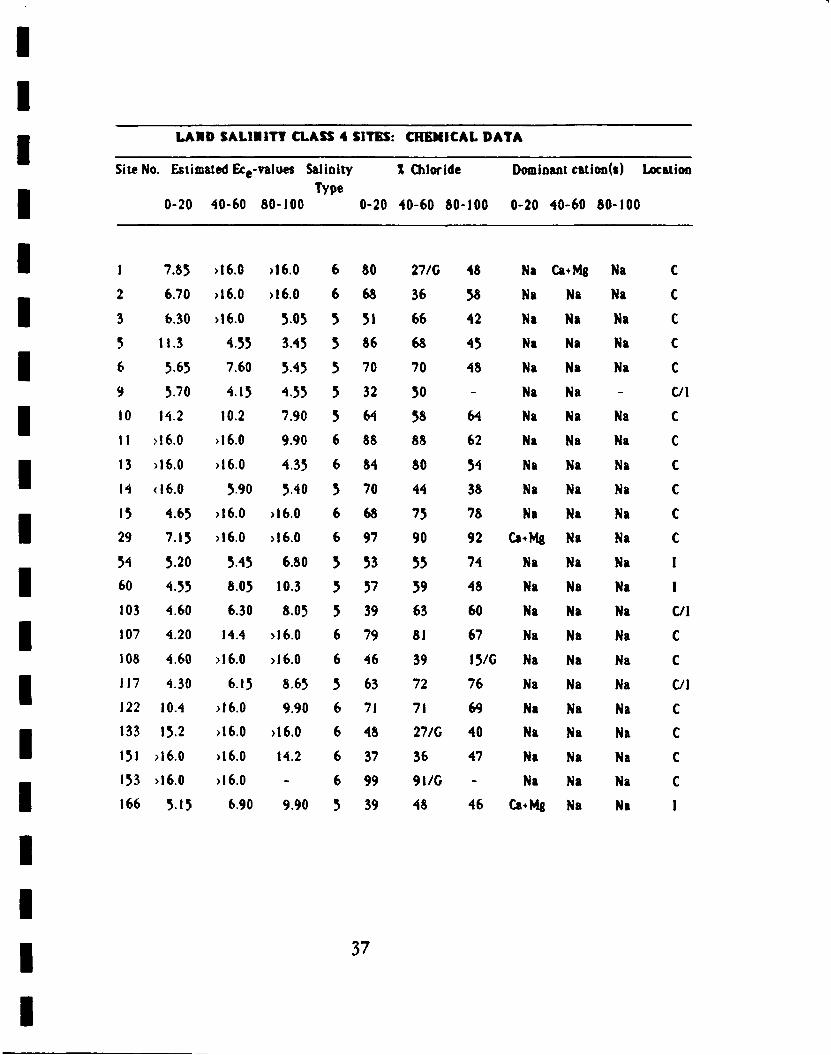
LAND SAL1BITT CLASS 4 SITES: CHEMICAL DATA
Site No. Estim&ted Ece-values Salioity X Chloride Dominant cation(s) Location Type
0-20 40-60 80-100 0-20 40-60 80-100 0-20 40-60 80-100
1 7.85 >16.0 >16.0 6 80 27/C 48 Na Ca* Mg Na C
2 6.70 >I6.0 >I6.0 6 68 36 58 Na Na Na C
3 6.30 >16.0 505 5 51 66 42 Na Na Na c 5 11.3 4.55 3.45 5 86 68 45 Na Na Na c 6 565 7.60 545 5 70 70 48 Na Na Na c 9 5.70 415 4.55 5 32 50 - Na Na - C/l
10 14.2 10.2 7.90 5 64 58 64 Na Na Na c 11 >16.0 >16.0 9.90 6 88 88 62 Na Na Na c 13 >16.0 >16.0 4.35 6 84 80 54 Na Na Na c 14 <16.0 590 540 5 70 44 38 Na Na Na c 15 4.65 >I6.0 >16.0 6 68 75 78 Na Na Na c 29 7.15 >16.0 >16.0 6 97 90 92 Ca+Mg Na Na c 54 5.20 545 6.80 5 53 55 74 Na Na Na I
60 4.55 8.05 10.3 5 57 59 48 Na Na Na I
103 4.60 6.30 8.05 5 39 63 60 Na Na Na C/l
107 4.20 14.4 >16.0 6 79 81 67 Na Na Na C
108 4.60 >I6.0 >16.0 6 46 39 15/G Na Na Na c 117 4.30 6.15 8.65 5 63 72 76 Na Na Na C/I
122 10.4 >I6.0 9.90 6 71 71 69 Na Na Na c 133 15.2 >16.0 >16.0 6 48 27/G 40 Na Na Na c 151 >I6.0 >16.0 14.2 6 37 36 47 Na Na Na c 153 >I6.0 >I6.0 - 6 99 91/G - Na Na Na c 166 5.15 6.90 9.90 5 39 48 46 Ca*Mg Na Na I
37

LAND SALIIITT CLASS 4 SITES: CHEMICAL DATA
Site No. Estimated Ece-values Salinity l Chloride Dominant cation(s) Location Type
0-20 40-60 80-100 0-20 40-60 80-100 0-20 40-60 80-100
216B 4.20 150 150 5 45 21/G 70 Na Na Na C
217 11.3 >16.0 >16.0 6 61 26 69 Na Ca* Mg Na C
220 9.15 >16.0 13.9 6 63 74 80 Na Na Na C/I
228 10.2 13.2 6.65 5 80 80 78 Na Na Na C/l
230 >16.0 8.52 3.35 5 64? 68 52 Na Na Na C/I
232 8.15 7.15 5.65 5 73 58 62 Na Na Na c 233 5.65 <16.0 >16.0 6 58 29/G 47 Na Na Na c 271 10.4 >I6.0 >16.0 6 81 39 28/C Na Na Na c 272 >16.0 - >16.0 6 31 - 56 Na Na Na c 273 10.9 >16.0 12.8 6 68 71 18 Na Na Na c
38

liSoSa.
SITE LOCATIONS, SALINIZATION TYPES CLARENDON PLAINS
S C A L E 5 0 0 0 0
o RURAL PHYSICAL PLANNING DIVISION
MINISTRY OF AGRICULTURE
HOPE GARUEKS
KINGSTON 6, JAMAICA
V ' .

II50S b
LAND SALINITY CLASS MAP CLARENDON PLAINS
MILK RIVER BAY
1
^AT.TTsJT^V C T . A S S E S
Class 1 . Non-saline throughout 0-100 era ( ECe less than 4mmhos/cra )
Class Is Non saline throughoul 0-100cm, bul ECe in some paris of Ihe prolile between 25 and 4.0 mmhos/cm.
Class 2 Non-saline frora 0-60cra or up lo 80cra and saline {ECe over 4mmhos/cm) below a deplh of 60-80cm (2A) or slighlly saline from 0-20cm or up lo 60cm and non-saline below a deplh of 20cra lo 60cm (2B)
Class 3 Non-saline frora 0-20cm or up lo 40 cm and saline below 20-40cra deplh
Class 4 . Saline throughoul 0-100cm, salinily generally increasing rilh deplh
Tenlative Salinily Boundary
L I M I T A T I O N S K O R A G R I C U L T U R E
Clabb 1 No limilalions for agncullurdl use as far as salinily is concemed
Class Is Slighl limilalions for agncullural use (sensilive crops) when irrigaled, good qualily irrigalion water in combinalion with adequate overnrigalion and drainage should be pracliced lo prevent furlhei delenoialion
Class 2 Moderate limilalions foi agncullurdl use for deep-rooling crops on soils with (decp) subsoil salinizalion (saltype 2A), for shallow rooled crops on soils with lop soil salinization (saltype 2B), when ii rigaled, use of good qualily irrigalion water in combinalion with adequate overiri igation and drainage is impemlive in order lo prevent further detenoidtion and lo improve on the present salinily stalus
Class 3 Severe limilalions,special and costly medsures bhould be taken to reclaira these soils; Ihe land m<iy be used for posture, some salt-lolerant crops undei good drainage or aquaculture •
/v A/ A/
/ V
MA1N R0AÜ (CLASS A)
UAIN R0AD (CUSS B)
ÜNCUSSIF1ED R0AD
PAR0CH1AL ROAD (U0T0RABLE)
PARISH BOUNDARY
v ÜPLANDS, H1LLS
S a l l n l t y Survey of the South C l a r e n d o n P l a l n s (1985) R P P D - MOA.
i *->-U
I Wagenlnet", The'1 l " ' *-"a" '* '«
E| RURAL PHYSICAL PLANNING DIV1SION
UJNISTRY OF AÜRJCULTURK
HOPE GAKDENS
KINGSTON 6. IAUAICA
rUA/RPPDÖ l»87