Embed Size (px)
Citation preview
Soil-Plant Inorganic Nitrogen
Buffering
Soil-Plant Inorganic Nitrogen
Buffering
W.R. Raun, G.V. Johnson, H. Sembiring, E.V. Lukina,
J.M. LaRuffa, W.E. Thomason, S.B. Phillips,
J.B. Solie, M.L. Stone and R.W. Whitney
OKLAHOMA STATE UNIVERSITY
94th ASHS International Conference
Salt Lake City, Utah, July 26, 1997
W.R. Raun, G.V. Johnson, H. Sembiring, E.V. Lukina,
J.M. LaRuffa, W.E. Thomason, S.B. Phillips,
J.B. Solie, M.L. Stone and R.W. Whitney
OKLAHOMA STATE UNIVERSITY
94th ASHS International Conference
Salt Lake City, Utah, July 26, 1997
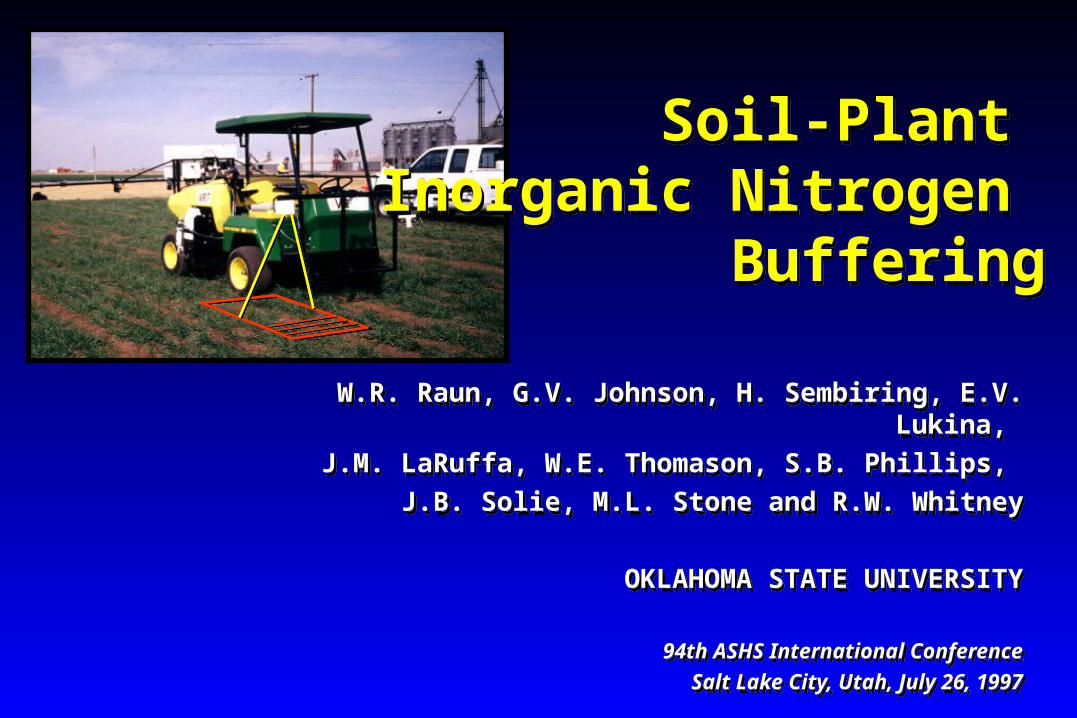
To evaluate the relationship between To evaluate the relationship between relative wheat grain yield and NOrelative wheat grain yield and NO33-N -N
accumulation as a function of applied N in accumulation as a function of applied N in soil profiles of long-term experiments.soil profiles of long-term experiments.
To evaluate the presence of inorganic N To evaluate the presence of inorganic N buffering in soils using linear-plateau and buffering in soils using linear-plateau and plateau-linear models of N rate versus plateau-linear models of N rate versus grain yield and soil profile inorganic N grain yield and soil profile inorganic N accumulation.accumulation.
Objectives:Objectives:Objectives:Objectives:
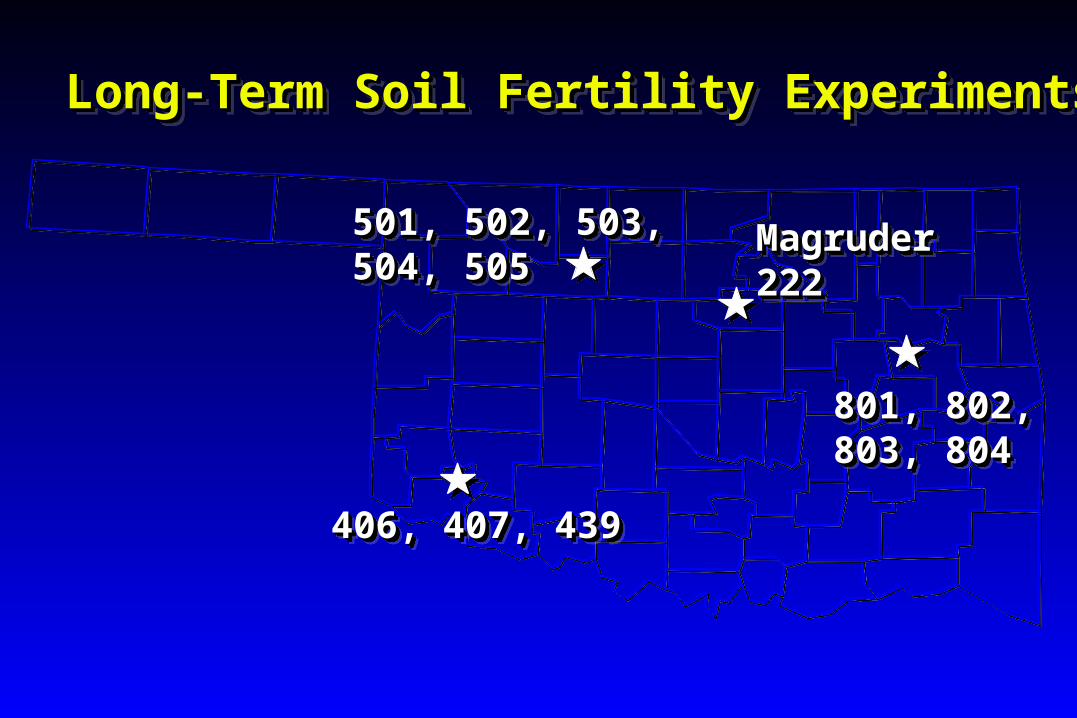
406, 407, 439 406, 407, 439 406, 407, 439 406, 407, 439
501, 502, 503, 501, 502, 503, 504, 505504, 505501, 502, 503, 501, 502, 503, 504, 505504, 505
MagruderMagruder222222MagruderMagruder222222
801, 802, 801, 802, 803, 804803, 804801, 802, 801, 802, 803, 804803, 804
Long-Term Soil Fertility ExperimentsLong-Term Soil Fertility ExperimentsLong-Term Soil Fertility ExperimentsLong-Term Soil Fertility Experiments
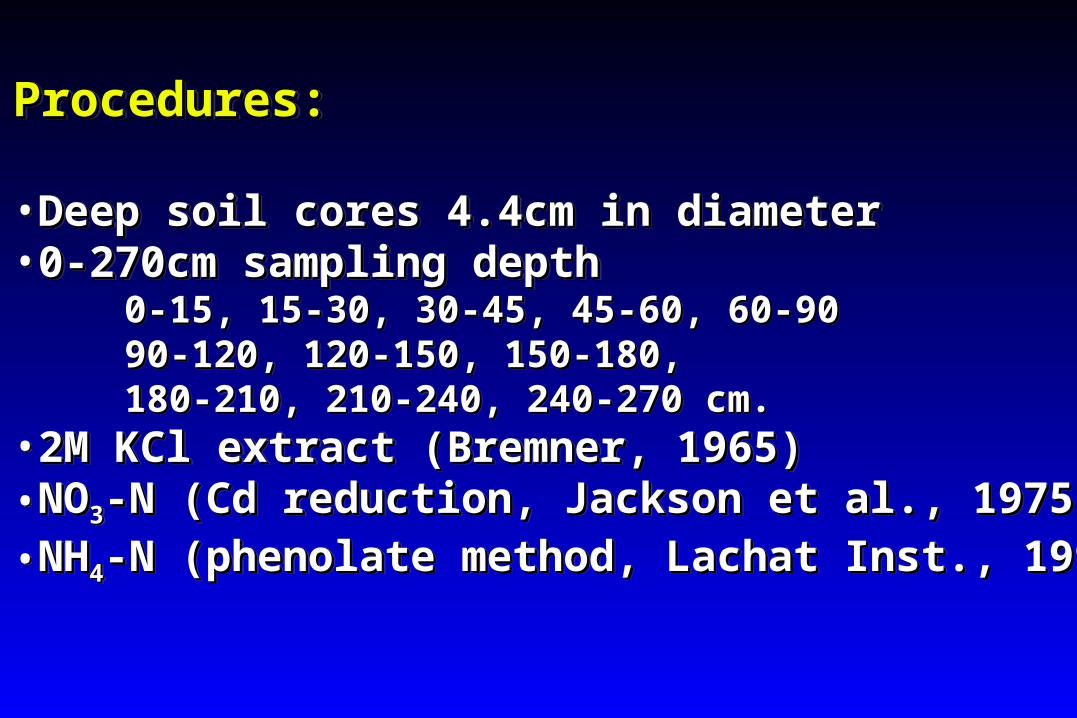
Procedures:Procedures: •Deep soil cores 4.4cm in diameterDeep soil cores 4.4cm in diameter•0-270cm sampling depth0-270cm sampling depth 0-15, 15-30, 30-45, 45-60, 60-900-15, 15-30, 30-45, 45-60, 60-90 90-120, 120-150, 150-180,90-120, 120-150, 150-180, 180-210, 210-240, 240-270 cm.180-210, 210-240, 240-270 cm.•2M KCl extract (Bremner, 1965)2M KCl extract (Bremner, 1965)•NONO33-N (Cd reduction, Jackson et al., 1975)-N (Cd reduction, Jackson et al., 1975)
•NHNH44-N (phenolate method, Lachat Inst., 1990-N (phenolate method, Lachat Inst., 1990
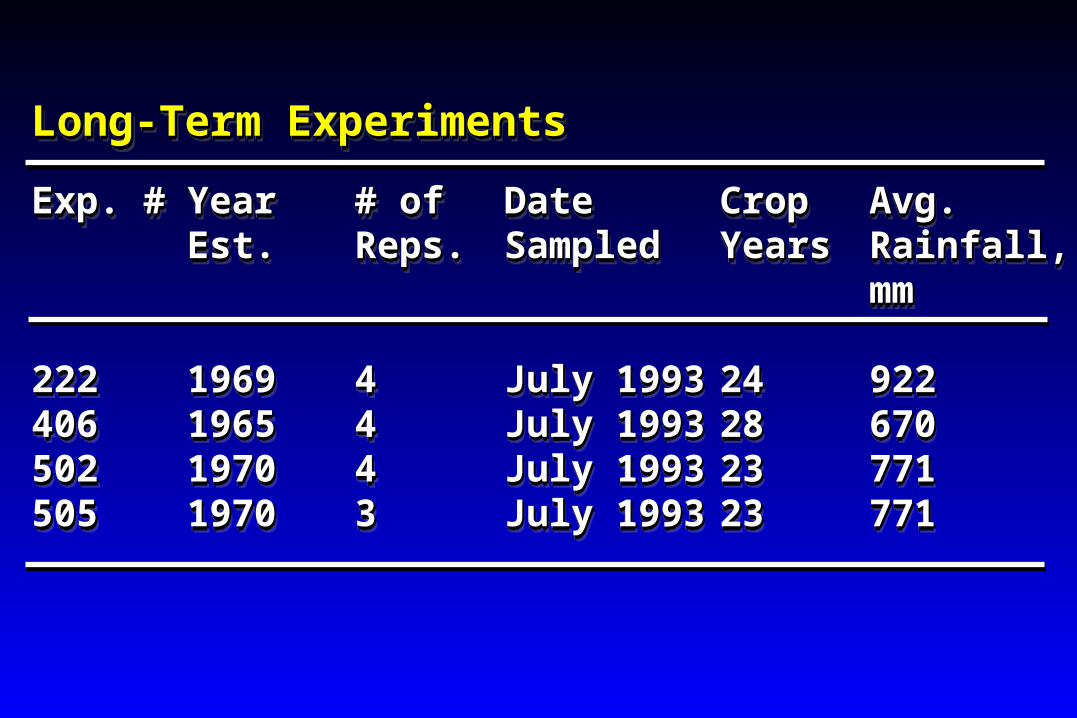
Long-Term ExperimentsLong-Term Experiments
Exp. #Exp. # Year Year # of# of DateDate Crop Crop Avg.Avg. Est.Est. Reps.Reps. SampledSampled YearsYears Rainfall,Rainfall, mmmm
222222 19691969 44 July 1993July 1993 2424 922922406406 19651965 44 July 1993July 1993 2828 670670502502 19701970 44 July 1993July 1993 2323 771771505505 19701970 33 July 1993July 1993 2323 771771
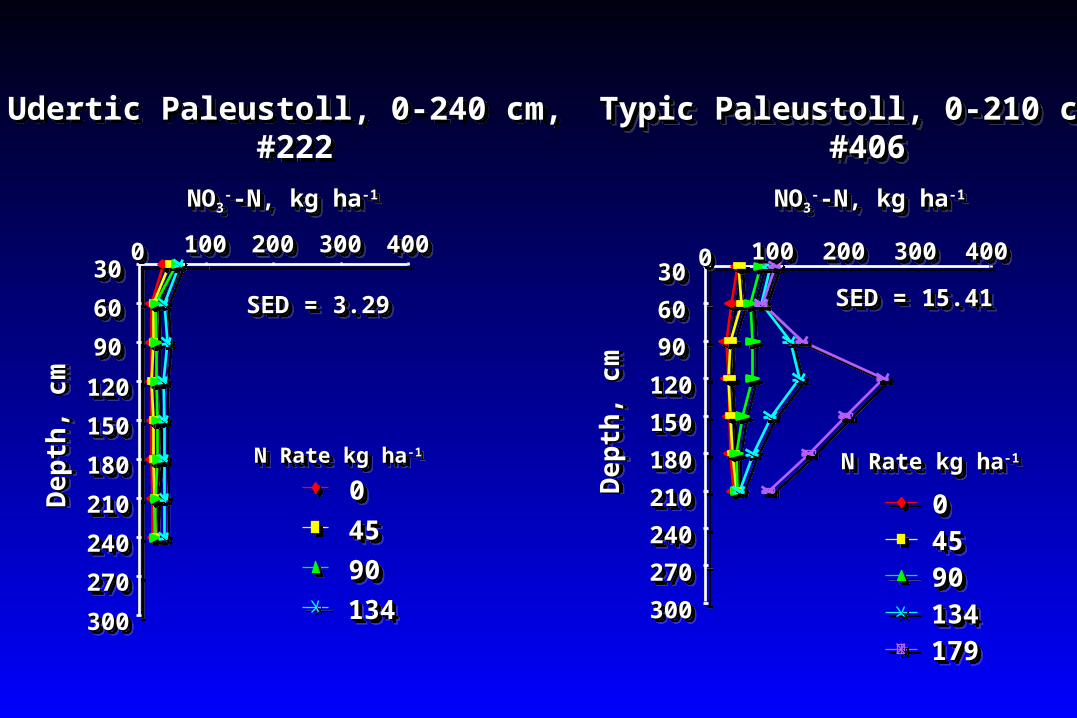
134134134134
0000
45454545
90909090
179179179179
0000 100100100100 200200200200 300300300300 40040040040030303030
60606060
90909090
120120120120
150150150150
180180180180
210210210210
240240240240
270270270270
300300300300
N Rate kg haN Rate kg ha-1-1N Rate kg haN Rate kg ha-1-1
SED = 15.41SED = 15.41SED = 15.41SED = 15.41
NONO33---N, kg ha-N, kg ha-1-1NONO33
---N, kg ha-N, kg ha-1-1
Typic Paleustoll, 0-210 cm, Typic Paleustoll, 0-210 cm, #406#406
Typic Paleustoll, 0-210 cm, Typic Paleustoll, 0-210 cm, #406#406
0000
45454545
90909090
134134134134
0000 100100100100 200200200200 300300300300 40040040040030303030
60606060
90909090
120120120120
150150150150
180180180180
210210210210
240240240240
270270270270
300300300300
N Rate kg haN Rate kg ha-1-1N Rate kg haN Rate kg ha-1-1
SED = 3.29SED = 3.29SED = 3.29SED = 3.29
NONO33---N, kg ha-N, kg ha-1-1NONO33
---N, kg ha-N, kg ha-1-1
Udertic Paleustoll, 0-240 cm, #222
Udertic Paleustoll, 0-240 cm, #222
De
pth
, cm
De
pth
, cm
De
pth
, cm
De
pth
, cm
De
pth
, cm
De
pth
, cm
De
pth
, cm
De
pth
, cm
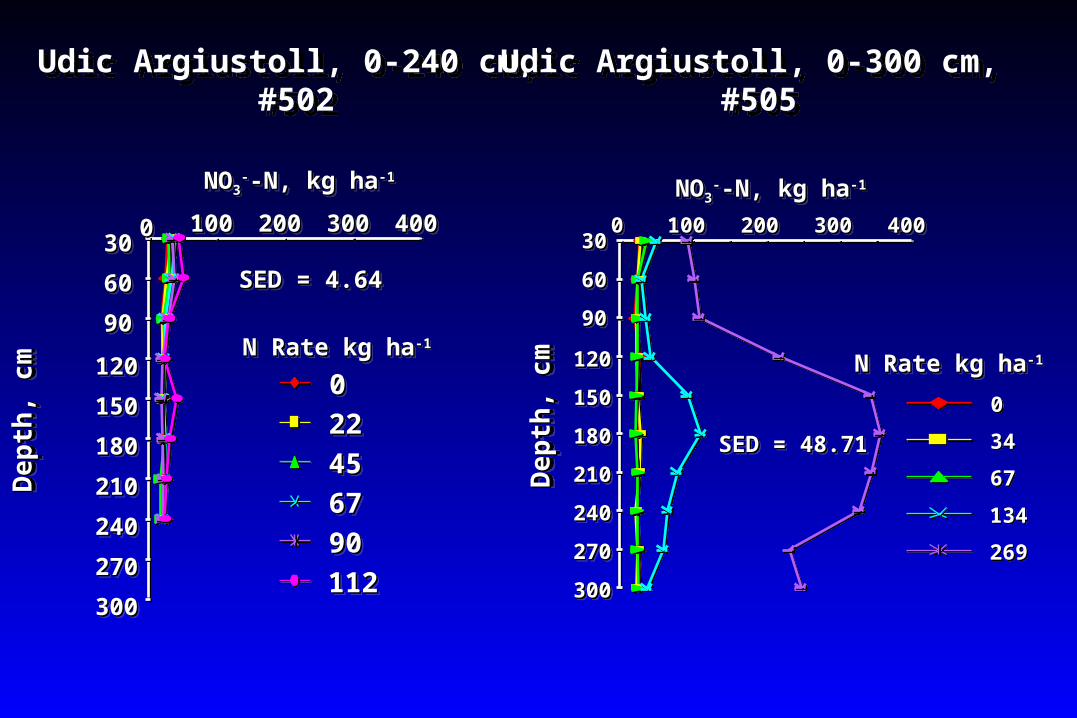
0000
22222222
45454545
67676767
90909090
112112112112
0000 100100100100 200200200200 300300300300 40040040040030303030
60606060
90909090
120120120120
150150150150
180180180180
210210210210
240240240240
270270270270
300300300300
NONO33---N, kg ha-N, kg ha-1-1NONO33---N, kg ha-N, kg ha-1-1
Udic Argiustoll, 0-240 cm, #502
Udic Argiustoll, 0-240 cm, #502
SED = 4.64SED = 4.64SED = 4.64SED = 4.64
N Rate kg haN Rate kg ha-1-1 N Rate kg haN Rate kg ha-1-1
00
3434
6767
134134
269269
N Rate kg haN Rate kg ha-1-1 N Rate kg haN Rate kg ha-1-1
0000 100100100100 200200200200 300300300300 40040040040030303030
60606060
90909090
120120120120
150150150150
180180180180
210210210210
240240240240
270270270270
300300300300
SED = 48.71SED = 48.71SED = 48.71SED = 48.71
NONO33---N, kg ha-N, kg ha-1-1NONO33---N, kg ha-N, kg ha-1-1
Udic Argiustoll, 0-300 cm, #505
Udic Argiustoll, 0-300 cm, #505
De
pth
, cm
De
pth
, cm
De
pth
, cm
De
pth
, cm
De
pth
, cm
De
pth
, cm
De
pth
, cm
De
pth
, cm
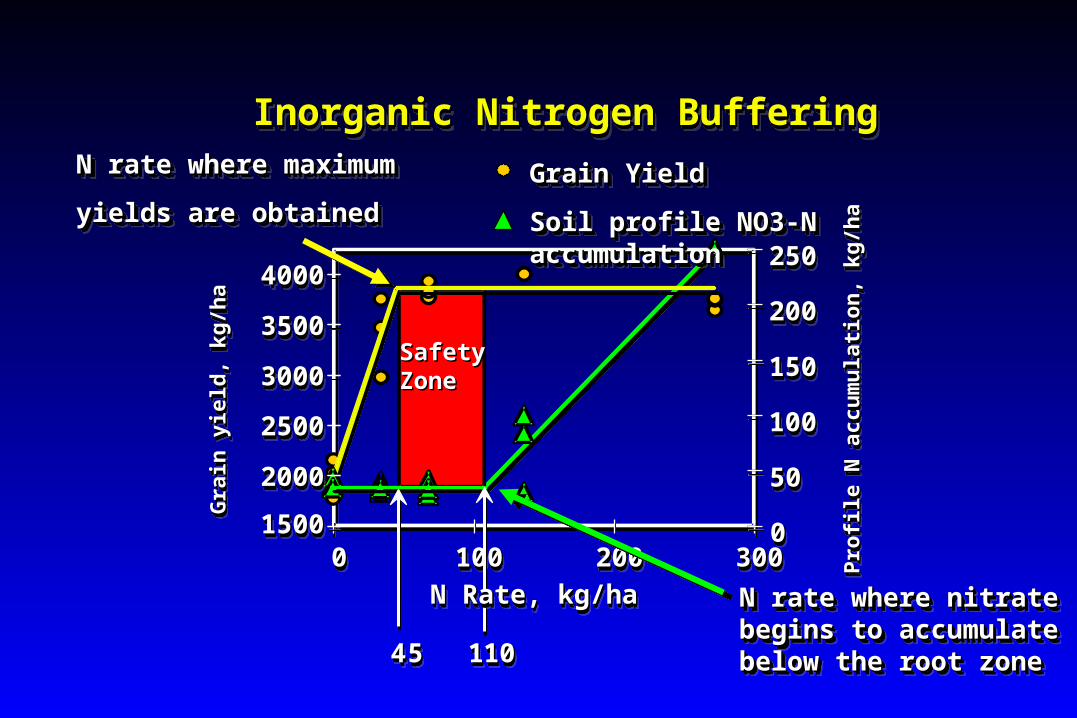
Ability of the soil-plant system to limit Ability of the soil-plant system to limit the amount of inorganic N accumulation the amount of inorganic N accumulation in the rooting profile when N fertilization in the rooting profile when N fertilization rates exceed that required for maximum rates exceed that required for maximum grain yields. grain yields.
Ability of the soil-plant system to limit Ability of the soil-plant system to limit the amount of inorganic N accumulation the amount of inorganic N accumulation in the rooting profile when N fertilization in the rooting profile when N fertilization rates exceed that required for maximum rates exceed that required for maximum grain yields. grain yields.
Inorganic Nitrogen Buffering:Inorganic Nitrogen Buffering:Inorganic Nitrogen Buffering:Inorganic Nitrogen Buffering:
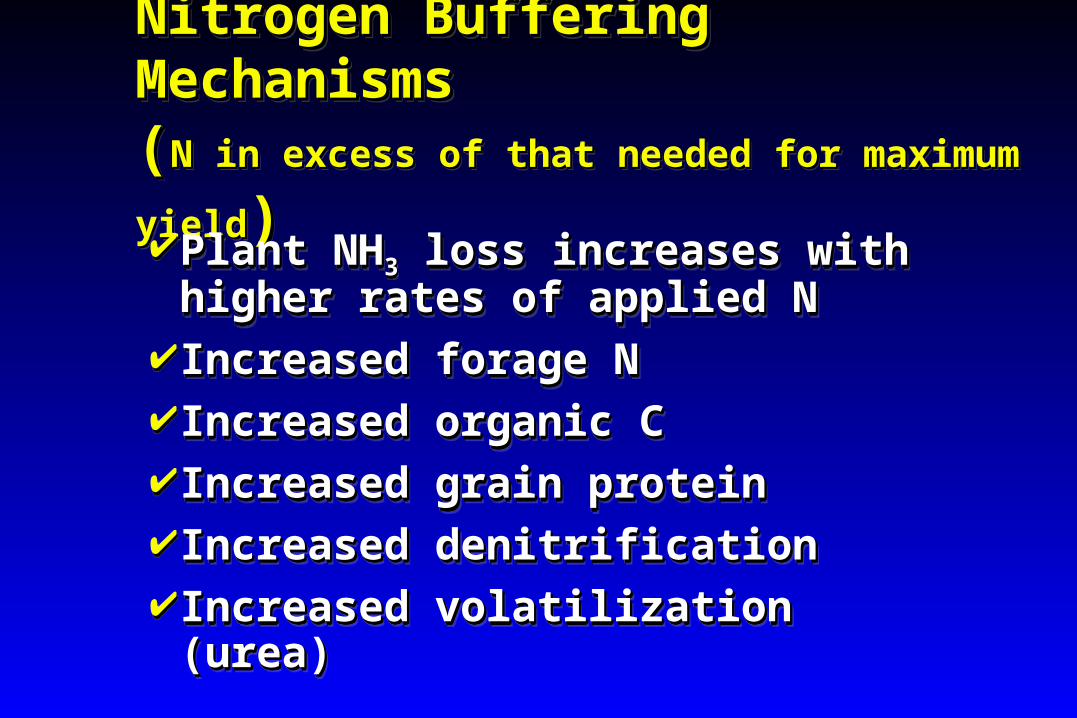
Nitrogen Buffering MechanismsNitrogen Buffering Mechanisms((N in excess of that needed for maximum yieldN in excess of that needed for maximum yield))Nitrogen Buffering MechanismsNitrogen Buffering Mechanisms((N in excess of that needed for maximum yieldN in excess of that needed for maximum yield))
Plant NHPlant NH33 loss increases with higher loss increases with higher rates of applied Nrates of applied N
Increased forage NIncreased forage N Increased organic CIncreased organic C Increased grain proteinIncreased grain protein Increased denitrificationIncreased denitrification Increased volatilization (urea)Increased volatilization (urea)
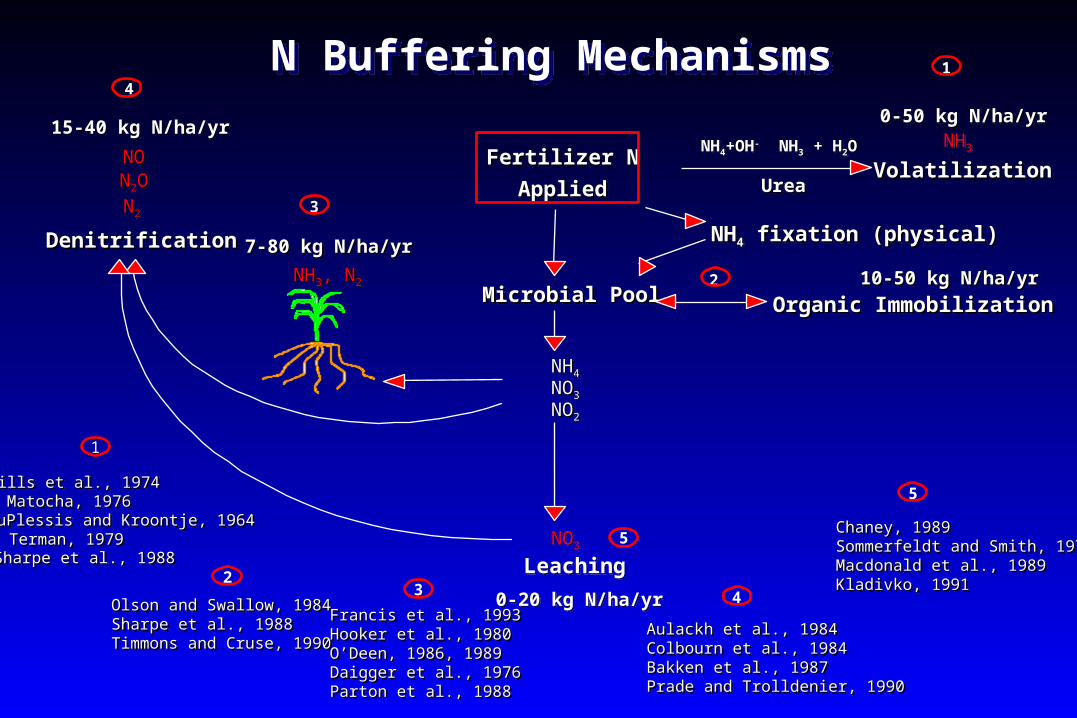
VolatilizationVolatilizationVolatilizationVolatilization
DenitrificationDenitrificationDenitrificationDenitrification
LeachingLeaching
NHNH33, N, N22NHNH33, N, N22
NO3NO3
Microbial PoolMicrobial PoolMicrobial PoolMicrobial Pool
NHNH44NHNH44
NONO33NONO33
NONO22NONO22
7-80 kg N/ha/yr7-80 kg N/ha/yr7-80 kg N/ha/yr7-80 kg N/ha/yr
NONONONONN22OONN22OO
NN22NN22
15-40 kg N/ha/yr15-40 kg N/ha/yr15-40 kg N/ha/yr15-40 kg N/ha/yrNH3NH3
0-50 kg N/ha/yr0-50 kg N/ha/yr0-50 kg N/ha/yr0-50 kg N/ha/yr
UreaUreaUreaUrea
Organic ImmobilizationOrganic ImmobilizationOrganic ImmobilizationOrganic Immobilization10-50 kg N/ha/yr10-50 kg N/ha/yr10-50 kg N/ha/yr10-50 kg N/ha/yr
0-20 kg N/ha/yr0-20 kg N/ha/yr
Fertilizer N Fertilizer N Fertilizer N Fertilizer N
AppliedAppliedAppliedApplied
1
2
3
4
5
5
2
Olson and Swallow, 1984Olson and Swallow, 1984Sharpe et al., 1988Sharpe et al., 1988Timmons and Cruse, 1990Timmons and Cruse, 1990
Olson and Swallow, 1984Olson and Swallow, 1984Sharpe et al., 1988Sharpe et al., 1988Timmons and Cruse, 1990Timmons and Cruse, 1990
1
Mills et al., 1974Mills et al., 1974Mills et al., 1974Mills et al., 1974Matocha, 1976Matocha, 1976Matocha, 1976Matocha, 1976DuPlessis and Kroontje, 1964DuPlessis and Kroontje, 1964DuPlessis and Kroontje, 1964DuPlessis and Kroontje, 1964Terman, 1979Terman, 1979Terman, 1979Terman, 1979Sharpe et al., 1988Sharpe et al., 1988Sharpe et al., 1988Sharpe et al., 1988
4
Aulackh et al., 1984Aulackh et al., 1984Colbourn et al., 1984Colbourn et al., 1984Bakken et al., 1987Bakken et al., 1987Prade and Trolldenier, 1990Prade and Trolldenier, 1990
Aulackh et al., 1984Aulackh et al., 1984Colbourn et al., 1984Colbourn et al., 1984Bakken et al., 1987Bakken et al., 1987Prade and Trolldenier, 1990Prade and Trolldenier, 1990
3
Francis et al., 1993Francis et al., 1993Hooker et al., 1980Hooker et al., 1980O’Deen, 1986, 1989O’Deen, 1986, 1989Daigger et al., 1976Daigger et al., 1976Parton et al., 1988Parton et al., 1988
Francis et al., 1993Francis et al., 1993Hooker et al., 1980Hooker et al., 1980O’Deen, 1986, 1989O’Deen, 1986, 1989Daigger et al., 1976Daigger et al., 1976Parton et al., 1988Parton et al., 1988
Chaney, 1989Chaney, 1989Sommerfeldt and Smith, 1973Sommerfeldt and Smith, 1973Macdonald et al., 1989Macdonald et al., 1989Kladivko, 1991Kladivko, 1991
Chaney, 1989Chaney, 1989Sommerfeldt and Smith, 1973Sommerfeldt and Smith, 1973Macdonald et al., 1989Macdonald et al., 1989Kladivko, 1991Kladivko, 1991
NHNH44+OH+OH-- NH NH33 + H + H22OONHNH44+OH+OH-- NH NH33 + H + H22OO
N Buffering MechanismsN Buffering Mechanisms
NHNH44 fixation (physical) fixation (physical)NHNH44 fixation (physical) fixation (physical)
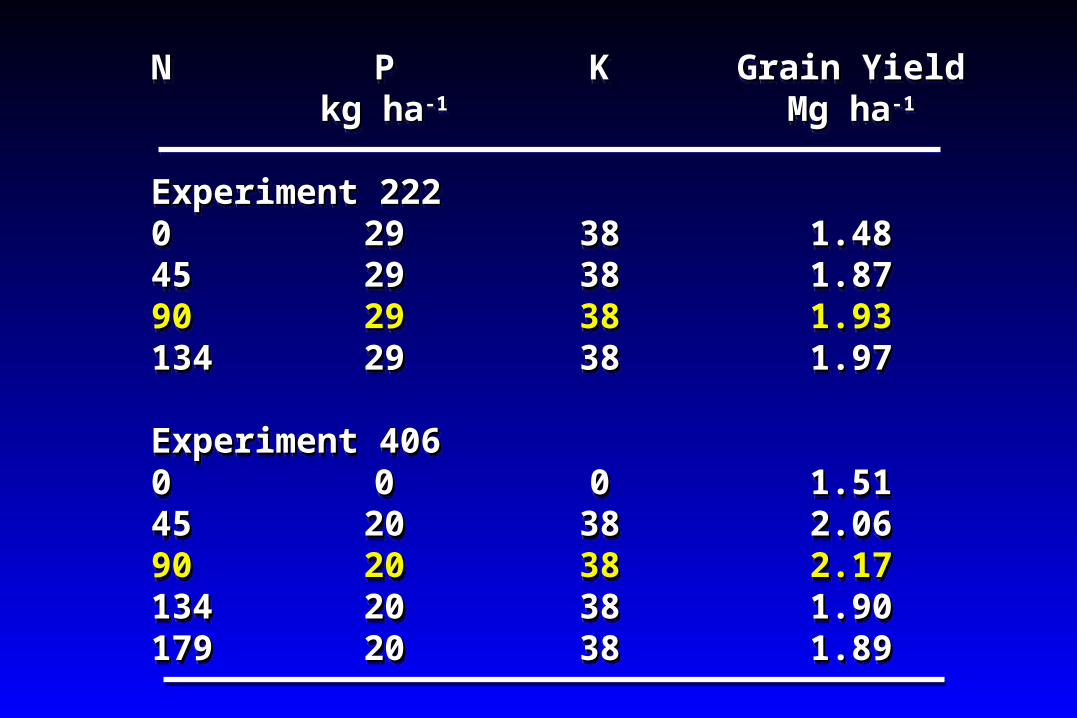
NN PP KK Grain YieldGrain Yield kg hakg ha-1-1 Mg haMg ha-1-1
Experiment 222Experiment 22200 2929 3838 1.481.484545 2929 3838 1.871.879090 2929 3838 1.931.93134134 2929 3838 1.971.97
Experiment 406Experiment 40600 00 00 1.511.514545 2020 3838 2.062.069090 2020 3838 2.172.17134134 2020 3838 1.901.90179179 2020 3838 1.891.89
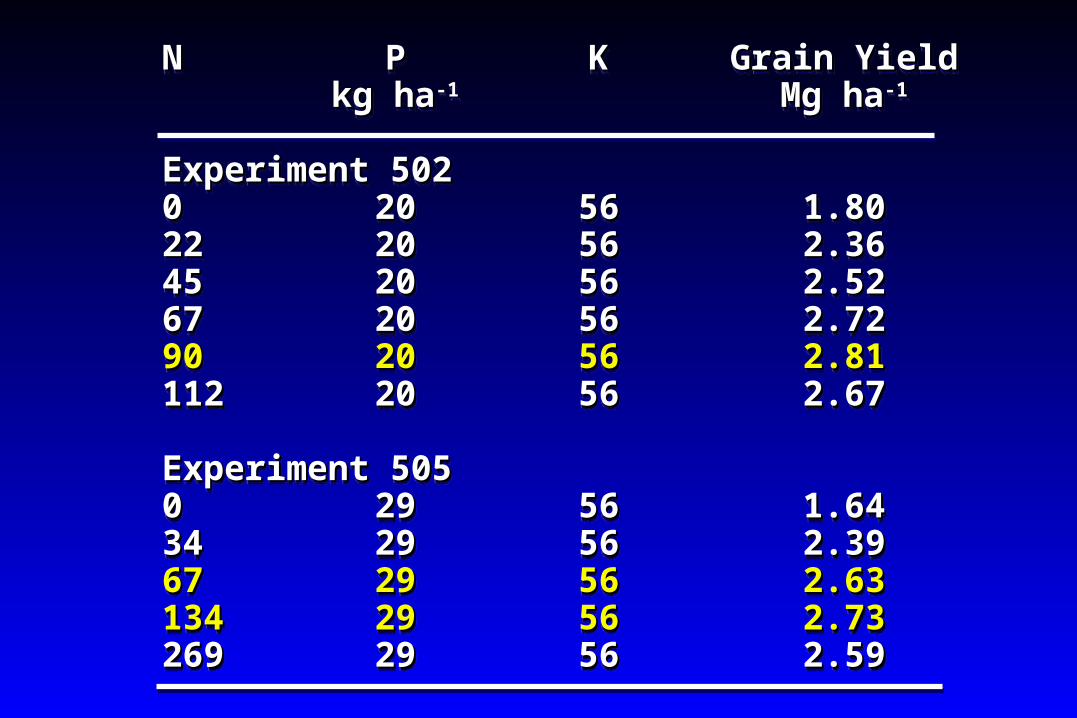
NN PP KK Grain YieldGrain Yield kg hakg ha-1-1 Mg haMg ha-1-1
Experiment 502Experiment 50200 2020 5656 1.801.802222 2020 5656 2.362.364545 2020 5656 2.522.526767 2020 5656 2.722.729090 2020 5656 2.812.81112112 2020 5656 2.672.67
Experiment 505Experiment 50500 2929 5656 1.641.643434 2929 5656 2.392.396767 2929 5656 2.632.63134134 2929 5656 2.732.73269269 2929 5656 2.592.59
1500150015001500
2000200020002000
2500250025002500
3000300030003000
3500350035003500
4000400040004000
0000 100100100100 200200200200 3003003003000000
50505050
100100100100
150150150150
200200200200
250250250250
4444 5555 11111111 0000
Inorganic Nitrogen BufferingInorganic Nitrogen BufferingInorganic Nitrogen BufferingInorganic Nitrogen Buffering
Pro
file
N a
ccu
mu
lati
on
, kg
/ha
Pro
file
N a
ccu
mu
lati
on
, kg
/ha
Pro
file
N a
ccu
mu
lati
on
, kg
/ha
Pro
file
N a
ccu
mu
lati
on
, kg
/ha
Gra
in y
ield
, kg
/ha
Gra
in y
ield
, kg
/ha
Gra
in y
ield
, kg
/ha
Gra
in y
ield
, kg
/ha
N Rate, kg/haN Rate, kg/haN Rate, kg/haN Rate, kg/ha
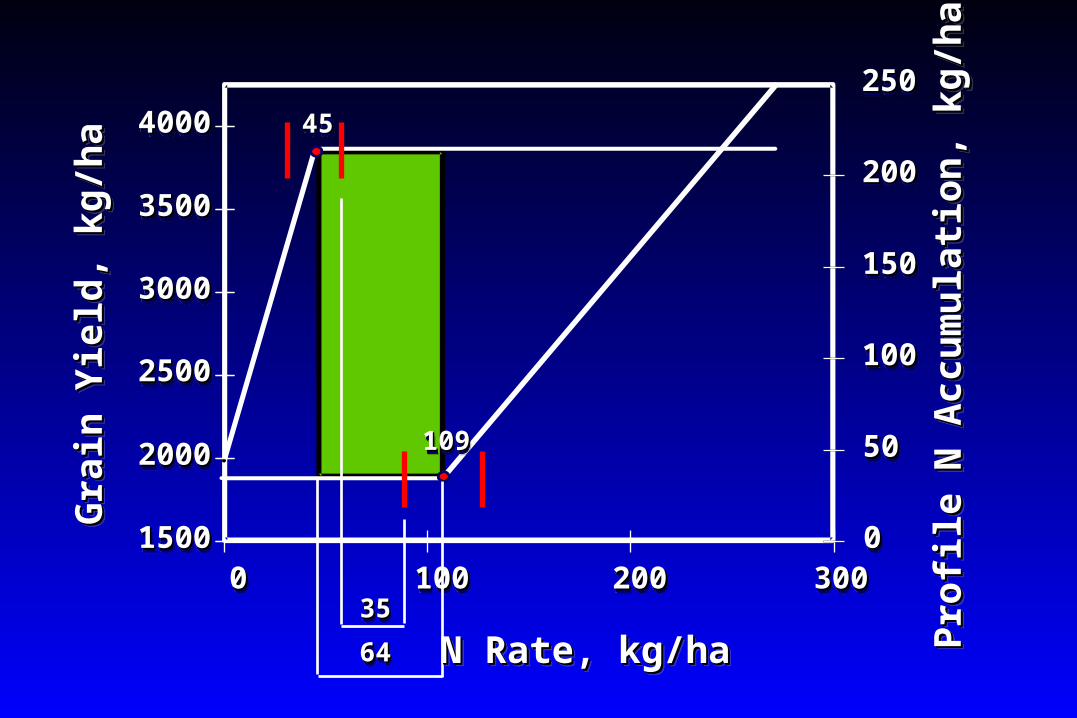
SafetySafetyZoneZone
N rate where maximumN rate where maximum
yields are obtainedyields are obtained
N rate where maximumN rate where maximum
yields are obtainedyields are obtainedGrain YieldGrain Yield
Soil profile NO3-N accumulationSoil profile NO3-N accumulation
Grain YieldGrain Yield
Soil profile NO3-N accumulationSoil profile NO3-N accumulation
N rate where nitrate N rate where nitrate begins to accumulate begins to accumulate below the root zonebelow the root zone
N rate where nitrate N rate where nitrate begins to accumulate begins to accumulate below the root zonebelow the root zone
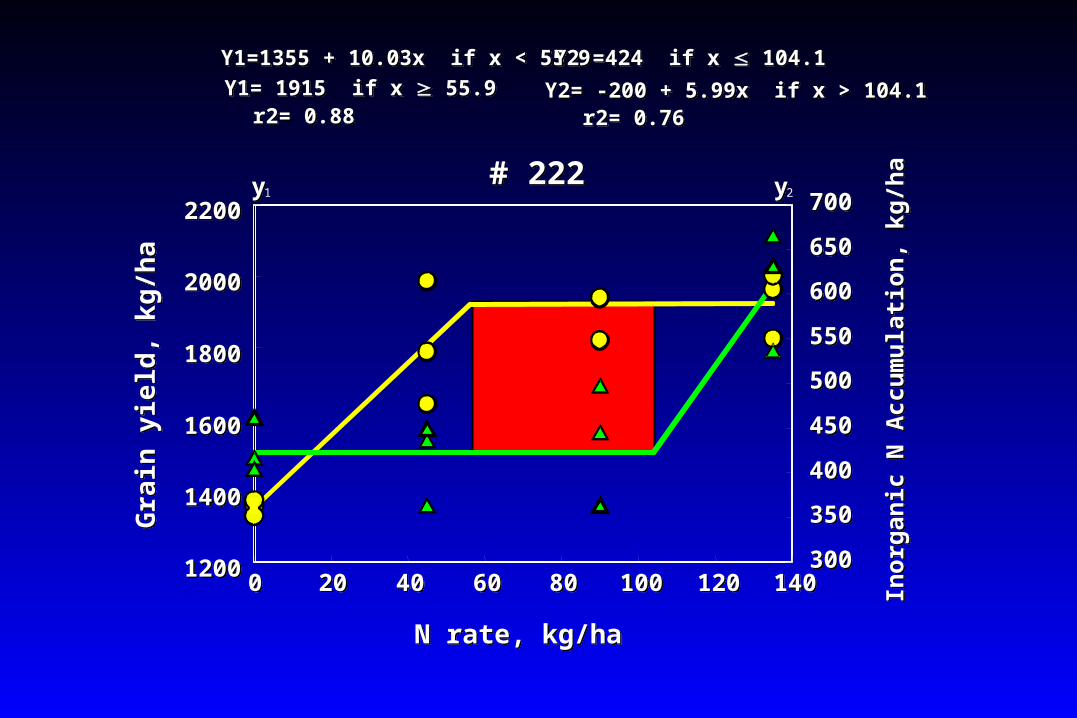
# 222# 222
N rate, kg/haN rate, kg/ha
Y1=1355 + 10.03x if x < 55.9 Y1=1355 + 10.03x if x < 55.9
Y1= 1915 if x 55.9 Y1= 1915 if x 55.9 r2= 0.88 r2= 0.88
Y2 =424 if x 104.1 Y2 =424 if x 104.1
Y2= -200 + 5.99x if x > 104.1Y2= -200 + 5.99x if x > 104.1r2= 0.76r2= 0.76
Gra
in y
ield
, kg
/ha
Gra
in y
ield
, kg
/ha
Ino
rgan
ic N
Acc
um
ula
tio
n,
kg/h
aIn
org
anic
N A
ccu
mu
lati
on
, kg
/ha
00 2020 4040 6060 8080 100100 120120 14014012001200
14001400
16001600
18001800
20002000
22002200
300300
350350
400400
450450
500500
550550
600600
650650
700700yy1 yy2
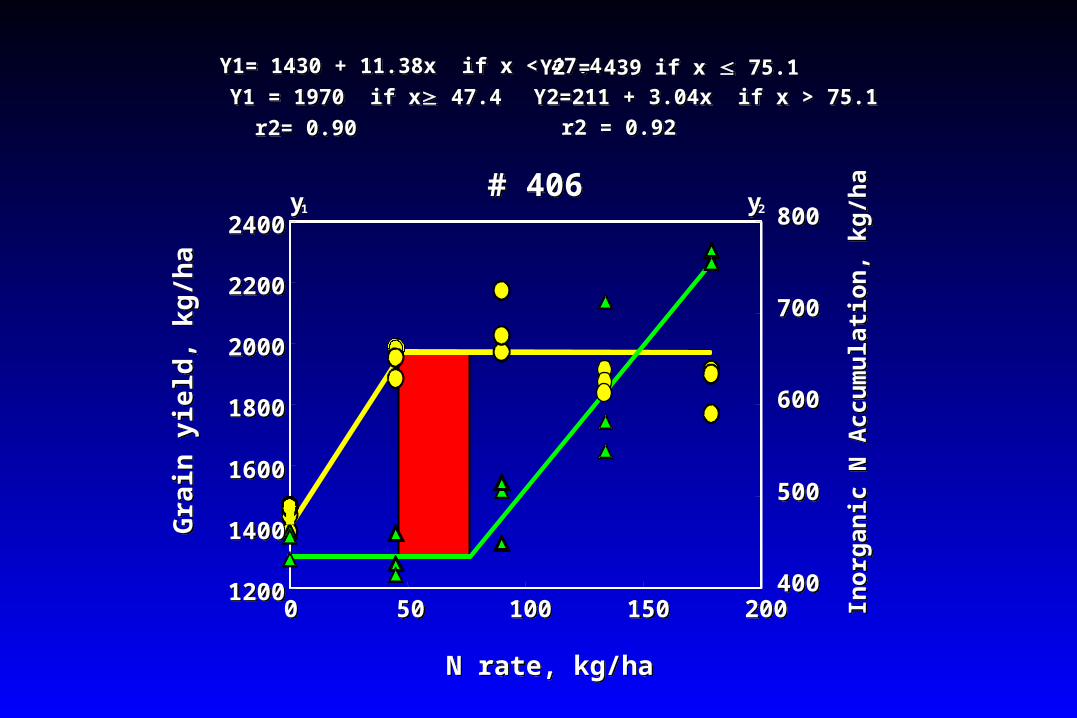
Y1= 1430 + 11.38x if x < 47.4Y1= 1430 + 11.38x if x < 47.4
Y1 = 1970 if x 47.4Y1 = 1970 if x 47.4
r2= 0.90r2= 0.90
Y2 = 439 if x 75.1Y2 = 439 if x 75.1
Y2=211 + 3.04x if x > 75.1Y2=211 + 3.04x if x > 75.1
r2 = 0.92r2 = 0.92
# 406# 406
00 5050 100100 150150 20020012001200
14001400
16001600
18001800
20002000
22002200
24002400
400400
500500
600600
700700
800800yy1 yy2
Gra
in y
ield
, kg
/ha
Gra
in y
ield
, kg
/ha
Ino
rgan
ic N
Acc
um
ula
tio
n,
kg/h
aIn
org
anic
N A
ccu
mu
lati
on
, kg
/ha
N rate, kg/haN rate, kg/ha
1500150015001500
2000200020002000
2500250025002500
3000300030003000
3500350035003500
4000400040004000
0000 100100100100 200200200200 3003003003000000
50505050
100100100100
150150150150
200200200200
250250250250
35353535
64646464
109109109109
45454545G
rain
Yie
ld, k
g/h
aG
rain
Yie
ld, k
g/h
aG
rain
Yie
ld, k
g/h
aG
rain
Yie
ld, k
g/h
a
Pro
file
N A
ccu
mu
lati
on
, kg
/ha
Pro
file
N A
ccu
mu
lati
on
, kg
/ha
Pro
file
N A
ccu
mu
lati
on
, kg
/ha
Pro
file
N A
ccu
mu
lati
on
, kg
/ha
N Rate, kg/haN Rate, kg/haN Rate, kg/haN Rate, kg/ha
00 2020 4040 6060 8080 100100 120120 1401402020
3030
4040
5050
6060
7070
8080
# 222# 222
N rate, kg/haN rate, kg/ha
Gra
in N
Up
take
, kg
/ha
Gra
in N
Up
take
, kg
/ha
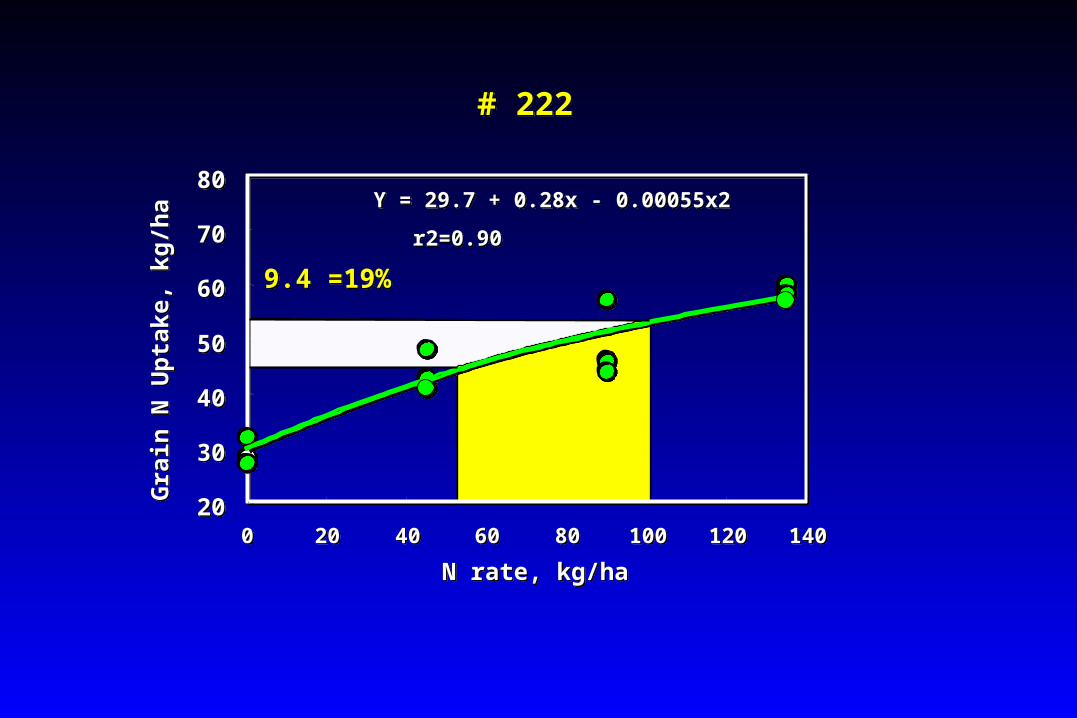
Y = 29.7 + 0.28x - 0.00055x2Y = 29.7 + 0.28x - 0.00055x2
r2=0.90r2=0.90
9.4 =19%9.4 =19%
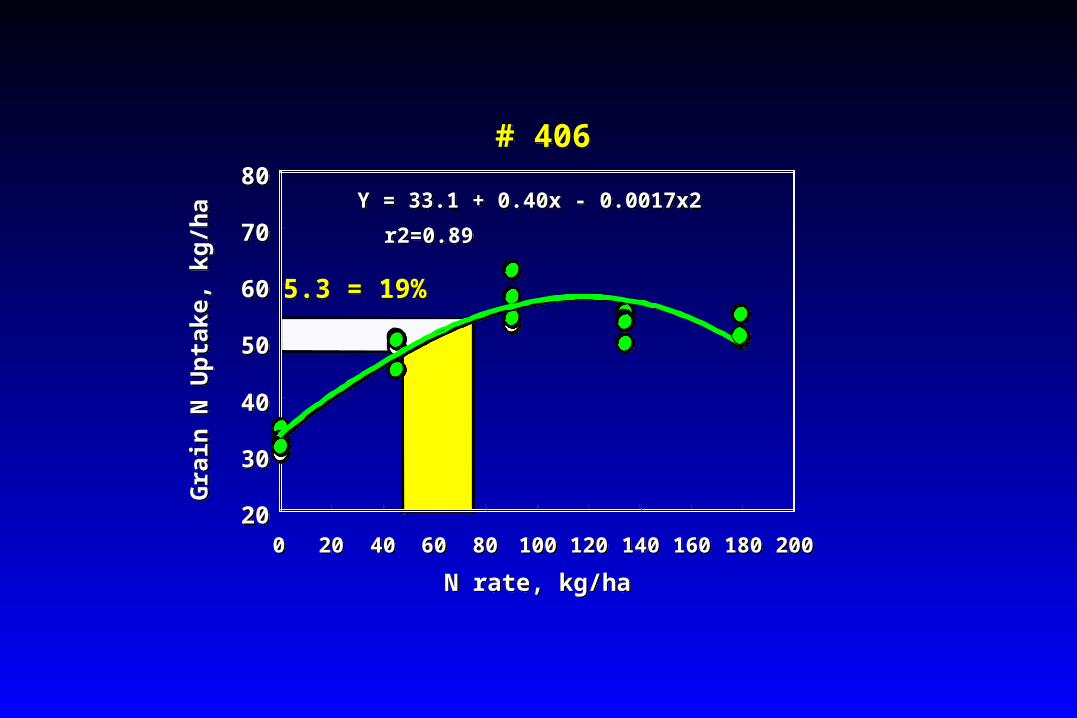
5.3 = 19%5.3 = 19%
# 406# 406
N rate, kg/haN rate, kg/ha
Gra
in N
Up
take
, kg
/ha
Gra
in N
Up
take
, kg
/ha
Y = 33.1 + 0.40x - 0.0017x2Y = 33.1 + 0.40x - 0.0017x2
r2=0.89r2=0.89
00 2020 4040 6060 8080 100100 120120 140140 160160 180180 2002002020
3030
4040
5050
6060
7070
8080
0.040.040.040.04
0.050.050.050.05
0.060.060.060.06
0.070.070.070.07
0.080.080.080.08
0.090.090.090.09
0.10.10.10.1
0000 30303030 60606060 90909090 120120120120 1501501501500.40.40.40.4
0.50.50.50.5
0.60.60.60.6
0.70.70.70.7
0.80.80.80.8
0.90.90.90.9TSNTSNTSNTSN
OCOCOCOC
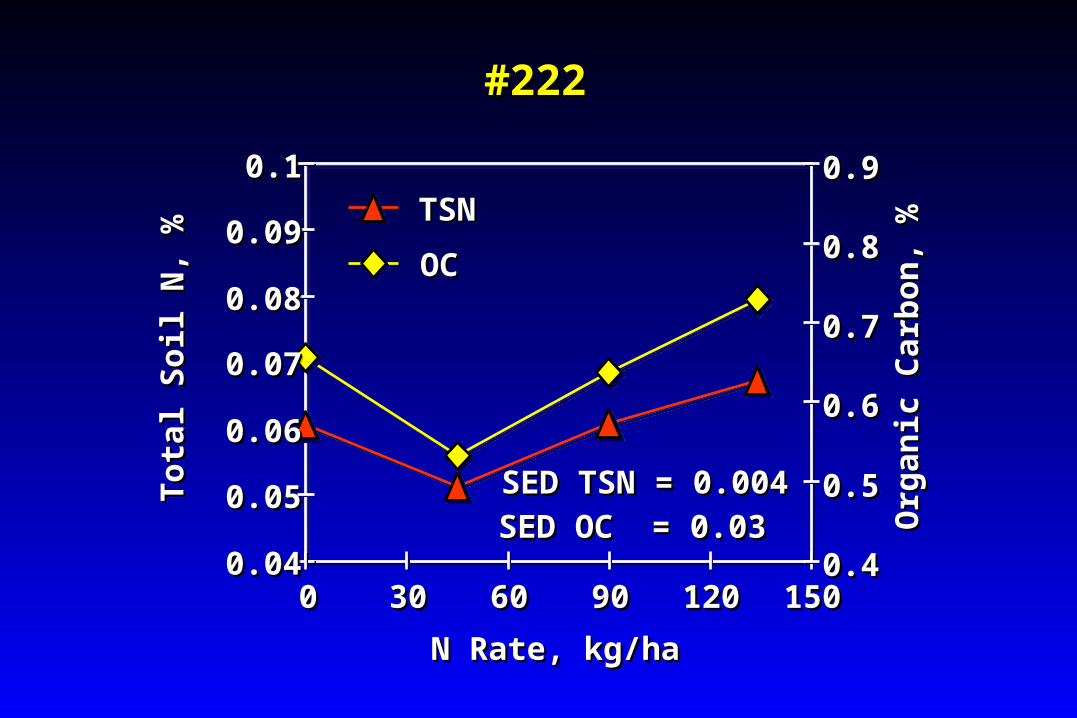
#222#222#222#222
To
tal
So
il N
, %
To
tal
So
il N
, %
To
tal
So
il N
, %
To
tal
So
il N
, %
Org
anic
Car
bo
n,
%O
rgan
ic C
arb
on
, %
Org
anic
Car
bo
n,
%O
rgan
ic C
arb
on
, %
N Rate, kg/haN Rate, kg/haN Rate, kg/haN Rate, kg/ha
SED TSN = 0.004SED TSN = 0.004SED TSN = 0.004SED TSN = 0.004
SED OC = 0.03SED OC = 0.03SED OC = 0.03SED OC = 0.03
0.040.040.040.04
0.050.050.050.05
0.060.060.060.06
0.070.070.070.07
0.080.080.080.08
0.090.090.090.09
0.10.10.10.1
0000 40404040 80808080 120120120120 160160160160 2002002002000.40.40.40.4
0.50.50.50.5
0.60.60.60.6
0.70.70.70.7
0.80.80.80.8
0.90.90.90.9
TSNTSNTSNTSN
OCOCOCOC
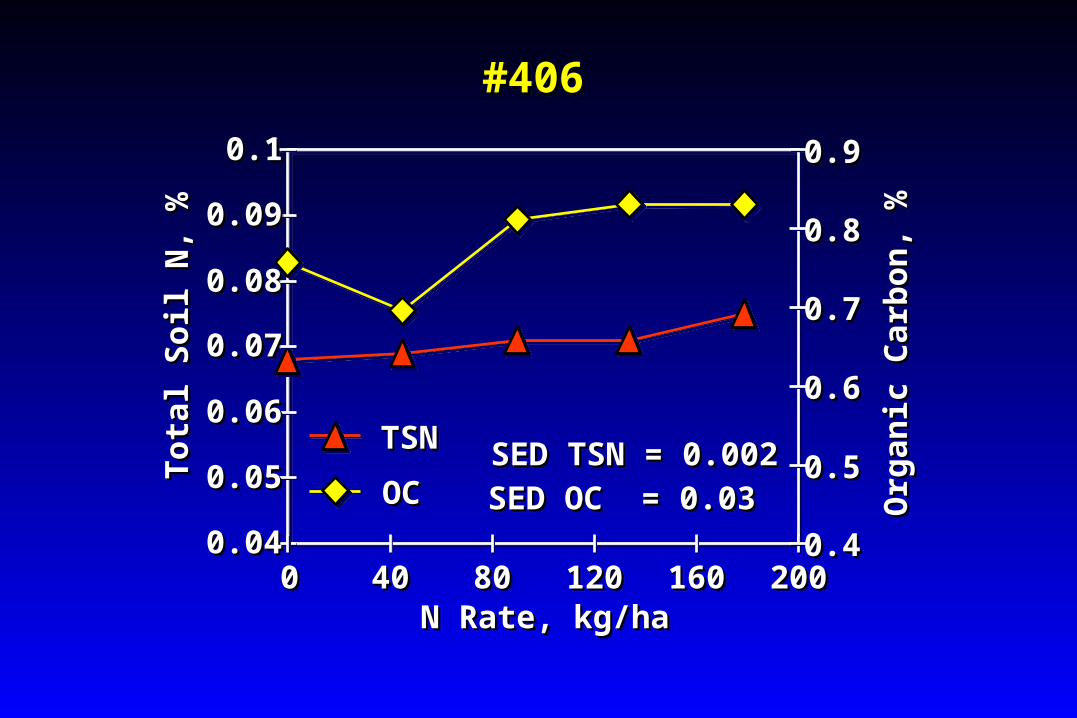
#406#406#406#406
To
tal
So
il N
, %
To
tal
So
il N
, %
To
tal
So
il N
, %
To
tal
So
il N
, %
Org
anic
Car
bo
n,
%O
rgan
ic C
arb
on
, %
Org
anic
Car
bo
n,
%O
rgan
ic C
arb
on
, %
N Rate, kg/haN Rate, kg/haN Rate, kg/haN Rate, kg/ha
SED TSN = 0.002SED TSN = 0.002SED TSN = 0.002SED TSN = 0.002
SED OC = 0.03SED OC = 0.03SED OC = 0.03SED OC = 0.03
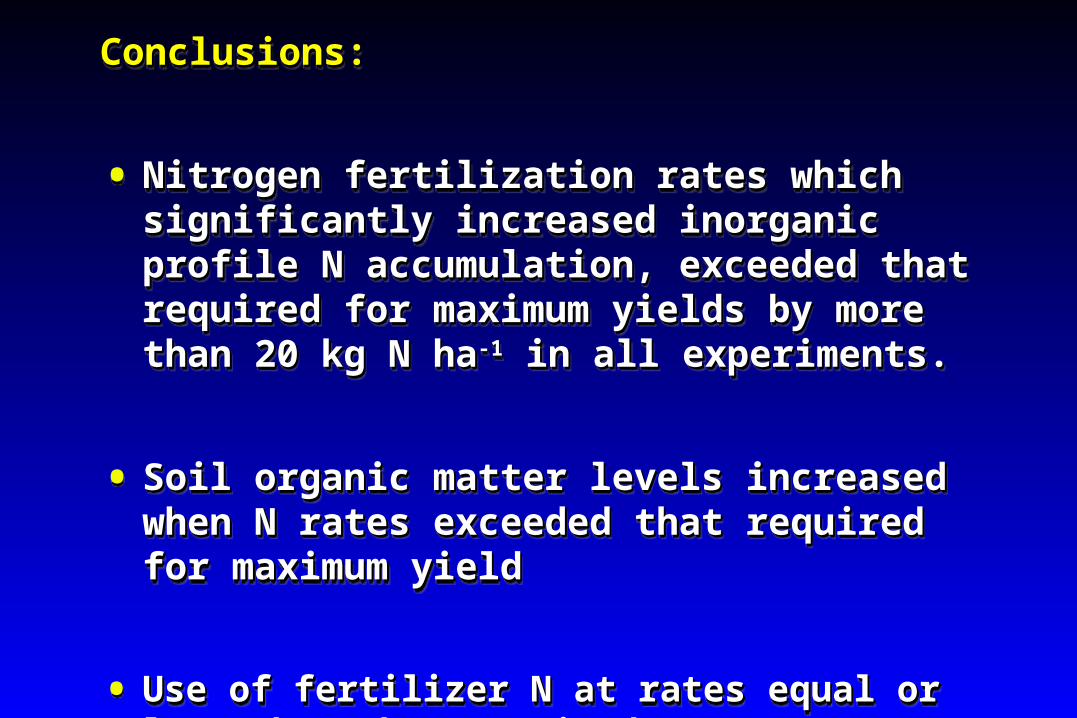
Conclusions:Conclusions:
• Nitrogen fertilization rates which significantly Nitrogen fertilization rates which significantly increased inorganic profile N accumulation, increased inorganic profile N accumulation, exceeded that required for maximum yields by exceeded that required for maximum yields by more than 20 kg N hamore than 20 kg N ha-1-1 in all experiments. in all experiments.
• Soil organic matter levels increased when N Soil organic matter levels increased when N rates exceeded that required for maximum rates exceeded that required for maximum yieldyield
• Use of fertilizer N at rates equal or less than that Use of fertilizer N at rates equal or less than that required to meet crop needs did not increase required to meet crop needs did not increase inorganic N accumulationinorganic N accumulation
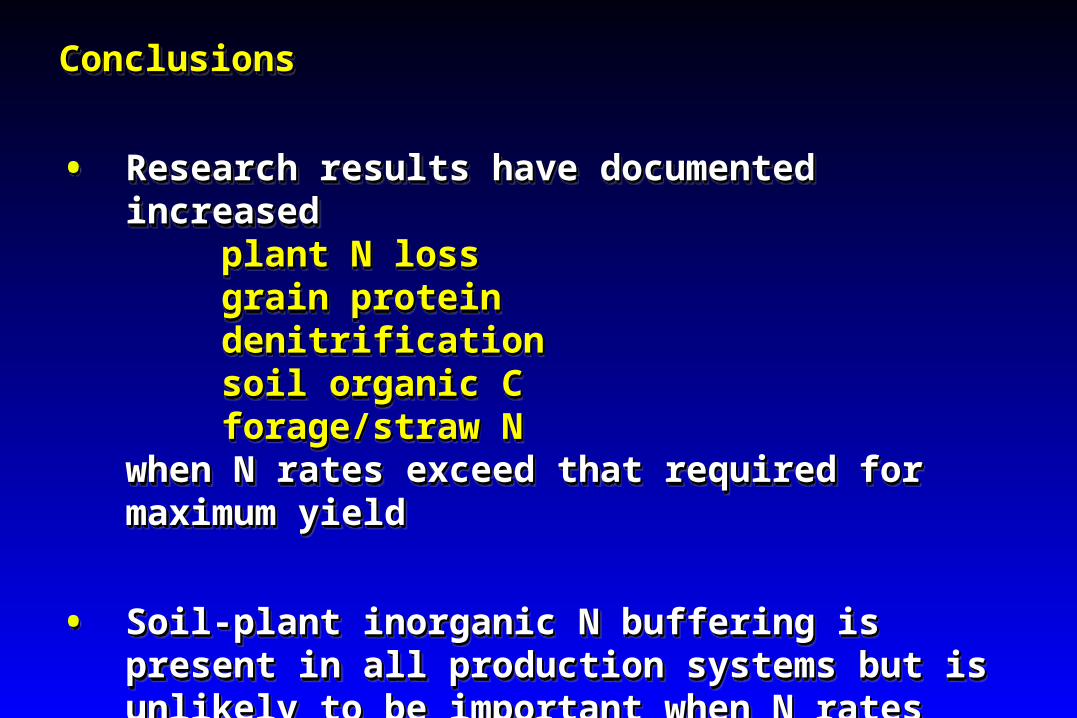
ConclusionsConclusions
• Research results have documented increased Research results have documented increased plant N lossplant N lossgrain protein grain protein denitrificationdenitrificationsoil organic Csoil organic Cforage/straw Nforage/straw N
when N rates exceed that required for maximum when N rates exceed that required for maximum yieldyield
• Soil-plant inorganic N buffering is present in all Soil-plant inorganic N buffering is present in all production systems but is unlikely to be important production systems but is unlikely to be important when N rates continuously exceed twice that when N rates continuously exceed twice that required required
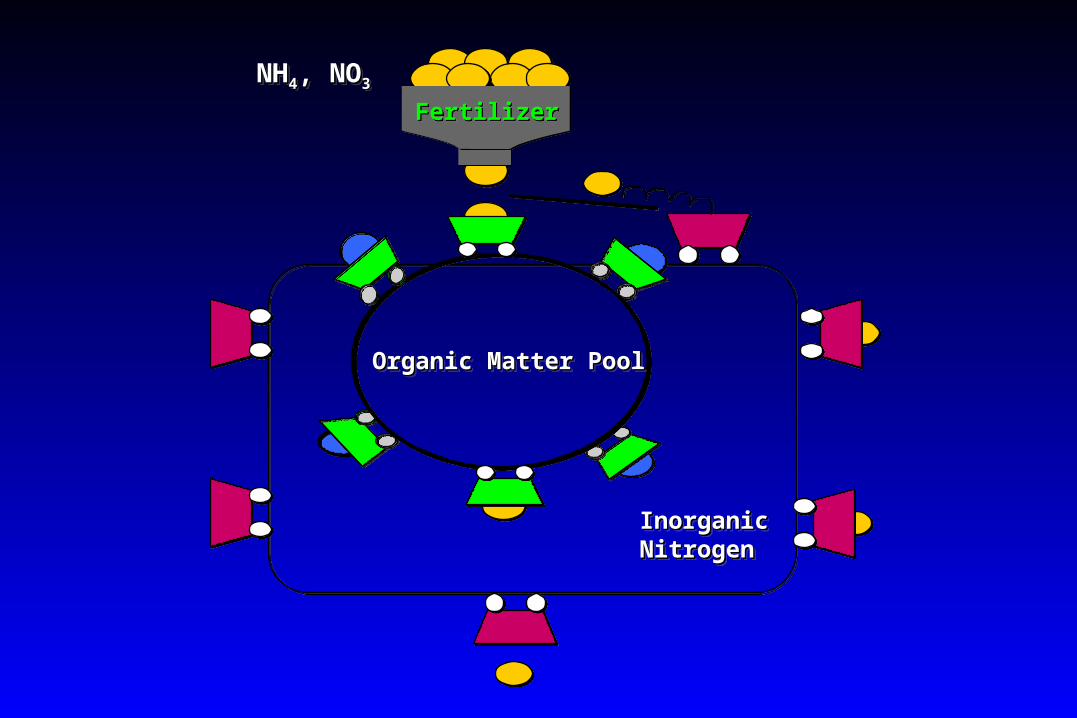
FertilizerFertilizer
NHNH44, NO, NO33NHNH44, NO, NO33
Organic Matter PoolOrganic Matter PoolOrganic Matter PoolOrganic Matter Pool
InorganicInorganicNitrogenNitrogenInorganicInorganicNitrogenNitrogen


![Automatically generated PDF from existing images.comunavaleaargovei.ro/fisiere_generale/Postelnicu CatalinI.pdf · COIIUEICIUI Sol/solie. Rude de gadlll I ) ale titularu]uj Scietöl(i](https://img.pdfslide.us/doc/110x75/5e0450dc9fae660b68542b28/automatically-generated-pdf-from-existing-catalinipdf-coiiueiciui-solsolie.jpg)