Embed Size (px)
Citation preview
Soil-Pipe Interface Friction
Coefficients for Buried PE4710 Pipe
Presented to Plastics Pipe Institute September 19, 2018
Prepared by: Mark C. Gemperline (MCG Geotechnical Engineering Inc.)
Robert V. Rinehart (Bureau of Reclamation)
Research conducted in cooperation with
Bureau of Reclamation Denver Federal Center Denver, CO 80225
MCG Geotechnical Engineering
Morrison, CO 80465 http://www.mcggeotechnical.com

Soil-Pipe Interface Friction Coefficients for Buried PE4710 Pipe September 19, 2018
MCG Geotechnical Engineering Inc.
ii
Table of Contents
Acknowledgements .................................................................................................................................... iv
Executive Summary..................................................................................................................................... v
Section I. Introduction ............................................................................................................................... 1
Section II. Scope ......................................................................................................................................... 1
Section III. Testing Program ....................................................................................................................... 1
Section IV. Test Procedure ......................................................................................................................... 2
Section V. Interface Friction Coefficients .................................................................................................... 4
Section VI. Observations ............................................................................................................................ 5
Section VII. Recommendations .................................................................................................................. 6
Section VII. Application of µ ....................................................................................................................... 7
Section VIII. Conclusions ............................................................................................................................ 8
Section IX. References ................................................................................................................................ 9
List of Tables
Table 1. Manufacturer Supplied Properties for Tested PE 4710 Coupons
Table 2. Soil Material Properties
Table 3. Test Program and Results
Table 4 Comparison of Interface Friction Coefficients
List of Figures
Figure 1. Photograph of PE4710 Test Coupons before 2-inch shear displacement at 20 lb/in2 normal
stress. Pea Gravel (Top), Crushed Rock (Bottom).
Figure 2. Photographs of Crushed Rock. Upper and Lower photographs are images of the same sample.
Figure 3. Image of Pea Gravel
Figure 4. Image of Density Sand
Figure 5. Image of the direct shear test machine.
Figure 6. Image of PE4710 HDPE test coupon positioned in lower shear box.

Soil-Pipe Interface Friction Coefficients for Buried PE4710 Pipe September 19, 2018
MCG Geotechnical Engineering Inc.
iii
Figure 7. General schematic of the direct shear test setup.
Figure 8. Photograph of PE4710 Test Coupons following 2-inch shear displacement at 20 lb/in2 normal
stress. Pea Gravel (Top), Crushed Rock (Bottom).
Figure 9. A conceptual representation of the change in axial displacement and interface shear stress
with increased distance from the centerline of a long horizontally buried pipeline in response to a
change in temperature or pressure.
List of Appendices
Appendix A. Summary plots of time, displacements and stresses.
Appendix B. Shear Stress v Normal Stress and Friction coefficient v Normal Stress Plots.
Appendix C. Data Plots Overlain on Drexel University Data Plots (Koerner 2005)
Disclaimer
The opinions and conclusions expressed in this report are the views of MCG Geotechnical Engineering
Inc. and do not necessarily express the policy or position of the Plastics Pipe Institute or the Bureau of
Reclamation.

Soil-Pipe Interface Friction Coefficients for Buried PE4710 Pipe September 19, 2018
MCG Geotechnical Engineering Inc.
iv
Acknowledgements Financial support for this project was provided by the Plastics Pipe Institute. Both technical support and
laboratory facilities were provided by the Department of Interior, Bureau of Reclamation. This work was
tremendously aided by Mr. Amster Howard, an advocate of the pipe industry throughout the past six
decades, who was consulted frequently during the planning and testing process. The authors are very
thankful for the contributions of these individuals. The kind and enthusiastic support of the Bureau of
Reclamation Concrete, Geotechnical & Structural Laboratory staff was encouraging, refreshing and
greatly appreciated. The authors would like to thank the following for enthusiastic support, discussion
and suggestions.
• Heath Casteel, Performance Pipe
• Gerry Groen, P.Eng., Uponor Infra
• Dustin Langston, WL Plastics
• Camille Rubeiz, P.E., F. ASCE, Plastics Pipe Institute
• Harvey Svetlik, P.E., GF Central Plastics
• Mike Whitehouse, ISCO Industries
Finally, we would like to thank GF Central Plastics for the PE4710 Test Material.

Soil-Pipe Interface Friction Coefficients for Buried PE4710 Pipe September 19, 2018
MCG Geotechnical Engineering Inc.
v
Executive Summary This study reports interface friction coefficients that were experimentally determined for various soil
types sliding on thick coupons of PE4710 high density polyethylene (HDPE). These values and related
discussion are intended to facilitate more accurate assessment of pipe resistance to axial movement.
Factors affecting frictional resistance between embedment and pipe experiencing axial movement due
to temperature and pressure change were studied.
The interface friction coefficients for soils sliding on 12-inch (305-mm) square, 2-inch (51-mm) thick
coupons of PE4710 high density polyethylene were measured and the results are reported herein. Five
different soils and twenty-two test coupons were used in testing. Peak and residual friction coefficients
were calculated from results of direct shear tests: the latter of these is generally most appropriate for
use in buried pipe design. Residual friction coefficients for free-draining coarse-grained soils were
between 0.15 and 0.5, whereas values were between 0.05 and 0.20 for fine-grained soil and coarse-
grained soil having significant fines content. Peak friction coefficient was observed to increase with
normal stress. This trend was minor and sometimes absent or otherwise indiscernible for the residual
friction coefficient. Also, it was observed that the planar features of fractured, angular, platy and
elongated coarse-grained particles aligned with the horizontal surface of the test coupons during
specimen placement. This may explain an unexpected observation that coarse-grained crushed rock
with these characteristics and subangular to angular sand exhibited friction coefficients that were less
than or equal to the values determined for a tested subrounded-to-subangular pea-gravel. These
observations lead to the recommendation that lower values of interface friction coefficient should be
selected for buried pipe design when the embedment has fractured, angular, platy and elongated shape,
has more than a few percent fines content, or normal stress is low.
Appropriate use of the results of this study requires understanding that pipe axial displacement is
required to fully mobilized frictional resistance. Hence, buried pipeline design must consider where the
displacement is sufficient to expect fully mobilized frictional resistance. Also, the design process should
consider the method used to estimate the average normal stress. A calculation method that is likely to
underestimate the average normal stress on buried pipe would be conservative for this purpose since it
would result in a lower estimate of pipe frictional resistance. However, underestimating normal stress is
inconsistent with the need to overestimate stress for conservative pipe radial deflection calculation.
Consequently, thoughtful consideration must be given to the method used to calculate average normal
stress on buried pipe for the purpose of estimating frictional resistance to axial movement.

Soil-Pipe Interface Friction Coefficients for Buried PE4710 Pipe September 19, 2018
MCG Geotechnical Engineering Inc.
1
Section I. Introduction The interface friction coefficients for soil sliding on 12-inch (305-mm) square, 2-inch (51-mm) thick
coupons of PE4710 high density polyethylene (HDPE) were measured in the laboratory by a direct shear
testing method. Five different soils and twenty-two coupons were used in testing. Peak and residual
interface friction coefficients were calculated and are presented and discussed. Considerations
important for appropriate application are identified and also discussed. This report is organized as
follows:
Section II - Scope
Section III - Test Program
Section IV - Test Procedure
Section V - Interface Friction Coefficients (µ)
Section VI - Observations
Section VI - Application of µ
Section VII - Recommendations
Section VIII - Conclusion
Section II. Scope Pipe changes axial length in response to changes in temperature, or internal pressure, which may occur
independently or in combination. Also, water flowing through a bend or tee in a pipe creates force that
causes pipe axial strain. For buried pipe embedded in soil, axial displacements are resisted by friction
that develops on the pipe-soil interface. Frictional resistance is mobilized as the pipe moves axially and is
fully mobilized at locations along the pipe where the movement is sufficient to cause the pipe to slip
through the embedment. The fully mobilized frictional resistance is given by the equation:
𝜏 = 𝜇σ (1)
Where:
𝜏 = 𝐹𝑢𝑙𝑙𝑦 𝑚𝑜𝑏𝑖𝑙𝑖𝑧𝑒𝑑 𝑓𝑟𝑖𝑐𝑡𝑖𝑜𝑛𝑎𝑙 𝑟𝑒𝑠𝑖𝑠𝑡𝑎𝑛𝑐𝑒
𝜎 = 𝐴𝑣𝑒𝑟𝑎𝑔𝑒 𝑁𝑜𝑟𝑚𝑎𝑙 𝑆𝑡𝑟𝑒𝑠𝑠
𝜇 = 𝐼𝑛𝑡𝑒𝑟𝑓𝑎𝑐𝑒 𝐶𝑜𝑒𝑓𝑓𝑖𝑐𝑖𝑒𝑛𝑡 𝑜𝑓 𝐹𝑟𝑖𝑐𝑡𝑖𝑜𝑛
This paper reports the results of tests performed to determine values of µ for PE4710 HDPE in contact
with typical pipe embedment materials. Measurements and observations made during the testing are
used to develop recommendations for appropriate selection of µ for buried pipe design. Considerations
for appropriate application of this study’s results are presented.
Section III. Testing Program Tested PE4710 HDPE coupons were approximately 2-inch thick and 12-inch square. Test coupons had a
smooth glossy surface with occasional, minor, random scratches. For examples, pretest photographs of
two coupons are shown on Figure 1. The predominant scratch direction, if any, was aligned with the

Soil-Pipe Interface Friction Coefficients for Buried PE4710 Pipe September 19, 2018
MCG Geotechnical Engineering Inc.
2
direction of shear displacement during testing. Manufacturer supplied PE4710 properties are
summarized in Table 1.
Common names are used to describe soils that were tested: these are, Density Sand, Crushed Rock, Pea
Gravel, Silty Sand, and Silty Clay. Table 2 presents tested soil properties, Unified Soil Classification
(ASTM D2487), and Uniform Soil Groups - Soil Class (ASTM D2774). Figures 2, 3 and 4 are photographs of
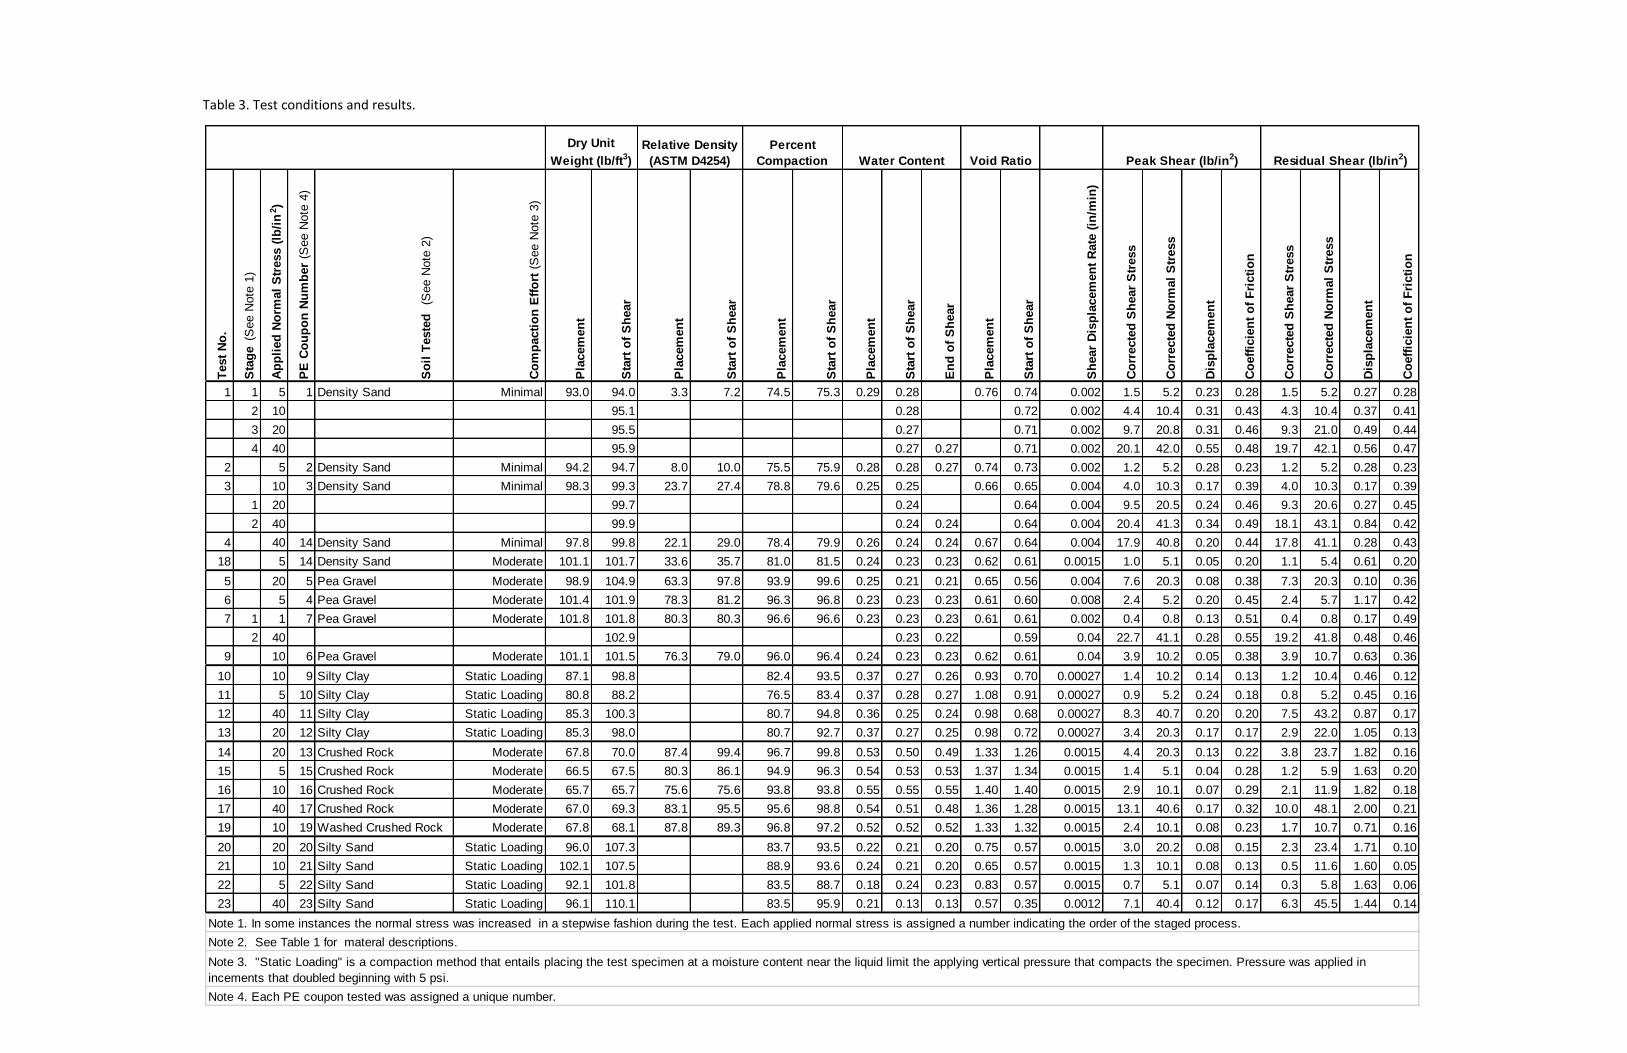
the coarse-grained soils. The test program is presented in Table 3. Soil placement conditions, as well as
test results that will be discussed in Section V, are likewise presented in Table 3.
Placement of coarse and fine-grained soils in the shear box involved either moderate or no compactive
effort. It is possible that the resulting µ are lower than would have been determined had specimens
been placed at higher densities. The condition of moderate to no compacted effort was selected with
the recognition that the resulting values of interface friction coefficient might be conservative for use in
design. In addition, it is speculated that the loose placement of the soil in this research may mimic
compacted backfill in close proximity to a buried pipe that may, over time, develop a low density due to
radial expansion and contraction of the pipe.
Crushed Rock contained approximately one percent fines (material passing the #200 sieve) and two
percent sand size particles (material passing the #4 sieve but retained on the #200 sieve). To evaluate
the significance of the finer fraction on the measured friction coefficient, the Crushed Rock was washed
over a #4 sieve prior to placement for Test 19. Washing to remove sand and fines produced no
measurable effect.
Section IV. Test Procedure Direct shear tests were performed in general compliance with:
ASTM D5321 Determining the Shear Strength of Soil-Geosynthetic and Geosynthetic-Geosynthetic
Interfaces by Direct Shear.
ASTM D3080 Standard Test Method for Direct Shear Test of Soils Under Consolidated Drained Conditions.
The direct shear test apparatus was a Wykeham Farrance Model WF25506 and is shown in Figure 5. The
general concept for the direct shear test is depicted on Figure 6. A normal (vertical) load is applied to the
soil, which lies above the test coupon in the upper half of a shear box. The lower half of the shear box
containing the HDPE test coupon is moved horizontally and the force resisting the horizontal movement
of the upper shear box is recorded. The corrected shear stress and normal stress are calculated as the
quotient of the respective force and the area of the coupon in contact with the soil. The corrected
stresses increase throughout the test because the area of the coupon in contact with soil decreases as
the shear box displaces. Horizontal and vertical displacements are recorded throughout the test. The
rate of horizontal displacement is controlled.
The upper and lower shear boxes are approximately the same 12-inch by 12-inch (305 mm by 305 mm)
size as the test coupons +/- 0.02 inch (0.5 mm). Coupons were cooled to about 32 degrees F prior to
placement. This was done to facilitate insertion of the coupon into the lower shear box. The coupons

Soil-Pipe Interface Friction Coefficients for Buried PE4710 Pipe September 19, 2018
MCG Geotechnical Engineering Inc.
3
were returned to room temperature prior to testing. The resulting thermal expansion yielded a snug fit
of the coupon in the lower shear box.
Both upper and lower shear boxes were approximately 3.9 inch (99 mm) deep. The test coupons were
two inches thick and were positioned so that the test surface was level and 0.08 inch (2 mm) above the
surface of the lower shear box. Either plaster-of-paris or a gypsum cement material was used to fill the
lower shear box below the test coupon and provide a solid bearing surface. A photograph of a test
coupon positioned in the lower shear box and placed in the test machine is shown on Figure 7.
Pea Gravel and Crushed Rock were placed with a moderate compactive effort. A moderate compacted
effort entailed placing the material in approximately four equal height lifts to a depth of approximately
3.4 inches (86 mm), each lift being hand compacted by tapping the surface repeatedly and uniformly
with a 3.3 pound, 3-inch (76 m) diameter steel cylinder for approximately 1 minute.
For tests using Density Sand, the sand was gently placed in the upper shear box on top of the test
coupon to attain a near zero relative density. This was done for all tests using Density Sand except test
18. A moderate compacted effort was used to place Density Sand for test 18.
The Silty Sand and Silty Clay were both placed in the upper shear box to a depth of approximately 1.25
inch (32 mm) by spooning and spreading a saturated slurry (material slightly above the approximate
liquid limit1). Following placement, the soil was consolidated statically under the normal stress to be
used for friction coefficient determination.
For all tests, initially, a seating pressure of approximately 0.7 lb/in2 was applied to the entire test
specimen. This is the pressure created by the static weight of the submerged soil, loading platen and
load frame. The shear box and test specimen were then submerged and remained submerged
throughout testing. Vertical displacement measurements began following soil consolidation at the
seating pressure.
For tests using Silty Clay and Silty Sand, the vertical pressure was typically added in doubling increments
beginning with 5 lb/in2 until the desired test normal stress was achieved. Time was provided for the
specimen to fully consolidate under each pressure increment prior to the addition of normal stress or
otherwise proceeding with shear displacement. This process typically took several days.
For tests using Pea Gravel, Density Sand and Crushed Rock, the desired test pressure was applied by
adding a single increment of load. Time was provided for the specimen to fully compress prior to
proceeding. This process typically took approximately one hour.
Following consolidation and prior to the application of shear displacement, four steel screws, “gap
screws”, threaded through the upper shear box and resting on the top of the lower shear box, were
advanced to separate the upper shear box from the lower shear box and create a gap of 0.16 inch (4
1 The liquid limit is the water content of the soil above which the soil behaves more like a viscous liquid than a semi-plastic solid (determined per ASTM D4318). For the Nonplastic Silty Sand material, the water content of the saturated slurry was based on judgement and visual observation.
Soil-Pipe Interface Friction Coefficients for Buried PE4710 Pipe September 19, 2018
MCG Geotechnical Engineering Inc.
4
mm). This resulted in the surface of the test coupon being centered in the gap. The gap screws slid on
the lower shear box on nylon pads during shear displacement. This maintained the 0.16-inch (4 mm) gap
throughout the test. The frictional resistance between the nylon pads and steel of the lower shear box
was measured prior to the first test. This measurement was subtracted from subsequent measurements
of frictional force.
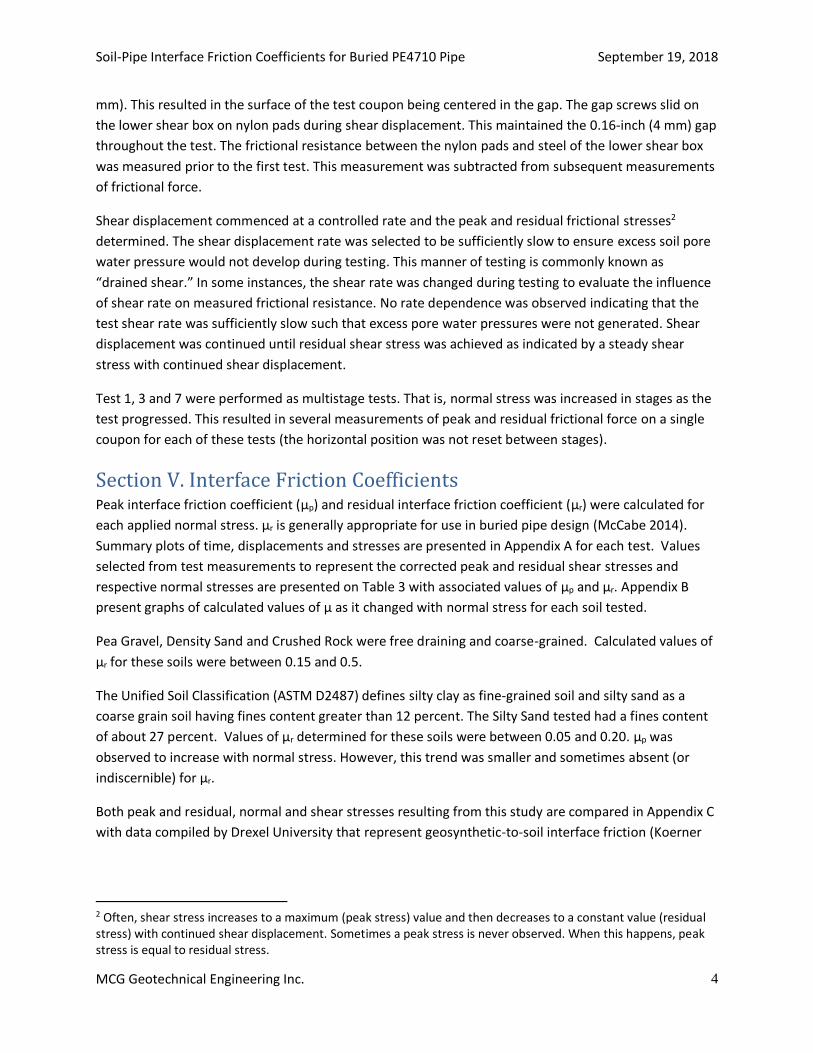
Shear displacement commenced at a controlled rate and the peak and residual frictional stresses2
determined. The shear displacement rate was selected to be sufficiently slow to ensure excess soil pore
water pressure would not develop during testing. This manner of testing is commonly known as
“drained shear.” In some instances, the shear rate was changed during testing to evaluate the influence
of shear rate on measured frictional resistance. No rate dependence was observed indicating that the
test shear rate was sufficiently slow such that excess pore water pressures were not generated. Shear
displacement was continued until residual shear stress was achieved as indicated by a steady shear
stress with continued shear displacement.
Test 1, 3 and 7 were performed as multistage tests. That is, normal stress was increased in stages as the
test progressed. This resulted in several measurements of peak and residual frictional force on a single
coupon for each of these tests (the horizontal position was not reset between stages).
Section V. Interface Friction Coefficients Peak interface friction coefficient (µp) and residual interface friction coefficient (µr) were calculated for
each applied normal stress. µr is generally appropriate for use in buried pipe design (McCabe 2014).
Summary plots of time, displacements and stresses are presented in Appendix A for each test. Values
selected from test measurements to represent the corrected peak and residual shear stresses and
respective normal stresses are presented on Table 3 with associated values of µp and µr. Appendix B
present graphs of calculated values of µ as it changed with normal stress for each soil tested.
Pea Gravel, Density Sand and Crushed Rock were free draining and coarse-grained. Calculated values of
µr for these soils were between 0.15 and 0.5.
The Unified Soil Classification (ASTM D2487) defines silty clay as fine-grained soil and silty sand as a
coarse grain soil having fines content greater than 12 percent. The Silty Sand tested had a fines content
of about 27 percent. Values of µr determined for these soils were between 0.05 and 0.20. µp was
observed to increase with normal stress. However, this trend was smaller and sometimes absent (or
indiscernible) for µr.
Both peak and residual, normal and shear stresses resulting from this study are compared in Appendix C
with data compiled by Drexel University that represent geosynthetic-to-soil interface friction (Koerner
2 Often, shear stress increases to a maximum (peak stress) value and then decreases to a constant value (residual stress) with continued shear displacement. Sometimes a peak stress is never observed. When this happens, peak stress is equal to residual stress.

Soil-Pipe Interface Friction Coefficients for Buried PE4710 Pipe September 19, 2018
MCG Geotechnical Engineering Inc.
5
2005). It is observed that the ranges of µ measured in this study are in approximate agreement with the
Drexel University data.
PPI TR-21/2001, “Thermal Expansion and Contraction in Plastic Piping Systems”, presents that a value of
0.1 is a generally accepted conservative value for µ for the case where smooth surface plastic pipe
makes full contact with the embedment material (PPI 2001). The PPI Handbook for Polyethylene Pipe,
Chapter 12 – Horizontal Drilling suggests µ for determining the pulling resistance between pipe and
ground is typically 0.4 (PPI 2018). These values fall within the range of µ determined by this study.
Table 4 compares the extreme values of µ determined by this study with the extreme values scaled from
plots of normal and shear stress representing the Drexel database and reproduced in Appendix C, as
well as values recently recommended by the ASCE Task Committee on Thrust Restraint Design of Buried
Pipelines (Koerner 2005; McCabe 2014). Additionally, values from pullout tests performed on PE tape-
wrapped steel pipe are presented (Alam S, et al. 2014). The range of µ’s determined by this study are
approximately within these ranges except that the values determined by Alam for silty clay are
significantly higher.
Alam presents results of 13 pullout tests of PE tape-wrapped steel pipe having cover depths of 4 feet to
16 feet (Alam et.al. 2013). Pipe were buried and tested in a moist compacted state, except one sand test
which was flooded. The friction factors3 presented show a trend toward decreasing friction factor with
increasing burial depth. Alam writes: “It is important to note that the friction factor was back-
calculated from Equation 13-6 in AWWA M11 (2004). As a result, the friction factor ‘declines’ with depth.
This is attributed to the fact that the relative contribution of the weight of the pipe and its content
decline as the weight of the soil prism above the pipe crown increases.” It is noteworthy that friction
coefficients determined in this study are constant or increase with increasing normal stress, suggesting
the friction coefficient is constant or increases with cover depth. This is discussed in greater detail in
Section VI. The need to thoughtfully evaluate the method used to calculate average normal stress on a
buried pipe is discussed in Section VII.
Section VI. Observations Traditionally, the friction coefficients for two planar surfaces sliding past one-another is explained as
being independent of normal stress, i.e. µ is a constant. However, this model does not fit all materials.
For example, µ typically decreases with normal stress for soils sliding on an internally developed shear
plane. This stress dependent behavior results from shear resistance being governed by a unique physical
mechanism. The behavior of µ describing friction between soil and PE4710 HDPE appears to be
governed by a mechanism that is different than that governing internal shear of typical soils. This is
evident by the observation of graphs in Appendix B that show both µp and µr to have a tendency to
increase with normal stress.
The observation that µ increases with normal stress is hypothesized herein to be attributable to
individual particles gouging into and subsequently plowing through the HDPE surface at increasingly
3 The term “friction factor” is synonymous with “friction coefficient” used herein.

Soil-Pipe Interface Friction Coefficients for Buried PE4710 Pipe September 19, 2018
MCG Geotechnical Engineering Inc.
6
greater depth as normal stress is increased. The resulting gouges are evident on the surface of tested
HDPE coupons. For example, Figure 8 shows before and after images that highlight scratch patterns
observed on the Test 7 coupon, which was tested at a normal stress of 40 lb/in2 using Pea Gravel. The
shear force required for a particle to plow through plastic expectedly increases with increasing gouge
depth and with increasing number of particles involved. The mechanism is complex and further
development is beyond the scope of this research. However, subsequent discussion presents
observations that seemingly support this mechanism.
The following observations are discussed in the context of the hypothesized mechanism for friction
presented in the previous paragraph:
1. Gouging was more evident for subrounded-to-subangular Pea Gravel than any other material.
2. Gouging was less extreme for tested materials having a predominance of planar features, i.e.
platy, elongated, fractured faces, and predominantly angular shapes.
3. Gouging was not visibly discernable on the surface of coupons tested using Silty Clay or Silty
Sand, although a less light reflective surface was discernable.
4. The friction coefficient increased as the extent of gouging increased.
When placing soil on the HDPE test coupons, it was observed that planar features of fractured, angular,
platy and elongated particles aligned with the plane of the test coupons. That is, flat sides of particles
rested flat on the coupon surface. Herein, it is hypothesized that particles lying flat on the HDPE surface
result in lower particle contact stress with the coupon and consequently less gouging of the coupon
surface. This may explain why both Crushed Rock having fractured, angular, platy and elongated
characteristics and the subangular Density Sand exhibited friction coefficients that are less than or equal
to the values determined for subrounded-to-subangular Pea Gravel.
Table 5 presents a summary of the friction ranges observed for the five soils tested. The low µ
associated with Silty Sand is noteworthy. A silty sand is considered a coarse-grained soil by the Unified
Soil Classification System and has a demonstrated higher coefficient of internal friction than fine-grained
soils. However, this relationship does not hold for the soil-HDPE interface: µr results for both Silty Sand
and Silty Clay are about the same. The association of low frictional resistance with an absence of visible
gouging on the surface of coupons tested using Silty Sand and Silty Clay suggests that frictional
resistance increases with the soils tendency for gouging and that tendency is diminished in coarse-
grained soil by the inclusion of a small percentage of fines.
Section VII. Recommendations The results and observations discussed in the previous sections lead to the following recommendations
for selection of interface friction coefficient:
1. The appropriate value of µ for buried pipe design applications for Class I and Class II
embedment ((ASTM D2774, crushed rock and clean coarse-grained soil) is likely in the range
0.15 and 0.50.

Soil-Pipe Interface Friction Coefficients for Buried PE4710 Pipe September 19, 2018
MCG Geotechnical Engineering Inc.
7
2. The appropriate value of µ for buried pipe design applications for any class of soil other than
Class I and Class II embedment is likely in the range 0.05 and 0.20.
3. The lower values in these ranges are recommended when the embedment material is expected
to include significant fractured, angular, platy or elongated shaped particles.
4. The lower values in these ranges are recommended when normal stress is low.
Section VII. Application of µ Buried pipeline designs sometimes rely on interface friction to resist axial displacement due to
temperature or pressure change and to control axial pipe movement associated with changes in flow.
Shear force that resists axial displacement of the pipe is governed by either the embedment shear stress
- shear strain relationship or the fully mobilized frictional resistance. The magnitude of pipe axial
displacement and both embedment type and condition determine if soil properties or pipe interface
properties control. The fully mobilized frictional resistance is given by equation 1. It must not be
assumed that the fully mobilized frictional resistance is instantaneously available to resist axial
displacement. The ASCE Task Committee on Thrust Restraint Design of Buried Pipelines presents that
experimental data for both pile foundations and pipes show that peak frictional resistance develops at
about 3 to 10 mm of displacement depending on soil type (ASCE 2014).
Embedment adjacent to a pipe that is experiencing axial elongation or contraction will undergo shear
strain and consequently move with the pipe until the shear stress at the interface exceeds the available
frictional resistance. For example, consider a long, buried pipe that is free to move axially at both ends
and experiences a pressure increase or a temperature decrease. The pipe contracts axially. Figure 9
shows a graph depicting pipe displacement and interface frictional resistance. Note that no frictional
resistance to movement has developed at the center of the pipe because it has not displaced. Frictional
resistance increases with increasing distance from pipe centerline. Initially, the frictional resistance is
controlled by the embedment shear stress-shear strain properties. Accumulative displacement near the
end of the pipe is sufficient to fully mobilize frictional resistance. Once fully mobilize the frictional
resistance remains constant and the pipe in this region slips through the embedment. Notice that axial
displacement of the pipe increases with increasing distance from centerline. Both the axial displacement
and the rate of change of axial displacement are greatest near the ends of the pipe where the
cumulative force from frictional restraint decreases to zero. This example is intended to dispel the belief
that fully mobilized friction is available instantaneously upon the onset of axial elongation or
contraction. Care should be taken during design to determine where displacement is sufficient to expect
frictional resistance to be fully mobilized and to realize that axial displacement occurs within this region.
The fully mobilized frictional resistance is directly proportional to the average normal stress acting on
the pipe interface. Design engineers commonly overestimate the stress on pipe for the purpose of
calculating a conservative estimate of pipe radial deflection. However, overestimating the stress would
lead to an unconservative estimate of fully mobilized frictional resistance to axial displacement. Care
should be taken to develop a conservative lower bound estimate of the average normal stress that may
exist during the life of the pipeline at locations where fully mobilize frictional resistance will be needed.

Soil-Pipe Interface Friction Coefficients for Buried PE4710 Pipe September 19, 2018
MCG Geotechnical Engineering Inc.
8
Cycles of axial elongation and contraction occur throughout the useful life of most pipelines. This
concern is not specifically addressed by this research. However, it is worth noting that applying cyclic
shear stresses to the embedment is expected to reduce the embedment shear modulus, which in turn
will result in larger shear displacement of the embedment soil being required to fully mobilize friction.
Section VIII. Conclusions The interface friction coefficients for soils sliding on approximately 12-inch (305-mm) square, 2-inch (51-
mm) thick coupons of PE4710 HDPE were measured. Twenty-two test coupons were used in testing.
Soils were selected to represent five different potential pipe embedment materials. Commonly used
names that describe the soil tested are Density Sand, Pea Gravel, Crushed Rock, Silty Sand and Silty Clay.
These soils were placed with either no compactive effort or moderate compactive effort. Gouging of the
HDPE was observed and appears to be a key factor in the mechanism governing shear resistance.
Peak and residual friction coefficients were calculated from results of direct shear tests: the latter of
these is generally most appropriate for use in buried pipe design. Residual friction coefficients for free-
draining coarse-grained soils were between 0.15 and 0.5, whereas values were between 0.05 and 0.20
for fine-grained soil and a coarse-grained soil having approximately 27 percent fines.
The tested crushed rock had a high percentage of flat and elongated particles which, during placement
in the test apparatus, were observed to preferentially lay flat on the surface of HDPE test coupons. The
Density Sand was angular-to-subangular in shape and the Pea Gravel was subrounded-to-subangular.
Less HDPE gouging was observed when testing the Pea Gravel than either the Density Sand or Crushed
Rock. Furthermore, the friction coefficients for the Pea Gravel were as great as or greater than those
determined for Density Sand and Crushed rock. It is hypothesized that these unexpected results are
because the flat surface of the latter materials preferentially aligned with the plane of the horizontal
surface of the test coupon. This observation and hypothesis supports a recommendation that the lower
values of measured friction coefficients be used for buried pipeline design when embedment material
has a significant quantity of flat surfaces.
Peak friction coefficient was observed to increase with normal stress. This trend was minor and
sometimes absent or otherwise indiscernible for the residual friction coefficient. These observations
support a recommendation that lower values of interface friction coefficient be selected for buried pipe
design when normal stress is expected to be low.
It was observed that the friction coefficients measured for Silty Sand having an approximately 27
percent fines content was about the same as that for fine grained Silty Clay. Silty Sand is commonly
considered a coarse-grained soil and expectedly would have higher coefficients of friction for internal
sliding than the fine-grained Silty Clay. This result, coupled with the observation of no gouging of HDPE
by either of these materials, leads to recommendation that coarse-grained soils having 12 percent or
more fines content be grouped with fine grained soils for the purpose of interface friction coefficient
selection.

Soil-Pipe Interface Friction Coefficients for Buried PE4710 Pipe September 19, 2018
MCG Geotechnical Engineering Inc.
9
The above results and observations lead to the following recommendations for selection of interface
friction coefficient.
1. The appropriate value of µ for buried pipe design applications for Class I and Class II
embedment (ASTM D2774, crushed rock and clean coarse-grained soil) is likely in the range 0.15
and 0.50.
2. The appropriate value of µ for buried pipe design applications for any class of soil other than
Class I and Class II embedment is likely in the range 0.05 and 0.20.
3. The lower values in these ranges are recommended when the embedment material is expected
to include significant fractured, angular, platy or elongated shaped particles.
4. The lower values in these ranges are recommended when normal stress is low.
Section IX. References McCabe, Martin W., ASCE Task Committee on Thrust Restraint Design of Buried Pipelines, “Soil
Parameters for Assessing Axial and Transverse Behavior of Restrained Pipelines Part 1: Axial Behavior”,
proceedings of Pipelines 2014: From Underground to the Forefront of Innovation and Sustainability,
ASCE 2014, p 1844.
American Society for Testing and Materials, Annual Book of ASTM Standards, Vol. 04.08.
D 3080 “Standard Test Method for Direct Shear Test of Soils Under Consolidated Drained
Conditions.”
D 5321 “Determining the Shear Strength of Soil-Geosynthetic and Geosynthetic-Geosynthetic Interfaces
by Direct Shear.”
AWWA M11 (2004). Steel Water Pipe: A Guide for Design and Installation, 4th Ed.
Alam, S., Erez N. Allouche, Chris Bartlett, Ang Sherpa, and Brent Keil, (2013). Experimental Evaluation of
Soil-Pipe Friction Coefficients for Coated Steel Pipes, Pipelines 2013: Pipelines and Trenchless
Construction and Renewals-A Global Perspective, American Society of Civil Engineers, Jun 21, 2013, pp
360 – 371.
(Koerner 2005) Koerner, George R., Direct Shear Database of Geosynthetic-to-Geosynthetic and
Geosynthetic-to Soil Interfaces, Drexel University, Geosynthetic Research Institute, Folsom, PA, GRI
Report #30, June 14, 2005.
(PPI 2001) Thermal Expansion and Contraction in Plastics Piping Systems, PPI TR-21/2001, Plastics Pipe
Institutes, Washington D.C., 2001, p.13.
(PPI 2018) PPI Handbook of Polyethylene Pipe Chapter 12 - Horizontal Directional Drilling, viewed online
at https://plasticpipe.org/publications/pe-handbook.html, March, 20, 2018, p. 441.
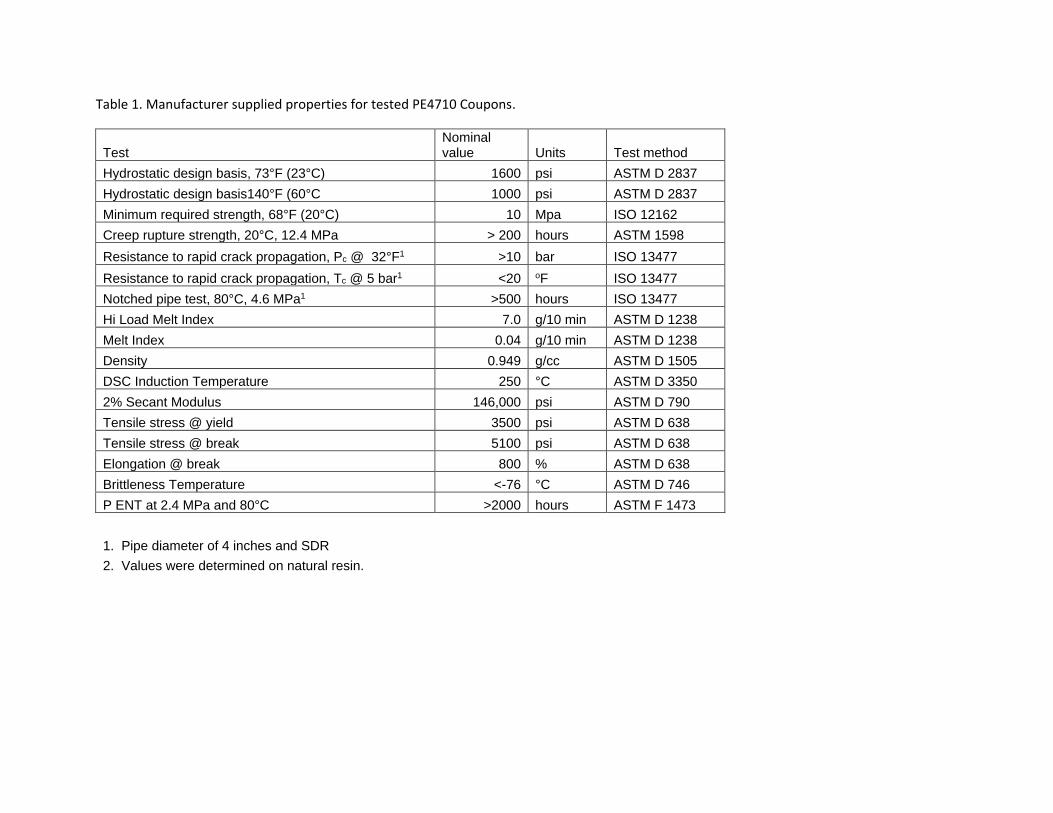
Table 1. Manufacturer supplied properties for tested PE4710 Coupons.
Test Nominal value Units Test method
Hydrostatic design basis, 73°F (23°C) 1600 psi ASTM D 2837
Hydrostatic design basis140°F (60°C 1000 psi ASTM D 2837
Minimum required strength, 68°F (20°C) 10 Mpa ISO 12162
Creep rupture strength, 20°C, 12.4 MPa > 200 hours ASTM 1598
Resistance to rapid crack propagation, Pc @ 32°F1 >10 bar ISO 13477
Resistance to rapid crack propagation, Tc @ 5 bar1 <20 oF ISO 13477
Notched pipe test, 80°C, 4.6 MPa1 >500 hours ISO 13477
Hi Load Melt Index 7.0 g/10 min ASTM D 1238
Melt Index 0.04 g/10 min ASTM D 1238
Density 0.949 g/cc ASTM D 1505
DSC Induction Temperature 250 °C ASTM D 3350
2% Secant Modulus 146,000 psi ASTM D 790
Tensile stress @ yield 3500 psi ASTM D 638
Tensile stress @ break 5100 psi ASTM D 638
Elongation @ break 800 % ASTM D 638
Brittleness Temperature <-76 °C ASTM D 746
P ENT at 2.4 MPa and 80°C >2000 hours ASTM F 1473
1. Pipe diameter of 4 inches and SDR
2. Values were determined on natural resin.

Table 2. Soil Material Properties.
Pip
e S
oil
Cla
ss
Co
mm
on
Nam
e
Un
ifie
d S
oil
Cla
ssif
icati
on
Perc
en
t F
ines
Perc
en
t S
an
d
Perc
en
t G
ravel
Liq
uid
Lim
it
Pla
sti
c L
imit
Sp
ecif
ic G
ravit
y
An
gu
lari
ty
Part
icle
Sh
ap
e
Maxim
ym
Dry
Un
it W
eig
ht
AS
TM
D698 (
lb/f
t3)
Maxim
um
Dry
Un
it W
eig
ht
AS
TM
D7382 (
lb/f
t3)
Min
imu
m D
ry U
nit
Weig
ht
AS
TM
D4254 (
lb/f
t3)
I Crushed Rock Poorly Graded Gravel (GP) 1 2 97 Angular 20 percent flat;20 percent elongated N/A 70.1 55.1
I Crushed Rock Washed Poorly Graded Gravel (GP) 0 0 100 Angular 20 percent flat;20 percent elongated N/A
II Density Sand Poorly Graded Sand (SP) 0 100 0 2.62 Subangular to Angular Approximately Equidimensional N/A 124.8 92.2
II Pea Gravel Poorly Graded Gravel (GP) 0 trace 100 2.56 Subrounded to Subangular Approximately Equidimensional N/A 105.3 89.5
III Silty Sand Silty Sand (SM) 27 73 0 2.60 N/A N/A 114.8 102.0 82.3
IV Silty Clay Silty Clay (CL-ML ) 97 3 0 22 16 2.71 N/A N/A 105.7 N/A N/A
Nonplastic
See Note 1 Below
Note 1: The minimum and maximum unit weights were not tested. The values of 70.1 lb/ft3 and 55.1 lb/ft3 measured for unwashed crushed rock are used to calculate percent compaction and relative density.
Note 2: The values presented for Crushed Rock, Crushed Rock Washed, and Pea Gravel represent Saturated Surface Dry - Bulk Specific Gravity.
2.53
Test
No
.
Sta
ge (S
ee N
ote
1)
Ap
pli
ed
No
rmal
Str
ess (
lb/i
n2)
PE
Co
up
on
Nu
mb
er
(See N
ote
4)
So
il T
este
d
(See N
ote
2)
Co
mp
acti
on
Eff
ort
(S
ee N
ote
3)
Pla
cem
en
t
Sta
rt o
f S
hear
Pla
cem
en
t
Sta
rt o
f S
hear
Pla
cem
en
t
Sta
rt o
f S
hear
Pla
cem
en
t
Sta
rt o
f S
hear
En
d o
f S
hear
Pla
cem
en
t
Sta
rt o
f S
hear
Sh
ear
Dis
pla
cem
en
t R
ate
(in
/min
)
Co
rrecte
d S
hear
Str
ess
Co
rrecte
d N
orm
al
Str
ess
Dis
pla
cem
en
t
Co
eff
icie
nt
of
Fri
cti
on
Co
rrecte
d S
hear
Str
ess
Co
rrecte
d N
orm
al
Str
ess
Dis
pla
cem
en
t
Co
eff
icie
nt
of
Fri
cti
on
1 1 5 1 Density Sand Minimal 93.0 94.0 3.3 7.2 74.5 75.3 0.29 0.28 0.76 0.74 0.002 1.5 5.2 0.23 0.28 1.5 5.2 0.27 0.28
2 10 95.1 0.28 0.72 0.002 4.4 10.4 0.31 0.43 4.3 10.4 0.37 0.41
3 20 95.5 0.27 0.71 0.002 9.7 20.8 0.31 0.46 9.3 21.0 0.49 0.44
4 40 95.9 0.27 0.27 0.71 0.002 20.1 42.0 0.55 0.48 19.7 42.1 0.56 0.47
2 5 2 Density Sand Minimal 94.2 94.7 8.0 10.0 75.5 75.9 0.28 0.28 0.27 0.74 0.73 0.002 1.2 5.2 0.28 0.23 1.2 5.2 0.28 0.23
3 10 3 Density Sand Minimal 98.3 99.3 23.7 27.4 78.8 79.6 0.25 0.25 0.66 0.65 0.004 4.0 10.3 0.17 0.39 4.0 10.3 0.17 0.39
1 20 99.7 0.24 0.64 0.004 9.5 20.5 0.24 0.46 9.3 20.6 0.27 0.45
2 40 99.9 0.24 0.24 0.64 0.004 20.4 41.3 0.34 0.49 18.1 43.1 0.84 0.42
4 40 14 Density Sand Minimal 97.8 99.8 22.1 29.0 78.4 79.9 0.26 0.24 0.24 0.67 0.64 0.004 17.9 40.8 0.20 0.44 17.8 41.1 0.28 0.43
18 5 14 Density Sand Moderate 101.1 101.7 33.6 35.7 81.0 81.5 0.24 0.23 0.23 0.62 0.61 0.0015 1.0 5.1 0.05 0.20 1.1 5.4 0.61 0.20
5 20 5 Pea Gravel Moderate 98.9 104.9 63.3 97.8 93.9 99.6 0.25 0.21 0.21 0.65 0.56 0.004 7.6 20.3 0.08 0.38 7.3 20.3 0.10 0.36
6 5 4 Pea Gravel Moderate 101.4 101.9 78.3 81.2 96.3 96.8 0.23 0.23 0.23 0.61 0.60 0.008 2.4 5.2 0.20 0.45 2.4 5.7 1.17 0.42
7 1 1 7 Pea Gravel Moderate 101.8 101.8 80.3 80.3 96.6 96.6 0.23 0.23 0.23 0.61 0.61 0.002 0.4 0.8 0.13 0.51 0.4 0.8 0.17 0.49
2 40 102.9 0.23 0.22 0.59 0.04 22.7 41.1 0.28 0.55 19.2 41.8 0.48 0.46
9 10 6 Pea Gravel Moderate 101.1 101.5 76.3 79.0 96.0 96.4 0.24 0.23 0.23 0.62 0.61 0.04 3.9 10.2 0.05 0.38 3.9 10.7 0.63 0.36
10 10 9 Silty Clay Static Loading 87.1 98.8 82.4 93.5 0.37 0.27 0.26 0.93 0.70 0.00027 1.4 10.2 0.14 0.13 1.2 10.4 0.46 0.12
11 5 10 Silty Clay Static Loading 80.8 88.2 76.5 83.4 0.37 0.28 0.27 1.08 0.91 0.00027 0.9 5.2 0.24 0.18 0.8 5.2 0.45 0.16
12 40 11 Silty Clay Static Loading 85.3 100.3 80.7 94.8 0.36 0.25 0.24 0.98 0.68 0.00027 8.3 40.7 0.20 0.20 7.5 43.2 0.87 0.17
13 20 12 Silty Clay Static Loading 85.3 98.0 80.7 92.7 0.37 0.27 0.25 0.98 0.72 0.00027 3.4 20.3 0.17 0.17 2.9 22.0 1.05 0.13
14 20 13 Crushed Rock Moderate 67.8 70.0 87.4 99.4 96.7 99.8 0.53 0.50 0.49 1.33 1.26 0.0015 4.4 20.3 0.13 0.22 3.8 23.7 1.82 0.16
15 5 15 Crushed Rock Moderate 66.5 67.5 80.3 86.1 94.9 96.3 0.54 0.53 0.53 1.37 1.34 0.0015 1.4 5.1 0.04 0.28 1.2 5.9 1.63 0.20
16 10 16 Crushed Rock Moderate 65.7 65.7 75.6 75.6 93.8 93.8 0.55 0.55 0.55 1.40 1.40 0.0015 2.9 10.1 0.07 0.29 2.1 11.9 1.82 0.18
17 40 17 Crushed Rock Moderate 67.0 69.3 83.1 95.5 95.6 98.8 0.54 0.51 0.48 1.36 1.28 0.0015 13.1 40.6 0.17 0.32 10.0 48.1 2.00 0.21
19 10 19 Washed Crushed Rock Moderate 67.8 68.1 87.8 89.3 96.8 97.2 0.52 0.52 0.52 1.33 1.32 0.0015 2.4 10.1 0.08 0.23 1.7 10.7 0.71 0.16
20 20 20 Silty Sand Static Loading 96.0 107.3 83.7 93.5 0.22 0.21 0.20 0.75 0.57 0.0015 3.0 20.2 0.08 0.15 2.3 23.4 1.71 0.10
21 10 21 Silty Sand Static Loading 102.1 107.5 88.9 93.6 0.24 0.21 0.20 0.65 0.57 0.0015 1.3 10.1 0.08 0.13 0.5 11.6 1.60 0.05
22 5 22 Silty Sand Static Loading 92.1 101.8 83.5 88.7 0.18 0.24 0.23 0.83 0.57 0.0015 0.7 5.1 0.07 0.14 0.3 5.8 1.63 0.06
23 40 23 Silty Sand Static Loading 96.1 110.1 83.5 95.9 0.21 0.13 0.13 0.57 0.35 0.0012 7.1 40.4 0.12 0.17 6.3 45.5 1.44 0.14
Note 4. Each PE coupon tested was assigned a unique number.
Note 2. See Table 1 for materal descriptions.
Note 1. In some instances the normal stress was increased in a stepwise fashion during the test. Each applied normal stress is assigned a number indicating the order of the staged process.
Residual Shear (lb/in2)
Note 3. "Static Loading" is a compaction method that entails placing the test specimen at a moisture content near the liquid limit the applying vertical pressure that compacts the specimen. Pressure was applied in
incements that doubled beginning with 5 psi.
Dry Unit
Weight (lb/ft3)
Relative Density
(ASTM D4254)
Percent
Compaction Water Content Void Ratio Peak Shear (lb/in2)
Table 3. Test conditions and results.

Table 4. Comparison of interface friction coefficients.
ASCE 2014
See Note 1
ASTM D2774 Common Name µr
Soil Class Symbol Group Name Material Tested High Low High Low High Low High Low High Low
I GP Poorly Graded Gravel Crushed Rock w trace of clay fines 0.35 0.22 0.20 0.16 N/A N/A N/A
II GP Poorly Graded Gravel Pea Gravel 0.55 0.30 0.43 0.31 0.25 0.53 0.36
SP Poorly Graded Sand Density Sand 16-30 0.49 0.22 0.47 0.16 0.25 0.53 0.25
III SM Silty Sand Silty Sand 0.18 0.13 0.14 0.05 0.20 N/A N/A
IV CL-ML Silty Clay Silty Clay 0.20 0.13 0.18 0.13 0.72 0.19 0.33 0.09 0.10 0.39 0.49
0.52 0.15
ASTM D2487 µp µr
0.70 0.24
Note 2. Results of 13 pullout tests on PE wrapped steel pipe. Values back calculated using AWWA M-11 equation 13-6.
Note 1. ASCE Recommended Values (McCabe 2014). Data was not provided in reference.
µ (Peak)
This Study
Alam et.al. - 2013
(See Note 2)
Koerner, 2005
(adhesion=0, scaled from plots)
µp µr
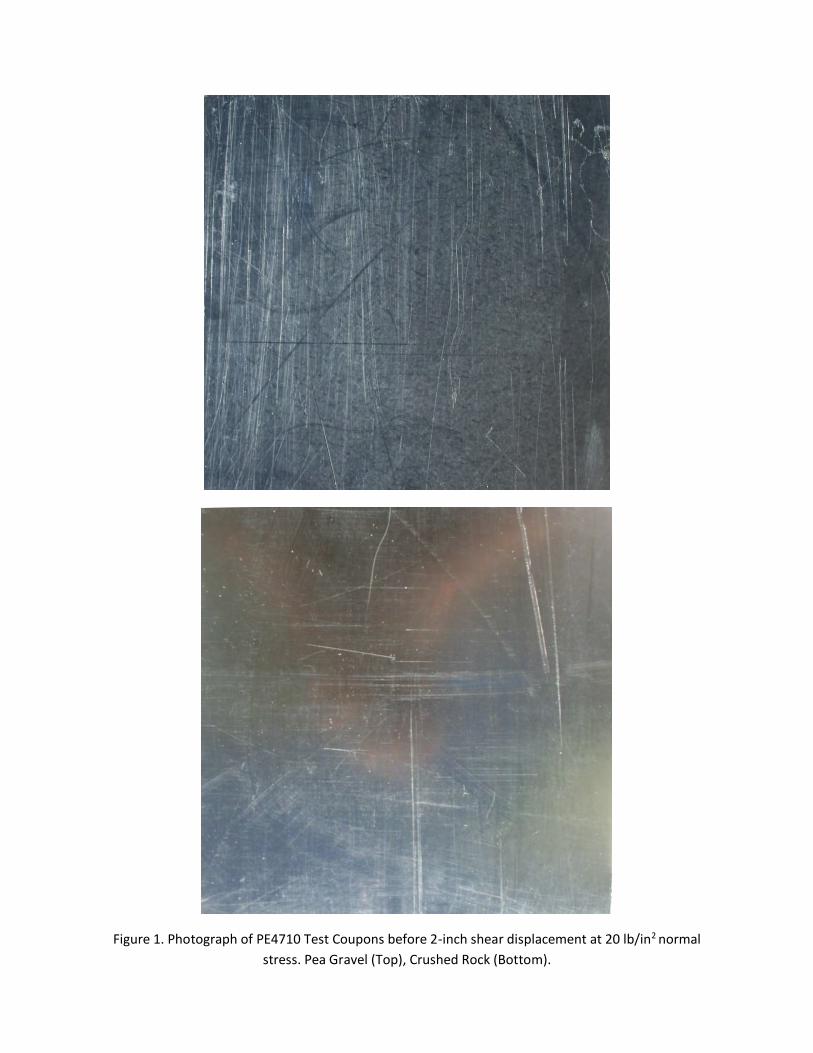
Figure 1. Photograph of PE4710 Test Coupons before 2-inch shear displacement at 20 lb/in2 normal
stress. Pea Gravel (Top), Crushed Rock (Bottom).

Figure 2. Photographs of Crushed Rock. Upper and Lower photographs are images of the same sample.

Figure 3. Image of Pea Gravel.

Figure 4. Image of Density Sand.
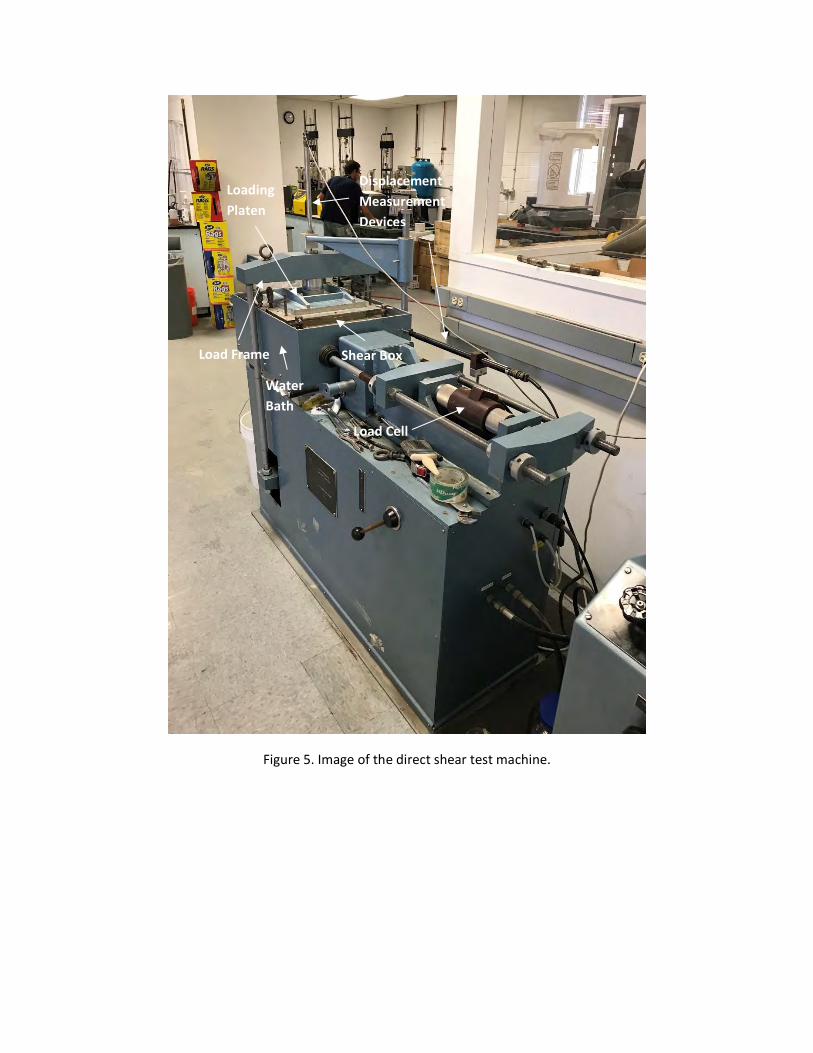
Figure 5. Image of the direct shear test machine.
Shear Box
Load Cell
Load Frame
Loading
Platen
Displacement
Measurement
Devices
Water
Bath
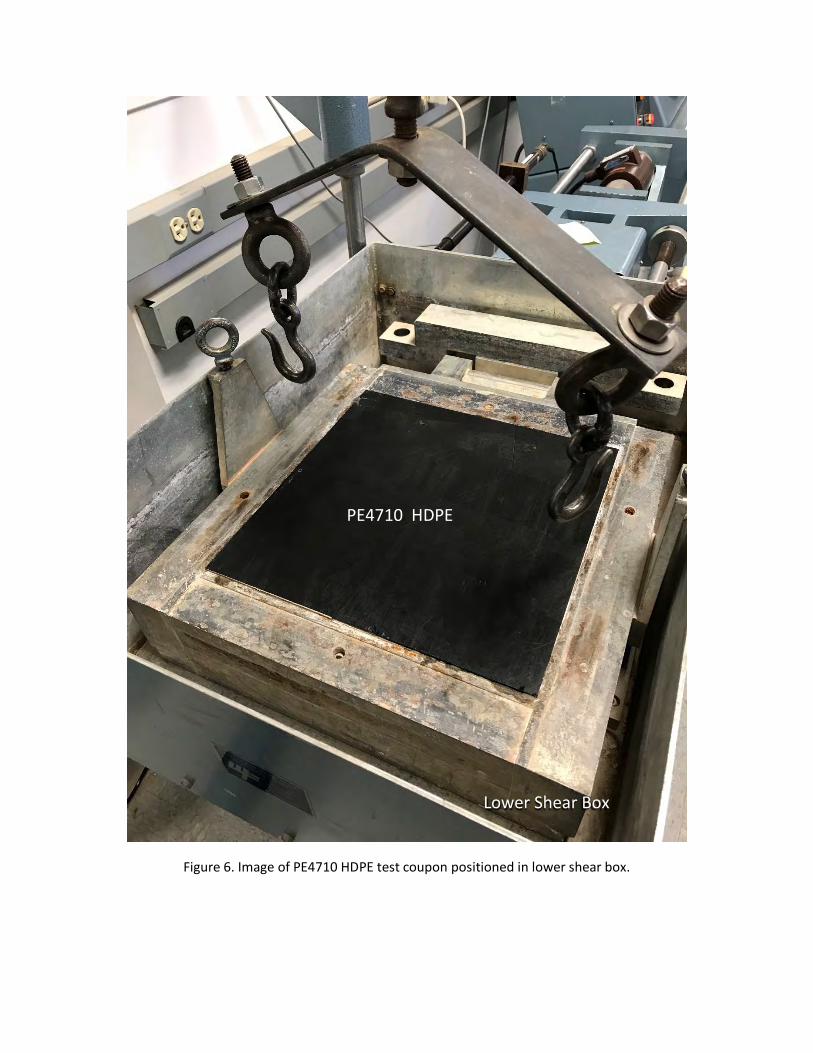
Figure 6. Image of PE4710 HDPE test coupon positioned in lower shear box.
PE4710 HDPE
Lower Shear Box
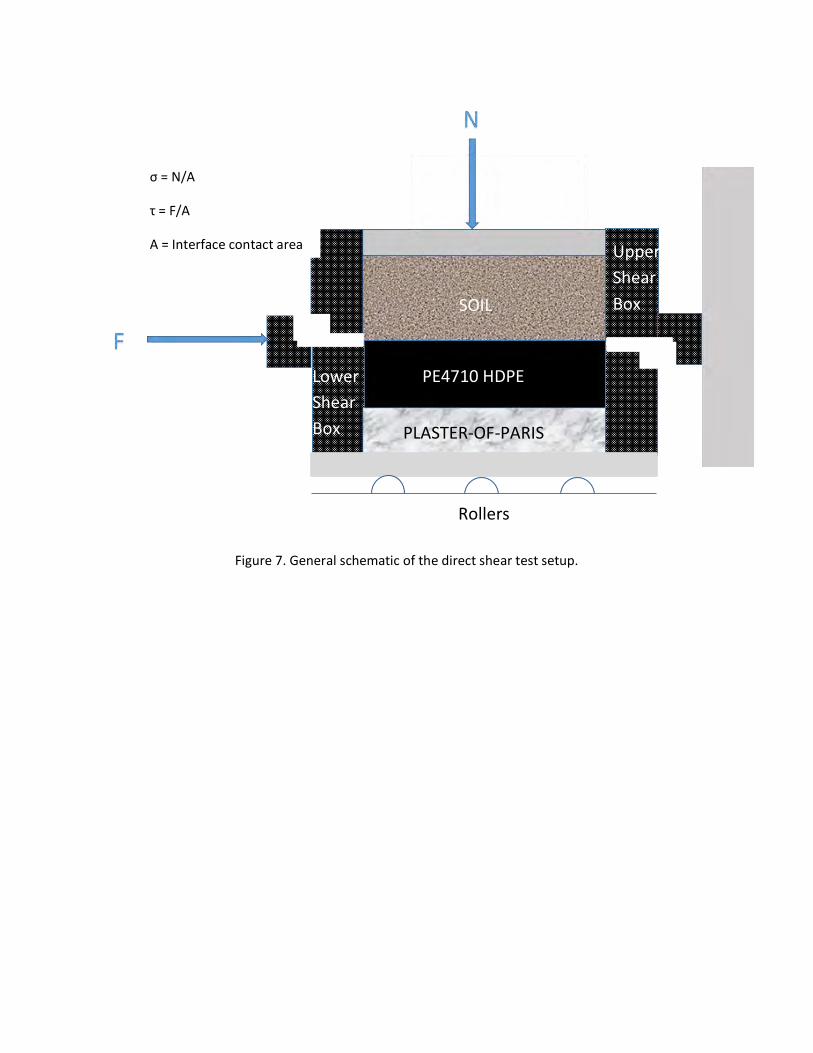
Figure 7. General schematic of the direct shear test setup.
Upper
Shear
Box
σ = N/A
τ = F/A
A = Interface contact area
Rollers
PE4710 HDPE
SOIL
PLASTER-OF-PARIS
Lower
Shear
Box

Figure 8. Photograph of PE4710 Test Coupons following 2-inch shear displacement at 20 lb/in2 normal
stress. Pea Gravel (Top), Crushed Rock (Bottom). Contrast with Figure 1.

Figure 9. A conceptual representation of the change in axial displacement and interface shear stress
with increased distance from the centerline of a long horizontally buried pipeline due to a change in
temperature or pressure (Note: shear stress distribution theoretically differs with changes in pipe dimensions,
pipe material, embedment, cover, and magnitude of temperature and/or pressure change.)
0
0.05
0.1
0.15
0.2
0.25
0.3
-1200 -900 -600 -300 0 300 600 900 1200
Axi
al D
isp
lace
men
t (in
)
Distance from Centeril ine of Horizontal Buried Pipeline (in)
0
0.1
0.2
0.3
0.4
0.5
0.6
0.7
0.8
-1200 -900 -600 -300 0 300 600 900 1200
Inte
rfa
ce S
hea
r S
tres
s (l
b/i
n2)
Distance from Centerline of a Horizontal Buried Pipe (in)

Test 1- Normal Stress = 5, 10, 20, 40 lb/in2. Density Sand, POORLY GRADED SAND (SP), 100 percent hard, medium-size, quartz sand. Particles break with moderate hammer blow. Interface Coefficients of Friction: µp5 = 0.28, µp10 = 0.43, µp20 = 0.46, µp40 = 0.48; µr5 = 0.28, µr10 = 0.41, µr20 = 0.44, µr40 = 0.47.
1 A
Seating Load
0.00
0.02
0.04
0.06
0.08
0.10
0.12
1 10 100 1000 10000
Vert
ical D
ispla
cem
ent
-in
Log Time - min
Vertical Displacement v Log of Time
0.00
0.02
0.04
0.06
0.08
0.10
0.12
0.00 0.10 0.20 0.30 0.40 0.50 0.60
Vert
ical D
ispla
cem
ent
-in
Horizontal Displacement - in
Vertical Displacement v Horizontal Displacement
Seating Load
5 psi consolidation
5 psi Shear
10 psi consolidation &
shear
20 psi consolidation
and Shear 40 psi
consolidation and Shear

Test 1- Normal Stress = 5, 10, 20, 40 lb/in2. Density Sand, POORLY GRADED SAND (SP), 100 percent hard, medium-size, quartz sand. Particles break with moderate hammer blow. Interface Coefficients of Friction: µp5 = 0.28, µp10 = 0.43, µp20 = 0.46, µp40 = 0.48; µr5 = 0.28, µr10 = 0.41, µr20 = 0.44, µr40 = 0.47.
2 A
Seating Load
0
200
400
600
800
1000
1200
1400
1600
0.00 0.10 0.20 0.30 0.40 0.50 0.60
Tim
e -
min
ute
s
Horizontal Displacement - in
Horizontal Displacement v Time
0.000
0.050
0.100
0.150
0.200
0.250
0.300
0.350
0.400
0.450
0.500
0
5
10
15
20
25
30
35
40
45
50
0.00 0.10 0.20 0.30 0.40 0.50 0.60
Ratio o
f S
hear
Str
ess to N
orm
al
Str
ess
Corr
ecte
d S
tress (
lbf/in
2)
Horizontal Displacement - in
Corrected Shear Stress v Horizontal DisplacementRatio of Shear Stress to Normal Stress v Horizontal Displacement
Shear Normal Shear/Normal
P
P
R P
R
P
R
R
Normal
Shear
µ

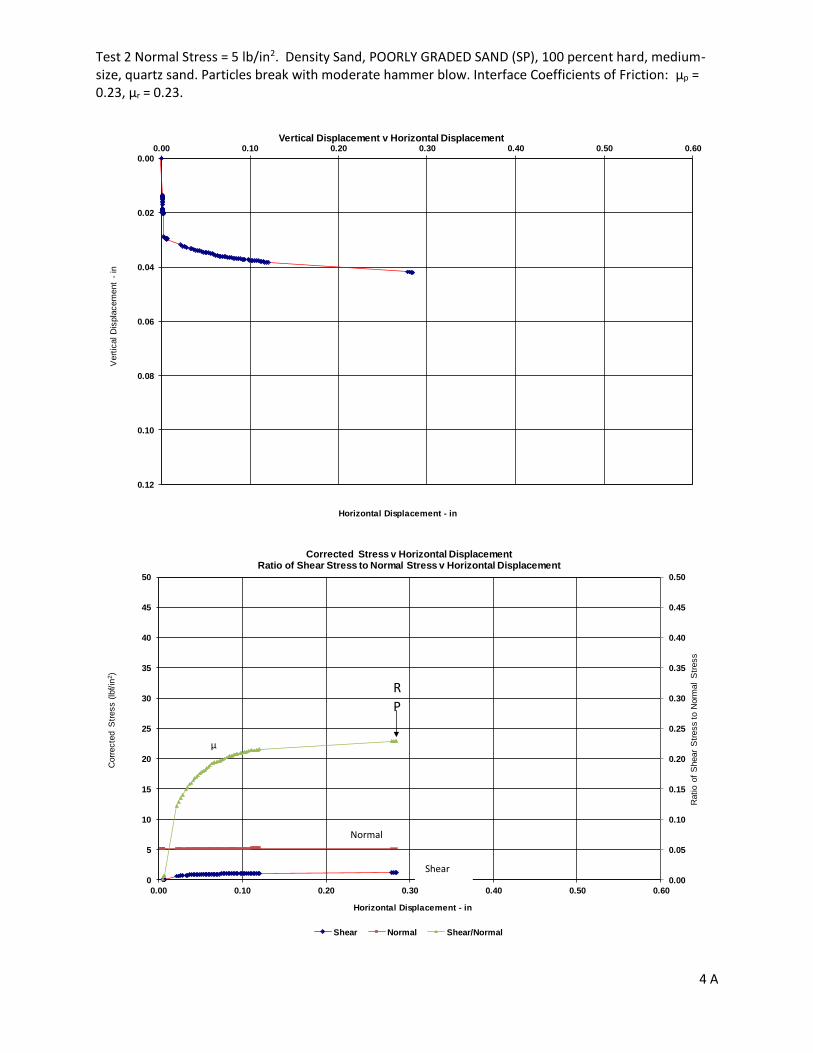
Test 2 Normal Stress = 5 lb/in2. Density Sand, POORLY GRADED SAND (SP), 100 percent hard, medium-size, quartz sand. Particles break with moderate hammer blow. Interface Coefficients of Friction: µp = 0.23, µr = 0.23.
3 A
0.00
0.02
0.04
0.06
0.08
0.10
0.12
0 1 10 100 1000 10000
Vert
ical D
ispla
cem
ent
-in
Log Time - min
Vertical Displacement v Log of Time
0
200
400
600
800
1000
1200
1400
0.00 0.10 0.20 0.30 0.40 0.50 0.60
Tim
e -
min
Horizontal Displacement - in
Horizontal Displacement v Time
Seating Load
5 psi consolidation Shear
Test 2 Normal Stress = 5 lb/in2. Density Sand, POORLY GRADED SAND (SP), 100 percent hard, medium-size, quartz sand. Particles break with moderate hammer blow. Interface Coefficients of Friction: µp = 0.23, µr = 0.23.
4 A
0.00
0.02
0.04
0.06
0.08
0.10
0.12
0.00 0.10 0.20 0.30 0.40 0.50 0.60
Vert
ical D
ispla
cem
ent
-in
Horizontal Displacement - in
Vertical Displacement v Horizontal Displacement
0.00
0.05
0.10
0.15
0.20
0.25
0.30
0.35
0.40
0.45
0.50
0
5
10
15
20
25
30
35
40
45
50
0.00 0.10 0.20 0.30 0.40 0.50 0.60
Ratio o
f S
hear
Str
ess to N
orm
al
Str
ess
Corr
ecte
d S
tress (
lbf/in
2)
Horizontal Displacement - in
Corrected Stress v Horizontal DisplacementRatio of Shear Stress to Normal Stress v Horizontal Displacement
Shear Normal Shear/Normal
R
P
µ
Shear
Normal
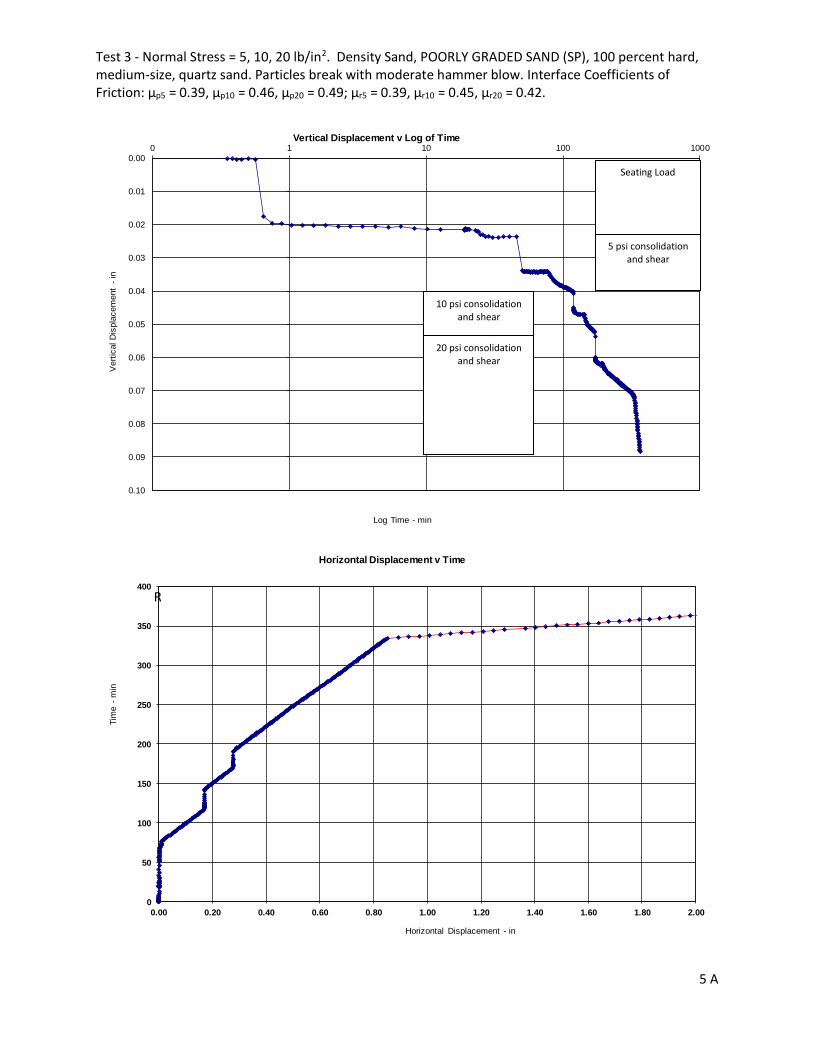
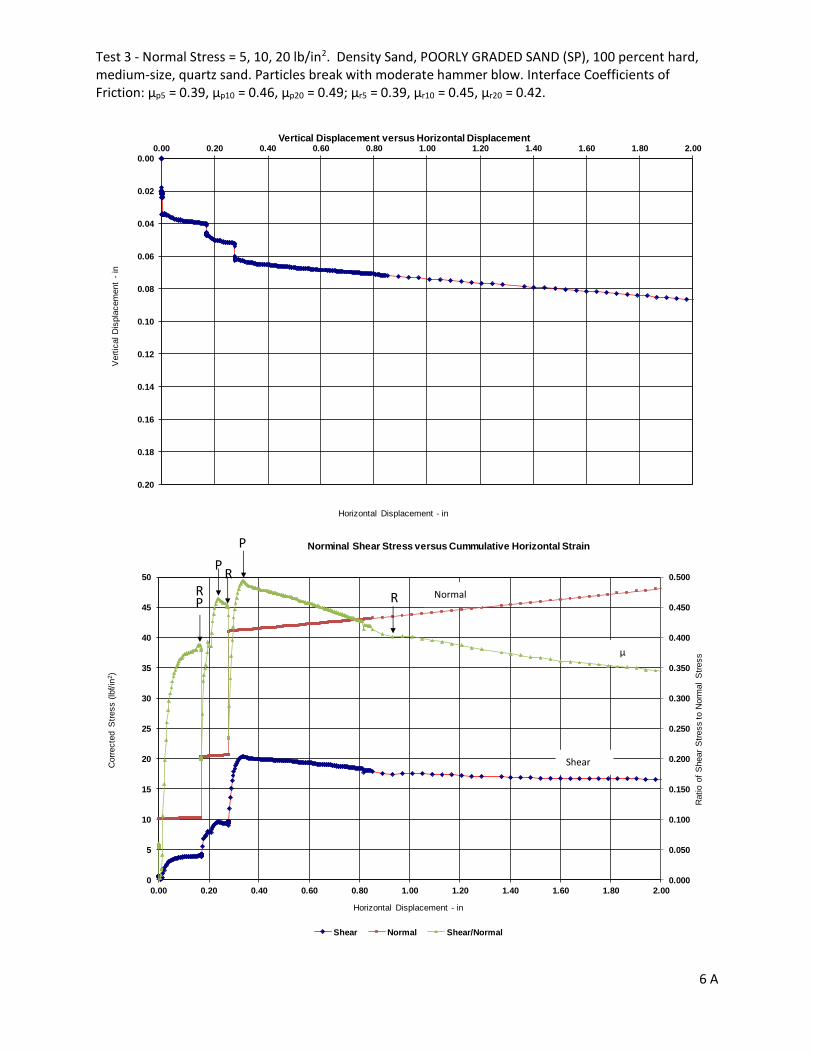
Test 3 - Normal Stress = 5, 10, 20 lb/in2. Density Sand, POORLY GRADED SAND (SP), 100 percent hard, medium-size, quartz sand. Particles break with moderate hammer blow. Interface Coefficients of Friction: µp5 = 0.39, µp10 = 0.46, µp20 = 0.49; µr5 = 0.39, µr10 = 0.45, µr20 = 0.42.
5 A
0.00
0.01
0.02
0.03
0.04
0.05
0.06
0.07
0.08
0.09
0.10
0 1 10 100 1000
Vert
ical D
ispla
cem
ent
-in
Log Time - min
Vertical Displacement v Log of Time
0
50
100
150
200
250
300
350
400
0.00 0.20 0.40 0.60 0.80 1.00 1.20 1.40 1.60 1.80 2.00
Tim
e -
min
Horizontal Displacement - in
Horizontal Displacement v Time
R
20 psi consolidation and shear
10 psi consolidation and shear
5 psi consolidation and shear
Seating Load
Test 3 - Normal Stress = 5, 10, 20 lb/in2. Density Sand, POORLY GRADED SAND (SP), 100 percent hard, medium-size, quartz sand. Particles break with moderate hammer blow. Interface Coefficients of Friction: µp5 = 0.39, µp10 = 0.46, µp20 = 0.49; µr5 = 0.39, µr10 = 0.45, µr20 = 0.42.
6 A
0.00
0.02
0.04
0.06
0.08
0.10
0.12
0.14
0.16
0.18
0.20
0.00 0.20 0.40 0.60 0.80 1.00 1.20 1.40 1.60 1.80 2.00
Vert
ical D
ispla
cem
ent
-in
Horizontal Displacement - in
Vertical Displacement versus Horizontal Displacement
0.000
0.050
0.100
0.150
0.200
0.250
0.300
0.350
0.400
0.450
0.500
0
5
10
15
20
25
30
35
40
45
50
0.00 0.20 0.40 0.60 0.80 1.00 1.20 1.40 1.60 1.80 2.00
Ratio o
f S
hear
Str
ess to N
orm
al
Str
ess
Corr
ecte
d S
tress (
lbf/in
2)
Horizontal Displacement - in
Norminal Shear Stress versus Cummulative Horizontal Strain
Shear Normal Shear/Normal
µ
Shear
Normal P
P R
P
R R

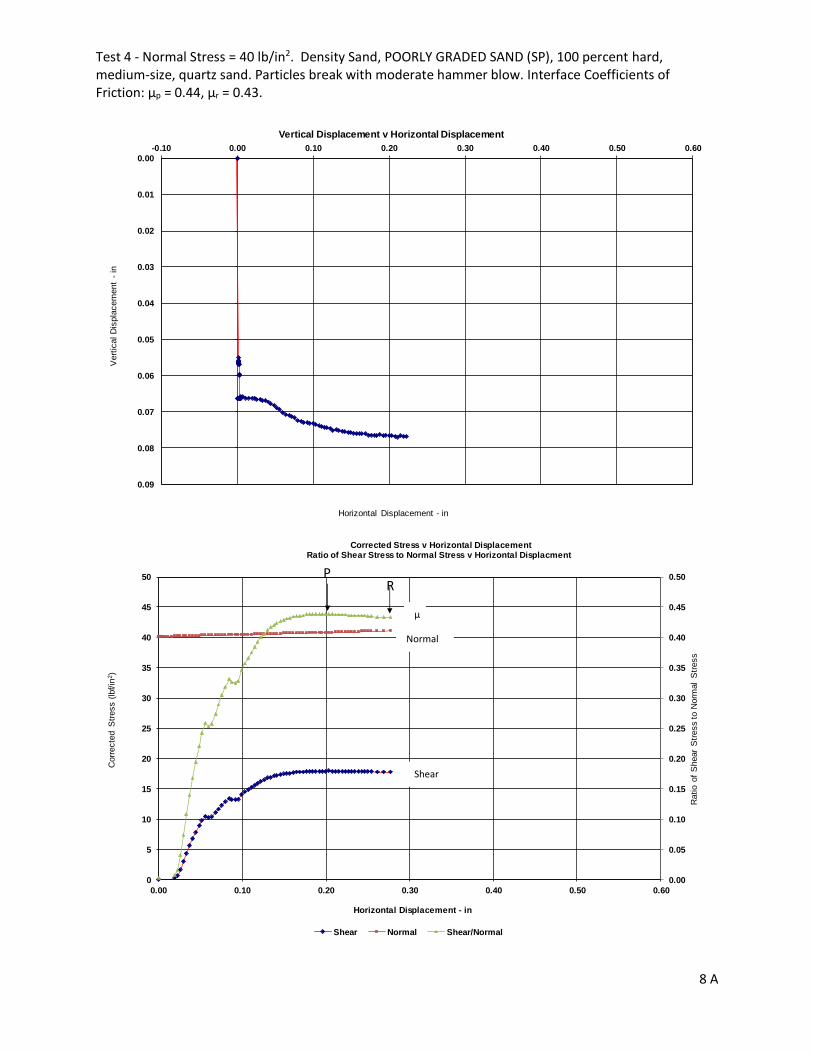
Test 4 - Normal Stress = 40 lb/in2. Density Sand, POORLY GRADED SAND (SP), 100 percent hard, medium-size, quartz sand. Particles break with moderate hammer blow. Interface Coefficients of Friction: µp = 0.44, µr = 0.43.
7 A
0.00
0.01
0.02
0.03
0.04
0.05
0.06
0.07
0.08
0.09
1 10 100
Vert
ical D
ispla
cem
ent
-in
Log Time - min
Vertical Displacement v Log of Time
0.00
10.00
20.00
30.00
40.00
50.00
60.00
70.00
80.00
90.00
100.00
0.00 0.10 0.20 0.30 0.40 0.50 0.60
Tim
e -
min
Horizontal Displacement - in
Horizontal Displacement v Time
Seating
Load
5 psi consolidation
Shear
Test 4 - Normal Stress = 40 lb/in2. Density Sand, POORLY GRADED SAND (SP), 100 percent hard, medium-size, quartz sand. Particles break with moderate hammer blow. Interface Coefficients of Friction: µp = 0.44, µr = 0.43.
8 A
0.00
0.01
0.02
0.03
0.04
0.05
0.06
0.07
0.08
0.09
-0.10 0.00 0.10 0.20 0.30 0.40 0.50 0.60
Vert
ical D
ispla
cem
ent
-in
Horizontal Displacement - in
Vertical Displacement v Horizontal Displacement
0.00
0.05
0.10
0.15
0.20
0.25
0.30
0.35
0.40
0.45
0.50
0
5
10
15
20
25
30
35
40
45
50
0.00 0.10 0.20 0.30 0.40 0.50 0.60
Ratio o
f S
hear
Str
ess to N
orm
al
Str
ess
Corr
ecte
d S
tress (
lbf/in
2)
Horizontal Displacement - in
Corrected Stress v Horizontal DisplacementRatio of Shear Stress to Normal Stress v Horizontal Displacment
Shear Normal Shear/Normal
P R
Normal
µ
Shear

Test 5 - Normal Stress = 20 lb/in2. Pea Gravel, POORLY GRADED GRAVEL (SP), 100 percent hard, subrounded to subangular gravel. Maximum particle size ½-inch. Particles break with moderate hammer blow. Interface Coefficients of Friction: µp = 0.38, µr = 0.36.
9 A
0.00
0.05
0.10
0.15
0.20
0.25
0.1 1.0 10.0 100.0 1000.0
Vert
ical D
ispla
cem
ent
-in
Log Time - min
Vertical Displacement v Log of Time
0
50
100
150
200
250
0.00 0.20 0.40 0.60 0.80 1.00 1.20 1.40 1.60 1.80 2.00
Tim
e -
min
Horizontal Displacement - in
Horizontal Displacement v Time
5 psi consolidation
Shear
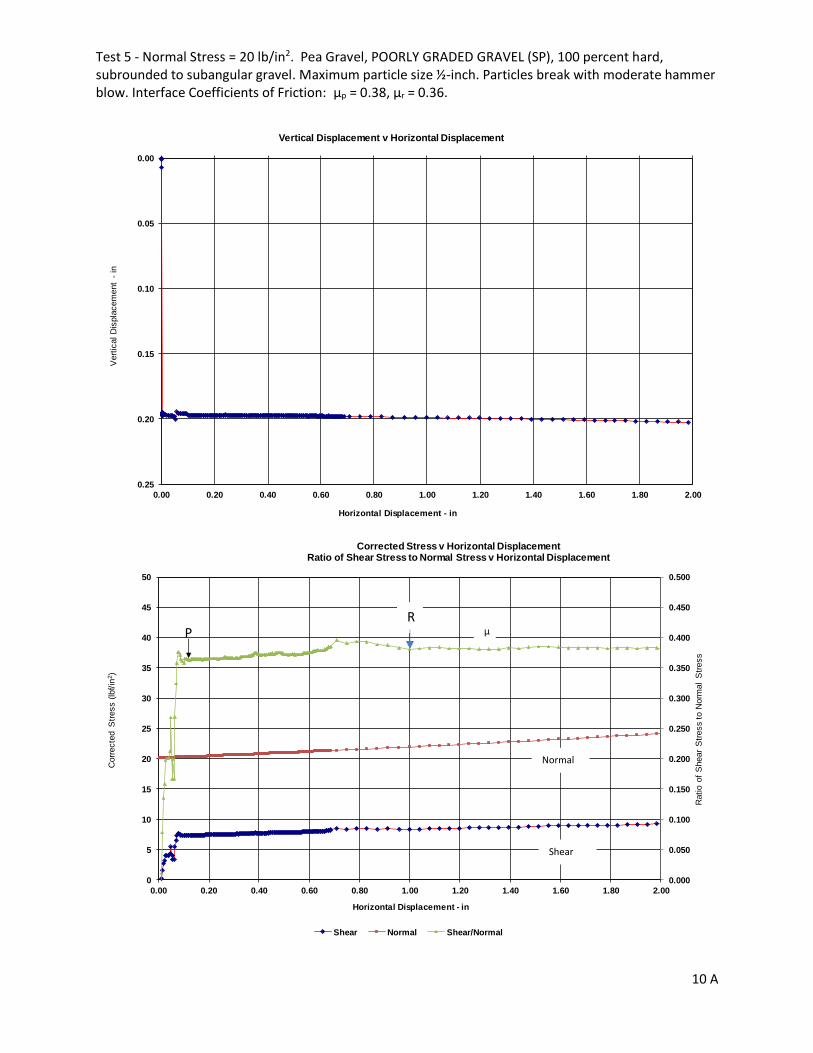
Test 5 - Normal Stress = 20 lb/in2. Pea Gravel, POORLY GRADED GRAVEL (SP), 100 percent hard, subrounded to subangular gravel. Maximum particle size ½-inch. Particles break with moderate hammer blow. Interface Coefficients of Friction: µp = 0.38, µr = 0.36.
10 A
0.00
0.05
0.10
0.15
0.20
0.25
0.00 0.20 0.40 0.60 0.80 1.00 1.20 1.40 1.60 1.80 2.00
Vert
ical D
ispla
cem
ent
-in
Horizontal Displacement - in
Vertical Displacement v Horizontal Displacement
0.000
0.050
0.100
0.150
0.200
0.250
0.300
0.350
0.400
0.450
0.500
0
5
10
15
20
25
30
35
40
45
50
0.00 0.20 0.40 0.60 0.80 1.00 1.20 1.40 1.60 1.80 2.00
Ratio o
f S
hear
Str
ess to N
orm
al
Str
ess
Corr
ecte
d S
tress (
lbf/in
2)
Horizontal Displacement - in
Corrected Stress v Horizontal DisplacementRatio of Shear Stress to Normal Stress v Horizontal Displacement
Shear Normal Shear/Normal
R P
Normal
Shear
µ

Test 6 - Normal Stress = 5 lb/in2. Pea Gravel, POORLY GRADED GRAVEL (SP), 100 percent hard, subrounded to subangular gravel. Maximum particle size ½-inch. Particles break with moderate hammer blow. Interface Coefficients of Friction: µp = 0.45, µr = 0.42.
11 A
0.000
0.002
0.004
0.006
0.008
0.010
0.012
0.014
0.016
0.018
0.020
0.1 1.0 10.0 100.0 1000.0
Vert
ical D
ispla
cem
ent
-in
Log Time - min
Vertical Displacement v Log of Time
0
50
100
150
200
250
300
0.00 0.20 0.40 0.60 0.80 1.00 1.20 1.40 1.60 1.80 2.00
Tim
e -
min
Horizontal Displacment - in
Horizontal Displacement v Time
5 psi consolidation
Seating Load
Shear

Test 6 - Normal Stress = 5 lb/in2. Pea Gravel, POORLY GRADED GRAVEL (SP), 100 percent hard, subrounded to subangular gravel. Maximum particle size ½-inch. Particles break with moderate hammer blow. Interface Coefficients of Friction: µp = 0.45, µr = 0.42.
12 A
0.000
0.005
0.010
0.015
0.020
0.00 0.20 0.40 0.60 0.80 1.00 1.20 1.40 1.60 1.80 2.00
Vert
ical D
ispla
cem
ent
-in
Horizontal Displacement - in
Vertical Displacement v Horizontal Displacement
0.00
0.05
0.10
0.15
0.20
0.25
0.30
0.35
0.40
0.45
0.50
0
5
10
15
20
25
30
35
40
45
50
0.00 0.20 0.40 0.60 0.80 1.00 1.20 1.40 1.60 1.80 2.00
Ratio o
f S
hear
Str
ess to N
orm
al
Str
ess
Corr
ecte
d S
tress (
lbf/in
2)
Horizontal Displacement - in
Corrected Stress v Horizontal DisplacementRatio of Shear Stress to Normal Stress v Horizontal Displacement
Shear Normal Shear/Normal
R
P
µ
Shear
Normal

Test 7 - Normal Stress = 1 lb/in2,40 lb/in2. Pea Gravel, POORLY GRADED GRAVEL (SP), 100 percent hard, subrounded to subangular gravel. Maximum particle size ½-inch. Particles break with moderate hammer blow. Interface Coefficients of Friction: µp1 = 0.51, µp40 = 0.55; µr1 = 0.49, µr40 = 0.46.
13 A
-0.010
0.000
0.010
0.020
0.030
0.040
0.050
1.0 10.0 100.0 1000.0
Vert
ical D
ispla
cem
ent
-in
Log Time - min
Vertical Displacement v Log of Time
0
50
100
150
200
250
0.00 0.10 0.20 0.30 0.40 0.50 0.60
Tim
e -
min
Horizontal Displacement - in
Horizontal Displacement versus Time
Seating Load Shear
5 PSI consolidation then Shear

Test 7 - Normal Stress = 1 lb/in2,40 lb/in2. Pea Gravel, POORLY GRADED GRAVEL (SP), 100 percent hard, subrounded to subangular gravel. Maximum particle size ½-inch. Particles break with moderate hammer blow. Interface Coefficients of Friction: µp1 = 0.51, µp40 = 0.55; µr1 = 0.49, µr40 = 0.46.
14 A
-0.01
0.00
0.01
0.02
0.03
0.04
0.05
0.00 0.10 0.20 0.30 0.40 0.50 0.60
Vert
ical D
ispla
cem
ent
-in
Horizontal Displacement - in
Vertical Displacement versus Horizontal Displacement
0.0
0.1
0.2
0.3
0.4
0.5
0.6
0
5
10
15
20
25
30
35
40
45
50
0.00 0.10 0.20 0.30 0.40 0.50 0.60
Ratio o
f S
hear
Str
ess to N
orm
al
Str
ess
Corr
ecte
d S
tress (
lbf/in
2)
Horizontal Displacement - in
Corrected Stress v Horizontal DisplacementRatio of Shear Stress to Normal Stress v Horizontal Displacement
Shear Normal Shear/Normal
R P
µ
Normal
Shear
P
R

Test 9 - Normal Stress = 10 lb/in2. Pea Gravel, POORLY GRADED GRAVEL (SP), 100 percent hard, subrounded to subangular gravel. Maximum particle size ½-inch. Particles break with moderate hammer blow. Interface Coefficients of Friction: µp = 0.38, µr = 0.36.
15 A
0.000
0.005
0.010
0.015
0.020
0.025
1.0 10.0 100.0
Vert
ical D
ispla
cem
ent
-in
Log Time - min
Vertical Displacement v Log of Time
0
2
4
6
8
10
12
14
16
0.00 0.10 0.20 0.30 0.40 0.50 0.60
Tim
e -
min
Horizontal Displacement - in
Horizontal Displacement v Time
Shear

Test 9 - Normal Stress = 10 lb/in2. Pea Gravel, POORLY GRADED GRAVEL (SP), 100 percent hard, subrounded to subangular gravel. Maximum particle size ½-inch. Particles break with moderate hammer blow. Interface Coefficients of Friction: µp = 0.38, µr = 0.36.
16 A
0.000
0.005
0.010
0.015
0.020
0.025
0.00 0.10 0.20 0.30 0.40 0.50 0.60
Vert
ical D
ispla
cem
ent
-in
Horizontal Displacement - in
Vertical Displacement versus Horizontal Displacement
0.00
0.05
0.10
0.15
0.20
0.25
0.30
0.35
0.40
0.45
0.50
0
2
4
6
8
10
12
14
16
18
20
0.00 0.10 0.20 0.30 0.40 0.50 0.60
Ratio o
f S
hear
Str
ess to N
orm
al
Str
ess
Corr
ecte
d S
tress (
lbf/in
2)
Horizontal Displacement - in
Corrected Stress v Horizontal DisplacementRatio of Shear Stress to Normal Stress v Horizontal Displacement
Shear Normal Shear/Normal
R P
Normal
Shear
µ
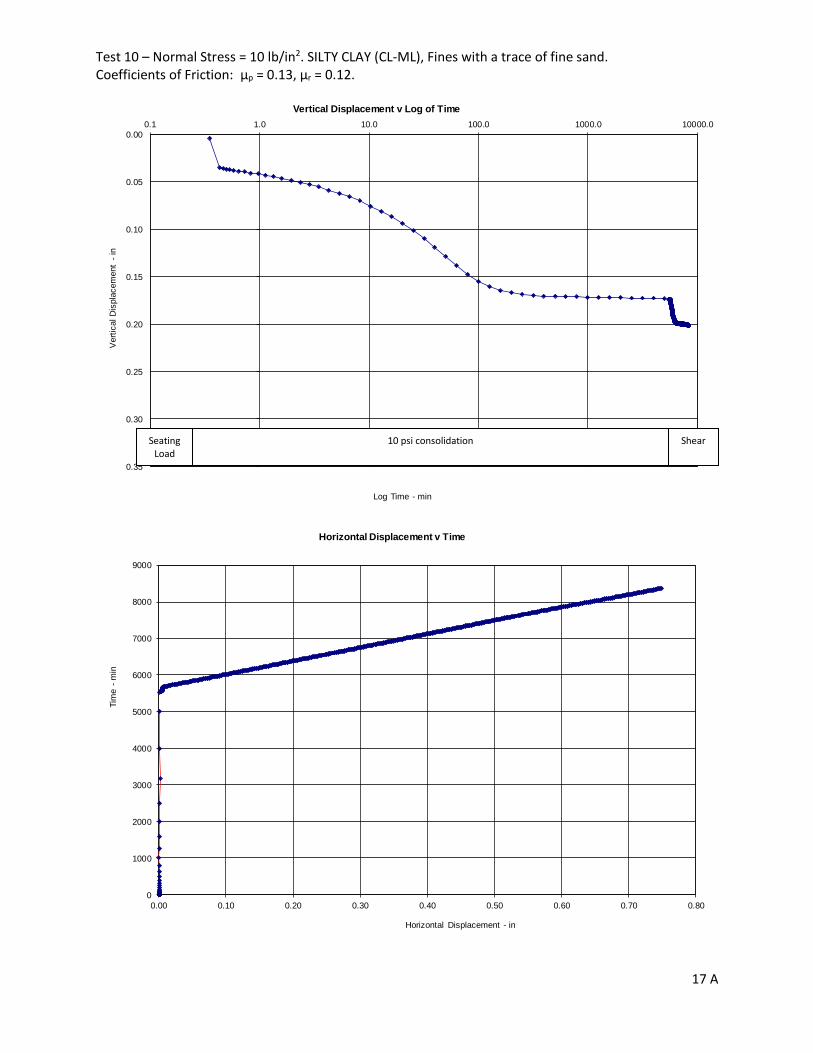
Test 10 – Normal Stress = 10 lb/in2. SILTY CLAY (CL-ML), Fines with a trace of fine sand. Coefficients of Friction: µp = 0.13, µr = 0.12.
17 A
0.00
0.05
0.10
0.15
0.20
0.25
0.30
0.35
0.1 1.0 10.0 100.0 1000.0 10000.0
Vert
ical D
ispla
cem
ent
-in
Log Time - min
Vertical Displacement v Log of Time
0
1000
2000
3000
4000
5000
6000
7000
8000
9000
0.00 0.10 0.20 0.30 0.40 0.50 0.60 0.70 0.80
Tim
e -
min
Horizontal Displacement - in
Horizontal Displacement v Time
Seating Load
10 psi consolidation
Shear

Test 10 – Normal Stress = 10 lb/in2. SILTY CLAY (CL-ML), Fines with a trace of fine sand. Coefficients of Friction: µp = 0.13, µr = 0.12.
18 A
0.00
0.05
0.10
0.15
0.20
0.00 0.10 0.20 0.30 0.40 0.50 0.60 0.70 0.80
Vert
ical D
ispla
cem
ent
-in
Horizontal Displacement - in
Vertical Displacement v Horizontal Displacement
0.0
0.1
0.1
0.2
0.2
0.3
0.3
0.4
0.4
0.5
0.5
0
5
10
15
20
25
30
35
40
45
50
0.0 0.1 0.2 0.3 0.4 0.5 0.6 0.7 0.8
Ratio o
f S
hear
Str
ess to N
orm
al
Str
ess
Corr
ecte
d S
tress (
lbf/in
2)
Horizontal Displacement - in
Corrected Stress v Horizontal DisplacementRatio of Shear Stress to Normal Stress v Horizontal Displacement
Shear Normal Shear/Normal
R P
µ
Normal
Shear

Test 11 – Normal Stress = 5 lb/in2. SILTY CLAY (CL-ML), Fines with a trace of fine sand. Coefficients of Friction: µp = 0.18, µr = 0.16.
19 A
0.00
0.05
0.10
0.15
0.20
0.25
0.30
0.35
0.40
0.45
0.50
0.1 1.0 10.0 100.0 1000.0 10000.0
Vert
ical D
ispla
cem
ent
-in
Log Time - min
Vertical Displacement v Log of Time
0
1000
2000
3000
4000
5000
6000
7000
8000
0.0 0.1 0.2 0.3 0.4 0.5 0.6 0.7
Tim
e -
min
horizontal Displacement - in
Horizontal Displacement v Time
Seating Load
5 psi consolidation
Shear

Test 11 – Normal Stress = 5 lb/in2. SILTY CLAY (CL-ML), Fines with a trace of fine sand. Coefficients of Friction: µp = 0.18, µr = 0.16.
20 A
0.00
0.02
0.04
0.06
0.08
0.10
0.12
0.14
0.16
0.18
0.20
0.0 0.1 0.2 0.3 0.4 0.5 0.6 0.7
Vert
ical D
ispla
cem
ent
-in
Horizontal Displacement - in
Vertical Displacement v Horizontal Displacement
0.0
0.1
0.1
0.2
0.2
0.3
0
1
2
3
4
5
6
0.0 0.1 0.2 0.3 0.4 0.5 0.6 0.7
Ratio o
f S
hear
Str
ess to N
orm
al
Str
ess
Corr
ecte
d S
tress (
lbf/in
2)
Horizontal Displacement - in
Corrected Stress v Horizontal DisplacementRatio of Shear Stress to Normal Stress v Horizontal Displacement
Shear Normal Shear/Normal
P
R
µ
Shear
Normal
Normal Load
Drifted during
this horizontal
displacement
interval

Test 12 – Normal Stress = 40 lb/in2. SILTY CLAY (CL-ML), Fines with a trace of fine sand. Coefficients of Friction: µp = 0.20, µr = 0.17.
21 A
0.00
0.05
0.10
0.15
0.20
0.25
0.30
0.35
0.40
0.1 1.0 10.0 100.0 1000.0 10000.0
Vert
ical D
ispla
cem
ent
-in
Log Time - min
Vertical Displacement v Log of Time
0
1000
2000
3000
4000
5000
6000
7000
8000
9000
0.00 0.20 0.40 0.60 0.80 1.00 1.20
Tim
e -
min
Horizontal Displacement - in
Horizontal Displacement v Time
Shear
5 psi
10
psi
20
psi
40
psi
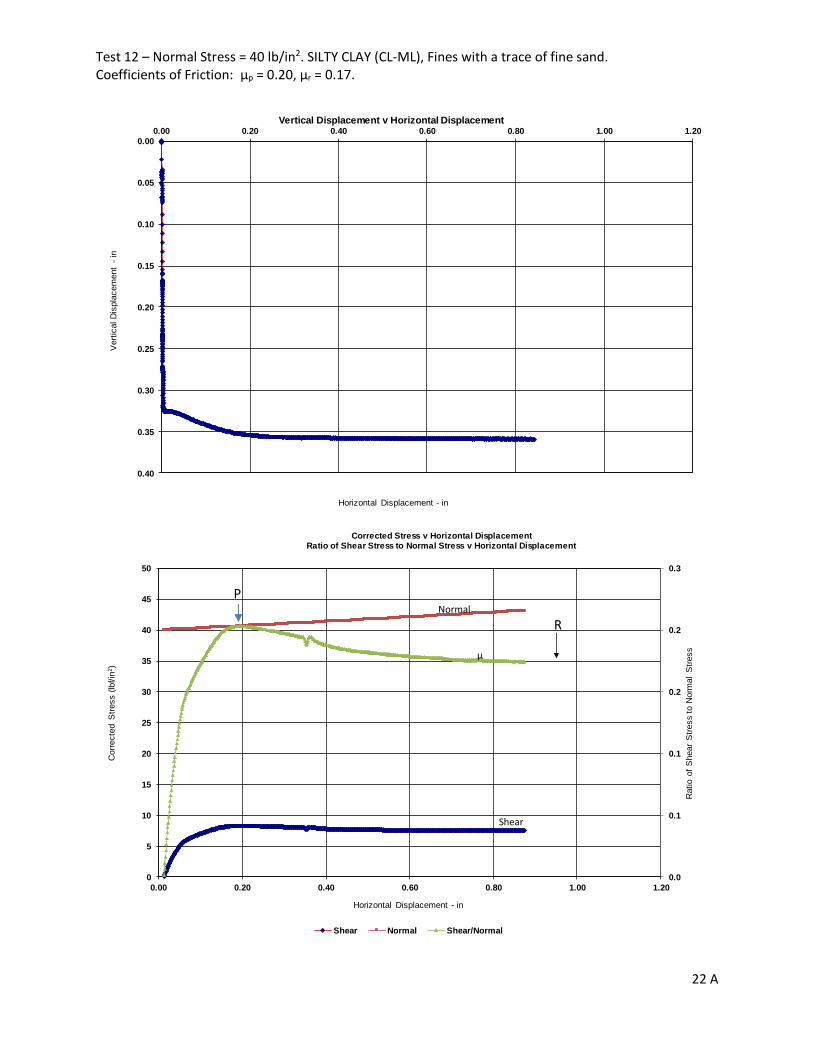
Test 12 – Normal Stress = 40 lb/in2. SILTY CLAY (CL-ML), Fines with a trace of fine sand. Coefficients of Friction: µp = 0.20, µr = 0.17.
22 A
0.00
0.05
0.10
0.15
0.20
0.25
0.30
0.35
0.40
0.00 0.20 0.40 0.60 0.80 1.00 1.20
Vert
ical D
ispla
cem
ent
-in
Horizontal Displacement - in
Vertical Displacement v Horizontal Displacement
0.0
0.1
0.1
0.2
0.2
0.3
0
5
10
15
20
25
30
35
40
45
50
0.00 0.20 0.40 0.60 0.80 1.00 1.20
Ratio o
f S
hear
Str
ess to N
orm
al
Str
ess
Corr
ecte
d S
tress (
lbf/in
2)
Horizontal Displacement - in
Corrected Stress v Horizontal DisplacementRatio of Shear Stress to Normal Stress v Horizontal Displacement
Shear Normal Shear/Normal
P
R
Shear
Normal
µ

Test 13 – Normal Stress = 20 lb/in2. SILTY CLAY (CL-ML), Fines with a trace of fine sand. Coefficients of Friction: µp = 0.17, µr = 0.13.
23 A
0.00
0.01
0.02
0.03
0.04
0.05
0.06
0.07
0.08
0.0 0.1 1.0 10.0 100.0 1000.0 10000.0
Vert
ical D
ispla
cem
ent -
in
Log Time - min
Vertical Displacement v Log of Time
0
1000
2000
3000
4000
5000
6000
7000
8000
0.00 0.20 0.40 0.60 0.80 1.00 1.20
Tim
e -
min
Horizontal Displacement - in
Horizontal Displacement v Time
Shear
20 psi consolidation Shear
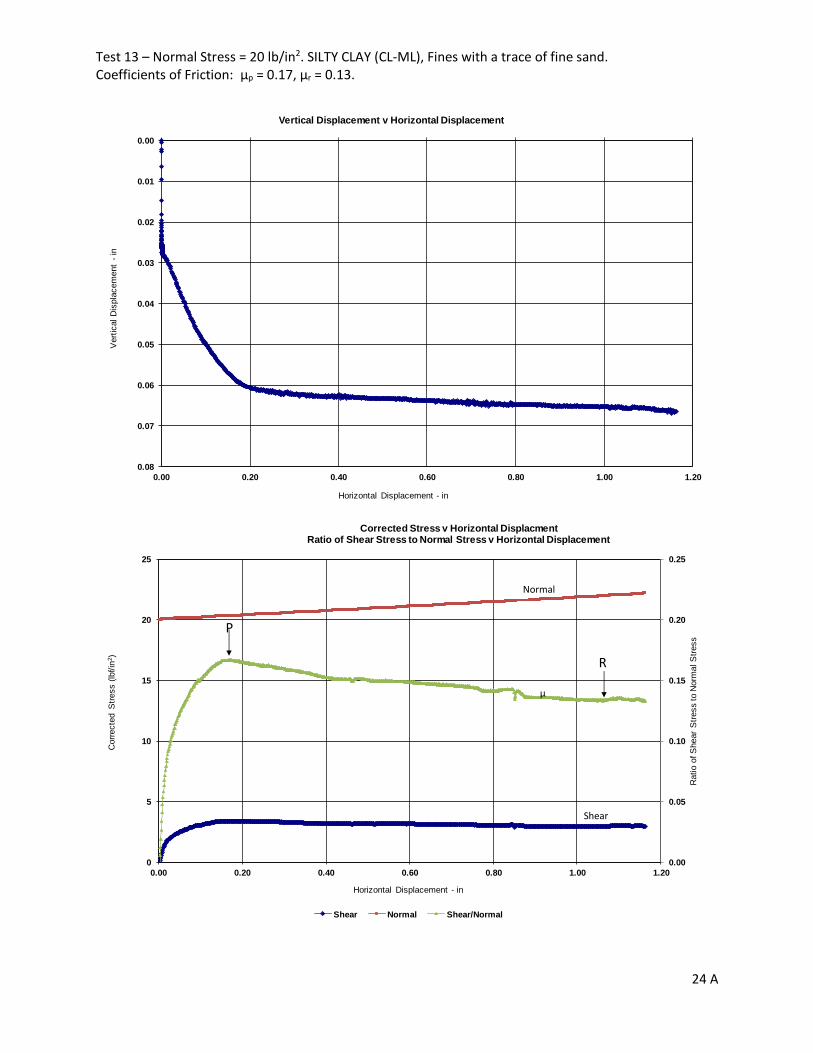
Test 13 – Normal Stress = 20 lb/in2. SILTY CLAY (CL-ML), Fines with a trace of fine sand. Coefficients of Friction: µp = 0.17, µr = 0.13.
24 A
0.00
0.01
0.02
0.03
0.04
0.05
0.06
0.07
0.08
0.00 0.20 0.40 0.60 0.80 1.00 1.20
Vert
ical D
ispla
cem
ent
-in
Horizontal Displacement - in
Vertical Displacement v Horizontal Displacement
0.00
0.05
0.10
0.15
0.20
0.25
0
5
10
15
20
25
0.00 0.20 0.40 0.60 0.80 1.00 1.20
Ratio o
f S
hear
Str
ess to N
orm
al S
tress
Corr
ecte
d S
tress (
lbf/in
2)
Horizontal Displacement - in
Corrected Stress v Horizontal DisplacmentRatio of Shear Stress to Normal Stress v Horizontal Displacement
Shear Normal Shear/Normal
P
R
Shear
Normal
µ
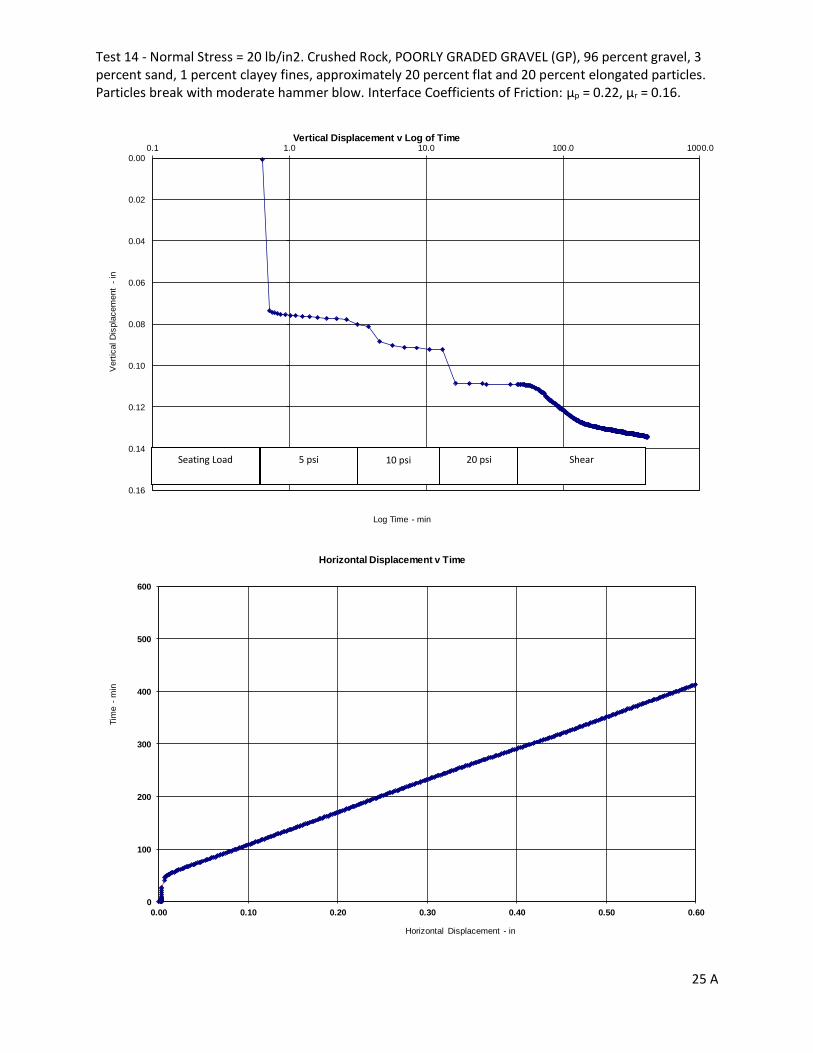
Test 14 - Normal Stress = 20 lb/in2. Crushed Rock, POORLY GRADED GRAVEL (GP), 96 percent gravel, 3 percent sand, 1 percent clayey fines, approximately 20 percent flat and 20 percent elongated particles. Particles break with moderate hammer blow. Interface Coefficients of Friction: µp = 0.22, µr = 0.16.
25 A
0.00
0.02
0.04
0.06
0.08
0.10
0.12
0.14
0.16
0.1 1.0 10.0 100.0 1000.0
Vert
ical D
ispla
cem
ent
-in
Log Time - min
Vertical Displacement v Log of Time
0
100
200
300
400
500
600
0.00 0.10 0.20 0.30 0.40 0.50 0.60
Tim
e -
min
Horizontal Displacement - in
Horizontal Displacement v Time
20 psi
10 psi
5 psi
Seating Load
Shear

Test 14 - Normal Stress = 20 lb/in2. Crushed Rock, POORLY GRADED GRAVEL (GP), 96 percent gravel, 3 percent sand, 1 percent clayey fines, approximately 20 percent flat and 20 percent elongated particles. Particles break with moderate hammer blow. Interface Coefficients of Friction: µp = 0.22, µr = 0.16.
26 A
0.00
0.02
0.04
0.06
0.08
0.10
0.12
0.14
0.16
0.18
0.20
-0.10 0.00 0.10 0.20 0.30 0.40 0.50 0.60
Vert
ical D
ispla
cem
ent
-in
Horizontal Displacement - in
Vertical Displacement v Horizontal Displacement
0.00
0.05
0.10
0.15
0.20
0.25
0.30
0.35
0.40
0.45
0.50
0
5
10
15
20
25
0.00 0.20 0.40 0.60 0.80 1.00 1.20 1.40 1.60 1.80 2.00
Ratio o
f S
hear
Str
ess to N
orm
al
Str
ess
Corr
ecte
d S
tress (
lbf/in
2)
Horizontal Displacement - in
Corrected Stress v Horizontal DisplacementRatio of Shear to Normal Stress v Horizontal Displacement
Shear Normal Shear/Normal
R
P
Shear
Normal
µ
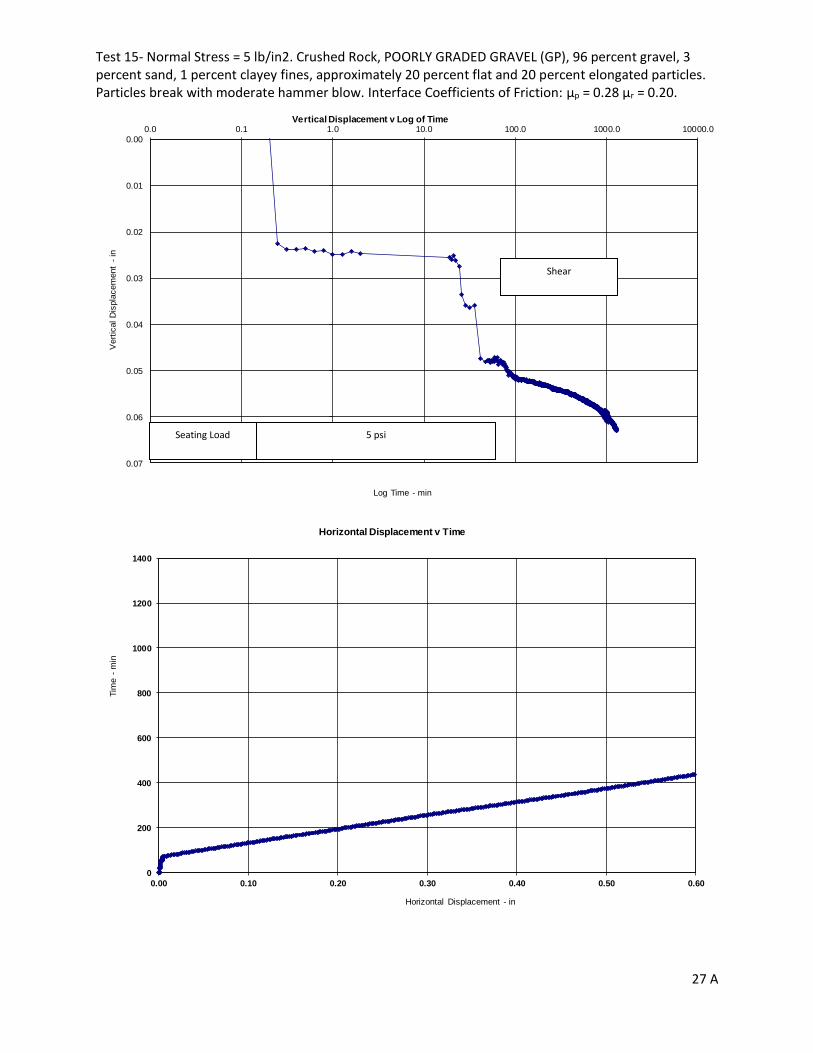
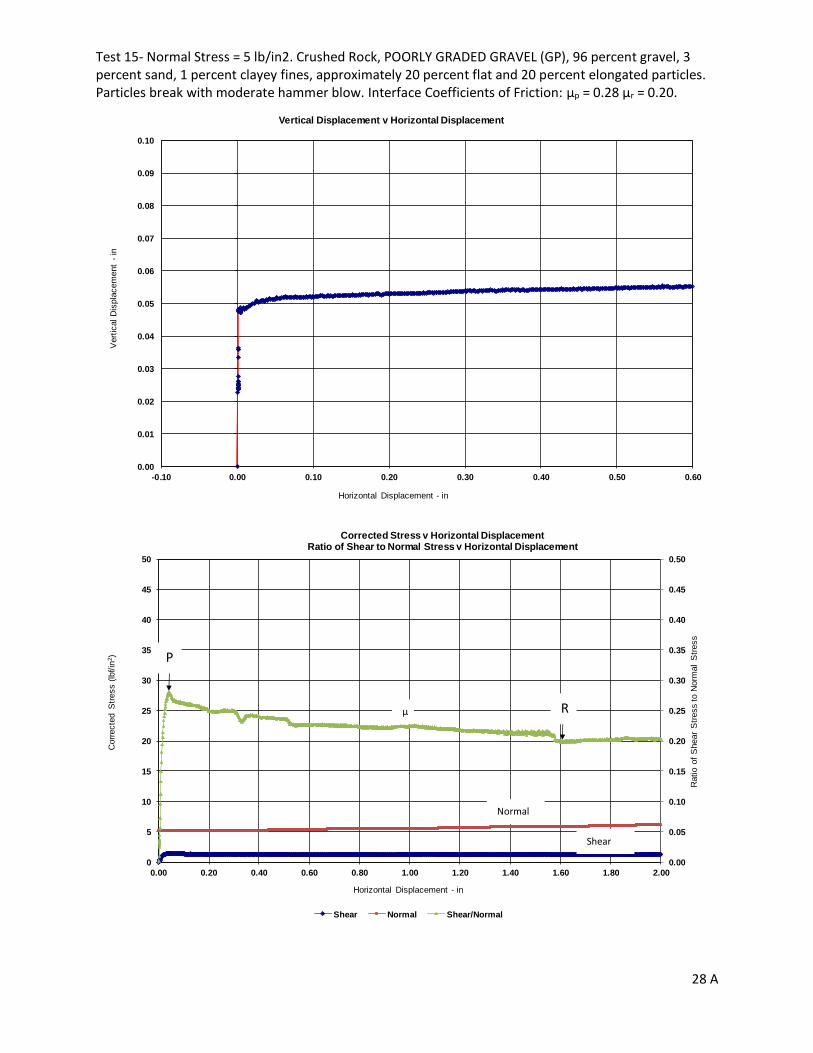
Test 15- Normal Stress = 5 lb/in2. Crushed Rock, POORLY GRADED GRAVEL (GP), 96 percent gravel, 3 percent sand, 1 percent clayey fines, approximately 20 percent flat and 20 percent elongated particles. Particles break with moderate hammer blow. Interface Coefficients of Friction: µp = 0.28 µr = 0.20.
27 A
0.00
0.01
0.02
0.03
0.04
0.05
0.06
0.07
0.0 0.1 1.0 10.0 100.0 1000.0 10000.0
Vert
ical D
ispla
cem
ent
-in
Log Time - min
Vertical Displacement v Log of Time
0
200
400
600
800
1000
1200
1400
0.00 0.10 0.20 0.30 0.40 0.50 0.60
Tim
e -
min
Horizontal Displacement - in
Horizontal Displacement v Time
Seating Load
5 psi
Shear
Test 15- Normal Stress = 5 lb/in2. Crushed Rock, POORLY GRADED GRAVEL (GP), 96 percent gravel, 3 percent sand, 1 percent clayey fines, approximately 20 percent flat and 20 percent elongated particles. Particles break with moderate hammer blow. Interface Coefficients of Friction: µp = 0.28 µr = 0.20.
28 A
0.00
0.01
0.02
0.03
0.04
0.05
0.06
0.07
0.08
0.09
0.10
-0.10 0.00 0.10 0.20 0.30 0.40 0.50 0.60
Vert
ical D
ispla
cem
ent
-in
Horizontal Displacement - in
Vertical Displacement v Horizontal Displacement
0.00
0.05
0.10
0.15
0.20
0.25
0.30
0.35
0.40
0.45
0.50
0
5
10
15
20
25
30
35
40
45
50
0.00 0.20 0.40 0.60 0.80 1.00 1.20 1.40 1.60 1.80 2.00
Ratio o
f S
hear
Str
ess to N
orm
al
Str
ess
Corr
ecte
d S
tress (
lbf/in
2)
Horizontal Displacement - in
Corrected Stress v Horizontal DisplacementRatio of Shear to Normal Stress v Horizontal Displacement
Shear Normal Shear/Normal
R
P
Normal
Shear
µ

Test 16 - Normal Stress = 10 lb/in2. Crushed Rock, POORLY GRADED GRAVEL (GP), 96 percent gravel, 3 percent sand, 1 percent clayey fines, approximately 20 percent flat and 20 percent elongated particles. Particles break with moderate hammer blow. Interface Coefficients of Friction: µp = 0.29 µr = 0.18.
29 A
0.000
0.005
0.010
0.015
0.020
0.1 1.0 10.0 100.0 1000.0 10000.0
Vert
ical D
ispla
cem
ent
-in
Log Time - min
Vertical Displacement v Log of Time
0
200
400
600
800
1000
1200
1400
0.00 0.20 0.40 0.60 0.80 1.00 1.20 1.40 1.60 1.80 2.00
Tim
e -
min
Horizontal Displacement - in
Horizontal Displacement vTime
Displacement not recorded during
the application of 10 psi normal
stress.
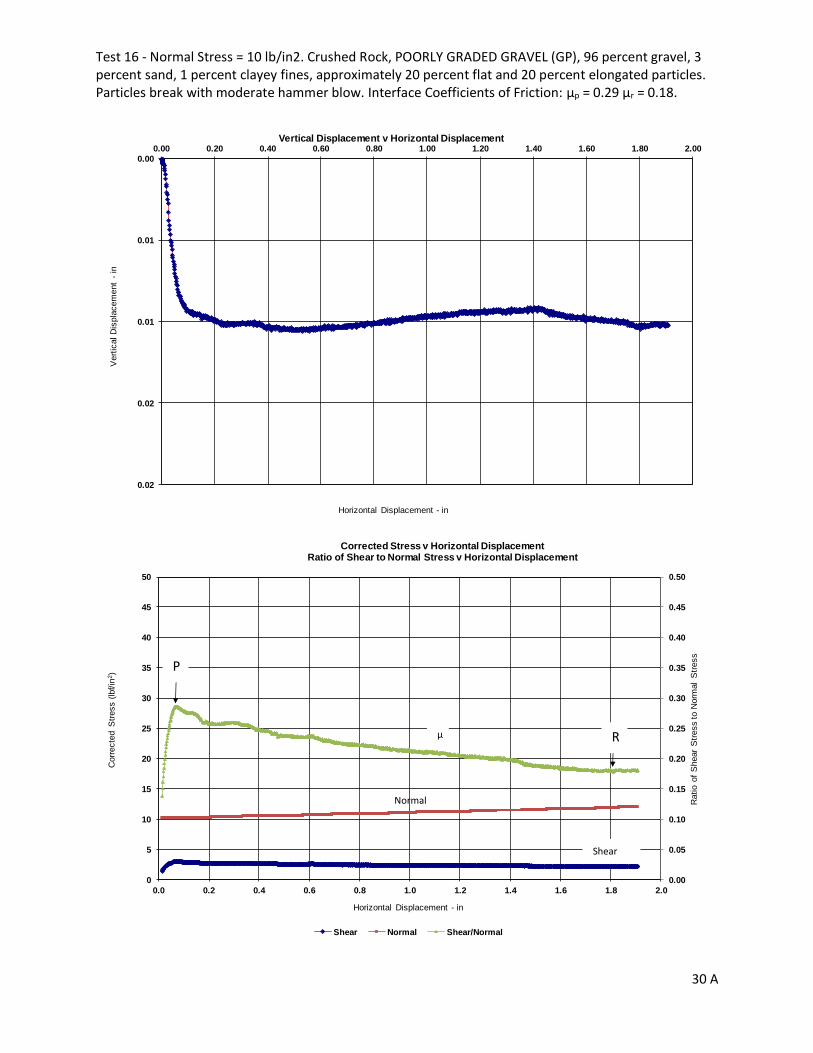
Test 16 - Normal Stress = 10 lb/in2. Crushed Rock, POORLY GRADED GRAVEL (GP), 96 percent gravel, 3 percent sand, 1 percent clayey fines, approximately 20 percent flat and 20 percent elongated particles. Particles break with moderate hammer blow. Interface Coefficients of Friction: µp = 0.29 µr = 0.18.
30 A
0.00
0.01
0.01
0.02
0.02
0.00 0.20 0.40 0.60 0.80 1.00 1.20 1.40 1.60 1.80 2.00
Vert
ical D
ispla
cem
ent
-in
Horizontal Displacement - in
Vertical Displacement v Horizontal Displacement
0.00
0.05
0.10
0.15
0.20
0.25
0.30
0.35
0.40
0.45
0.50
0
5
10
15
20
25
30
35
40
45
50
0.0 0.2 0.4 0.6 0.8 1.0 1.2 1.4 1.6 1.8 2.0
Ratio o
f S
hear
Str
ess to N
orm
al
Str
ess
Corr
ecte
d S
tress (
lbf/in
2)
Horizontal Displacement - in
Corrected Stress v Horizontal DisplacementRatio of Shear to Normal Stress v Horizontal Displacement
Shear Normal Shear/Normal
R
P
Shear
Normal
µ

Test 17 - Normal Stress = 40 lb/in2. Crushed Rock, POORLY GRADED GRAVEL (GP), 96 percent gravel, 3 percent sand, 1 percent clayey fines, approximately 20 percent flat and 20 percent elongated particles. Particles break with moderate hammer blow. Interface Coefficients of Friction: µp = 0.32 µr = 0.21.
31 A
0.00
0.05
0.10
0.15
0.20
0.25
0.1 1.0 10.0 100.0 1000.0 10000.0
Vert
ical D
ispla
cem
ent -
in
Log Time - min
Vertical Displacement v Log of Time
0
100
200
300
400
500
600
0.00 0.10 0.20 0.30 0.40 0.50 0.60
Horizonta
l D
ispla
cem
ent
-in
Time - min
Horizontal Displacement v Time
Seating Load
10,20&40
psi
Shear 5 psi
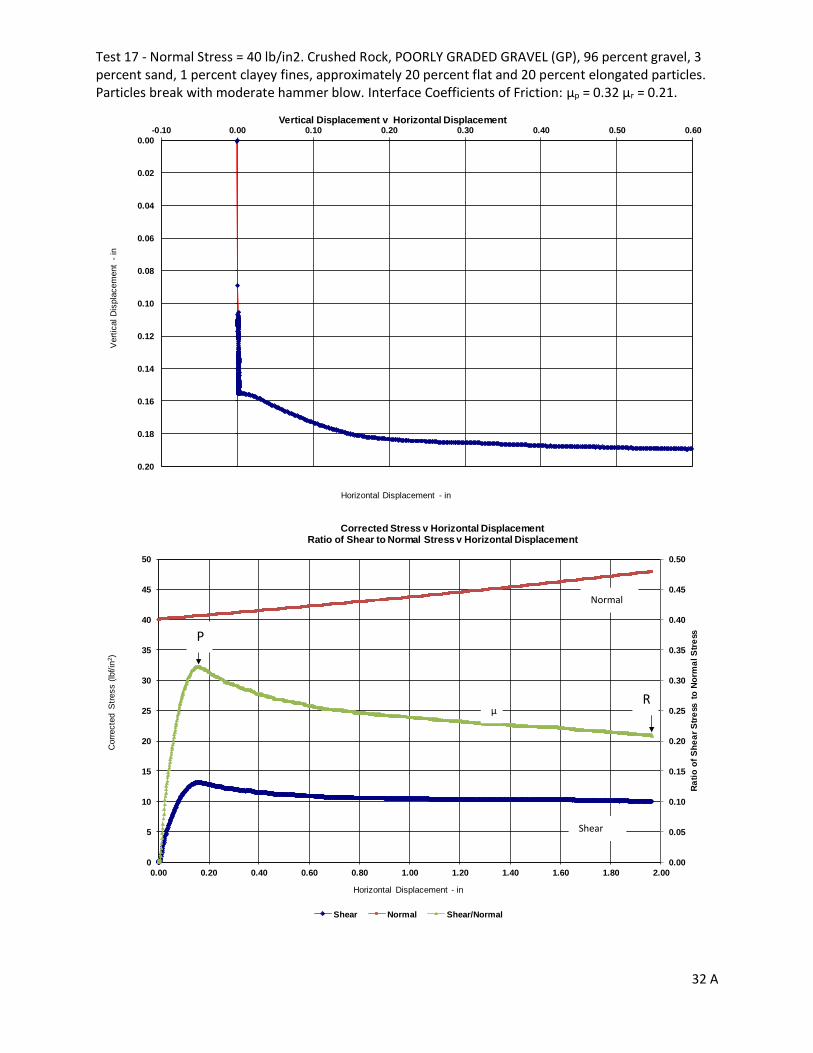
Test 17 - Normal Stress = 40 lb/in2. Crushed Rock, POORLY GRADED GRAVEL (GP), 96 percent gravel, 3 percent sand, 1 percent clayey fines, approximately 20 percent flat and 20 percent elongated particles. Particles break with moderate hammer blow. Interface Coefficients of Friction: µp = 0.32 µr = 0.21.
32 A
0.00
0.02
0.04
0.06
0.08
0.10
0.12
0.14
0.16
0.18
0.20
-0.10 0.00 0.10 0.20 0.30 0.40 0.50 0.60
Vert
ical D
ispla
cem
ent
-in
Horizontal Displacement - in
Vertical Displacement v Horizontal Displacement
0.00
0.05
0.10
0.15
0.20
0.25
0.30
0.35
0.40
0.45
0.50
0
5
10
15
20
25
30
35
40
45
50
0.00 0.20 0.40 0.60 0.80 1.00 1.20 1.40 1.60 1.80 2.00
Ra
tio
of
Sh
ea
r S
tre
ss to
No
rma
l S
tre
ss
Corr
ecte
d S
tress (
lbf/in
2)
Horizontal Displacement - in
Corrected Stress v Horizontal DisplacementRatio of Shear to Normal Stress v Horizontal Displacement
Shear Normal Shear/Normal
R
P
Shear
Normal
µ

Test 18 - Normal Stress = 5 lb/in2. POORLY GRADED SAND (SP), 100 percent hard, medium-size, quartz sand. Particles break with moderate hammer blow. Interface Coefficients of Friction: µp = 0.20, µr = 0.20.
33 A
0.000
0.005
0.010
0.015
0.020
0.025
1.0 10.0 100.0 1000.0 10000.0
Vert
ical D
ispla
cem
ent
-in
Log Time - min
Vertical Displacement v Log of Time
0
200
400
600
800
1000
1200
0.00 0.20 0.40 0.60 0.80 1.00 1.20 1.40 1.60 1.80 2.00
Tim
e -
min
Horozontal Displacement - in
Horizontal Displacement v Time
Seating Load
Shear at Seating
Load
5 psi Shear

Test 18 - Normal Stress = 5 lb/in2. POORLY GRADED SAND (SP), 100 percent hard, medium-size, quartz sand. Particles break with moderate hammer blow. Interface Coefficients of Friction: µp = 0.20, µr = 0.20.
34 A
0.000
0.005
0.010
0.015
0.020
0.025
0.00 0.20 0.40 0.60 0.80 1.00 1.20 1.40 1.60 1.80 2.00
Vert
ical D
ispla
cem
ent
-in
Horizontal Displacement - in
Vertical Displacement v Horizontal Displacement
0.000
0.050
0.100
0.150
0.200
0.250
0.300
0.350
0.400
0.450
0.500
0
5
10
15
20
25
30
35
40
45
50
0.00 0.20 0.40 0.60 0.80 1.00 1.20 1.40 1.60 1.80 2.00
Ratio o
f S
hear
Str
ess to N
orm
al
Str
ess
Corr
ecte
d S
tress (
lbf/in
2)
Horizontal Displacement - in
Corrected Stress v Horizontal DisplacementRatio of Shear Stress to Normal Stress v Horizontal Displacment
Shear Normal Shear/Normal
P R
Shear
Normal
µ

Test 19 - Normal Stress = 10 lb/in2. Crushed Rock, POORLY GRADED GRAVEL (GP), 96 percent gravel, 3 percent sand, 1 percent clayey fines, approximately 20 percent flat and 20 percent elongated particles. Particles break with moderate hammer blow. Interface Coefficients of Friction: µp = 0.23, µr = 0.16.
35 A
0.000
0.005
0.010
0.015
0.020
0.025
0.0 0.1 1.0 10.0 100.0 1000.0 10000.0
Vert
ical D
ispla
cem
ent
-in
Log Time - min
Vertical Displacement v Log of Time
0
500
1000
1500
2000
2500
3000
0.00 0.20 0.40 0.60 0.80 1.00 1.20 1.40 1.60 1.80 2.00
Tim
e -
min
Horizontal Displacement - in
Horizontal Displacement versus Time
10 psi 5 psi Shear Seating Load

Test 19 - Normal Stress = 10 lb/in2. Crushed Rock, POORLY GRADED GRAVEL (GP), 96 percent gravel, 3 percent sand, 1 percent clayey fines, approximately 20 percent flat and 20 percent elongated particles. Particles break with moderate hammer blow. Interface Coefficients of Friction: µp = 0.23, µr = 0.16.
36 A
0.000
0.005
0.010
0.015
0.020
0.025
0.030
0.00 0.20 0.40 0.60 0.80 1.00 1.20 1.40 1.60 1.80 2.00
Vert
ical D
ispla
cem
ent
-in
Horizontal Displacement - in
Vertical Displacement v Horizontal Displacement
0.00
0.05
0.10
0.15
0.20
0.25
0.30
0.35
0.40
0.45
0.50
0
2
4
6
8
10
12
14
0.00 0.20 0.40 0.60 0.80 1.00 1.20 1.40 1.60 1.80 2.00
Ratio o
f S
hear
Str
ess to N
orm
al
Str
ess
Corr
ecte
d S
tress (
lbf/in
2)
Horizontal Displacement - in
Norminal Shear Stress versus Cummulative Horizontal Strain
Shear Normal Shear/Normal
R
P
Normal
µ
Shear

Test 20 - Normal Stress = 20 lb/in2. SILTY SAND (SM), 73 percent hard sand, 27 percent nonplastic fines. Maximum size medium subangular to angular sand. Particles break with moderate hammer blow. Interface Coefficients of Friction: µp = 0.15, µr = 0.10.
37 A
0.00
0.02
0.04
0.06
0.08
0.10
0.12
0.14
0.16
0.18
0.1 1.0 10.0 100.0 1000.0 10000.0
Vert
ical D
ispla
cem
ent
-in
Log Time - min
Vertical Displacement v Log of Time
0
2000
4000
6000
8000
10000
12000
0.00 0.20 0.40 0.60 0.80 1.00 1.20 1.40 1.60 1.80 2.00
Tim
e -
min
Horizontal Displacement - in
Horizontal Displacement versus Time
Seating Load
5 psi 10
psi
20 psi
Shear
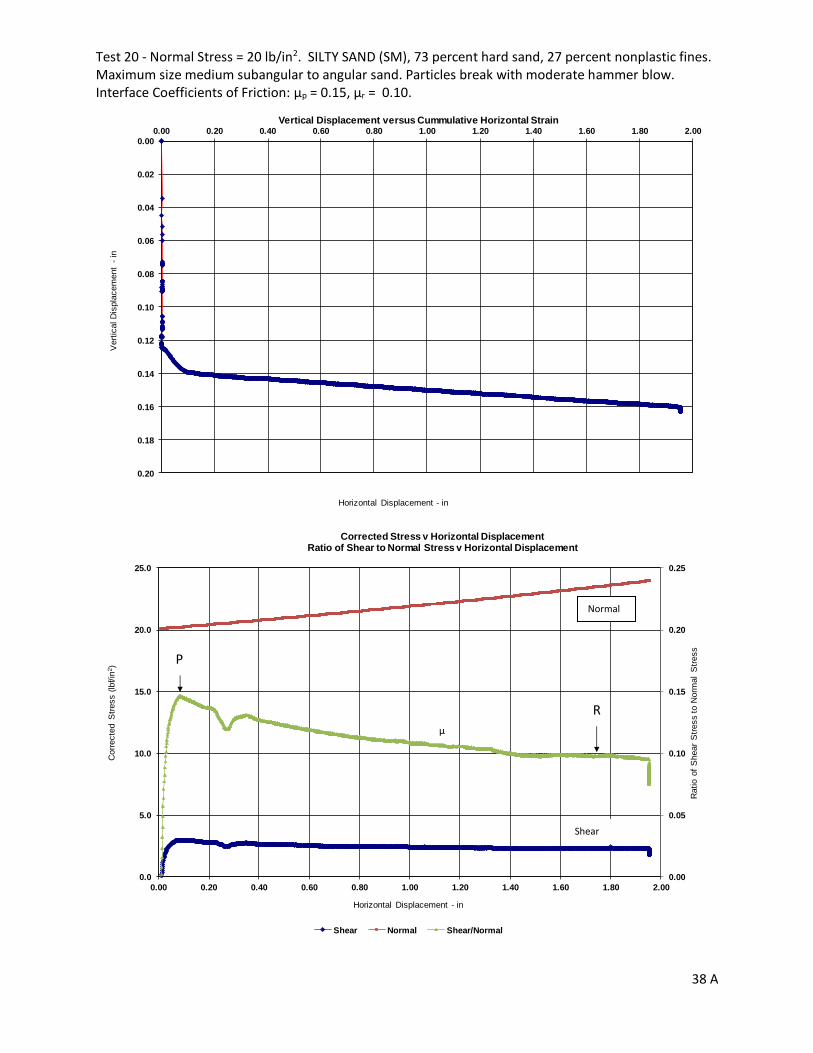
Test 20 - Normal Stress = 20 lb/in2. SILTY SAND (SM), 73 percent hard sand, 27 percent nonplastic fines. Maximum size medium subangular to angular sand. Particles break with moderate hammer blow. Interface Coefficients of Friction: µp = 0.15, µr = 0.10.
38 A
0.00
0.02
0.04
0.06
0.08
0.10
0.12
0.14
0.16
0.18
0.20
0.00 0.20 0.40 0.60 0.80 1.00 1.20 1.40 1.60 1.80 2.00
Vert
ical D
ispla
cem
ent
-in
Horizontal Displacement - in
Vertical Displacement versus Cummulative Horizontal Strain
0.00
0.05
0.10
0.15
0.20
0.25
0.0
5.0
10.0
15.0
20.0
25.0
0.00 0.20 0.40 0.60 0.80 1.00 1.20 1.40 1.60 1.80 2.00
Ratio o
f S
hear
Str
ess to N
orm
al
Str
ess
Corr
ecte
d S
tress (
lbf/in
2)
Horizontal Displacement - in
Corrected Stress v Horizontal DisplacementRatio of Shear to Normal Stress v Horizontal Displacement
Shear Normal Shear/Normal
R
P
Shear
Normal
µ

Test 21- Normal Stress = 10 lb/in2. SILTY SAND (SM), 73 percent hard sand, 27 percent nonplastic fines. Maximum size medium subangular to angular sand. Particles break with moderate hammer blow. Interface Coefficients of Friction: µp = 0.13, µr = 0.05.
39 A
0.00
0.02
0.04
0.06
0.08
0.10
0.12
0.14
0.0 0.1 1.0 10.0 100.0 1000.0 10000.0
Vert
ical D
ispla
cem
ent
-in
Log Time - min
Vertical Displacement v Log of Time
0
500
1000
1500
2000
2500
0.00 0.20 0.40 0.60 0.80 1.00 1.20 1.40 1.60 1.80 2.00
Tim
e -
min
Horizontal Displacement - in
Horizontal Displacement versus Time
Seating Loa
d
5 psi 10
psi
Shear
Normal
Load
Drifted
Normal load drifted. Stopped
test and reapplied 10 psi
normal stress.

Test 21- Normal Stress = 10 lb/in2. SILTY SAND (SM), 73 percent hard sand, 27 percent nonplastic fines. Maximum size medium subangular to angular sand. Particles break with moderate hammer blow. Interface Coefficients of Friction: µp = 0.13, µr = 0.05.
40 A
0.00
0.02
0.04
0.06
0.08
0.10
0.12
0.14
0.16
0.18
0.20
0.00 0.20 0.40 0.60 0.80 1.00 1.20 1.40 1.60 1.80 2.00
Vert
ical D
ispla
cem
ent
-in
Horizontal Displacement - in
Vertical Displacement versus Cummulative Horizontal Strain
0.000
0.050
0.100
0.150
0.200
0.250
0.0
2.0
4.0
6.0
8.0
10.0
12.0
14.0
0.00 0.20 0.40 0.60 0.80 1.00 1.20 1.40 1.60 1.80 2.00
Ratio o
f S
hear
Str
ess to N
orm
al
Str
ess
Corr
ecte
d S
tress (
lbf/in
2)
Horizontal Displacement - in
Corrected Stress v Horizontal DisplacementRatio of Shear to Normal Stress v Horizontal Displacement
Shear Normal Shear/Normal
Data not presented for this period because normal
load inadvertently drifted. P
R
Normal
Shear
µ
Normal load drifted.

Test 22- Normal Stress = 5 lb/in2. SILTY SAND (SM), 73 percent hard sand, 27 percent nonplastic fines. Maximum size medium subangular to angular sand. Particles break with moderate hammer blow. Interface Coefficients of Friction: µp = 0.14, µr = 0.06.
41 A
0.00
0.02
0.04
0.06
0.08
0.10
0.12
0.14
0.16
0.1 1.0 10.0 100.0 1000.0 10000.0
Vert
ical D
ispla
cem
ent
-in
Log Time - min
Vertical Displacement v Log of Time
0
200
400
600
800
1000
1200
1400
1600
0.00 0.20 0.40 0.60 0.80 1.00 1.20 1.40 1.60 1.80 2.00
Tim
e -
min
Horizontal Displacement - in
Horizontal Displacement versus Time
Seating Load
5 psi Shear
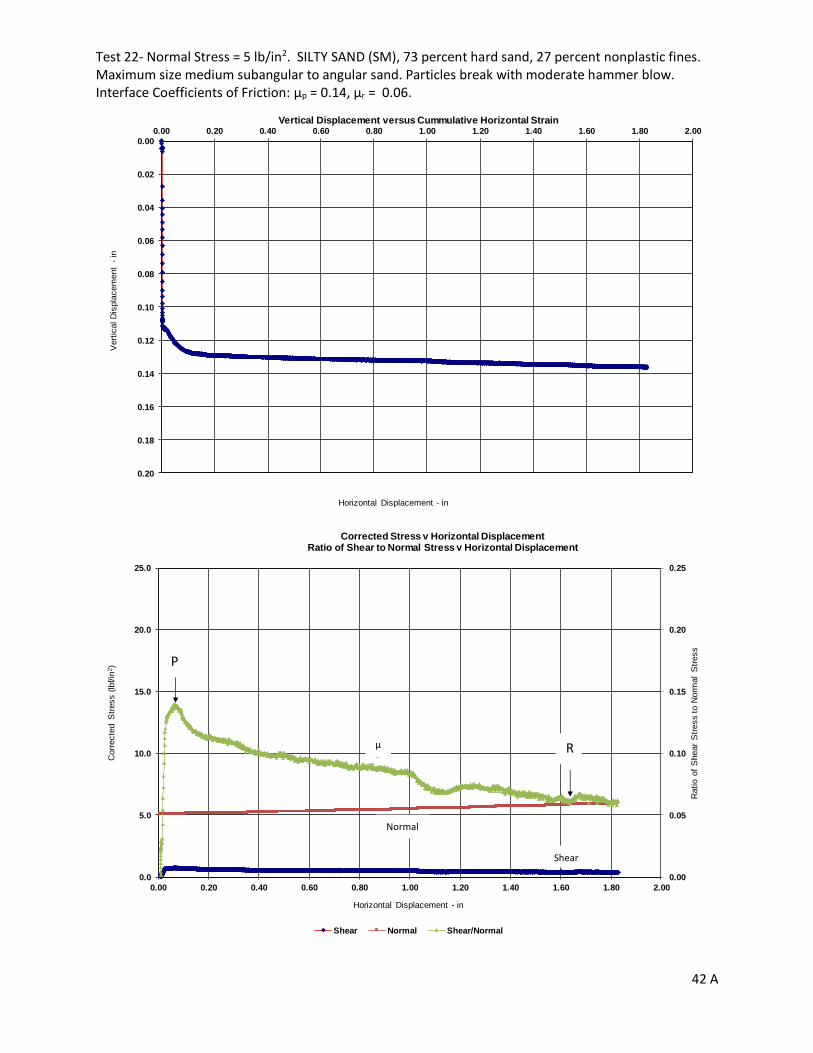
Test 22- Normal Stress = 5 lb/in2. SILTY SAND (SM), 73 percent hard sand, 27 percent nonplastic fines. Maximum size medium subangular to angular sand. Particles break with moderate hammer blow. Interface Coefficients of Friction: µp = 0.14, µr = 0.06.
42 A
0.00
0.02
0.04
0.06
0.08
0.10
0.12
0.14
0.16
0.18
0.20
0.00 0.20 0.40 0.60 0.80 1.00 1.20 1.40 1.60 1.80 2.00
Vert
ical D
ispla
cem
ent
-in
Horizontal Displacement - in
Vertical Displacement versus Cummulative Horizontal Strain
0.00
0.05
0.10
0.15
0.20
0.25
0.0
5.0
10.0
15.0
20.0
25.0
0.00 0.20 0.40 0.60 0.80 1.00 1.20 1.40 1.60 1.80 2.00
Ratio o
f S
hear
Str
ess to N
orm
al
Str
ess
Corr
ecte
d S
tress (
lbf/in
2)
Horizontal Displacement - in
Corrected Stress v Horizontal DisplacementRatio of Shear to Normal Stress v Horizontal Displacement
Shear Normal Shear/Normal
P
R µ
r
m
a
l
o
r Normal
Shear
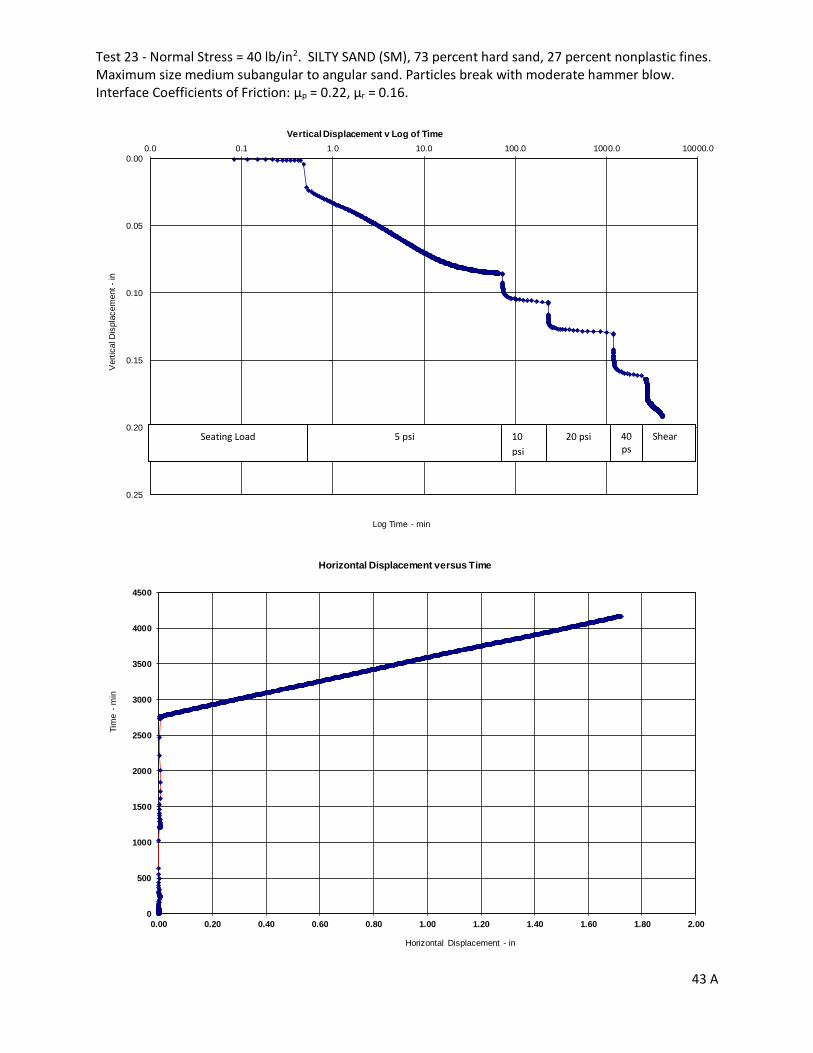
Test 23 - Normal Stress = 40 lb/in2. SILTY SAND (SM), 73 percent hard sand, 27 percent nonplastic fines. Maximum size medium subangular to angular sand. Particles break with moderate hammer blow. Interface Coefficients of Friction: µp = 0.22, µr = 0.16.
43 A
0.00
0.05
0.10
0.15
0.20
0.25
0.0 0.1 1.0 10.0 100.0 1000.0 10000.0
Vert
ical D
ispla
cem
ent
-in
Log Time - min
Vertical Displacement v Log of Time
0
500
1000
1500
2000
2500
3000
3500
4000
4500
0.00 0.20 0.40 0.60 0.80 1.00 1.20 1.40 1.60 1.80 2.00
Tim
e -
min
Horizontal Displacement - in
Horizontal Displacement versus Time
5 psi 10
psi
20 psi 40 psi
Shear Seating Load
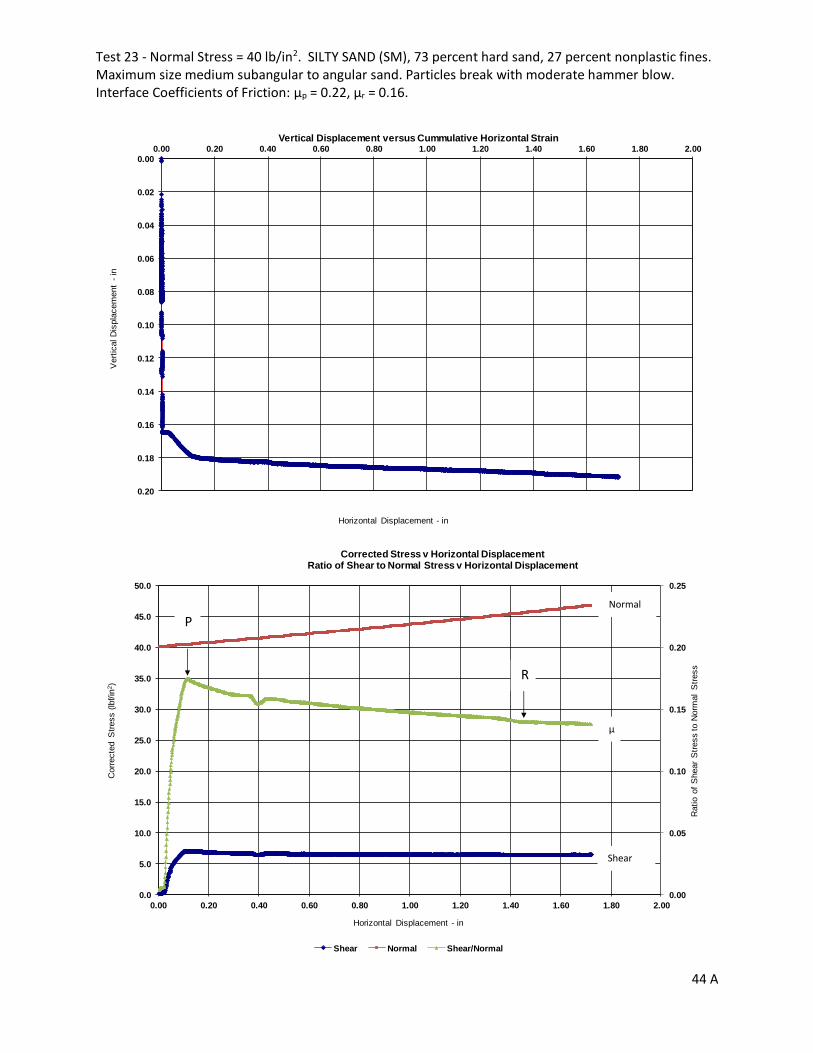
Test 23 - Normal Stress = 40 lb/in2. SILTY SAND (SM), 73 percent hard sand, 27 percent nonplastic fines. Maximum size medium subangular to angular sand. Particles break with moderate hammer blow. Interface Coefficients of Friction: µp = 0.22, µr = 0.16.
44 A
0.00
0.02
0.04
0.06
0.08
0.10
0.12
0.14
0.16
0.18
0.20
0.00 0.20 0.40 0.60 0.80 1.00 1.20 1.40 1.60 1.80 2.00
Vert
ical D
ispla
cem
ent
-in
Horizontal Displacement - in
Vertical Displacement versus Cummulative Horizontal Strain
0.00
0.05
0.10
0.15
0.20
0.25
0.0
5.0
10.0
15.0
20.0
25.0
30.0
35.0
40.0
45.0
50.0
0.00 0.20 0.40 0.60 0.80 1.00 1.20 1.40 1.60 1.80 2.00
Ratio o
f S
hear
Str
ess to N
orm
al
Str
ess
Corr
ecte
d S
tress (
lbf/in
2)
Horizontal Displacement - in
Corrected Stress v Horizontal DisplacementRatio of Shear to Normal Stress v Horizontal Displacement
Shear Normal Shear/Normal
P
R
Normal
Shear
µ

Appendix B – Shear Stress v Normal Stress and Coefficient of Friction v Normal Stress Plots
1 B
0
5
10
15
20
25
30
0 10 20 30 40 50
Shea
r St
ress
(p
si)
Normal Stress (psi)
Density Sand-PE Interface Peak Shear Stress v Normal Stress
Multi-Stage New Coupon
0.00
0.10
0.20
0.30
0.40
0.50
0.60
0 10 20 30 40 50
Co
effi
cien
t o
f Fr
icti
on
Normal Stress (psi)
Density Sand - PE Interface Peak Coefficient of Friction
New Coupon Multi-Stage
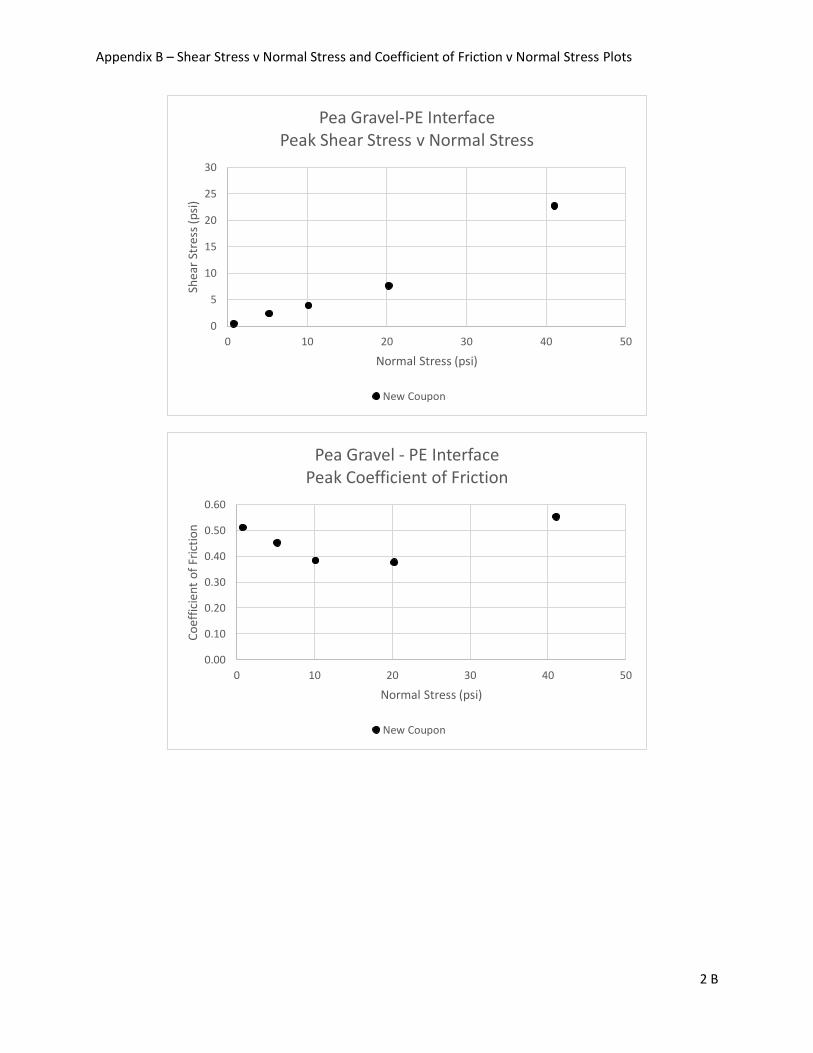
Appendix B – Shear Stress v Normal Stress and Coefficient of Friction v Normal Stress Plots
2 B
0
5
10
15
20
25
30
0 10 20 30 40 50
Shea
r St
ress
(p
si)
Normal Stress (psi)
Pea Gravel-PE Interface Peak Shear Stress v Normal Stress
New Coupon
0.00
0.10
0.20
0.30
0.40
0.50
0.60
0 10 20 30 40 50
Co
effi
cien
t o
f Fr
icti
on
Normal Stress (psi)
Pea Gravel - PE Interface Peak Coefficient of Friction
New Coupon

Appendix B – Shear Stress v Normal Stress and Coefficient of Friction v Normal Stress Plots
3 B
Results of tests on Bonny Loess.
0
5
10
15
20
25
30
0 10 20 30 40 50
Shea
r St
ress
(p
si)
Normal Stress (psi)
CL-ML PE Interface Peak Shear Stress v Normal Stress
New Coupon
0.00
0.10
0.20
0.30
0.40
0.50
0.60
0 10 20 30 40 50
Co
effi
cien
t o
f Fr
icti
on
Normal Stress (psi)
CL-ML PE Interface Peak Coefficient of Friction
New Coupon

Appendix B – Shear Stress v Normal Stress and Coefficient of Friction v Normal Stress Plots
4 B
Results of tests on Crushed Rock.
0
5
10
15
20
25
30
0 10 20 30 40 50
Shea
r St
ress
(p
si)
Normal Stress (psi)
Crushed Rock-PE Interface Peak Shear Stress v Normal Stress
Unwashed Washed
0.00
0.10
0.20
0.30
0.40
0.50
0.60
0 10 20 30 40 50
Co
effi
cien
t o
f Fr
icti
on
Normal Stress (psi)
Crushed Rock- PE Interface Peak Coefficient of Friction
Unwashed Washed

Appendix B – Shear Stress v Normal Stress and Coefficient of Friction v Normal Stress Plots
5 B
Results of Tests on SILTY SAND (SM)
0
5
10
15
20
25
30
0 10 20 30 40 50
Shea
r St
ress
(p
si)
Normal Stress (psi)
SM PE Interface Peak Shear Stress v Normal Stress
New Coupon
0.00
0.10
0.20
0.30
0.40
0.50
0.60
0 10 20 30 40 50
Co
effi
cien
t o
f Fr
icti
on
Normal Stress (psi)
SM PE Interface Peak Coefficient of Friction
New Coupon

Appendix B – Shear Stress v Normal Stress and Coefficient of Friction v Normal Stress Plots
6 B
0
5
10
15
20
25
30
0 10 20 30 40 50
Shea
r St
ress
(p
si)
Normal Stress (psi)
Density Sand-PE Interface Peak Shear Stress v Normal Stress
New Coupon Multi-Stage Moderate Compaction
0.00
0.10
0.20
0.30
0.40
0.50
0.60
0 10 20 30 40 50
Co
effi
cien
t o
f Fr
icti
on
Normal Stress (psi)
Density Sand - PE Interface Residual Coefficient of Friction
New Coupon Multi-Stage Moderate Compaction

Appendix B – Shear Stress v Normal Stress and Coefficient of Friction v Normal Stress Plots
7 B
0
5
10
15
20
25
30
0 10 20 30 40 50
Shea
r St
ress
(p
si)
Normal Stress (psi)
Pea Gravel-PE Interface Residual Shear Stress v Normal Stress
New Coupon
0.00
0.10
0.20
0.30
0.40
0.50
0.60
0 10 20 30 40 50
Co
effi
cien
t o
f Fr
icti
on
Normal Stress (psi)
Pea Gravel - PE Interface Residual Coefficient of Friction
New Coupon Multi-Stage
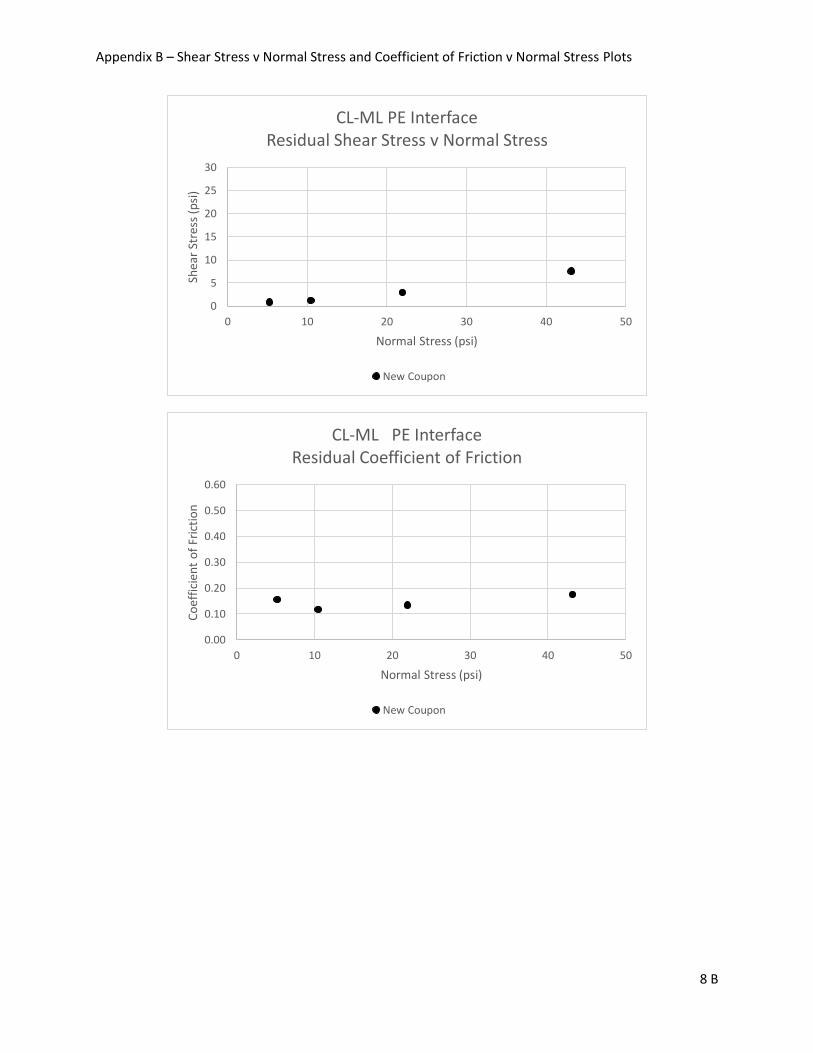
Appendix B – Shear Stress v Normal Stress and Coefficient of Friction v Normal Stress Plots
8 B
0
5
10
15
20
25
30
0 10 20 30 40 50
Shea
r St
ress
(p
si)
Normal Stress (psi)
CL-ML PE Interface Residual Shear Stress v Normal Stress
New Coupon
0.00
0.10
0.20
0.30
0.40
0.50
0.60
0 10 20 30 40 50
Co
effi
cien
t o
f Fr
icti
on
Normal Stress (psi)
CL-ML PE Interface Residual Coefficient of Friction
New Coupon

Appendix B – Shear Stress v Normal Stress and Coefficient of Friction v Normal Stress Plots
9 B
0
5
10
15
20
25
30
0 10 20 30 40 50
Shea
r St
ress
(p
si)
Normal Stress (psi)
Crushed Rock-PE Interface Residual Shear Stress v Normal Stress
New Coupon Washed
0.00
0.10
0.20
0.30
0.40
0.50
0.60
0 10 20 30 40 50
Co
effi
cien
t o
f Fr
icti
on
Normal Stress (psi)
Crushed Rock - PE Interface Residual Coefficient of Friction
New Coupon Washed

Appendix B – Shear Stress v Normal Stress and Coefficient of Friction v Normal Stress Plots
10 B
0
5
10
15
20
25
30
0 10 20 30 40 50
Shea
r St
ress
(p
si)
Normal Stress (psi)
SM PE Interface Residual Shear Stress v Normal Stress
New Coupon
0.000
0.100
0.200
0.300
0.400
0.500
0.600
0 10 20 30 40 50
Co
effi
cien
t o
f Fr
icti
on
Normal Stress (psi)
SM PE Interface Residual Coefficient of Friction
New Coupon
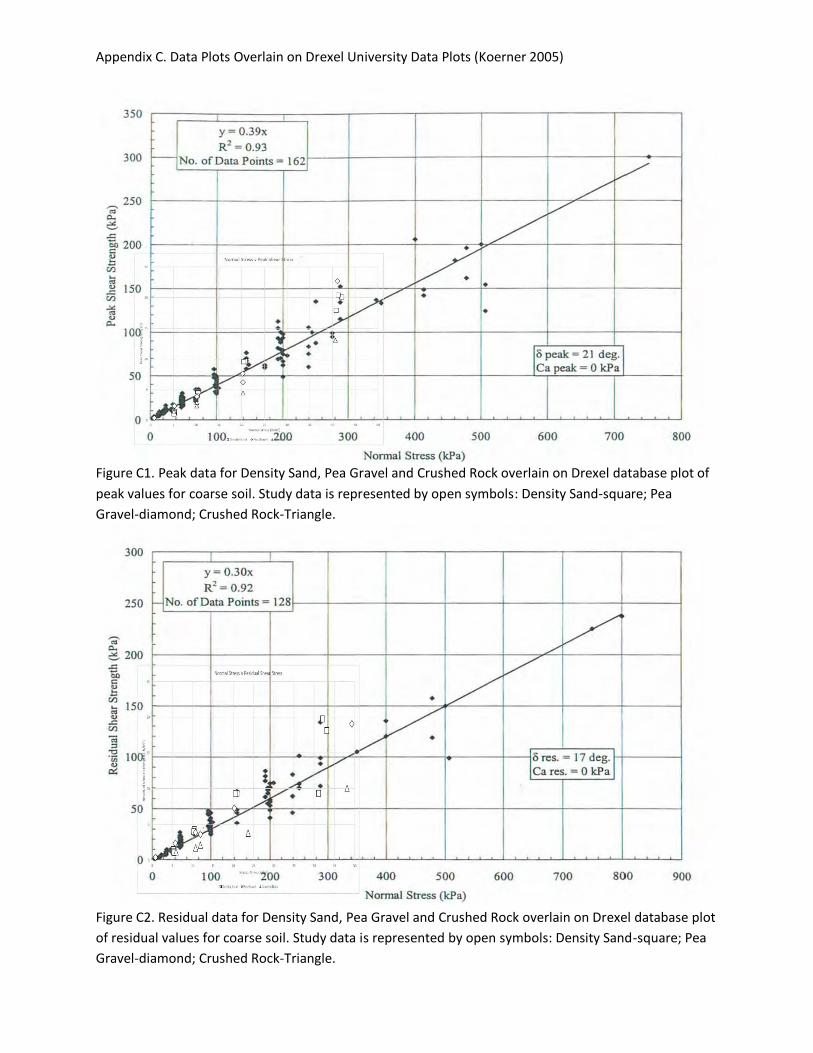
Appendix C. Data Plots Overlain on Drexel University Data Plots (Koerner 2005)
Figure C1. Peak data for Density Sand, Pea Gravel and Crushed Rock overlain on Drexel database plot of
peak values for coarse soil. Study data is represented by open symbols: Density Sand-square; Pea
Gravel-diamond; Crushed Rock-Triangle.
Figure C2. Residual data for Density Sand, Pea Gravel and Crushed Rock overlain on Drexel database plot
of residual values for coarse soil. Study data is represented by open symbols: Density Sand-square; Pea
Gravel-diamond; Crushed Rock-Triangle.

Appendix C. Data Plots Overlain on Drexel University Data Plots (Koerner 2005)
Figure C3. Peak data for Silty Sand and Silty Clay overlain on Drexel database plot of peak values for fine
soil. Silty Sand data is represented by x; Silty Clay data is represented by open circles.
Figure C4. Residual data for Silty Sand and Silty Clay overlain on Drexel database plot of residual values

Appendix C. Data Plots Overlain on Drexel University Data Plots (Koerner 2005)
for fine soil. Silty Sand data is represented by x; Silty Clay data is represented by open circles.
Figure C5. Peak Shear Stress v Normal Stress for all data from this study.
Figure C6. Residual Shear Stress v Normal Stress for all data from this study.
0
5
10
15
20
25
0 5 10 15 20 25 30 35 40 45 50
Pea
k Sh
ear
Stre
ngt
h (
lb/i
n2)
Normal Stress (lb/in2)
Normal Stress v Peak Shear Stress
Density Sand Pea Gravel Crushed Rock Loess CL-ML Silty Sand
0
5
10
15
20
25
0 5 10 15 20 25 30 35 40 45 50
Res
idu
al S
hea
r St
ren
gth
(lb
/in
2)
Normal Stress (lb/in2)
Normal Stress v Residual Shear Stress
Density Sand Pea Gravel Crushed Rock Loess CL-ML Silty Sand


![Design of Buried PVC Pipe[2]](https://img.pdfslide.us/doc/110x75/55cf98e2550346d0339a3cfd/design-of-buried-pvc-pipe2.jpg)
