Embed Size (px)
Citation preview

'Jtchasedby USDAfor OfficialUs~
SOIL ORGANIC MATTER, CEC, AND MOISTURE SENSINGWITH A PORTABLE NIR SPECTROPHOTOMETER
K. A. Sudduth, J. W. HummelMEMBER MEMBERASAE ASAE
ABSTRACT.Soil reflectance data were collected with a portable near infrared (NIR) spectrophotometer and werecorrelated with soil organic matter content in laboratory and field tests. Laboratory calibrations yielded an r2 of 0.89and a standard error of prediction of 0.40% organic matter with 30 representativeIllinois soils at 1.5 MPa and0.033 MPa moisture tension levels. Limited in-furrowfield operation produced much higher errors, due to the movementof soil past the sensor during data acquisition. Estimation of cation exchange capacity (CEC) and soil moisture contentwas also accomplished in the laboratory. Keywords. Organic matter, Soil moisture, Herbicides, Spectrophotometry,Variable rate application, Optics, Cation exchange capacity.
Variable rate herbicide application is an importantaspect of site-specific crop production. In recentyears, herbicides have been increasinglyidentified in ground and surface water, and the
general public, as well as agricultural producers, havebecome concerned with the possible overuse of thesechemicals. Knowing that recommended soil-appliedherbicide rates are highly dependent on soil organic matter(SOM) and that organic matter content can vary greatlywithin a single field, researchers began over a decade agoto investigate electro-optical approaches to SOM sensingfor herbicide rate control, based on the general observationthat soils with higher organic matter (or organic carbon*)contents appear darker.
LITERATURE REVIEWInvestigators have taken varying approaches and
attained varying degrees of success in developing andimplementing electro-optic SOM sensors. Distinctions canbe made in terms of application (soil classification vs.herbicide rate control), sensor proximity (remote sensingvs. close-range sensing), spectral region [visible vs. nearinfrared (NIR)], spectral data type (color vs. narrow-bandreflectance vs. wide-band reflectance), spectral dataquantity (number of data channels), and calibration
Article has been reviewed and approved for publication by the Powerand Machinery Div. of ASAE.
This research was carried out under USDA Cooperative Research and
Development Memorandum of Understanding 58-32U4-M-592 withAGMED, Inc., Springfield, IL.
Trade names are used solely for the purpose of providing specificinformation. Mention of a trade name, proprietary product, or specificequipment does not constitute a guarantee or warranty by the USDA anddoes not imply the approval of the named product to the exclusion ofother products that may be suitable.
The authors are Kenneth A. Sudduth, Agricultural Engineer,
Cropping Systems and Water Quality Research Unit, USDA-AgriculturalResearch Service, Agricultural Engineering Building, University ofMissouri, Columbia; and John W. Hummel, Supervisory Agricultural
Engineer, Crop Protection Research Unit, USDA-Agricultural ResearchService, Urbana, IL.* In the context of this manuscript, soil organic matter content is
defined as 1.72 times the organic carbon content.
VOL. 36(6):1571-1582 - NOVEMBER-DECEMBER 1993
development (large geographic range vs. within a soillandscape). Problems have been encountered with someapproaches because soil color and reflectance propertiesare a function of such parameters as moisture, texture,chemical makeup, and parent material, as well as SOM.A general review of past progress in SOM sensing researchis given by Sudduth (1989).
Krishnan et aI. (1980) correlated multiple-bandreflectance characteristics in the 400 to 2400 om range andSOM for 10 Illinois soils at 4 moisture levels. Bettercorrelations were obtained with visible range data thanwith NIR data. A first derivative model using opticaldensity data yielded an r2 of 0.85 with the calibrationdataset. Other researchers (Pitts et aI., 1986) could notobtain satisfactory correlations when using this model withan expanded set of soils. Pitts et al. (1986) did successfullypredict the SOM of 30 Illinois soils using an exclusionalgorithm and polychromatic (white), green, and redreflected light. The width of the prediction range for eachsoil varied from I to 3% organic matter, with an averagerange width of 1.4%.
Griffis (1985) developed and tested a soil carbon sensorconsisting of an incandescent source and siliconphototransistor mounted in a light-proof housing. An r2 of0.75 was obtained in laboratory tests with a set of 18 airdry Arkansas soils ranging from 0.19% to 1.98% organiccarbon. Kocher and Griffis (1989) reported on a systemconsisting of an elevating chain and horizontal belt whichwas used to convey soil past the sensor developed byGriffis (1985). In laboratory tests with sieved, air dry soil,the conveying mechanism-sensor combination wassuccessful in locating a step change in soil type.
Gunsaulis et aI. (1991) studied the effect of soil surfacestructure on reflectance from a red (660 nm) light-emittingdiode (LED) source. A maximum r2 of 0.61 was obtainedon the test set of 20 Arkansas soils containing from 0.47 to2.1% SOM. Attempts to minimize surface structure effectsby passing the soil through small sieves and rolling thesurface smooth resulted in poorer (r2 = 0.40) correlationsto SOM. Improved results (r2 = 0.73) were obtained withmultiple linear regression on data from a pair of sensors
1571

which measured both diffuse and specular reflectancecomponents.
Shonk and Gaultney (1988) developed a real-time SOMsensor intended to be recalibrated for each new soillandscape, rather than for the larger geographic area (suchas an entire state) attempted by other researchers.Laboratory tests using red (660 nm) LEDs as the lightsource yielded good correlations (r2 = 0.80 to r2 = 0.98)for soils obtained within a single landscape and prepared toa single moisture content. Below-surface field tests showeda curvilinear relationship between sensor output and SOM(r2 = 0.84 to r2 = 0.95), with new calibrations developedfor changes in travel speed or sensing depth(Gaultney et aI., 1989). The sensor was licensed forcommercial development, and used to control the rate of agranular herbicide formulation applied by a customapplicator truck. Moisture and surface preparationsignificantly affected sensor output, and it wasrecommended that calibration be done under conditionssimilar to those encountered at the time of chemicalapplication (McGrath et aI., 1990).
Worner (1989) developed a portable spectrophotometersuitable for collection of multiple-wavelength visible andNIR reflectance data in the laboratory. Although theinstrumentation required in this approach was morecomplex and expensive, the additional reflectanceinformation allowed more accurate SOM calibrations thancould be obtained with spectral information from only afew wavelength bands. Worner's sensor incorporated fiberoptic bundles to route light to and from a remote sensinglocation, a prism monochromator, and a silicon photodiodearray detector. Smith (1991) modified the instrument forimproved performance and reliability, and used it to collectreflectance data over the range from 531 to 1004 nrn on thesame set of 30 Illinois soils used by other researchers(Pitts et aI., 1986; Sudduth and Hummel, 1991). Analysisof combined 0.033 MPa (field capacity) and 1.5 MPa(wilting point) moisture tension data by stepwise multiplelinear regression yielded an r2 of 0.61 and a standard errorof prediction (SEP) of 0.46% organic carbon, using datafrom four wavelengths.
Sudduth and Hummel (1991) tested several differentoptical data types and calibration methods on arepresentative set of 30 Illinois mineral soils at 0.033 MPaand 1.5 MPa moisture tension levels and determined thatoptical density transformed (OD, defined as logreflectance-I) NIR data analyzed by partial least squaresregression (PLS) held the most promise for prediction ofsoil organic carbon content. A latent variable regressionmethod, PLS, was used to reduce the set of collinearindependent variables (reflectances) to a smaller set oforthogonal components which represented most of thevariability in the original data and contained a reducedamount of random measurement noise (Martens and Naes,1987). Excellent correlation (r2 = 0.92, SEP = 0.20%organic carbon) was retained when the NIR data weresmoothed to a 60-nm data point spacing and thewavelength range reduced to 1720 to 2380 nm, for a totalof only 12 data points used. Similar correlations wereobtained with a 4O-nmdata spacing and a slightly smallerwavelength range (Sudduth and Hummel, 1991).
Sudduth and Hummel (1993) then developed a rugged,portable NIR spectrophotometer to implement this
1572
prediction method on a near real-time basis. Specificdesign objectives for this instrument were to:
Utilize a bandpass of 60 nm or less over a minimumsensing range from 1700to 2420 nm.Provide an essentially continuous (in wavelength)sensing method, to allow flexibility for additionaloptimization of the wavelengths selected.Have potential, with additional refinements ifneeded, to generate an organic matter signal every4.5 s to support on-the-go herbicide application rateadjustment at realistic field speeds.Predict soil organic matter content with a standarderror of prediction of less than 0.5% (or less than0.29% organic carbon) for the 30 Illinois soils inthe calibration dataset (Sudduth and Hummel,1991).Tolerate harsh environmental conditions, e.g., dust,temperature fluctuations, shock loads, andvibration, that would be encountered in fieldoperation.
The portable spectrophotometer (fig. 1) used a circularvariable filter spinning at 5 Hz to sequentially providemonochromatic, chopped light from a broadband source.The monochromatic light was transmitted to the soilsurface by a fiber optic bundle, allowing remote mountingof the major portion of the sensor. Energy diffuselyreflected from the soil surface was captured by a leadsulfide (PbS) photodetector. The output from the detector
SOURCE
--FOCUSINGLDIS
,:
I
,,,,,
ANGULAR POSITIONSENSOR
IMAGEOFRECTANGULARF1LAIIENTFUEl! / CHOPPER
DISK
CIRCULAR ENDOF nlER BUNDLE
_IWIIotINA11ONCONE
QUAIIIZ WINDOW
[L_m__J I-SAIIN CUP
Figure I-Prototype portable near infrared spectropbotometerincluding instrument housing with filter disk and lamp (top) andsensor head assembly (bottom).
TRANSACTIONS OF THE ASAE

was conditioned by an AC-coupled preamplifier and inputto a personal computer through an AID converter. Theeffective sensing range was from 1630 to 2650 nm, on a52 nm bandpass.
OBJECTIVESThe objectives of this study were to:. Develop and evaluate laboratory calibrations relating
the output of the prototype portable NIRspectrophotometer to soil organic carbon, soilmoisture, and cation exchange capacity.. Field test the NIR sensing system and evaluate theaccuracies of the organic carbon estimates obtained.
EQUIPMENT AND PROCEDURESTesting of the portable spectrophotometer proceeded in
three phases. Initial tests to verify operation and calibratethe instrument were described by Sudduth and Hummel(1993). Additional tests were then conducted to developprediction equations relating sensor output to soil carboncontent, soil moisture, and CEC and to validate thoseprediction equations under a range of conditions. Finally,the spectrophotometer was modified for field use, and teststo evaluate its field performance for organic carbon sensingwere conducted.
LABORATORY SOIL SAMPLE PREPARATION AND PROPERTY
DETERMINATION
Thirty Illinois mineral soils (table 1), selected asrepresentative of the state's important agricultural soils,were used to test the laboratory operation of the sensor.Samples of these soils, which included 10 initially used byKrishnan et al. (1980) and another 20 selected byPitts et al. (1986), were also used in a previous studyconducted by the authors to evaluate reflectance and color-based sensing methods (Sudduth and Hummel, 1991).
Soils were prepared for analysis by removal of foreignmaterial and crushing to pass through a 2-mm sieve.Primary calibration samples, each consisting ofapproximately 150 g of dry soil, were prepared at the1.5 MPa (wilting point) moisture tension level and at the0.033 MPa (field capacity) moisture tension level.Supplementary samples were also prepared to threemoisture levels - oven dry, air dry, and 0.33 MPa moisturetension.
The desired gravimetric moisture contents (table 2) ateach of the tension levels (0.033 MPa, 0.33 MPa, and1.5 MPa) were obtained from previous pressure platestudies which used the same 30 soils (Worner, 1989;Christensen, 1985). The volume of water required to obtainthe desired moisture content was added to each soil sampleafter oven drying. The samples were placed in sealedplastic bags and manipulated by hand to distribute theadded water. The sealed bags were then stored at 100C and70% relative humidity (RH) for at least 5 d to allow timefor the moisture to equilibrate with the soil. Air dry soilsamples were prepared by oven drying and placing ashallow layer of soil in an open container. These containerswere then placed in the same controlled environment roomat 100 C and 70% RH to allow the soil to equilibrate withthe ambient environment.
VOL. 36(6): 1571-1582 - NOVEMBER-DECEMBER 1993
Table I. Organic carbon, organic matter, cation exchange capacity,pH, and textural classification of the 30 Illinois soils tested
Soil NameandTexturalClass*
IDNo.
DryCombustion(%) CationExchange
Organic Organic CapacityCarbon Matter (mEq/100g) pH
Loamy SandAdePlainfieldSpartaMaumee
Sandy LoamCarmi
LoamAmbrawTice
ClayJacob
Clay LoamProctorDarwin
Silt LoamWynooseBirkbeckShoalsCisneBlufordSaybrookCatlinSaybrookCisnePiopolis
I234
5
611
7
89
10121314151617181920
Silty Clay LoamFlanagan 21Jacob 22Flanagan 23Drummer 24Flanagan 25Drummer 26Proctor 27Flanagan 28Drummer 29PIano 30
* Textural classsification and pH from Womer (1989).
5.84.87.16.9
5.6
6.97.0
7.3
6.06.8
5.07.17.06.96.56.35.25.86.96.8
6.36.06.15.15.35.46.25.26.35.8
Larger amounts of six selected soils were prepared forheight variation and moving sample tests. The six soils,chosen to span the textures and organic carbon levels foundin the calibration set, were Ade Loamy Sand (ID No.1,table 1), Maumee Loamy Sand (4), Darwin Clay Loam (9),Saybrook Silt Loam (16), Flanagan Silty Clay Loam (23),and Proctor Silty Clay Loam (27). Approximately 600 g ofeach dry soil was prepared to the 0.033 MPa tension levelusing the methods outlined above.
Soil properties measured for each soil included organiccarbon, moisture content, and cation exchange capacity(CEC). Total organic carbon content was determined bydry combustion of duplicate samples of each soil in aLECO Model HFI0 induction furnace (table 1). Thegravimetric moisture content of each individual soil samplewas determined after reflectance measurement by ovendrying for 24 hat 1050C (table 2). An analysis of varianceshowed that there was no significant difference in soilmoisture content (P > 0.05) due to the three samplereplicates for any set of the 1.5 MPa, 0.033 MPa, or0.33 MPa moisture tension samples, and marginalsignificance for the air dry samples. Cation exchangecapacity (table 1) was determined by mechanical vacuum
1573
0.45 0.77 15.00.59 1.02 12.00.69 1.18 11.41.04 1.79 16.8
1.14 1.96 15.0
1.26 2.18 27.00.99 1.71 22.8
2.01 3.47 55.2
0.82 1.41 24.01.35 2.32 29.4
0.94 1.62 16.81.04 1.79 21.60.74 1.27 13.81.26 2.17 22.80.77 1.32 12.01.26 2.18 22.21.86 3.21 22.81.58 2.72 25.81.56 2.68 20.71.53 2.65 29.4
2.10 3.62 33.01.12 1.93 22.81.84 3.17 27.01.79 3.09 24.02.29 3.95 36.62.91 5.01 38.42.29 3.94 30.62.37 4.08 27.63.16 5.45 37.81.81 3.13 25.2

extraction of the cations with an ammonium acetatesolution at a pH of 7.0 and a subsequent Kjeldahldistillation. As a check, five replicates of a standard soilwith a CEC of 24.6 milliEquivalents (mEq) per lOOgwereanalyzed along with the 30 test soils. The mean of the fivereplicates was 24.6 mEq/1OOg,and the standard deviationwas 0.38 mEq/lOOg, showing an acceptable degree ofaccuracy and precision.
LABORATORY TESTS
Soil sample reflectance analyses were conducted in thelaboratory to:
1. Develop calibrations between the measuredreflectance spectra of the 30 test soils and themeasured soil organic carbon content.
2. Partition the overall organic carbon estimation errorinto those errors associated with the variousportions of the data collection procedure.
3. Determine the effects of varying sample-to-sensordistance on the predictive capability of thecalibration.
4. Incorporate data from reflectance scans of movingsoil to estimate the errors associated with in-furrowsensing.
5. Develop calibrations for soil moisture and cationexchange capacity.
A light exclusion chamber was used during laboratorytesting to keep ambient light from influencing the
1574
photodetector output. Contained within the chamber was apositioning stage which supported the sensor headassembly and provided approximately 50 mm of crankactuated vertical adjustment. For most laboratory tests, soilsamples were hand-placed 15 mm below the sensor headassembly in a 13-mm deep x 50-mm diameter flat blackaluminum sample cup.
A rotating disk was used within the light exclusionchamber to test the ability of the sensor to collect data froma moving soil surface, such as would be seen with field in-furrow sensing. The disk was 305 mm in diameter with a13-mm deep x 32-mm wide soil sample trough centered ona 248-mm diameter circle. The disk was attached to avertical shaft, which was driven by a variable speed drill atspeeds adjustable from 0.8 to 10Hz.
Both user-written and commercial software wereemployed to obtain raw reflectance data from the portablespectrophotometer, convert the data to percent reflectanceform, and develop calibrations for prediction of soilorganic matter content. Algorithms and software for datacollection, multiple scan averaging, baseline correction,wavelength calibration and interpolation, and reflectanceand optical density calculation were developed by Sudduthand Hummel (1993). Calibration development and soilproperty estimation were accomplished with partial leastsquares regression (PLS) techniques implemented in thePC-based Unscrambler software (CAMO A/S, Trondheim,Norway).
TRANSACTIONS OF THE ASAE
Table 2. Desired and mean actual gravimetric moisture contents (MC) for 1.5 MPa, 0.033 MPa, and 0.33 MPa moisture tension soil samplesand mean actual MC for air dry soil samples used in laboratory calibration tests
Moisture Tension Levels* Air Dry1.5 MPa 0.033 MPa 0.33 MPa
SoillD Desired Actual Desired Actual Desired Actual ActualNo. MC (%) MC (%) MC (%) MC (%) MC (%) MC (%) MC (%)
I 1.6 1.4 4.2 4.1 3.8 3.6 0.82 1.1 1.0 6.1 5.9 3.7 3.6 0.73 1.4 1.2 6.2 6.0 4.0 3.9 0.74 2.1 1.9 6.2 6.0 5.6 5.1 1.25 3.9 3.8 9.7 9.5 7.3 7.3 1.7
6 8.7 7.8 15.5 15.7 12.1 11.5 3.17 24.4 25.4 36.8 39.7 27.2 23.2 9.48 7.7 7.3 19.2 19.5 12.3 11.4 2.99 11.0 11.0 20.7 20.8 14.8 \3.7 4.1
10 5.3 4.9 22.0 21.9 10.4 10.1 2.2
1\ 8.4 8.1 20.4 19.7 12.1 11.7 3.912 4.7 4.5 22.7 22.5 11.2 10.9 2.4\3 4.3 3.8 19.8 19.5 10.2 10.0 1.914 8.7 8.4 21.8 22.0 \3.1 12.3 3.015 4.0 3.8 20.6 19.3 10.8 10.4 1.9
16 8.5 8.3 21.7 21.5 12.1 11.6 3.717 7.7 7.1 25.1 25.2 13.6 12.9 3.418 10.3 9.7 25.0 24.1 14.3 13.3 3.919 10.3 10.3 22.4 22.1 17.2 16.2 3.520 7.7 7.6 26.4 26.3 \3.6 12.4 3.5
21 16.7 16.6 28.5 29.1 20.0 18.3 5.222 9.9 9.6 27.1 26.8 15.2 14.5 3.523 9.3 8.8 24.0 23.8 14.3 \3.6 3.724 11.5 11.2 23.1 24.6 16.2 15.1 4.525 12.0 11.5 21.8 20.5 15.6 15.3 4.9
26 \3.4 12.9 23.3 21.1 16.8 15.9 5.627 11.0 10.9 24.4 24.7 15.6 15.2 4.628 9.8 8.7 22.1 23.6 14.3 13.8 4.129 \3.6 13.1 26.2 25.8 17.2 16.1 5.930 9.2 9.5 21.3 20.9 12.8 11.8 4.2
* Desired moisture contents at 1.5 MPa and 0.033 MPa from Worner (1989). Desired moisture contents at 0.33 MPa from Christensen (1985).

ORGANIC CARBON CALIBRATION TESTS
Three replications of the 30 Illinois soil samples at0.033 MPa and 1.5 MPa moisture tensions were used forthe calibration test, with each replication consisting of60 randomized soil-moisture tension samples. A soilsample of approximately 40 g was transferred from asealed plastic bag to a sample cup, and the surface wasstruck off level with the top of the cup. Care was taken tomaintain the soil surface structure; however, a smeared orpartially smeared surface resulted on several of the highclay content samples at the 0.033 MPa tension level. Eachsoil sample was placed under the sensor and multiplereflectance scans were obtained and stored in the dataacquisition computer. The sample was then immediatelyweighed for gravimetric moisture determination. A ceramicreference disk was scanned after every fifth soil sample, orapproximately every 10 min. This ceramic data scan wasthen used as the reference for the next five soil samples.The reflectance data obtained every 5 nm were transformedto optical density and averaged to either a 40 nm or a60 nm bandpass. The averaged optical density data wereanalyzed using PLS techniques. The 0.033 MPa and1.5 MPa moisture tension data were analyzed as a singlegroup to bracket the moisture conditions likely to beencountered in field operation.
Several PLS calibrations were completed using thesedata while varying parameters to:
1. Determine the optimum wavelength range to usefor organic carbon estimation.
2. Determine the effect of varying the number of scansin the ensemble average on predictive capability.
Additional reflectance data were collected from soilsamples at an intermediate moisture tension of 0.33 MPa,as well as from air dry and oven dry samples. Theintermediate tension samples were intended to validate thecalibration equations at another point in the designmoisture range. The air dry samples were used toinvestigate the effects of the extended calibration rangeused by some previous researchers. The oven dry sampleswere analyzed to evaluate the predictive capability of thesensor in a laboratory setting, where drying could be usedto eliminate any influence of moisture variations onreflectance. In each case, three replications of each of the30 Illinois test soils were analyzed with the samelaboratory procedures that were used for the maincalibration datasets.
ORGANIC CARBON ERROR ANALYSIS
Data were collected using samples of three soils(ID Nos. 10, 20 and 26, table 1) at both the 0.033 MPa and1.5 MPa moisture tension levels to partition the variouserror sources present in the data. These three soils werechosen to span the range of colors and carbon contentspresent in the 30 Illinois soils used for calibration. Arandomized complete block design was used, with soil asthe blocking variable. Within each block, there were threereplications of each moisture tension, and within eachreplication (which involved preparation of another soilsample), three lO-scan data collection runs were completedon each soil sample. The ceramic reference disk wasscanned after every six soil samples, or approximatelyevery 10 min. The data were transformed to optical densityand averaged to a 60-nm bandpass (1670- to 2630-nmcenter wavelengths) for PLS analysis.
VOL. 36(6): ]57] -] 582 - NOVEMBER-DECEMBER] 993
HEIGHT VARIATION TESTS
A supplementary set of IOO-scanreflectance data wascollected to study the effects of sample-to-sensor heightvariation on the predictive capability of the calibration.Samples of six 0.033 MPa moisture tension soils (ID Nos.1, 4, 9, 16, 23, and 27) were used in the height variationtests. Three replications of data were collected at fiveheights of the quartz aperture window of the sensor abovethe soil surface: 5 mm, 10 mm, 15 mm (the nominaldistance used for all other tests), 20 mm, and 25 mm.
MOVINGSAMPLETESTS
A sequence of tests assessed the degradation in accuracyassociated with allowing a sample to move past the sensorhead while collecting the reflectance scans. In thissimulation of in-furrow field operation, the test soil wasplaced in a trough in a rotating disk located within a lightexclusion chamber. Sample disk speeds of 1 Hz and 2 Hzwere used, corresponding to linear velocities of 0.75 mlsand 1.5 mls at the center of the sample trough.
The six soils (ID Nos. 1, 4, 9, 16, 23, and 27) at0.033 MPa moisture tension used in these tests were thesame ones used in the height variation tests. Due topractical considerations, all tests for each soil werecompleted at one time within a randomized soil order.Within each soil, the reflectance data collected were:
1. Ceramic reference.2. Stationary readings at three positions randomly
selected from the six measurement locations evenlyspaced around the sample trough.
3. Duplicate readings at the slow (nominal 0.75 m/s)speed.
4. Duplicate readings at the fast (nominal 1.5 m/s)speed.
5. Three stationary readings, at the locations notmeasured in the second step.
6. A second ceramic reference.
ESTIMATION OF SOIL MOISTURE AND CEC
The spectral reflectance data obtained in the laboratorywere also used to predict soil moisture content and cationexchange capacity (CEC). The PLS analyses were used tocorrelate spectral information with laboratory determinedgravimetric moisture (table 2) and CEC (table 1) for the30 Illinois soils.
INSTRUMENT MODIFICATIONS FOR FIELD TESTING
The prototype portable spectrophotometer was adaptedfor field use and was operated to collect soil reflectancedata under field conditions. Modifications to the systemincluded the addition of a suitable sample presentationmechanism and modification and packaging of the sensorto enable it to operate on a moving vehicle and withstandfield environmental conditions.
The in situ sensing approach, where the instrumentscanned the bottom surface of a furrow prepared by sometype of opener, was selected (Sudduth, 1989). Dis-advantages of this method were difficulty of reflectancecalibration and inability to hold the sample stationary whiledata were being acquired, but in situ sensing provided themost direct route to development of a workable prototypefield sensor. After evaluation of several commercialsoil-engaging components, a row unit from a HinikerEcon-O- Till ridge cleaner was selected to create the
]575

flat-bottomed fUITOWwith uniform surface texture neededfor field testing.
Sensor modifications made prior to field testing were inthe areas of power supply, packaging, and mounting; thebasic optical and electronic systems described by Sudduthand Hummel (1993) were not altered. The sensor wasmounted to the Hiniker row cleaner unit (fig. 2), which inturn was attached to the three-point hitch of a compactutility tractor. The filter disk housing and source werecontained in one sealed electrical enclosure, while thesensor head assembly, detector, and preamplifier weremounted in another sealed electrical enclosure, with thequartz window of the sensor head assembly aligned with anaperture in the bottom surface of the enclosure. The sensorhead enclosure was mounted in a light exclusion shieldfabricated from an open-bottomed steel box, which was inturn rigidly attached to the rear of the ridge cleaner rowunit. The two sensor enclosures were optically connectedby a fiber optic bundle protected inside flexible conduit.
Three 12 V deep-cycle batteries powered the sensor anddata acquisition system. One battery provided dc power tothe lamp and filter disk timing circuit. The remaining twobatteries powered an invertor, which output 115 Vac to thefilter disk motor, the precision power supply for thedetector and preamplifier, and the data acquisitioncomputer. All sensor components could have beendc powered; ac power was merely used to speed thefabrication of the prototype.
Field data acquisition was accomplished with the sameMetraByte DAS-16 I/O board as was used in the laboratorytests (Sudduth and Hummel, 1993). The DAS-16 wasinstalled in an expansion chassis attached to a laptopcomputer with an 8OC88processor running at 8 MHz. Thedata acquisition software used in the field was modifiedfrom that used in the laboratory to allow for the
Figure 2-Prototype portable NIR spectrophotometer during fieldoperation.
1576
450 individual scans which would be obtained in a 180 stest run.
IN-FIELD ESTIMATION OF ORGANIC CARBON
Field tests were conducted at the University of IllinoisAgricultural Engineering Farm in Urbana. Four testlocations were identified to span the range of soil types andorganic matter contents present on the farm. At eachlocation, duplicate 90 m test runs were completed within5 m of one another. The ridge cleaner unit was adjusted sothat the horizontal disk cut a 35- to 50-mm deep fUITow.The average forward speed of the tractor wasapproximately 0.65 m/s. This low speed was used sincebounce and pitch of the small tractor at higher speedsduring preliminary tests had caused a rough, non-uniformfuITOW bottom.
Absolute reflectance calibration of the sensor was amanual procedure, accomplished with the hitch raised andthe tractor stationary. A wooden test fixture held theceramic disk used for calibration a constant 15 mm fromthe sensor head and excluded ambient light. A 50-scanreading of the ceramic calibration standard was obtainedbefore each test run, and a second ceramic reading wasobtained after the run was completed.
As each run was progressing, the location of the sensinghead was marked every 10 s. Once the run was complete, asoil sample of approximately 150 g was obtained at eachmarked location for carbon and moisture analysis. Either13 or 15 samples were obtained for each 120 s (Run 1) or140 s (Runs 2 through 8) test. Gravimetric moisture andorganic carbon were determined using the same analysisprocedures as for the laboratory calibration soils.
Data were processed similarly to the laboratory testdata, with modifications to allow for the individual scandata obtained in the field tests. The mean of the1()()ceramic scans associated with each run was used as thereflectance standard for the run. For each field run, either300 (Run 1) or 350 (Runs 2 through 8) individual,unaveraged scans were converted to optical densityrepresentation for input to the PLS prediction routines.
RESULTS AND DISCUSSIONORGANIC CARBON CALIBRATION TESTS
Comparisons of the replicate spectral reflectance curvesobtained with the prototype portable spectrophotometer tothose previously obtained on the same soils at the USDAInstrumentation and Sensing Laboratory by Worner (1989)showed close agreement in both overall shape and level(fig. 3). An analysis of variance performed on the meanreflectance value for each curve showed no significantdifference between the three replicates. There werestatistical differences between the actual moisture contentsof the samples and the desired moisture contents, but thesedifferences were generally small and since the sensor wasexpected to compensate for moisture content they were notconsidered important.
The optimum wavelength range was determined usingthe 30-soil calibration test data and IO-scan ensembleaveraging on each soil sample. With a 40 nm data spacing,the 1660- to 2620-nm range, consisting of 26 data points,was the most predictive. Analysis of 60-nm data confirmedthe predictive capabilities of that data spacing over a
TRANSACfIONS OF TIJE ASAE

0.6
0.5- 1.5MPaTension
- - - 0.033 MPa Tension
00:::. 0.4""<:"-g 0.3115II:
1::~ 0.2Q;a..
0.1
0 -400 800 1200 1600 2000 2400
Wavelength, nm
Figure 3-Comparison between mean reflectance curves from theUSDA-ARS Instrumentation and Sensing Laboratory (ISL) and threereplicate prototype spectrophotometer curves for Ade Loamy Sand attwo moisture tension levels.
similar (1670 to 2630 nm) wavelength range. In theseanalyses, as well as all other PLS analyses, the cross-validation techniques integral to the analysis program wereused to ensure that the data were not overfit and to generatethe standard error of prediction (SEP) values.
Scan averaging effects on predictive capability weredetermined using a single scan data set and datasetsconsisting of the averages of from 5 to 100 scans on eachsample, collected at a rate of 5 scans/so Averaging fewerthan 10 data scans did not allow the sensor to meet thedesign objective of a SEP less than 0.29% organic carbon.With 10 or more scans, averaging of additional scansdecreased the SEP over the range tested (table 3). The bestpredictors of organic carbon were the 100 scan datasetswith either a 40 nm (fig. 4) or 60 nm data spacing.However, little improvement was seen by increasing thenumber of scans from 60 to 100. Based on these results,
Table 3. Summary of partial least squares regression results fordetermining the optimum number of scans to ensemble average
for soil organic carbon prediction with the portablespectrophotometer, based on laboratory test data
No.ofScansEnsembleAveraged
No. of Factors*
TotalValid
SEP Withinom of Min' R2 SEct SEPt
* The maximum number of factors valid by cross-validation, and the numberof factors necessary to achieve a SEP within 0.01 of the minimum SEP.
t SEC (Standard Error of Calibration) is the standard error of the estimate inthe calibration data in percent organic carbon.
:\: SEP (Standard Error of Prediction) is the standard error of the estimate inthe validation data in percent organic carbon.
§ Maximum number of factors which could be extracted by the program, dueto array size limitations. Results presented are based on this number offactors, although additional factors may be valid.
VOL. 36(6): 1571-1582 - NOVEMBER-DECEMBER 1993
4/
//
/I
/
. /
vi'I
:t~'I .~/.'
/ .
r2 ~ 0.89
SEP = 0.23
- 3<:Q)"Q;a..<:0-e 2"0'0"U'0"a:: 1
00 2 3 4
Measured Carbon, Percent
Figure 4-Predicted vs. measured organic carbon content of 30 lllinoissoils at 0.033 MPa and 1.5 MPa moisture tension levels.
additional analyses used 100-scan average data from 1640to 2640 nm (40-nm spacing) or from 1670 to 2630 nm(60-nm spacing), unless otherwise noted.
Addition of the data collected at 0.33 MPa moisturetension to the standard calibration dataset collected at0.033 MPa and 1.5 MPa moisture tensions slightly reducedthe predictive capability of the data (table 4). In anothertest, the calibration equation developed with the lOO-scanstandard (0.033 MPa and 1.5 MPa) dataset was applied tothe combined dataset containing 0.033 MPa, 0.33 MPa, and1.5 MPa data. The SEP obtained with this equation was0.23 for the calibration dataset and 0.24 for the combineddataset. The small increase in SEP seen with theintroduction of a completely independent dataset at a newmoisture tension indicated that the cross-validationtechniques in the calibration program were guardingagainst data overfitting as expected.
* The maximum number of factors valid by cross-validation, and the numberof factors necessary to achieve a SEP within 0.01 of the minimum SEP.
t SEC (Standard Error of Calibration) is the standard error of the estimate inthe calibration data in percent organic carbon.
:\: SEP (Standard Error of Prediction) is the standard error of the estimate inthe validation data in percent organic carbon.
§ Maximum number of factors which could be extracted by the program, dueto array size limitations. Results presented are based on this number offactors, although additional factors may be valid.
1577
40 nm Data Spacing(1640-2640 nm, 26 points)
10 10 8 0.85 0.26 0.2825 II 9 0.87 0.24 0.2540 17§ 11 0.88 0.23 0.2460 17§ 12 0.89 0.22 0.23
100 17§ 10 0.89 0.22 0.23
60 nm Data Spacing(1670-2630 nm, 17 points)
10 11 9 0.85 0.26 0.27100 16 II 0.88 0.23 0.23
Table 4. Summary of partial least squares regression results forcalibration datasets including oven dry, air dry, and 0.33 MPa
moisture tension samples
No. of Factors*
Moisture ContentsIncluded in Total SEP WithinCalibration Data Valid 0.01 of Min R2 SECt SEP:\:
10-scan Average Data0.033 MPa & 1.5 MPa 10 8 0.85 0.26 0.280.033 MPa, 0.33 MPa 10 9 0.83 0.27 0.28
& 1.5 MPa0.033 MPa, 1.5 MPa 10 9 0.84 0.27 0.28
& air dryOven dry only 11 9 0.90 0.21 0.24
IOO-scan Average Data0.033 MPa & 1.5 MPa 17§ 10 0.89 0.22 0.230.033 MPa, 0.33 MPa l2§ 11 0.87 0.24 0.25
& 1.5 MPa0.033 MPa, 1.5 MPa l2§ 10 0.86 0.25 0.25
& air dry0.033 MPa, 0.33 MPa, 9§ 8 0.84 0.26 0.26
1.5 MPa & air dryOven dry only 13 10 0.92 0.20 0.22

Inclusion of air dry soil data in the calibration datasetreduced the predictive capability of the regression ascompared to the standard 0.033 MPa and 1.5 MPa dataset(table 4). Because of this reduction and since it would beunlikely to encounter soil dryer than 1.5 MPa (wiltingpoint) during field operation of the organic matter sensorwith a herbicide applicator, only 1.5 MPa and 0.033 MPamoisture tension data were included for development of thein-field calibration equation. A calibration (table 4)considering only the oven dry soil samples as a separatedataset was somewhat more predictive than the standardcalibration, indicating that use of the sensor in a laboratorysetting could be enhanced by oven drying of the soilsamples before reflectance scanning.
ORGANIC CARBON ERROR ANALYSIS
Error source partitioning was based on methodssuggested by Williams (1987). Two datasets werecombined for this analysis - the 10-scan calibration datasetand the error analysis dataset containing repeated datacollection runs on the same sample. The PLS calibrationbased on these 60 nm data yielded an r2 of 0.87 and a SEPof 0.27 for the combined dataset. Error components wereestimated from this calibration as detailed by Sudduth(1989).
The errors due to instrument noise and drift accountedfor 12% of the total error. The errors associated withorientation of the sample under the sensor accounted for6%. Sampling error, including acquiring a subsample fromthe total soil sample and preparing the sample cup, was 8%of the total error. Moisture error contributed an additional14%, leaving 60% attributable to regression error. Thesmall portion of the total error attributable to theinstrument and to sample preparation and presentationprocedures indicated good performance of the system inthose areas. The low error percentage due to moisturevariations was also encouraging, as an indication that theregression was properly compensating for varying moisturecontents of the samples.
HEIGHT VARIATIONTESTSVisual observation of the reflectance data obtained in
the height variation tests showed considerable offsetbetween readings from the same sample at differing heights(fig. 5). This variability was reduced by normalizing thedecimal reflectance signal to a mean value of 1.00 for eachsample curve. The normalization procedure collapsedalmost all of the height variability out of the reflectancecurves for individual soils (fig. 5), while retainingsignificant inter-soil variability (fig. 6), as needed for theprediction process.
Before varying height data were analyzed, a PLScalibration based on normalizing the most predictivecalibration data (loa-scan data from 1640 to 2640 nm on a40 nm spacing) was completed. The normalized data wereslightly more predictive (r2 = 0.90, SEC = 0.21, SEP =0.22) of organic carbon than were the un-normalized data(table 3). Normalization of decimal reflectance was foundto be a better approach than normalization of the data afterthe transformation to optical density.
ThreeseparatePLScalibrationswereusedin analysisofthe normalized varying height data:
1578
2000 2200
Wavelength, nm
Figure S-Reflectance curves for Proctor Silty Clay Loam (Soil 27) at0.033 MPa moisture tension and five sample heights relative to thesensor, before (top) and after (bottom) normalization.
8 0.2
+10mm+ 5mmNominal-5mm-10mm-
Q)uc'"
1:3Q)'"Q)a:EQ)uQ;0..
0.1
01600 1800 2000 2200
Wavelength, nm
2400 2600
2
Q)uai
1:3Q)'"Q)a:uQ)N~E0z
01600 1800 2400 2600
1. The calibration described above, using the normal-ized calibration dataset (n = 180).A calibration combining the dataset describedabove and all the varying height data for the sixsoils (n = 270).A calibration combining the 180-observationnormalized calibration data and the varying heightdata for Soil 4 and Soil 23 (n = 210).
2.
3.
2
"()c'""Q)
~a:u".~<iiE0z
-S0119Soil 16Soil 23Soil 27Soil 180114
01600 1800 2000 2200 2400 2600
Wavelength, nm
Figure 6-Normalized reflectance curves for the varying heightcalibration soils at 0.033 MPa moisture tension and nominal sampleheight.
TRANSACTIONS OF TIlE ASAE

Table 5. Standard errors of prediction (SEP) for various calibration equationsources and prediction datasets developed to evaluate tbe effects of varying
soil sample height on organic carbon estimation
Calibration Equation Source
Standard 180Sample Calib. STD Plus Six Soils at STD Plus Two SoilsDataset (STD) Varying Heights at Varying Heights
0.22
Prediction Dataset
Standard 180 SampleCalib. Dataset (STD)
0.24 0.23
Each calibration was applied to the complete dataset andvarious subsets and a SEP calculated for each calibrationequation and prediction dataset combination (table 5). Theoverall SEP for the varying height samples was lowerwhen using the varying height calibration equations, asopposed to the standard, normalized calibration equation,even though normalization had removed most of theobservable difference between the reflectance curvesobtained at varying sample-to-sensor heights.
The SEP at individual heights varied, with betterprediction at the greater heights, where sampleheterogeneity could be compensated for by the largersensed spot on the sample, and at the lesser heights whereincreased signal could be obtained. The least predictivedata were seen in the center of the height span.Unfortunately, it was impractical to take advantage of thesetrends for in-furrow sensing due to the difficulties involvedwith precise height control. Based on the results of thevarying height tests, it was decided to normalize the opticaldensity data and include data from samples scanned atvarying heights when developing calibration equations forthe field sensor.
MOVING SAMPLE TESTS
Data from the moving sample tests were normalizedbefore analysis to remove that portion of the sample-to-sample variability due to wobble in the plate holding thesoil, which allowed up to 2 mm in height deviation fromone location along the soil sample trough to another.
For analysis of the normalized, 100-scan mean movingsample data, three separate PLS calibrations, similar tothose used in analysis of the varying height data, wereused:
1. The standard calibration, using the normalizedcalibration dataset (n = 180). Predictions weredeveloped using both 17 and 11 factors from thiscalibration equation.
2. A calibration combining the standard calibrationdataset described above and all the moving sampledata, both static and dynamic, for the six soils (n =240).
3. A calibration combining the 180-observationnormalized calibration data and the static anddynamic moving sample data for Soil 4 and Soil 23(n = 200).
Both dynamic and static data from the moving sampletests were included in the calibrations since the static dataquantified the variations in reflectance due to the heightvariations around the sample disk trough. Each calibrationwas applied to the complete dataset and various subsetsand a SEP calculated for each calibration equation and
VOL. 36(6):1571-1582 - NOVEMBER-DECEMBER1993
Table 6. Standard errors of prediction (SEP) for various calibrationequation sources and prediction datasets developed to evaluate
the effects of soil sample movement during data acquisition onorganic carbon estimation
Calibration Equation Source
Standard 180
Sample Calib.Dataset (STD)
SID Plus SID Plus6 Moving 2 Moving
Soil SoilSamples SamplesPrediction Dataset
0.47
Standard 180 SampleCalib. Dataset (SID)
60 Sample Moving Test(MOV), Including BothStatic and Dynamic
0.26 0.23
0.30
24 Dynamic SamplesinMOV
36 Static SamplesinMOV
SID Plus MOV
prediction dataset combination (table 6). Where movingsample data were included in the development of thecalibration equation, better prediction was obtained for themoving samples. The calibration set which included all sixmoving sample tests was a better predictor than thecalibration set which included only two moving sampletests. The standard calibration equation with 11 factors wasa better predictor for the moving sample data than thestandard calibration equation with 17 factors. Although the17-factor equation did not overfit the standard calibrationdata, some degree of overfitting was evidenced when it wasapplied to the moving sample data. Based on these tests,inclusion of all moving samples in the calibration stepwould be the best approach for field use. The SEP of 0.38for the moving samples with this approach was the lowestobtained, but unfortunately was higher than the maximumdesired SEP of 0.29.
ESTIMATION OF SOIL MOISTURE AND CEC
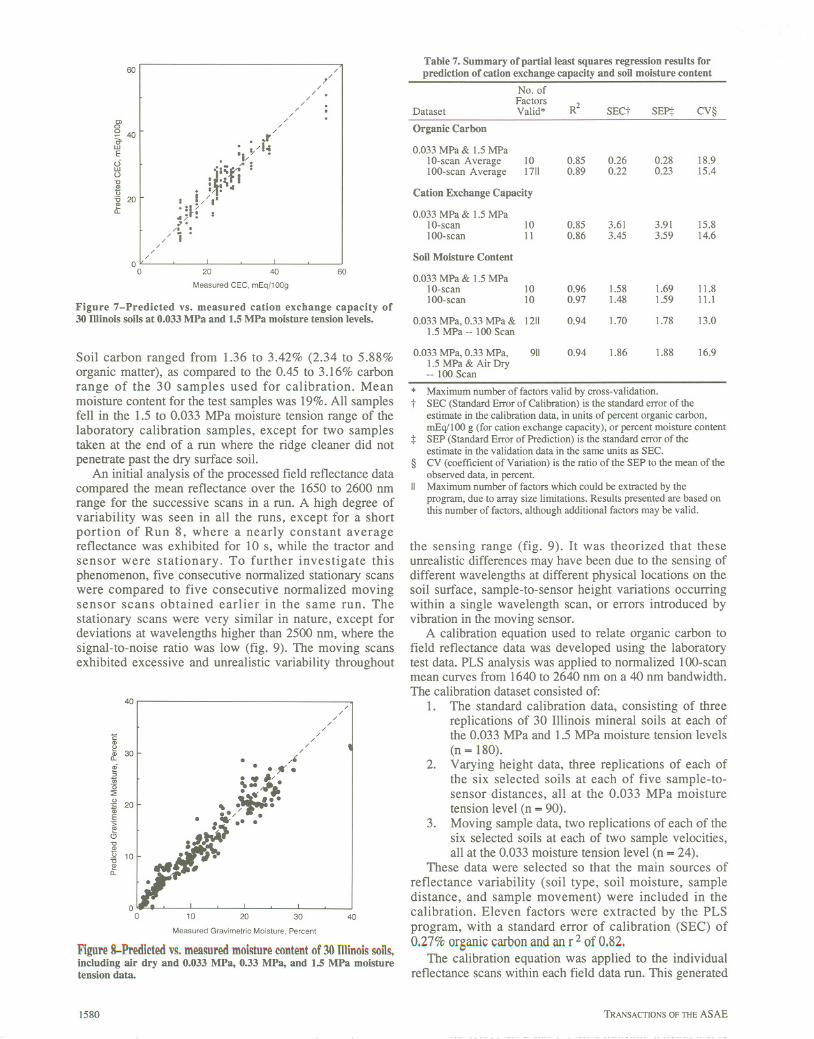
Cation exchange capacity (CEC) and soil moisturecontent were estimated using 40 nm data, with 10-scan or100-scan averaging. The best CEC prediction yielded aSEP of 3.59 mEq/lOOg for the combination of 0.033 MPaand 1.5 MPa moisture tensions (fig. 7). Moisture contentwas predicted with a SEP of 1.88% for the datasetincluding 0.033 MPa, 0.33 MPa, 1.5 MPa, and air dry soil(fig. 8). In terms of the coefficient of variation (CV), theprediction of these two properties was even more accuratethan the prediction of soil organic carbon (table 7). Thus,the portable spectrophotometer could be used to measuresoil moisture and CEC as well as organic carbon.
IN-FIELD ESTIMATION OF ORGANIC CARBON
Mechanical operation of the sensor in the field was quitegood. The furrow formed by the horizontal disk wasgenerally smooth and uniform. Isolated buried residueappearing in the path of the sensor head and someroughness caused by adhesion of soil in the wettest parts ofthe test runs were the only problems noted.
Laboratory carbon analysis showed considerablevariation among the four test locations and eight test runs.
1579
STD Plus 90 Varying 0.24 0.22 0.21Height Samples
90 Varying Height 0.26 0.17 0.18Samples
17 Fact. II Fact.
0.22 0.23
0.58 0.47
0.86 0.68 0.38 0.70
0.26 0.27 0.25 0.22
0.34 0.30 0.26 0.30
60
0>0;:> 40"iTwE<5wU-aQ)(;'6 20Q)a:
/
?//
// ./
//
//
. r/:. ~A.;
t.";:;~'/i .
: ':l I. . . ..I I / .
.:V/ I~~: I/. .
/// i ./
/
00 20 40 60
Measured CEC, mEq/100g
Figure 7-Predicted vs. measured cation exchange capacity of30 Illinois soils at 0.033 MPa and 1.5 MPa moisture tension levels.
Soil carbon ranged from 1.36 to 3.42% (2.34 to 5.88%organic matter), as compared to the 0.45 to 3.16% carbonrange of the 30 samples used for calibration. Meanmoisture content for the test samples was 19%.All samplesfell in the 1.5 to 0.033 MPa moisture tension range of thelaboratory calibration samples, except for two samplestaken at the end of a run where the ridge cleaner did notpenetrate past the dry surface soil.
An initial analysis of the processed field reflectance datacompared the mean reflectance over the 1650 to 2600 nmrange for the successive scans in a run. A high degree ofvariability was seen in all the runs, except for a shortportion of Run 8, where a nearly constant averagereflectance was exhibited for lOs, while the tractor andsensor were stationary. To further investigate thisphenomenon, five consecutive normalized stationary scanswere compared to five consecutive normalized movingsensor scans obtained earlier in the same run. Thestationary scans were very similar in nature, except fordeviations at wavelengths higher than 2500 nm, where thesignal-to-noise ratio was low (fig. 9). The moving scansexhibited excessive and unrealistic variability throughout
40
1::Q)()
:;; 30Il.cD5;;'0:2.g 20a;E'S:'"<9-a'"1! 10-aQ)a:
00 10 20 30 40
Measured Gravimetric Moisture, Percent
Figure 8-Predicted VS.measured moisture content of 30 Illinois sonS,including air dry and 0.033 MPa, 0.33 MPa, and 1.5 MPa moisturetension data.
1580
* Maximum number of factors valid by cross-validation.t SEC (Standard Error of Calibration) is the standard error of the
estimate in the calibration data, in units of percent organic carbon,mEqlloo g (for cation exchange capacity), or percent moisture content
+ SEP (Standard Error of Prediction) is the standard error of theestimate in the validation data in the same units as SEe.
§ CV (coefficient of Variation) is the ratio of the SEP to the mean of theobserved data, in percent.
II Maximum number of factors which could be extracted by theprogram, due to array size limitations. Results presented are based onthis number of factors, although additional factors may be valid.
the sensing range (fig. 9). It was theorized that theseunrealistic differences may have been due to the sensing ofdifferent wavelengths at different physical locations on thesoil surface, sample-to-sensor height variations occurringwithin a single wavelength scan, or errors introduced byvibration in the moving sensor.
A calibration equation used to relate organic carbon tofield reflectance data was developed using the laboratorytest data. PLS analysis was applied to normalized lOO-scanmean curves from 1640 to 2640 nm on a 40 nm bandwidth.The calibration dataset consisted of:
1. The standard calibration data, consisting of threereplications of 30 Illinois mineral soils at each ofthe 0.033 MPa and 1.5 MPa moisture tension levels(n = 180).
2. Varying height data, three replications of each ofthe six selected soils at each of five sample-to-sensor distances, all at the 0.033 MPa moisturetension level (n = 90).
3. Moving sample data, two replications of each of thesix selected soils at each of two sample velocities,all at the 0.033 moisture tension level (n = 24).
These data were selected so that the main sources ofreflectance variability (soil type, soil moisture, sampledistance, and sample movement) were included in thecalibration. Eleven factors were extracted by the PLSprogram, with a standard error of calibration (SEC) of0.27% organic carbon and an r 2 of 0.82.
The calibration equation was applied to the individualreflectance scans within each field data run. This generated
TRANSACTIONS OF TIlE ASAE
Table 7. Summary of partial least squares regression results forprediction of cation exchange capacity and soil moisture content
No, ofFactors
R2Dataset Valid* SECt SEPt CV§
Organic Carbon
0.033 MPa & 1.5 MPaI O-scan Average 10 0.85 0.26 0,28 18,9
100-scan Average 1711 0.89 0.22 0.23 15.4
Cation Exchange Capacity
0.033 MPa & 1.5 MPaI O-scan 10 0.85 3.61 3.91 15.8100-scan II 0.86 3.45 3.59 14.6
Soil Moisture Content
0.033 MPa & 1.5 MPaI O-scan 10 0.96 1.58 1.69 11.8100-scan 10 0.97 1.48 1.59 Il.l
0.033 MPa, 0.33 MPa & 1211 0.94 1.70 1.78 13.01.5 MPa -- 100 Scan
0,033 MPa, 0.33 MPa, 911 0.94 1.86 1.88 16.9
1.5 MPa & Air Dry-- 100 Scan

2
CDCJ
ai1:5CD
=CD
a: 1"0CDN'fijE0z
01600 1800 2000 2200
Wavelength,nm
2400 2600
2
CDCJ
ai1:5CD
'$a: 1"0CD.!::!7iiE0z
01600 1800 2000 2200
Wavelength,nm
Figure 9-Comparison of five replicate normalized reflectance scansacquired in the field with the sensor stationary (top) and moving(bottom).
2400 2600
a predicted organic carbon trace with an unrealistic degreeof variability. These data were then processed through a25-point (10 s) moving average routine after elimination ofobvious outlier points. The averaged predicted organiccarbon traces were compared with laboratorymeasurements by extraction of predicted organic carbonvalues at the run times corresponding to the locations of thelaboratory samples (fig. 10). Good agreement was seen inthe overall means (reflectance mean = 2.44% carbon,laboratory mean = 2.41%, n = 102). However, there wasnot good agreement between laboratory and reflectancedata at the individual measurement locations (SEP = 0.53%organic carbon). This SEP was unsatisfactory whencompared to the range (1.36-3.42%) and standard deviation(0.50%) of the laboratory determined organic carbon data.The errors in reflectance data associated with sensing whilemoving apparently carried over into errors in organiccarbon estimation.
CONCLUSIONS. The best laboratory correlation of reflectance withorganic carbon (r2 = 0.89, SEP = 0.23% organiccarbon) was obtained when the data were smoothedto a 40 nm data point spacing over the wavelength
VOL. 36(6): 1571-1582 - NOVEMBER-DECEMBER 1993
- 4c:CD"Qja..",3.81;;0" 2'1:'"OJ0
10
Run1
/ V}..
/\""'" .' :',.'.. / \.: f "
Y1.J\.f\""'" .,'
",. .,~ "" '.. ""''''1''''.' " "" \: ~..~:' ~ ~ .:~.' " "i .
20 40 60 80Elapsed Run Time, s
100 120 140
- 4c:"":;;
~30.c1;;0" 2'1:'"E'0
10
Run2,
':\,.j\ :/-t.!\.,:'~-(
\~..:.;}..i\
20 40 60 80Elapsed Run Time, S
100 120 140
Figure lO-Measured (solid curve) and sensor predicted (dashedcurve) organic carbon for field test runs 1 and 2. Data points indicatepaired laboratory and sensor data used for statistical comparison.
range from 1640 to 2640 nm and 100 scans of eachsoil sample were ensemble averaged. Similarcorrelation was obtained with a 60 nm data spacingand a slightly smaller wavelength range.Partitioning of the errors found in the laboratoryshowed small error contributions from instrumentnoise and from sample preparation andpresentation.The predictive capability of data obtained with theprototype portable spectrophotometer approachedthe predictive capability of data obtained on thesame soils with a research-grade spectro-photometer.Variations in sample-to-sensor height only slightlyreduced the organic carbon predictive capabilitywhen the wavelength data were normalized beforecalibration.Laboratory tests conducted with moving soilshowed considerable degradation of organic carbonpredictive capability.The cation exchange capacity and moisture contentof the test set of 30 Illinois mineral soils wereestimated successfully in the laboratory. The bestCEC calibration yielded a SEP of 3.59 mEq/lOOgand the best moisture calibration yielded a SEP of1.59% moisture content.In-furrow soil sensing was accomplished at slowtravel speeds after the addition of a soil opener andprotective packaging of the spectrophotometerassembly.In-furrow sensing did not provide accurateestimates of soil organic matter content. Movementof the sample relative to the sensor duringwavelength scanning seemed to be a majorcontributor to the lack of predictive capability.
ACKNOWLEDGMENT.The authors acknowledge thecontributions of Robert C. Funk and others at AGMED,Inc. to this research.
1581

REFERENCESChristensen, D. A. 1985. Real-time soil moisture content sensing
using near infrared reflectance. Unpub. M.S. thesis, Library,Univ. of Illinois at Urbana-Champaign.
Gaultney, L. D., J. L. Shonk, D. G. Schultze and G. E.
Van Scoyoc. 1989. A soil organic matter sensor forprescription chemical application. In Agricultural engineering- Proc. of the 11 th international congress, Dublin, 4-8September 1989, eds. V. A. Dodd and P. M. Grace, 3065-3072.Rotterdam: Balkema.
Griffis, C. L. 1985. Electronic sensing of soil organic matter.Transactions of the ASAE 28(3):703-705.
Gunsaulis, F. R., M. F. Kocher and C. L. Griffis. 1991. Surfacestructure effects on close-range reflectance as a function of soilorganic matter content. Transactions of the ASAE 34(2):641-649.
Kocher, M. F. and C. L. Griffis. 1989. Laboratory performance ofa sampler for on-the-go in-situ soil carbon contentmeasurement. ASAE Paper No. 89-1008. St Joseph, MI:ASAE.
Krishnan, P., J. D. Alexander, B. J. Butler and J. W. Hummel.1980. Reflectance technique for predicting soil organic matter.Soil Sci. Soc. Am. J. 44(6): 1282-1285.
McGrath, D. E., J. P. Ellingson and A. O. Leedahl. 1990. Variableapplication rates based on soil organic matter. ASAE Paper No.90-1598. St. Joseph, MI: ASAE.
Martens, H. and T. Naes. 1987. Multivariate calibration by datacompression. In Near-infrared Technology in the Agriculturaland Food Industries, eds. P. C. Williams and K. H. Norris, 57-87. St. Paul, MN: American Association of Cereal Chemists.
1582
Pitts, M. J., J. W. Hummel and B. J. Butler. 1986. Sensors utilizinglight reflection to measure soil organic matter. Transactions ofthe ASAE 29(2):422-428.
Shonk, J. L. and L. D. Gaultney. 1988. Spectroscopic sensing forthe determination of organic matter content. ASAE Paper No.88-2142. St. Joseph, MI: ASAE.
Smith, D. L. 1991. Visible/NIR reflectance soil organic mattersensor - Laboratory investigation. Unpub. M.S. thesis,
Library, Univ. of Illinois at Urbana-Champaign.Sudduth, K. A. 1989. Near infrared reflectance soil organic matter
sensor. Ph.D. diss., Univ. of Illinois at Urbana-Champaign.Public. No. 90-15736. Ann Arbor, MI: University Microfilms,Inc. [Diss. Abstr. Int. B 51(1):308].
Sudduth, K. A. and J. W. Hummel. 1991. Evaluation ofreflectance
methods for soil organic matter sensing. Transactions of theASAE 34(4):1900-1909.
Sudduth, K. A. and J. W. Hummel. 1993. Portable, near-infraredspectrophotometer for rapid soil analysis. Transactions of theASAE 36(1): 185-193.
Williams, P. C. 1987. Variables affecting near-infrared reflectancespectroscopic analysis. In Near-infrared Technology in theAgricultural and Food Industries, eds. P. C. Williams andK. H. Norris, 57-87. St. Paul, MN: American Association ofCereal Chemists.
Womer, C. R. 1989. Design and construction of a portablespectrophotometer for realtime analysis of soil reflectanceproperties. Unpub. M.S. thesis, Library, Univ. of Illinois atUrbana-Champaign.
TRANSACTIONS OF TIlE ASAE