Embed Size (px)
Citation preview
Soil Mapping: A Soil Mapping: A BlueprintBlueprint for for Optimizing Inputs and YieldOptimizing Inputs and Yield
By: Jim Yager, Ph.D.By: Jim Yager, Ph.D.
Oct. 23, 2014Oct. 23, 2014Tulare Fall Citrus MeetingTulare Fall Citrus Meeting

Do You Need A BlueprintDo You Need A Blueprint??
• Build a New House Without A Blueprint?
• Order Windows Without a Blueprint?
• Would You Really Develop a New Citrus Planting Without a Blueprint… Or Order
• Trees Without a Blueprint?
• A Blueprint is a Small Investment to Help Manage, Control, and Execute the Large Investment Going into A New Planting.

Are We At Risk with Same Old Ways?Are We At Risk with Same Old Ways?
• Faced with Drought, Water Crisis, ACP, and Gloomy Economics, Can We Afford to Farm the Same Old Way?
Doing the Same Thing Over and Over Expecting Doing the Same Thing Over and Over Expecting Different Results is the Definition of Insanity!Different Results is the Definition of Insanity!

How Do You Make A Blueprint?How Do You Make A Blueprint?
• Use Technologies to Get Current Data & Information to Bring About Significant Improvements.
• Soil Textures are the Fixed and Critical Factor For a Superior Citrus Planting.
• It Includes an Integration of All the Resources, Systems, and Processes: Soil, Crop, Water, Inputs, Outputs, and Pest Management.

Data From the Veris Technology!Data From the Veris Technology!
- + - - + -- + - - + -
11 FtFt
3 Ft3 Ft
Veris EC Data and Directed Sampling for Verification Along with Analysis and Interpretation Provides Information and Knowledge.
Started in 1998!Mapped > 100,000Acres and 34 Different Crops
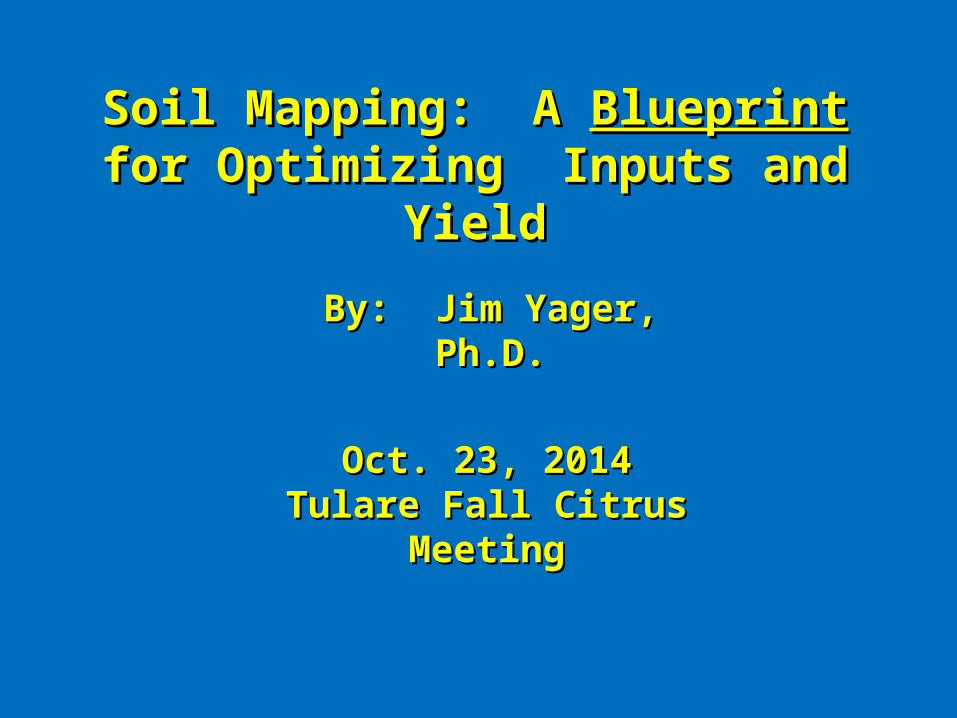
Key Color Codes to Electrical Conductivity MapsKey Color Codes to Electrical Conductivity Maps
• Red is High EC = Fine Textured (Clayey) Soils
• Yellow EC = Field Average
• BlueBlue is Low EC = Coarse Texture (Sandy)Soils
.5 X Mean Mean 1.5 X Mean.5 X Mean Mean 1.5 X MeanEC’s EC’s BlueBlue Yellow Yellow RedRed
To Estimate Yields if You Have A Block Average:To Estimate Yields if You Have A Block Average:

Data Analysis Is the Critical Factor!Data Analysis Is the Critical Factor!
Normal Distribution Around Mean Distribution of Good, Bad SoilsA Typical Map Provided by Most Service Providers.
Do Best Job of Farming on Better Soils While Saving Input on Worst Soils
Why I See What You Don’t!Why I See What You Don’t!
• We Are Looking for Different Things.
• I Trained as Combat Engineer Officer! With “Mouse Trap” Booby Traps… If You Heard a Snap You Were Dead
• Trained to Spot, Sweep and Disarm Mines.
• That is Why I See Things You Don’t. It’s A Habit for Me But You Can Develop These Same Skills.

• I Have Done Corporate Sales and R&D. If You Can’t See Performance Differences, You Don’t Have A Product to Sell! Customers Will not Buy.
• Which is Why Some of You Have Not Been Impressed With the Whole PA Tech. Thing! The Maps Don’t Relate To Things You See in Your Fields.
• Look for Differences in How Products Work or Don’t Work, and For Any Thing That Looks Very Similar or Are Very Contrasting in Size, Shape, Color, Texture, etc.

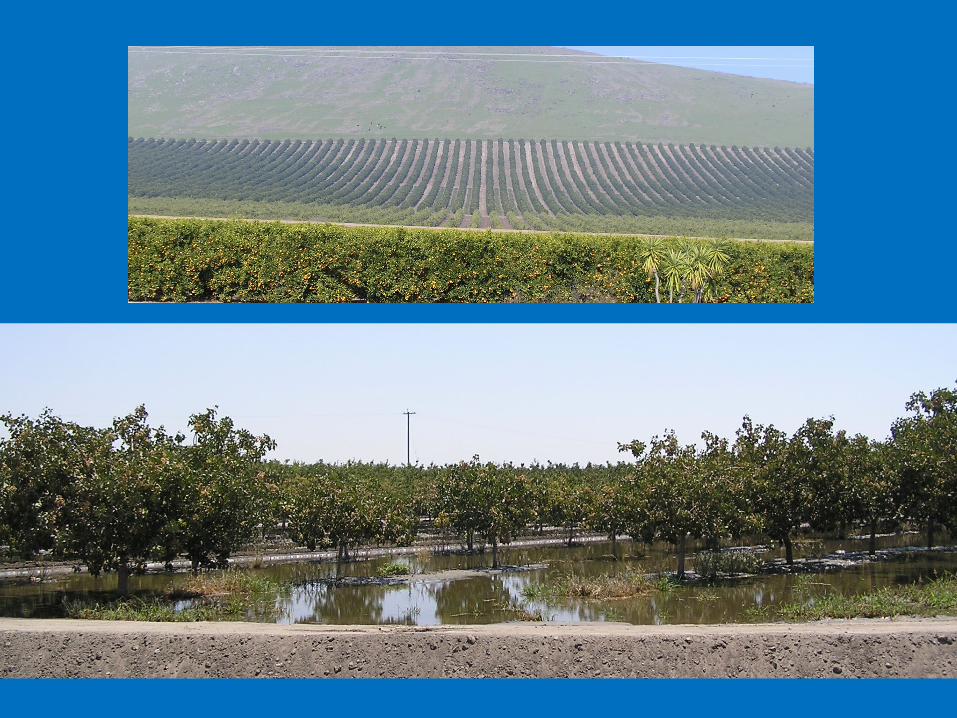

Verification of Textures to EC - Best/Worst SoilsVerification of Textures to EC - Best/Worst Soils
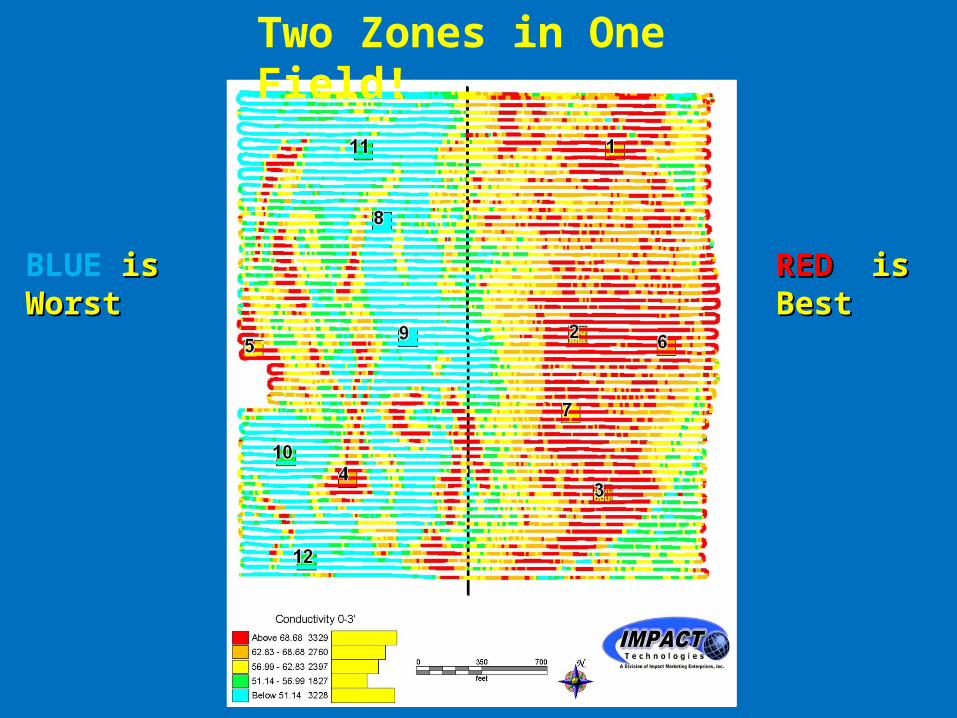
Two Zones in One Field!
REDRED is Best is BestBLUE is Worstis Worst
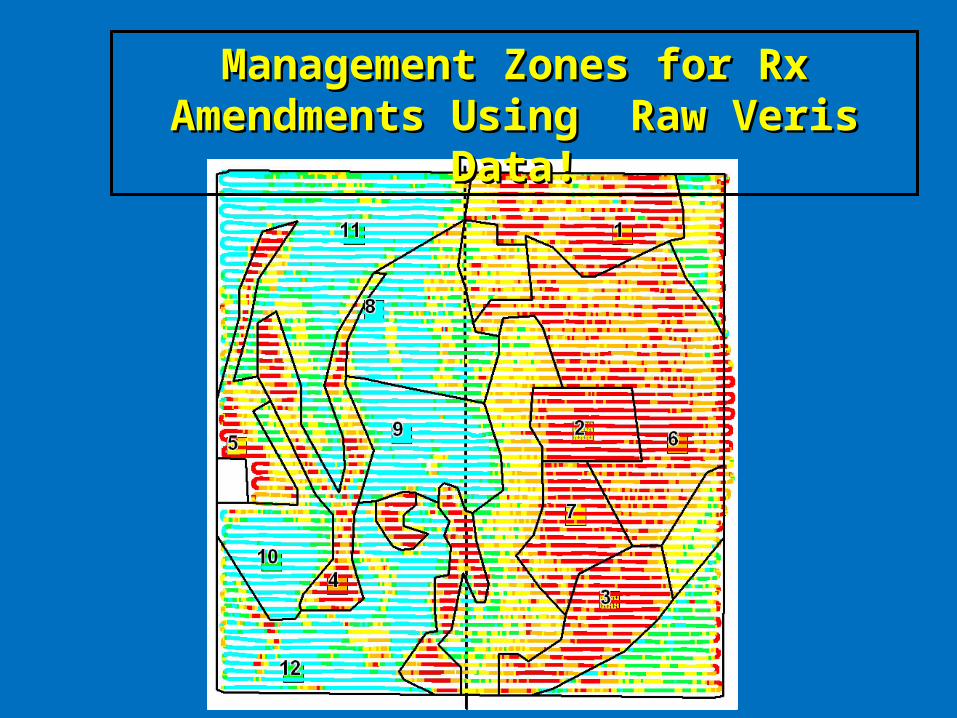
Management Zones for Rx Amendments Management Zones for Rx Amendments Using Raw Veris Data!Using Raw Veris Data!

Soil Textures/Planting FeaturesSoil Textures/Planting Features
Row Direction
Tree Spacing
Air/Water Drainage
Soil Prep
Harvest/Maturity
Var./Rootstock
On Tree Storage
Scheduling
Pest Mgmt.
Plants/Soils Water
Zones/Valving
Dual Line/Manifold
Water ½ Rows
Yield/Quality
Shady or Sunny
Moisture Sensors
Thermometers
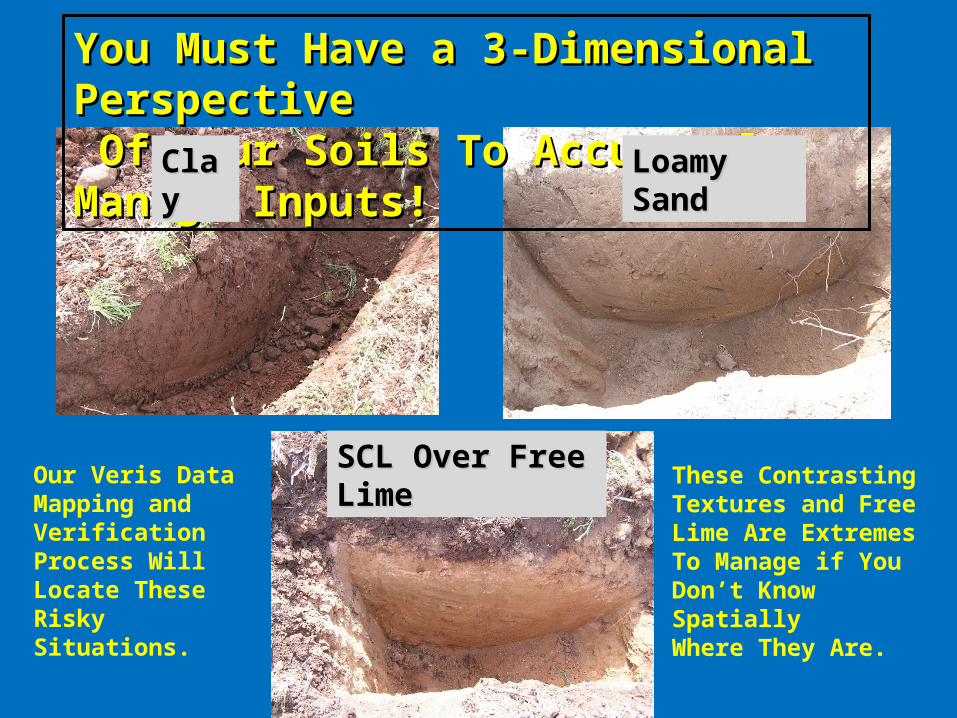
You Must Have a 3-Dimensional Perspective You Must Have a 3-Dimensional Perspective Of Your Soils To Accurately Manage Inputs!Of Your Soils To Accurately Manage Inputs!
These ContrastingTextures and Free Lime Are Extremes To Manage if You Don’t Know SpatiallyWhere They Are.
ClayClay Loamy SandLoamy Sand
SCL Over Free LimeSCL Over Free LimeOur Veris Data Mapping and VerificationProcess Will Locate TheseRisky Situations.

How Soil Textures Impact Citrus!How Soil Textures Impact Citrus!
Note:Dry Down forRedevelopment
SL/LSL/L SCLSCLCL
LSLSL

Google Earth Image Under EC 0-3’ MapGoogle Earth Image Under EC 0-3’ Map
MissingTrees with Red (High)EC 0-3’
100+ Yr Old Wash. Navels
Why SOW Doesn’t Work! Gone from Furrow Flood to Micro Brdcast Flood ofTotal Root Area.

Total Integration of Field Features, Processes, Total Integration of Field Features, Processes, and Systems Included in Blueprint!and Systems Included in Blueprint!
InputsInputs
Soil
Output/Yld
CropWaterWater
Pest MgmtPest Mgmt

What Does A Blueprint Do For You?What Does A Blueprint Do For You?
• Provides New Knowledge Gained From Technologies!
• Reveals Opportunities for Major Improvements in Crop Production and Profitability!
• Validate Old Paradigms.
• Focuses Decision Making Based On Soil Textures.

Thank You For Your Time
Break Through Your KNOWLEDGE BARRIER:
Get To Know Your Soils
For More Information: Jim Yager
Cell Phone: 559-259-4532
What Would a Blueprint Look Like?What Would a Blueprint Look Like?
1. Have Current State-of-the-Art Soil Data!2. Features Are Designed Around Soil Textures.3. Straight Forward, No Algorithms, and Hidden Mysterious Statistics or Rx’s.4. It Visually Relates to Features You See.5. Has Choices or Alternatives to Consider!6. Comprehensive!