Embed Size (px)
Citation preview
Soil
Ind
icat
ors
of Q
uee
nsla
nd W
etla
nds Carbrook Wetlands
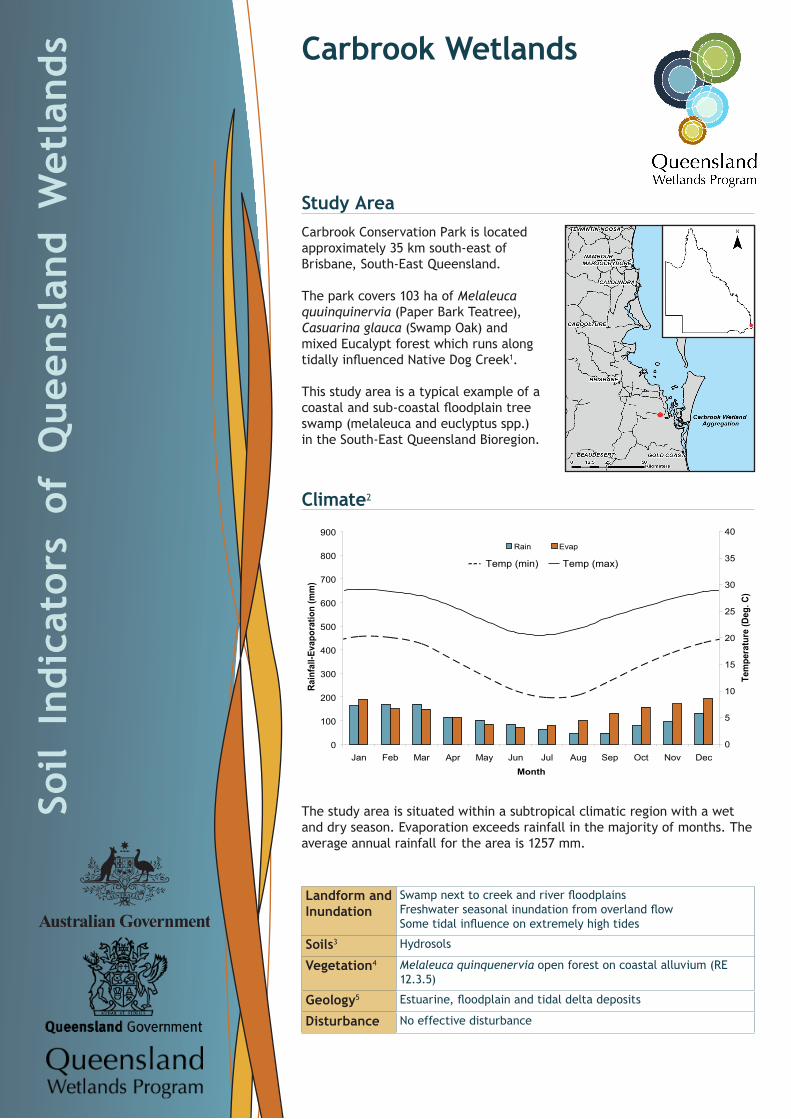
Study Area Carbrook Conservation Park is located approximately 35 km south-east of Brisbane, South-East Queensland. The park covers 103 ha of Melaleuca quuinquinervia (Paper Bark Teatree), Casuarina glauca (Swamp Oak) and mixed Eucalypt forest which runs along tidally influenced Native Dog Creek1.
This study area is a typical example of a coastal and sub-coastal floodplain tree swamp (melaleuca and euclyptus spp.) in the South-East Queensland Bioregion.
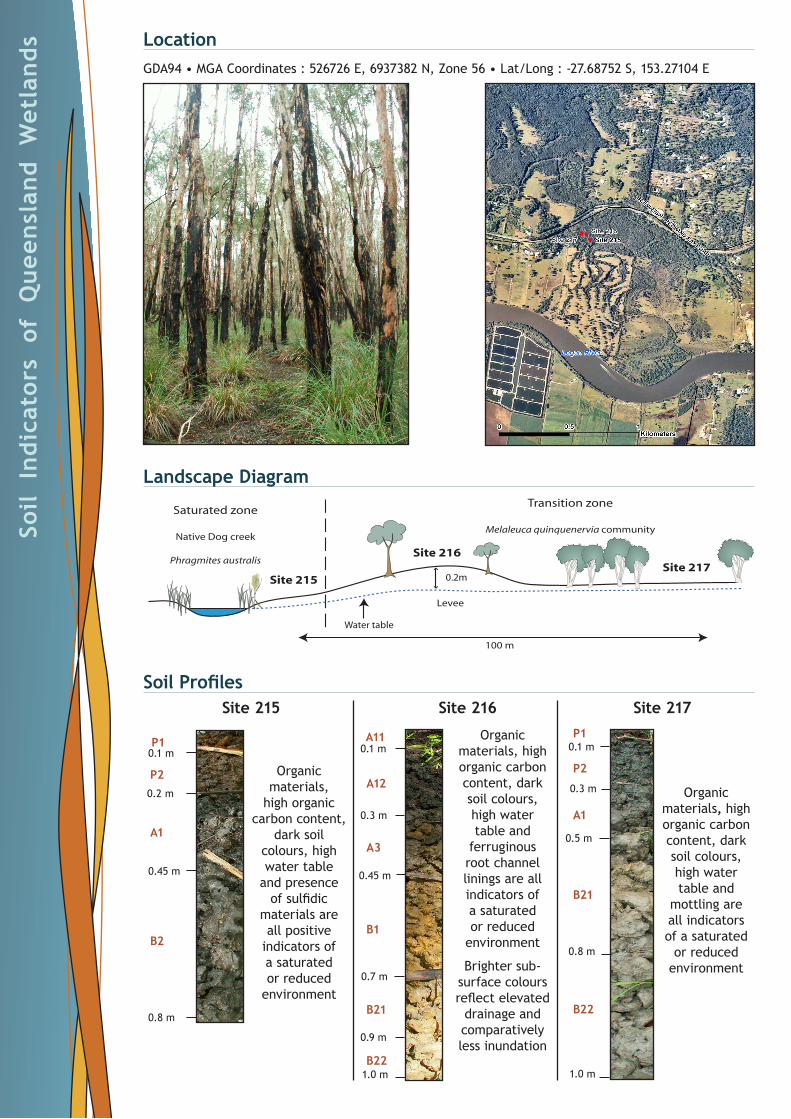
Climate2
0
100
200
300
400
500
600
700
800
900
Jan Feb Mar Apr May Jun Jul Aug Sep Oct Nov DecMonth
Rain
fall-
Evap
orat
ion
(mm
)
0
5
10
15
20
25
30
35
40
Tem
pera
ture
(Deg
.C)
Rain Evap
Temp (min) Temp (max)
The study area is situated within a subtropical climatic region with a wet and dry season. Evaporation exceeds rainfall in the majority of months. The average annual rainfall for the area is 1257 mm.
Landform and Inundation
Swamp next to creek and river floodplainsFreshwater seasonal inundation from overland flow Some tidal influence on extremely high tides
Soils3 Hydrosols
Vegetation4 Melaleuca quinquenervia open forest on coastal alluvium (RE 12.3.5)
Geology5 Estuarine, floodplain and tidal delta deposits
Disturbance No effective disturbance
Soil
In
dic
ator
s of
Q
ue
ensl
and
W
etla
nd
s Location GDA94 • MGA Coordinates : 526726 E, 6937382 N, Zone 56 • Lat/Long : -27.68752 S, 153.27104 E
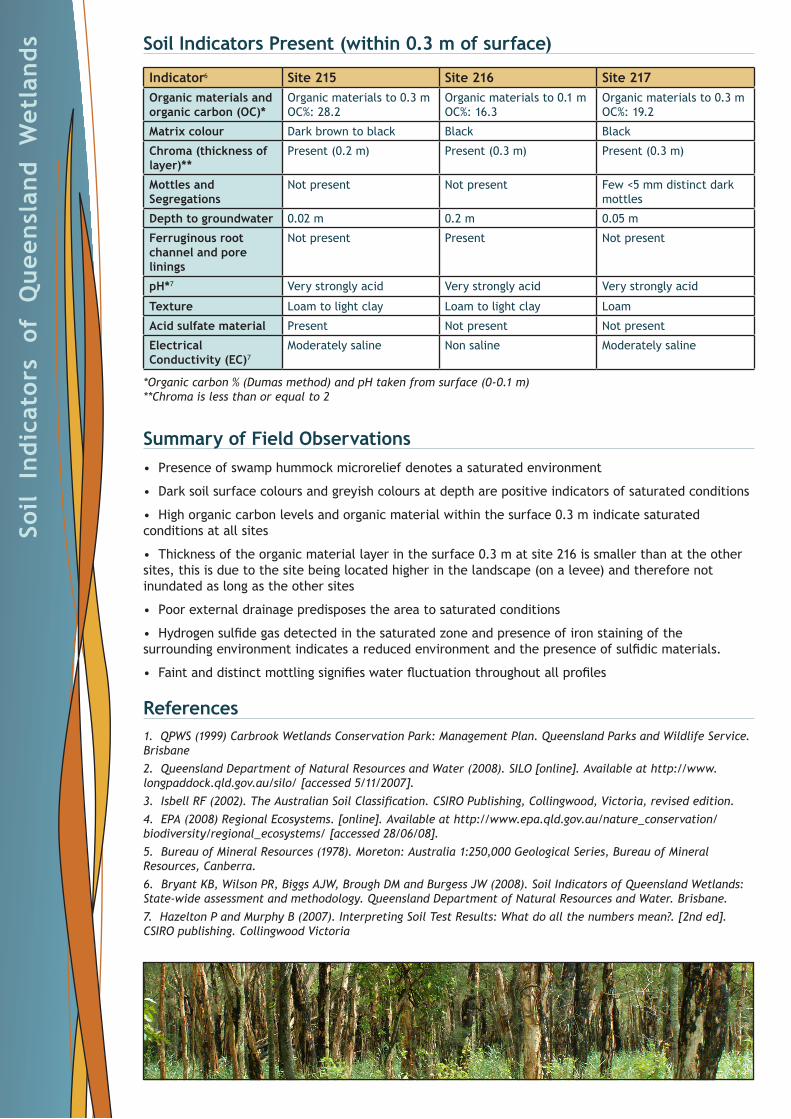
Landscape Diagram
Saturated zone
Native Dog creek
Phragmites australis
Transition zone
Melaleuca quinquenervia community
Site 215Site 217
Levee
Water table
0.2m
Site 216
100 m
Soil ProfilesSite 217Site 216Site 215
0.1 mP1
0.2 m
0.45 m
0.8 m
A1
B2
P2
0.1 mA11
0.3 m
0.45 m
0.7 m
0.9 m
A12
A3
B1
1.0 m
B21
B22
0.1 mP1
0.3 m
0.5 m
1.0 m
0.8 m
P2
A1
B21
B22
Organic materials,
high organic carbon content,
dark soil colours, high water table
and presence of sulfidic
materials are all positive
indicators of a saturated or reduced
environment
Organic materials, high organic carbon content, dark soil colours, high water table and
ferruginous root channel linings are all indicators of a saturated or reduced
environment
Brighter sub-surface colours reflect elevated
drainage and comparatively less inundation
Organic materials, high organic carbon content, dark soil colours, high water table and
mottling are all indicators of a saturated
or reduced environment
Soil
In
dic
ator
s of
Q
ue
ensl
and
W
etla
nd
s Soil Indicators Present (within 0.3 m of surface)
Indicator6 Site 215 Site 216 Site 217 Organic materials and organic carbon (OC)*
Organic materials to 0.3 m OC%: 28.2
Organic materials to 0.1 m OC%: 16.3
Organic materials to 0.3 mOC%: 19.2
Matrix colour Dark brown to black Black Black
Chroma (thickness of layer)**
Present (0.2 m) Present (0.3 m) Present (0.3 m)
Mottles and Segregations
Not present Not present Few <5 mm distinct dark mottles
Depth to groundwater 0.02 m 0.2 m 0.05 m
Ferruginous root channel and pore linings
Not present Present Not present
pH*7 Very strongly acid Very strongly acid Very strongly acid
Texture Loam to light clay Loam to light clay Loam
Acid sulfate material Present Not present Not present
Electrical Conductivity (EC)7
Moderately saline Non saline Moderately saline
*Organic carbon % (Dumas method) and pH taken from surface (0-0.1 m) **Chroma is less than or equal to 2
Summary of Field ObservationsPresence of swamp hummock microrelief denotes a saturated environment
Dark soil surface colours and greyish colours at depth are positive indicators of saturated conditions
High organic carbon levels and organic material within the surface 0.3 m indicate saturated conditions at all sites
Thickness of the organic material layer in the surface 0.3 m at site 216 is smaller than at the other sites, this is due to the site being located higher in the landscape (on a levee) and therefore not inundated as long as the other sites
Poor external drainage predisposes the area to saturated conditions
Hydrogen sulfide gas detected in the saturated zone and presence of iron staining of the surrounding environment indicates a reduced environment and the presence of sulfidic materials.
Faint and distinct mottling signifies water fluctuation throughout all profiles
References1. QPWS (1999) Carbrook Wetlands Conservation Park: Management Plan. Queensland Parks and Wildlife Service. Brisbane
2. Queensland Department of Natural Resources and Water (2008). SILO [online]. Available at http://www.longpaddock.qld.gov.au/silo/ [accessed 5/11/2007].
3. Isbell RF (2002). The Australian Soil Classification. CSIRO Publishing, Collingwood, Victoria, revised edition.
4. EPA (2008) Regional Ecosystems. [online]. Available at http://www.epa.qld.gov.au/nature_conservation/biodiversity/regional_ecosystems/ [accessed 28/06/08].
5. Bureau of Mineral Resources (1978). Moreton: Australia 1:250,000 Geological Series, Bureau of Mineral Resources, Canberra.
6. Bryant KB, Wilson PR, Biggs AJW, Brough DM and Burgess JW (2008). Soil Indicators of Queensland Wetlands: State-wide assessment and methodology. Queensland Department of Natural Resources and Water. Brisbane.
7. Hazelton P and Murphy B (2007). Interpreting Soil Test Results: What do all the numbers mean?. [2nd ed]. CSIRO publishing. Collingwood Victoria
•
•
•
•
•
•
•
Soil Indicators of Queensland WetlandsSo
il M
orph
olog
y
Site
215
Clas
sifi
cati
on
Aust
ralia
n So
il Cl
assi
fica
tion
Su
lfur
ic E
xtra
tida
l Hyd
roso
lLa
ndfo
rm E
lem
ent
Swam
pM
orph
olog
ical
Typ
e Fl
at
Hor
izon
Dep
th (
m)
Boun
dary
Text
ure
Colo
urM
ottl
esCo
arse
Fr
agm
ents
Stru
ctur
eSe
greg
atio
nsCo
nsis
tenc
e
P10
to .1
-fib
ric
loam
brow
nish
bla
ck
(10Y
R32)
no
neno
nem
oder
ate
angu
lar
bloc
kyno
neve
ry w
eak
wet
P2.1
to
.2-
sapr
ic lo
amda
rk b
row
n (1
0YR3
3)
none
none
mod
erat
e an
gula
r bl
ocky
none
very
wea
k w
et
A1.2
to
.45
-sa
pric
ligh
t cl
aybl
ack
(5Y2
1)
none
none
mod
erat
e an
gula
r bl
ocky
none
wea
k w
et
B2.4
5 to
.8
-m
ediu
m
clay
brow
nish
bla
ck
(2.5
Y31)
ve
ry f
ew (
<2%)
fin
e (<
5 m
m)
fain
t ye
llow
mot
tles
none
mas
sive
none
firm
wet
Site
216
Clas
sifi
cati
on
Aust
ralia
n So
il Cl
assi
fica
tion
Su
lfur
ic E
xtra
tida
l Hyd
roso
lLa
ndfo
rm E
lem
ent
Leve
eM
orph
olog
ical
Typ
e Fl
at
Hor
izon
Dep
th (
m)
Boun
dary
Text
ure
Colo
urM
ottl
esCo
arse
Fr
agm
ents
Stru
ctur
eSe
greg
atio
nsCo
nsis
tenc
e
P20
to .1
cle
ar t
osa
pric
loam
blac
k (5
Y21)
no
neno
nem
oder
ate
gran
ular
very
few
(<2
%)
fine
(<2
mm
) fe
rrug
inou
s ro
ot
linin
gs
wea
k m
oist
A1.1
to
.3 g
radu
al t
olig
ht c
lay
blac
k (5
Y21)
no
neno
nem
oder
ate
suba
ngul
ar b
lock
yno
new
eak
moi
st
A3
.3 t
o .4
5 g
radu
al t
ohe
avy
light
cl
ayol
ive
blac
k (5
Y22)
few
(2-
10%)
fine
(<
5 m
m)
fain
t ye
llow
mot
tles
none
mod
erat
e su
bang
ular
blo
cky
none
firm
wet
B1.4
5 to
.7
gra
dual
to
light
m
ediu
m
clay
yello
wis
h gr
ey
(2.5
Y41)
co
mm
on (
10-2
0%)
med
ium
(5
-15
mm
) pr
omin
ent
yello
w
mot
tles
none
mas
sive
none
firm
wet
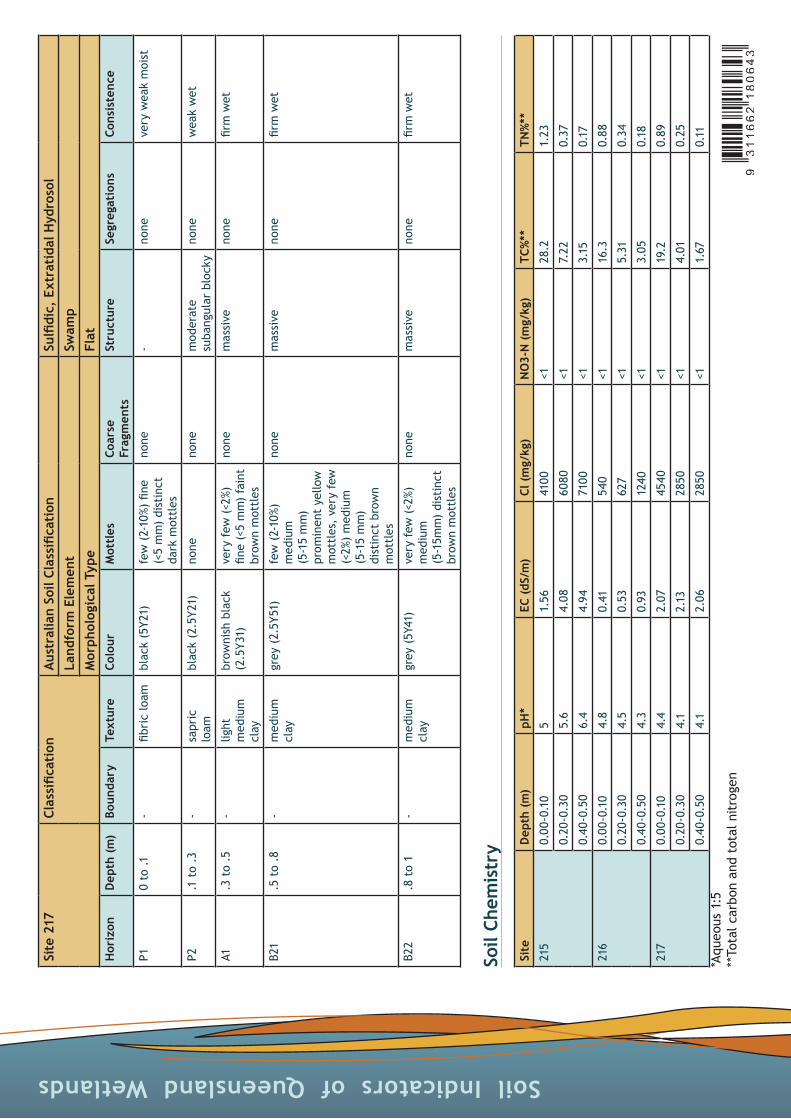
Soil Indicators of Queensland WetlandsSi
te 2
17Cl
assi
fica
tion
Au
stra
lian
Soil
Clas
sifi
cati
on
Sulfi
dic,
Ext
rati
dal H
ydro
sol
Land
form
Ele
men
t Sw
amp
Mor
phol
ogic
al T
ype
Flat
H
oriz
onD
epth
(m
)Bo
unda
ryTe
xtur
eCo
lour
Mot
tles
Coar
se
Frag
men
tsSt
ruct
ure
Segr
egat
ions
Cons
iste
nce
P10
to .1
-fib
ric
loam
blac
k (5
Y21)
fe
w (
2-10
%) fi
ne
(<5
mm
) di
stin
ct
dark
mot
tles
none
-no
neve
ry w
eak
moi
st
P2.1
to
.3-
sapr
ic
loam
blac
k (2
.5Y2
1)
none
none
mod
erat
e su
bang
ular
blo
cky
none
wea
k w
et
A1.3
to
.5-
light
m
ediu
m
clay
brow
nish
bla
ck
(2.5
Y31)
very
few
(<2
%)
fine
(<5
mm
) fa
int
brow
n m
ottl
es
none
mas
sive
none
firm
wet
B21
.5 t
o .8
-m
ediu
m
clay
grey
(2.
5Y51
) fe
w (
2-10
%)
med
ium
(5
-15
mm
) pr
omin
ent
yello
w
mot
tles
, ve
ry f
ew
(<2%
) m
ediu
m
(5-1
5 m
m)
dist
inct
bro
wn
mot
tles
none
mas
sive
none
firm
wet
B22
.8 t
o 1
-m
ediu
m
clay
grey
(5Y
41)
very
few
(<2
%)
med
ium
(5
-15m
m)
dist
inct
br
own
mot
tles
none
mas
sive
none
firm
wet
Soil
Chem
istr
y
Site
Dep
th (
m)
pH*
EC (
dS/m
)Cl
(m
g/kg
)N
O3-
N (
mg/
kg)
TC%
**TN
%**
215
0.00
-0.1
05
1.56
4100
<128
.21.
23
0.20
-0.3
05.
64.
0860
80<1
7.22
0.37
0.40
-0.5
06.
44.
9471
00<1
3.15
0.17
216
0.00
-0.1
04.
80.
4154
0<1
16.3
0.88
0.20
-0.3
04.
50.
5362
7<1
5.31
0.34
0.40
-0.5
04.
30.
9312
40<1
3.05
0.18
217
0.00
-0.1
04.
42.
0745
40<1
19.2
0.89
0.20
-0.3
04.
12.
1328
50<1
4.01
0.25
0.40
-0.5
04.
12.
0628
50<1
1.67
0.11
*Aqu
eous
1:5
**To
tal c
arbo
n an
d to
tal n
itro
gen
93
11
66
21
80
64
3