Embed Size (px)
Citation preview
Biogeosciences, 12, 5831–5852, 2015
www.biogeosciences.net/12/5831/2015/
doi:10.5194/bg-12-5831-2015
© Author(s) 2015. CC Attribution 3.0 License.
Soil fertility controls soil–atmosphere carbon dioxide and methane
fluxes in a tropical landscape converted from lowland forest to
rubber and oil palm plantations
E. Hassler1, M. D. Corre1, A. Tjoa2, M. Damris3, S. R. Utami4, and E. Veldkamp1
1Soil Science of Tropical and Subtropical Ecosystems, Büsgen Institute, Georg August University of Göttingen,
Büsgenweg 2, 37077 Göttingen, Germany2Faculty of Agriculture, Tadulako University, Jl. Soekarno Hatta, km 09 Tondo, Palu 94118, Indonesia3Department of Chemical Engineering, Faculty of Engineering, Jambi University, Jl. Tribrata, Km 11,
Pondok Meja, Muaro Jambi, Jambi, Indonesia4Department of Soil Science, Faculty of Agriculture, Brawijaya University, Jl. Veteran 1, Malang 65145, Indonesia
Correspondence to: E. Veldkamp ([email protected])
Received: 6 May 2015 – Published in Biogeosciences Discuss.: 19 June 2015
Revised: 14 September 2015 – Accepted: 22 September 2015 – Published: 13 October 2015
Abstract. Expansion of palm oil and rubber production, for
which global demand is increasing, causes rapid deforesta-
tion in Sumatra, Indonesia, and is expected to continue in the
next decades. Our study aimed to (1) quantify changes in soil
CO2 and CH4 fluxes with land-use change and (2) determine
their controlling factors. In Jambi Province, Sumatra, we se-
lected two landscapes on heavily weathered soils that differ
mainly in texture: loam and clay Acrisol soils. In each land-
scape, we investigated the reference land-use types (forest
and secondary forest with regenerating rubber) and the con-
verted land-use types (rubber, 7–17 years old, and oil palm
plantations, 9–16 years old). We measured soil CO2 and CH4
fluxes monthly from December 2012 to December 2013. An-
nual soil CO2 fluxes from the reference land-use types were
correlated with soil fertility: low extractable phosphorus (P)
coincided with high annual CO2 fluxes from the loam Acrisol
soil that had lower fertility than the clay Acrisol soil (P <
0.05). Soil CO2 fluxes from the oil palm (107.2 to 115.7 mg
C m−2 h−1) decreased compared to the other land-use types
(between 178.7 and 195.9 mg C m−2 h−1; P < 0.01). Across
land-use types, annual CO2 fluxes were positively correlated
with soil organic carbon (C) and negatively correlated with15N signatures, extractable P and base saturation. This sug-
gests that the reduced soil CO2 fluxes from oil palm were
the result of strongly decomposed soil organic matter and
reduced soil C stocks due to reduced litter input as well as
being due to a possible reduction in C allocation to roots
due to improved soil fertility from liming and P fertilization
in these plantations. Soil CH4 uptake in the reference land-
use types was negatively correlated with net nitrogen (N)
mineralization and soil mineral N, suggesting N limitation
of CH4 uptake, and positively correlated with exchangeable
aluminum (Al), indicating a decrease in methanotrophic ac-
tivity at high Al saturation. Reduction in soil CH4 uptake in
the converted land-use types (ranging from−3.0 to−14.9 µg
C m−2 h−1) compared to the reference land-use types (rang-
ing from −20.8 to −40.3 µg C m−2 h−1; P < 0.01) was due
to a decrease in soil N availability in the converted land-use
types. Our study shows for the first time that differences in
soil fertility control the soil–atmosphere exchange of CO2
and CH4 in a tropical landscape, a mechanism that we were
able to detect by conducting this study on the landscape
scale.
1 Introduction
Oil palm (Elaeis guineensis) and rubber (Hevea brasiliensis)
are two of the fastest-expanding tree cash crops in the tropics
(Clay, 2013). Global oil palm production has quintupled from
1990 to 2013 and is currently grown on an estimated area of
17 million hectare (Mha) (Food and Agricultural Organiza-
Published by Copernicus Publications on behalf of the European Geosciences Union.

5832 E. Hassler et al.: Soil fertility controls soil–atmosphere carbon dioxide
tion, 2014). Indonesia contributes nearly half of the global
palm oil production (Food and Agricultural Organization,
2014) and is planning to double its production in the coming
decade (Carlson et al., 2013). Similarly, rubber is grown on
around 10 Mha globally, and Indonesia is the second largest
rubber producer (Food and Agricultural Organization, 2014).
Most Indonesian oil palm and rubber production is located in
Sumatra (Indonesian Ministry of Agriculture, 2014), where
the conversion of lowland rainforest to plantations has been
widespread (Laumonier et al., 2010). It has been estimated
that plantation establishment has caused a loss of 7.5 Mha
of Sumatran natural forest in the last 2 decades (1990–2010)
(Margono et al., 2012), and future expansion will probably
be at the expense of large areas of tropical forest, unless a
properly planned and spatially explicit development strategy
is implemented (Koh and Ghazoul, 2010).
Although the majority of remaining lowland tropical
forests are located on nutrient-poor, heavily weathered soils,
these ecosystems are among the most productive worldwide
and contain globally significant above- and belowground car-
bon stocks. The high ecosystem productivity is possible de-
spite the nutrient-poor soils because of efficient cycling of
rock-derived nutrients (phosphorus (P) and base cations) be-
tween vegetation and soil and also high soil nitrogen (N)
availability caused by biological N fixation (Hedin et al.,
2009). Conversion of tropical forest to agricultural land-use
systems does not only decrease biodiversity and contribute
to climate change (Danielsen et al., 2009) but also alters
soil fertility and soil physical properties in the newly es-
tablished land-use systems (Dechert et al., 2004; Klinge et
al., 2004). Burning of slashed vegetation is typically part
of forest conversion, releasing large amounts of nutrients
previously bound in the vegetation. A considerable part of
these nutrients ends up in the soil but is susceptible to losses
(through leaching and gaseous emission), which are espe-
cially high in the earlier years of crop establishment and
decrease with time (Klinge et al., 2004). Furthermore, for-
est conversion is often associated with increases in soil bulk
density. These dynamic changes in soil fertility and soil bulk
density following forest conversion do not only affect agri-
cultural production but also the soil–atmosphere exchange of
trace gases like carbon dioxide (CO2) and methane (CH4)
since their production, consumption and exchange are di-
rectly related to soil fertility and soil bulk density (Keller et
al., 1993; Veldkamp et al., 2008).
Globally, soils are the largest natural source of CO2 (IPCC,
2007), which is released during respiration processes of
microbial communities and roots (Raich and Schlesinger,
1992). While the important proximal controllers of soil CO2
fluxes are soil temperature and moisture, it has been demon-
strated that other distal regulators such as vegetation type and
soil physical and biochemical properties (e.g., bulk density,
texture, pH, carbon stocks) also affect soil CO2 fluxes (Raich
and Schlesinger, 1992). Soils also play a dominant role in
the production and consumption of CH4, a greenhouse gas
with a global warming potential 23 times that of CO2 over
a 100-year time period (IPCC, 2007). In soils, CH4 can be
produced during anaerobic decomposition by methanogenic
archaea, while CH4 can also be consumed by methanotrophic
bacteria which are able to utilize CH4 as an energy source.
Whether net consumption or net emission of CH4 occurs at
the soil surface depends on the balance between production
and consumption in the soil. For soil CH4 fluxes, the proxi-
mal controllers are soil moisture, gas diffusivity and temper-
ature, while other distal regulators include microbial activity,
N availability and aluminum toxicity (Verchot et al., 2000;
Tamai et al., 2003; Bodelier and Laanbroek, 2004; Veldkamp
et al., 2013).
In tropical lowland forest landscapes with heavily weath-
ered soils, much of the spatial variability in trace gas fluxes
appears to be related to soil texture (Sotta et al., 2006). In the
Brazilian Amazon, lowland forests on Acrisol and Ferralsol
soils display high soil CO2 emissions with large variations
among sites that relate to soil texture: soils with sandy loam
to sandy clay loam texture had 21–36 % higher CO2 emis-
sions than soils with clay texture (Keller et al., 2005; Sotta et
al., 2006). Moreover, although well-drained soils in tropical
lowland forests generally act as a sink for CH4 (Keller and
Reiners, 1994; Verchot et al., 2000; Veldkamp et al., 2013),
their differences in CH4 uptake are explicable by their dif-
ferences in soil texture. In a review of 16 tropical lowland
forests, the only factor correlating annual CH4 fluxes with
site characteristics was a significant positive correlation with
clay contents, indicating that the higher the clay content the
lower the CH4 uptake (Veldkamp et al., 2013).
Since much of the original forest in our study area have
been converted to oil palm and rubber plantations, the man-
agement practices in these land-use types added important
factors that influence soil CO2 and CH4 fluxes from these
converted landscapes. Earlier studies have shown that forest
conversion to agricultural land-use types in the tropics lead
to considerable changes in soil CO2 fluxes, which were re-
lated to changes in belowground C allocation (Davidson et
al., 2000; Salimon et al., 2004), carbon quality (Werner et
al., 2006), living fine-root biomass and litter input (Ishizuka
et al., 2002; Sheng et al., 2010). Conversion of tropical for-
est to agricultural land use causes a reduction in soil CH4
uptake or even turns the soil into a source of CH4. Often
this trend is explained by soil compaction, which leads to re-
duced gas diffusivity and accordingly limits aerobic CH4 ox-
idation while enhancing anaerobic CH4 production (Keller
et al., 1993; Veldkamp et al., 2008). Changes in N availabil-
ity may also play a role since CH4 uptake may be N limited
(Bodelier and Laanbroek, 2004; Veldkamp et al., 2013) and
high concentrations of ammonium (NH+4 , e.g., from fertil-
ization) can inhibit CH4 oxidation (Veldkamp et al., 2001;
Werner et al., 2006). Finally, termites are known to produce
CH4, and their presence may also affect the balance between
production and consumption of CH4 (Seiler et al., 1984).
Biogeosciences, 12, 5831–5852, 2015 www.biogeosciences.net/12/5831/2015/

E. Hassler et al.: Soil fertility controls soil–atmosphere carbon dioxide 5833
Although Sumatra, Indonesia, represents a hot spot of
land-use change, especially for the establishment of rubber
and oil palm plantations, how this affects soil CO2 and CH4
fluxes remains highly uncertain for the following reasons:
(1) most studies relating land-use change to trace gas emis-
sions have been conducted in South and Central America
(Keller and Reiners, 1994; Davidson et al., 2000; Verchot et
al., 2000; Veldkamp et al., 2001; Salimon et al., 2004) and
only few studies were conducted in southeast Asia (Ishizuka
et al., 2002; Veldkamp et al., 2008); (2) most studies have fo-
cused on forest conversion to traditional land-use types, such
as maize, pastures, slash-and-burn agriculture, cacao and cof-
fee, and less on the rapidly expanding tree cash crops such as
rubber and oil palm; (3) the few studies that reported CO2
and CH4 fluxes from oil palm plantations were conducted
on peat soils (Melling et al., 2005a, b), whereas the studies
conducted on mineral soils, where most of the rubber and oil
palm plantations are located, were either conducted without
spatial replication, covered only short periods of measure-
ments (Ishizuka et al., 2002; Adachi et al., 2005; Werner et
al., 2006) or measured only once (Ishizuka et al., 2005). It is
imperative that better information becomes available on trace
gas fluxes from these economically important and rapidly
expanding rubber and oil palm plantations. Whether palm-
oil-based biofuel does indeed have environmental advantages
compared to fossil fuel depends, among many factors, on the
greenhouse gas balance during oil palm fruit production.
In the present study, our aims were to (1) quantify changes
in soil–atmosphere fluxes of CO2 and CH4 with land-use
change and (2) determine their controlling factors in a
converted lowland landscape in Sumatra, Indonesia. Soil–
atmosphere fluxes of CO2 and CH4 were measured in for-
est and secondary forest with regenerating rubber (hereafter
called jungle rubber, which is a more traditional rubber agro-
forestry system; Gouyon et al., 1993) as reference land-use
types and the converted land-use types of monoculture rub-
ber and oil palm plantations. Our study was designed to cover
these four land-use types in each of the two landscapes on
highly weathered soils that differed mainly in texture: clay
and loam Acrisol soils. We tested the following hypothe-
ses: (1) soil CO2 emissions and CH4 uptake will be higher
in loam than in clay Acrisol soils, and (2) soil CO2 fluxes
and CH4 uptake rates will be higher in the reference land-use
types (forest and jungle rubber) than in the converted land-
use types (rubber and oil palm plantations). Here, we present
the first spatially replicated study with a full year of mea-
surements that investigates soil CO2 and CH4 fluxes from
conversion of forest or jungle rubber to rubber and oil palm
plantations on mineral soils. We also evaluate the effect of
management intensity since we compare rubber plantations
without fertilizer inputs with fertilized oil palm plantations.
Our results will be a critical contribution to trace gas life-
cycle assessment of rubber and palm oil at the production
stage.
2 Material and methods
2.1 Study area and experimental design
The study area is located in the lowlands (35–95 m above
sea level) of Jambi province, Sumatra, Indonesia. In the
past 2 decades, forest cover in Jambi province decreased by
1.14 Mha, which was about 40 % of the forest cover in 1990
(Margono et al., 2012). The climate is humid tropical with a
mean annual air temperature of 26.7± 0.1 ◦C and a mean an-
nual precipitation of 2235± 385 mm (1991–2011; data relat-
ing to Jambi Sultan Thaha Airport from the Indonesian Me-
teorological, Climatological and Geophysical Agency). The
dry season is usually from May to September and the rainy
season occurs from October to April. In 2013, during our
study period, the wet season lasted slightly longer, while a
drier period was detected between mid-June and the end of
October. During this dry period, rainfall was reduced by 35–
57 % compared to the wetter months during which rainfall
was 333–362 mm per month.
We selected two landscapes on heavily weathered soils
that differed mainly in texture: loam Acrisol soil (36± 6 %
sand, 32± 4 % silt and 32± 2 % clay in the top 0.5 m) and
clay Acrisol soil (26± 6 % sand, 29± 3 % silt and 45± 4 %
clay in the top 0.5 m). This textural difference led to differ-
ences in soil fertility: forest sites in the clay Acrisol soil had
a higher base saturation, Bray-extractable P and lower Al sat-
uration compared to those in the loam Acrisol soil (P ≤ 0.01
to 0.04; Appendix Table A1; Allen et al., 2015). Detailed
soil physical and biochemical characteristics from our study
sites were measured by Allen et al. (2015) and are summa-
rized in Table A1. Acrisol soils cover about 50 % of the land
area in Sumatra and about one third of Indonesia (FAO et al.,
2009). The clay Acrisol landscape was located about 160 km
southwest of Jambi City between 01.94◦ S, 102.58◦ E and
02.14◦ S, 102.85◦ E. Forest sites in this landscape were es-
tablished within the Bukit Duabelas National Park (adminis-
tered by the Ministry of Forestry, PHKA). The loam Acrisol
landscape was located about 80 km southwest of Jambi City
between 01.79◦ S, 103.24◦ E and 2.19◦ S, 103.36◦ E. The for-
est sites in this landscape were established within the Hara-
pan Forest Reserve and had been partially logged in the past
(administered by the Restoration Ecosystem Indonesia Hara-
pan, PT REKI).
In each landscape, we studied four land-use types: lowland
forest, jungle rubber, and smallholder monoculture planta-
tions of rubber and oil palm. In Jambi province, the small-
holder rubber and oil palm plantations were established after
clearing and burning either the forest (often partially logged)
or jungle rubber (based on interviews conducted by Euler et
al.; unpublished data). Thus, in our study the lowland forest
and jungle rubber served as the reference land-use types, rep-
resenting the baseline conditions with which we compared
the rubber and oil palm plantations.
www.biogeosciences.net/12/5831/2015/ Biogeosciences, 12, 5831–5852, 2015

5834 E. Hassler et al.: Soil fertility controls soil–atmosphere carbon dioxide
For each of the four land-use types within each landscape,
we selected four replicate plots (50 m× 50 m each with a
minimum distance of 200 m between plots), totalling 32 plots
that were all located on relatively flat, well-drained positions
in the landscape. Additional information on tree species com-
position, tree density, tree height, basal area, and plantation
age of these plots is reported in Table A2. Within each plot,
we established a 10× 10 grid which was used to select four
randomly nested subplots (5 m× 5 m each) that were at least
5 m from the plot’s border. In each subplot, we placed one
permanent chamber base at random to measure soil trace gas
fluxes.
This approach of comparing soil CO2 and CH4 fluxes from
the converted land-use types to that from the reference land-
use types in order to assess the effects of land-cover change
has the implicit assumption that before land-use conversion,
soil characteristics were comparable. We tested this assump-
tion by comparing the land-use-independent soil characteris-
tics, i.e., clay content in 0.50–2.00 m depth, among land-use
types within each landscape. Since there were no significant
differences in clay contents between the reference and con-
verted land-use types at these depths (Table A1; Allen et al.,
2015), we deduced that the sites within each landscape had
previously similar soil characteristics and that differences in
trace gas fluxes can be attributed to the changes in land-use
type and its associated management practices.
Since all the plantations were managed by smallholders,
management practices of rubber and oil palm were diverse.
The following information on management practices was
based on our interviews of the smallholders. In 2013, oil
palm and rubber plantations were weeded once or twice a
year either manually or using herbicide (most commonly 2–
5 L Gramaxone® or Roundup® ha−1 yr−1). Oil palm planta-
tions were fertilized, whereas rubber plantations were not.
Oil palm plantations in the clay Acrisol landscape were fer-
tilized only once during the rainy season, whereas those in
the loam Acrisol landscape had a second fertilizer application
in the dry season. The most commonly used fertilizers were
NPK complete fertilizer (i.e., Phonska, Mahkota), potassium
chloride (KCl) and urea. Plantations fertilized once received
about 300 kg NPK fertilizer ha−1 yr−1 and plantations fertil-
ized twice received about 550 kg NPK fertilizer ha−1 yr−1.
In terms of nutrient elements added, these rates were equiv-
alent to 48–88 kg N ha−1 yr−1, 21–38 kg P ha−1 yr−1 and
40–73 kg K ha−1 yr−1. Additionally, three of the smallhold-
ers applied 157 and 143 kg KCl-K ha−1 yr−1 and two of
the smallholders applied 138 kg urea-N ha−1 yr−1. One of
the smallholders also applied lime in 2013 at about 200 kg
dolomite ha−1 yr−1. Smallholders typically applied the fer-
tilizer around the oil palm tree at about 0.8–1 m distance
from the tree base. Additionally, senescing fronds were reg-
ularly cut and piled on the interrows of an oil palm plan-
tation, typically in the middle of the 9 m distance between
rows of oil palms. Oil palm fruits were harvested every 2
weeks, whereas the latex of the rubber and jungle rubber was
collected weekly.
In addition to the monthly flux measurements conducted
at the smallholder farms described above, we simulated fer-
tilizations and conducted more frequent measurements (6 to
11 times) during 3 to 8 weeks following fertilization as the
monthly sampling may have missed the short-term effect of
fertilization on soil CO2 and CH4 fluxes. We chose three
plots of oil palm plantations in each of the two landscapes,
and in each plot we selected three trees separated by an in-
terrow distance of 9 m (in total, 18 oil palm trees). At 0.8 m
distance from the base of each tree, we applied the fertilizer
manually to the area within 0.2 m around the tree using the
same rate that smallholders applied to these oil palm plan-
tations (i.e., equivalent to 2 kg fertilizer per tree, based on
300 kg NPK fertilizer ha−1 divided by 134–140 trees ha−1;
Table A2). We used the same fertilizer forms that smallhold-
ers applied, i.e., NPK complete fertilizer in the clay Acrisol
landscape and a combination of KCl, ammonium sulfate and
NPK complete fertilizer in the loam Acrisol landscape. One
chamber base was placed at 0.3 m distance from the tree base
(chamber location a); another chamber base, to which fer-
tilizer was applied, was placed at 0.8 m distance from the
tree (chamber location b); and a third chamber was placed
at 4–4.5 m distance from the tree and served as a reference
chamber without direct fertilizer application (chamber loca-
tion c). In the clay Acrisol landscape, measurements in the
three oil palm plots were done from mid-October to mid-
December 2013, mid-February to mid-March 2014, and mid-
February to mid-April 2013. In the loam Acrisol landscape,
measurements were done from the end of October 2013 to
mid-December 2013, mid-January to mid-March 2014, and
mid-March to the start of April 2014. Shorter intervals of
sampling days (Appendix Fig. B1) were conducted right af-
ter the fertilizer application.
2.2 CO2 and CH4 flux measurement
Soil CO2 and CH4 fluxes were measured monthly from De-
cember 2012 to December 2013, using static vented cham-
bers. We are aware that the use of static vented chambers
for CO2 and CH4 flux measurements could have possible
sources of error due to changes in diffusion gradients dur-
ing chamber closure. We have however adapted the design
of our chambers and the flux calculation to minimize, if not
avoid, these possible errors (see below). A clear advantage of
the static vented chamber method compared to other meth-
ods is that it remains the only operational method that can be
used to measure trace gas fluxes at a large number of plots
(in our case 32) spread over a large area with regular mea-
surements within a year. Furthermore, it also yields informa-
tion on short-distance spatial variability of trace gas fluxes,
which cannot be quantified by more integrative tower-based
methods. Our chamber bases were made of polyvinyl chlo-
ride (0.05 m2 area) and inserted ∼ 0.03 m into the soil. We
Biogeosciences, 12, 5831–5852, 2015 www.biogeosciences.net/12/5831/2015/

E. Hassler et al.: Soil fertility controls soil–atmosphere carbon dioxide 5835
placed a permanent chamber base at random in each of the
four subplots per replicate plot 1 month before the first mea-
surement started. Since the area occupied by piled fronds
or applied with fertilizer in oil palm plantations was rela-
tively small, none of these randomly placed chamber bases
(range of distance to the tree base was 1.8–5 m) happened
to be located in such an area. During sampling, the cham-
ber bases were covered with polyethylene hoods (0.27 m to-
tal chamber height and 12 L total volume) equipped with
a Luer-lock sampling port and a vent for pressure equilib-
rium. Four gas samples (30 mL each) were removed at 1, 11,
21 and 31 min after chamber closure using a plastic syringe
connected to the Luer-lock port. Immediately after sampling,
gas samples were stored with overpressure in pre-evacuated
12 mL Labco Exetainers® (Labco Limited, Lampeter, UK)
with rubber septa that were only used once. Our group has
tested these exetainers for an extended period of sample stor-
age (e.g., up to 6 months) and air transport by storing and
transporting standard gases of known concentrations in over-
pressure, and these exetainers were proven to be leak proof.
Gas samples in exetainers were transported to Germany by
air every 3–4 months and were analyzed upon arrival us-
ing a gas chromatograph (GC 6000 Vega Series 2, Carlo
Erba Instruments, Milan, Italy, with an ASPEC autosam-
pler, Gilson SAS, Villiers, Le Bel, France), equipped with
a flame ionization detector and an electron capture detector.
Three standard gases were used for calibration with concen-
trations from 350 to 5000 ppm for CO2 and 1000 to 5000 ppb
for CH4 (Deuste Steininger GmbH, Mühlhausen, Germany).
The software Probe66 version 1.3 (Messwert GmbH, Göttin-
gen, Germany) was used to determine CH4 and CO2 sam-
ple concentrations by comparing integrated peak areas with
those of the standard gases. Fluxes were calculated from the
concentration change over the duration of chamber closure
and adjusted with actual air temperature and pressure mea-
sured at the time of sampling. The linearity of increase in
CO2 concentrations with the duration of chamber closure
(R2≥ 0.98) was checked for each chamber measurement,
and in a few cases where concentration curved at the last
sampling time, we excluded the last data point and calcu-
lated the fluxes based on the linear increase in concentra-
tions during the first three samplings. The majority of the
measurements showed a linear change in CH4 concentrations
with the duration of chamber closure. There were a few mea-
surements when changes in CH4 concentrations with time of
chamber closure were small, mostly when net CH4 uptake
was low; in such cases, the calculated CH4 flux using lin-
ear regression was not significantly different from 0. These
fluxes were, however, retained in the statistical analyses to
avoid bias by excluding low CH4 fluxes or by assuming that
these fluxes were 0. Assuming constant flux rates per day,
annual soil CO2 and CH4 fluxes from the monthly sampling
and total fluxes during a fertilization event (see below) were
calculated by adopting the trapezoidal rule on time intervals
between measured flux rates, similar to the method we em-
ployed in our earlier studies (e.g., Koehler et al., 2009; Veld-
kamp et al., 2013)
2.3 Auxiliary measurements
Soil temperature, moisture and mineral N content were mea-
sured with each trace gas measurement. Soil temperature
was determined in the top 0.05 m depth using a GMH 1170
digital thermometer (Greisinger electronic GmbH, Regen-
stauf, Germany). Soil samples for mineral N content were
also taken from the top 0.05 m at approximately 1 m dis-
tance from each chamber with four soil samples per plot.
These four soil samples were pooled to represent each repli-
cate plot on each day of measurement, and roots, leaves and
twigs were manually removed. For the fertilization experi-
ment, soil samples taken near each chamber location (a, b
and c) were processed separately. Since even short storage of
disturbed soil samples can affect mineral N concentrations
(Arnold et al., 2008), extraction was done in the field im-
mediately following soil sampling. A soil sample was added
to a prepared 250 mL plastic bottle containing 150 mL of
0.5 mol L−1 K2SO4 (approximately 1 : 3 ratio of fresh soil to
extractant volume) and transported to the field station. At the
field station, samples were shaken for 1 h, filtered through
prewashed (with 0.5 mol L−1 K2SO4) filter papers (What-
man, GE Healthcare Life Sciences, 4 µm nominal pore size),
and the filtrate was immediately stored in a freezer. The re-
maining field-moist soil samples were stored in plastic bags
and gravimetric moisture content was determined at the field
station, for which 50–100 g of fresh soil was dried at 105 ◦C
for at least 1 day. The gravimetric moisture content was used
to calculate the dry mass of the soil extracted for mineral N.
Frozen extracts were transported by air to Germany to en-
sure that they stayed frozen throughout the transport until
analysis. At our laboratory at the University of Göttingen,
Germany, NH+4 and NO−3 concentrations in the extracts were
analyzed using continuous flow injection colorimetry (SEAL
Analytical AA3, SEAL Analytical GmbH, Norderstedt, Ger-
many). NH+4 was determined by salicylate and dicloroisocya-
nuric acid reaction (Autoanalyzer Method G-102-93), and
NO−3 was determined by the cadmium reduction method with
an NH4Cl buffer (Autoanalyzer Method G-254-02). Soil wa-
ter content was expressed as water-filled pore space (WFPS),
calculated using a particle density of 2.65 g cm−3 for min-
eral soil and the measured bulk densities at our study sites
(Table A1).
2.4 Statistical analysis
All statistical analyses of the monthly measurements of soil
CO2 and CH4 fluxes were conducted using the means of
the four chambers (or subplots) that represent each repli-
cate plot on a given sampling day. Data were checked for
normal distribution (using Shapiro–Wilk tests), and if neces-
sary, a logarithmic (for CO2, CH4, and mineral N) or square
www.biogeosciences.net/12/5831/2015/ Biogeosciences, 12, 5831–5852, 2015

5836 E. Hassler et al.: Soil fertility controls soil–atmosphere carbon dioxide
root (for WFPS) transformation was used. For our first ob-
jective, we conducted comparisons of the reference land-use
types between the two landscapes in order to test the first hy-
pothesis. Then we carried out comparisons among land-use
types within each landscape to test our second hypotheses.
Linear mixed-effect models (LMEs) were applied (Crawley,
2009) with either landscape (i.e., comparing landscapes for
each reference land use) or land use (i.e., comparing land-use
types within each landscape) as the fixed effect and replicate
plots and sampling days as the random effects. For the fer-
tilization experiment, we tested differences in soil CO2 and
CH4 fluxes between chamber locations within each oil palm
plantation plot, using LMEs with chamber location as the
fixed effect and palm trees and sampling days as the random
effects. We extended the LME model to include either (1) a
variance function that allows different variances of the fixed
effect and/or (2) a first-order temporal autoregressive pro-
cess, which assumes that correlation between measurements
decreases with increasing time difference if this improved the
relative goodness of the model fit based on the Akaike in-
formation criterion. Fixed effect was considered significant
based on the analysis of variance at P ≤ 0.05, and differ-
ences between landscapes or land-use types (or chamber lo-
cations for the fertilization experiment) were assessed using
Fisher’s least significant difference (LSD) test (P ≤ 0.05).
For our second objective, we assess how soil factors influ-
ence the seasonal variations in soil CO2 and CH4 fluxes, us-
ing Pearson’s correlation tests with soil temperature, WFPS,
NO−3 , NH+4 and total mineral N. This assessment of sea-
sonal controls of trace gas fluxes was conducted for each land
use type within each landscape using the means of the four
replicate plots (as spatial representation) on each of the 12
monthly measurements in order to focus the analysis on tem-
poral variation. Lastly, we assessed the influence of soil phys-
ical and biochemical characteristics (Table A1) on the spatial
variations in soil annual CO2 and CH4 fluxes first on the ref-
erence land-use types across landscapes (16 plots) and sec-
ond across land-use types within each landscape (16 plots),
using Spearman’s rank correlation test. The first was to as-
sess the spatial controls of trace gas fluxes from the reference
land-use types, and the second was to evaluate which soil fac-
tors drive the spatial variation in trace gas fluxes across land-
use types. We used the annual fluxes as temporal represen-
tation in order to focus this analysis on the spatial variation.
For all correlation tests, statistical significance was taken at
P ≤ 0.05, except in a few cases for which a marginal signif-
icance at P ≤ 0.09 was considered because our experimen-
tal design encompassed the inherent spatial variability in the
studied landscapes. All statistical analyses were conducted
using R 3.0.2 (R Development Core Team, 2013).
3 Results
3.1 Reference land-use types (forest and jungle
rubber): comparison between landscapes
WFPS in the jungle rubber was higher in the clay than loam
Acrisol soils (P < 0.01), but, in the forest, WFPS did not
differ between landscapes (P = 0.56; Fig. 1a, b). In both
landscapes, we detected lower WFPS during the drier period
(mean WFPS ranged from 38 to 80 % between mid-June and
October) compared to the wetter period (mean WFPS ranged
from 50 to 96 %; P < 0.01; Fig. 1a, b). Soil temperatures
in the forest were lower in the clay than loam Acrisol soils
(P = 0.02; Fig. 1c, d), which was probably due to the differ-
ence in the time of the day when measurements were con-
ducted. Soil temperatures in the jungle rubber did not differ
between landscapes (P = 0.17).
In both landscapes, NH+4 was the dominant form of min-
eral N (Table 1). Soil NH+4 contents in the jungle rubber were
higher in the clay than in loam Acrisol soils (P = 0.02), but
in the forest soil NH+4 contents did not differ between land-
scapes (P = 0.90; Table 1). Soil NO−3 contents in the forest
were higher in the clay than in loam Acrisol soils (P < 0.01),
whereas soil NO−3 contents in the jungle rubber were higher
in the loam than in clay Acrisol soils (P = 0.02; Table 1).
Total mineral N contents in both reference land-use types did
not differ between landscapes (P = 0.11–0.19; Table 1).
We detected no differences in soil CO2 fluxes between
landscapes for the reference land-use types (P = 0.63–0.69;
Table 2; Fig. 2a, b). Similarly, soil CH4 fluxes from both ref-
erence land-use types were also comparable between the two
landscapes (P = 0.26–0.27; Table 2; Fig. 2c, d). However, in
the loam Acrisol soil, two of the four forest sites displayed
net CH4 emissions in 26 % of the measurements, which re-
sulted in its largest variation among plots (as indicated by its
largest standard error around the mean; Table 2).
3.2 Converted land-use types (rubber and oil palm
plantations): comparisons to the reference land-use
types within each landscape
While in both landscapes WFPS did not differ among land-
use types (P = 0.12–0.26; Fig. 1a, b), soil temperatures were
slightly higher in the plantations (27.2± 0.1 ◦C) compared
to the reference land-use types (25.9± 0.1 ◦C) in each land-
scape (both P < 0.01; Fig. 1c, d). Soil NH+4 contents in rub-
ber were lower than in all other land-use types in the clay
Acrisol soil (P = 0.05), and soil NH+4 contents in both rub-
ber and oil palm were also lower than in the reference land-
use types in the loam Acrisol soil (P = 0.03; Table 1). In the
clay Acrisol soil, NO−3 contents in rubber and oil palm were
lower than in forest (P < 0.01), and in the loam Acrisol soil
NO−3 contents in rubber were lowest, whereas these were in-
termediary in oil palm (P < 0.01; Table 1). The latter was
related to fertilizer application by the owner of one of the
Biogeosciences, 12, 5831–5852, 2015 www.biogeosciences.net/12/5831/2015/

E. Hassler et al.: Soil fertility controls soil–atmosphere carbon dioxide 5837
Figure 1. Mean (±SE, n= 4) soil water-filled pore space (WFPS) and soil temperature in the top 0.05 m depth under forest (�), jungle
rubber (♦), rubber (N) and oil palm (M) in the clay Acrisol soil (a and c) and the loam Acrisol soil (b and d) in Jambi, Sumatra, Indonesia,
measured monthly from December 2012 to December 2013. Grey shadings mark the dry season.
Table 1. Mean (±SE, n= 4) soil-extractable mineral nitrogen in the top 0.05 m depth for different land-use types within each soil landscape
in Jambi, Sumatra, Indonesia, measured monthly from December 2012 to December 2013. Means followed by different lowercase letters
indicate significant differences among land-use types within a soil landscape and different capital letters indicate significant differences
between soil landscapes within a land-use type (linear mixed-effect models with Fisher’s least significant difference (LSD) test at P ≤ 0.05).
Land-use type NH+4
NO−3
mineral N
(mgNkg−1) (mgNkg−1) (mgNkg−1)
clay Acrisol soil
Forest 6.99± 1.03a,A 2.15± 0.36a,A 9.14± 1.34a,A
Jungle rubber 7.33± 0.21a,A 0.23± 0.06b,B 7.56± 0.26b,A
Rubber 4.25± 0.23b,A 0.05± 0.01b,B 4.30± 0.23c,A
Oil palm 5.80± 0.64a,A 0.81± 0.49b,A 6.60± 0.42b,A
loam Acrisol soil
Forest 5.94± 0.40a,A 0.61± 0.15ab,B 6.55± 0.28a,A
Jungle rubber 5.64± 0.28a,B 1.25± 0.63a,A 6.89± 0.59a,A
Rubber 4.14± 0.57b,A 0.12± 0.02b,A 4.26± 0.58b,A
Oil palm 4.20± 1.10b,B 0.60± 0.36ab,B 4.81± 1.44b,B
oil palm plots just a month prior to our measurement. Total
mineral N showed similar differences among land-use types
in each landscape to those for soil NH+4 and NO−3 contents
(both P < 0.01; Table 1).
Soil CO2 fluxes from oil palm were 45 % lower in the clay
Acrisol soil and 38 % lower in the loam Acrisol soil com-
pared to the forest (both P < 0.01; Table 2; Fig. 2a, b). From
the fertilization experiment, soil CO2 fluxes within 1 m of the
www.biogeosciences.net/12/5831/2015/ Biogeosciences, 12, 5831–5852, 2015

5838 E. Hassler et al.: Soil fertility controls soil–atmosphere carbon dioxide
Figure 2. Mean (±SE, n= 4) soil CO2 fluxes and soil CH4 fluxes from forest (�), jungle rubber (♦), rubber (N) and oil palm (M) on the
clay Acrisol soil (a and c) and the loam Acrisol soil (b and d) in Jambi, Sumatra, Indonesia, measured monthly from December 2012 to
December 2013. Grey shadings mark the dry season.
Table 2. Mean (±SE, n= 4) soil CO2 and CH4 fluxes and annual soil CO2 and CH4 fluxes from different land-use types within each
soil landscape in Jambi, Sumatra, Indonesia, measured monthly from December 2012 to December 2013. Means followed by different
lowercase letters indicate significant differences among land-use types within a soil landscape and different capital letters indicate significant
differences between soil landscapes within a land-use type (linear mixed-effect models with Fisher’s LSD test at P ≤ 0.05). Annual soil CO2
and CH4 fluxes were not statistically tested for differences between landscapes or land-use types since these annual values are trapezoidal
extrapolations. For the loam Acrisol soil, CH4 fluxes in parenthesis included only the two forest sites that had a dominantly net CH4 uptake,
and comparison among land-use types was conducted between jungle rubber, rubber and oil palm, which all showed net CH4 uptake.
Land-use type CO2 fluxes Annual CO2 fluxes CH4 fluxes Annual CH4 fluxes
(mgCm−2 h−1) (MgCha−1 year−1) (µgCm−2 h−1) (kgCha−1 year−1)
clay Acrisol soil
Forest 195.93± 13.51a,A 16.93± 1.19 −40.3± 10.25c,A−3.63± 0.89
Jungle rubber 185.25± 9.40a,A 16.11± 0.72 −20.79± 7.24b,A−1.85± 0.59
Rubber 182.77± 16.22a,A 16.09± 1.40 −3.00± 1.26a,A−0.29± 0.12
Oil palm 107.24± 7.23b,A 9.22± 0.61 −6.37± 3.06a,A−0.52± 0.26
loam Acrisol soil
Forest 186.64± 13.72a,A 16.21± 1.17 −1.56± 17.07A−0.18± 1.55
(−29.45± 11.92)
Jungle rubber 178.69± 11.17a,A 15.55± 0.94 −26.92± 3.85b,A−2.42± 0.34
Rubber 182.86± 14.47a,A 16.52± 1.32 −9.73± 3.79a,A−0.93± 0.35
Oil palm 115.74± 10.99b,A 10.29± 0.88 −14.94± 3.14a,A−1.38± 0.31
oil palm base (chamber locations a and b) were on average
2.3± 0.2 times higher than those 4–4.5 m from the tree base
(chamber location c) in both landscapes (all P < 0.01; Ta-
ble A3). However, this area within 1 m distance to the tree
Biogeosciences, 12, 5831–5852, 2015 www.biogeosciences.net/12/5831/2015/
E. Hassler et al.: Soil fertility controls soil–atmosphere carbon dioxide 5839
base is only 3 m2 per tree or 4 % on a hectare basis. Even if
we were to include these elevated soil CO2 fluxes into annual
estimates using area-weighted contributions, the high fluxes
within 1 m distance to the tree base would account for less
than the standard errors (7–9 %) of the mean annual fluxes.
Soil CH4 uptake in the plantations was 84 % (oil palm)
and 93 % (rubber) lower compared to the forest and 69 % (oil
palm) and 86 % (rubber) lower compared to the jungle rubber
in the clay Acrisol soil (P < 0.01; Table 2; Fig. 2c, d). Also
in the loam Acrisol soil, CH4 uptake in the plantations was
lower (reduction of 64 % for rubber and 44 % for oil palm)
compared to jungle rubber (P = 0.02; Table 2; Fig. 2c, d).
However, CH4 uptake in the forest on loam Acrisol soils
deviated from the differences detected in the clay Acrisol
soils because of the two forest sites that displayed net CH4
emissions (see above; Table 2; Fig. 2d). From the fertiliza-
tion experiment, soil CH4 uptake from the area of fertilizer
application (chamber location b) was 2.6± 0.2 times lower
than the unfertilized chamber locations a and c (respectively
0.3 m and 4–4.5 m from the oil palm base) (P ≤ 0.01–0.05;
Table A3), with the exception of plot 3 in the clay Acrisol soil
(P = 0.45; Table A3). In most cases, CH4 uptake in cham-
ber location b was reduced immediately following fertilizer
application and was restored to prefertilization values after
about 6 weeks (Fig. B1). Even if we included these reduced
soil CH4 fluxes into annual estimates using area-weighted
contributions, the low area coverage (∼1.3 % of 1 ha) and
time duration (12 % of 1 year) would render a negligible ef-
fect.
3.3 Seasonal controls of CO2 and CH4 fluxes from each
land-use type
In the clay Acrisol soil, CH4 fluxes were positively correlated
with WFPS (Table 3) in each of the four land-use types, sig-
nifying the higher CH4 uptake in the dry than in the wet sea-
son (P ≤ 0.01–0.03; Fig. 2c). Soil CH4 fluxes correlated neg-
atively with NO−3 contents in forest and with soil CO2 fluxes
in rubber (Table 3). Across all land-use types, soil CH4 up-
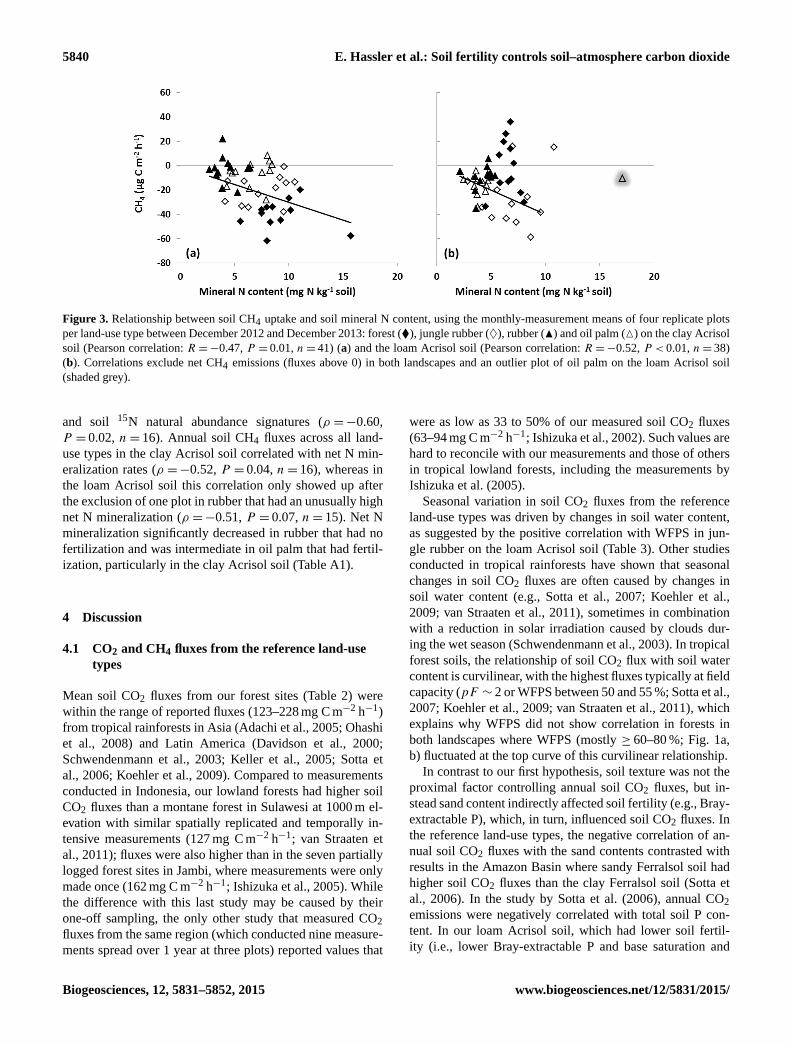
take was negatively correlated with total mineral N content
(R =−0.47, P ≤ 0.01, n= 41; Fig. 3a) and NO−3 content
(R =−0.73, P ≤ 0.01, n= 41). Some correlations in Table 3
were possibly spurious: in oil palm, soil CO2 fluxes were
positively correlated with soil temperatures (Table 3) even if
the temperate range was small (25.5–28.8 ◦C) such that this
correlation was likely caused by the differences in sampling
time during the day rather than by a seasonal temperature
pattern. In jungle rubber, plotting soil CO2 fluxes against soil
NO−3 contents showed that their correlation (Table 3) was
apparently caused by a group of many low NO−3 contents
against one high NO−3 value and this correlation became in-
significant when the one high value was removed. Also, in
rubber, the marginal negative correlation between soil CH4
fluxes with NO−3 contents was due to the correlation between
WFPS and NO−3 contents.
In the loam Acrisol soil, seasonal variations in soil CO2
fluxes were positively correlated with WFPS in jungle rub-
ber and negatively correlated with WFPS in rubber (Table 3).
Some correlations in Table 3 were also spurious, caused by
differences in sampling time during the day rather than by
a seasonal pattern: correlation between soil CO2 fluxes and
soil temperature in forest and oil palm despite narrow tem-
perate ranges (24.8–27.2 ◦C in forest and 25.8–29.4 ◦C in oil
palm). The negative correlation between soil CO2 fluxes and
NO−3 contents in jungle rubber was driven by the negative
correlation between WFPS and NO−3 (Table 3). As was ob-
served in the clay Acrisol soil, seasonal variation in soil CH4
fluxes from the loam Acrisol soil was positively correlated
with WFPS in each of the three land-use types (Table 3) with
the exception of the forest which was caused by one extreme
CH4 emission from a single chamber (656.47 µg C m−2 h−1).
When this one value was excluded, a positive correlation
between soil CH4 fluxes and WFPS was also detected for
forest (R = 0.60, P ≤ 0.01, n= 12). Soil CH4 fluxes also
correlated positively with soil CO2 fluxes in jungle rubber,
whereas this correlation was negative in rubber (Table 3). In
the jungle rubber, soil CH4 fluxes correlated negatively with
soil NO−3 contents (Table 3). Across land-use types, we also
observed negative correlations of soil CH4 uptake with total
mineral N content (R =−0.52, P ≤ 0.01, n= 38; Fig. 3b)
and NO−3 content (R =−0.75, P ≤ 0.01, n= 38).
3.4 Spatial controls of annual CO2 and CH4 fluxes
across land-use types within each landscape
For these correlation analyses, we used all soil physical and
biochemical characteristics which are reported in Table A1.
Apart from the correlations reported here, there were no other
significant correlations with any of the tested soil physical
and biochemical characteristics. First, analyzing both refer-
ence land-use types (forest and jungle rubber) across land-
scapes, the only significant correlation between annual soil
CO2 emissions and soil parameters was with sand content
(Spearman’s ρ =−0.51, P = 0.08, n= 16). However, ana-
lyzing for each landscape separately, annual soil CO2 fluxes
from the reference land-use types in the loam Acrisol soil
correlated with Bray-extractable soil P (ρ =−0.74, P =
0.04, n= 8). Furthermore, annual soil CH4 fluxes from both
reference land-use types across landscapes were correlated
with net N mineralization rates (ρ=−0.75, P < 0.01, n=
16) and, for each landscape separately, with exchangeable
Al (ρ = 0.74, P = 0.04, n= 8 in the clay Acrisol soil, and
ρ = 0.69, P = 0.06, n= 8 in the loam Acrisol soil).
Second, analyzing across four land-use types within each
landscape, annual soil CO2 fluxes correlated only with soil15N natural abundance signatures in the clay Acrisol soil
(ρ =−0.49, P = 0.05, n= 16). In the loam Acrisol soil, an-
nual soil CO2 fluxes correlated with soil organic C (ρ = 0.49,
P = 0.06, n= 16), base saturation (ρ=−0.53, P = 0.04,
n= 16), Bray-extractable P (ρ =−0.71, P < 0.01, n= 16)
www.biogeosciences.net/12/5831/2015/ Biogeosciences, 12, 5831–5852, 2015
5840 E. Hassler et al.: Soil fertility controls soil–atmosphere carbon dioxide
Figure 3. Relationship between soil CH4 uptake and soil mineral N content, using the monthly-measurement means of four replicate plots
per land-use type between December 2012 and December 2013: forest (�), jungle rubber (♦), rubber (N) and oil palm (M) on the clay Acrisol
soil (Pearson correlation: R =−0.47, P = 0.01, n= 41) (a) and the loam Acrisol soil (Pearson correlation: R =−0.52, P < 0.01, n= 38)
(b). Correlations exclude net CH4 emissions (fluxes above 0) in both landscapes and an outlier plot of oil palm on the loam Acrisol soil
(shaded grey).
and soil 15N natural abundance signatures (ρ =−0.60,
P = 0.02, n= 16). Annual soil CH4 fluxes across all land-
use types in the clay Acrisol soil correlated with net N min-
eralization rates (ρ =−0.52, P = 0.04, n= 16), whereas in
the loam Acrisol soil this correlation only showed up after
the exclusion of one plot in rubber that had an unusually high
net N mineralization (ρ =−0.51, P = 0.07, n= 15). Net N
mineralization significantly decreased in rubber that had no
fertilization and was intermediate in oil palm that had fertil-
ization, particularly in the clay Acrisol soil (Table A1).
4 Discussion
4.1 CO2 and CH4 fluxes from the reference land-use
types
Mean soil CO2 fluxes from our forest sites (Table 2) were
within the range of reported fluxes (123–228 mg C m−2 h−1)
from tropical rainforests in Asia (Adachi et al., 2005; Ohashi
et al., 2008) and Latin America (Davidson et al., 2000;
Schwendenmann et al., 2003; Keller et al., 2005; Sotta et
al., 2006; Koehler et al., 2009). Compared to measurements
conducted in Indonesia, our lowland forests had higher soil
CO2 fluxes than a montane forest in Sulawesi at 1000 m el-
evation with similar spatially replicated and temporally in-
tensive measurements (127 mg C m−2 h−1; van Straaten et
al., 2011); fluxes were also higher than in the seven partially
logged forest sites in Jambi, where measurements were only
made once (162 mg C m−2 h−1; Ishizuka et al., 2005). While
the difference with this last study may be caused by their
one-off sampling, the only other study that measured CO2
fluxes from the same region (which conducted nine measure-
ments spread over 1 year at three plots) reported values that
were as low as 33 to 50% of our measured soil CO2 fluxes
(63–94 mg C m−2 h−1; Ishizuka et al., 2002). Such values are
hard to reconcile with our measurements and those of others
in tropical lowland forests, including the measurements by
Ishizuka et al. (2005).
Seasonal variation in soil CO2 fluxes from the reference
land-use types was driven by changes in soil water content,
as suggested by the positive correlation with WFPS in jun-
gle rubber on the loam Acrisol soil (Table 3). Other studies
conducted in tropical rainforests have shown that seasonal
changes in soil CO2 fluxes are often caused by changes in
soil water content (e.g., Sotta et al., 2007; Koehler et al.,
2009; van Straaten et al., 2011), sometimes in combination
with a reduction in solar irradiation caused by clouds dur-
ing the wet season (Schwendenmann et al., 2003). In tropical
forest soils, the relationship of soil CO2 flux with soil water
content is curvilinear, with the highest fluxes typically at field
capacity (pF ∼ 2 or WFPS between 50 and 55 %; Sotta et al.,
2007; Koehler et al., 2009; van Straaten et al., 2011), which
explains why WFPS did not show correlation in forests in
both landscapes where WFPS (mostly ≥ 60–80 %; Fig. 1a,
b) fluctuated at the top curve of this curvilinear relationship.
In contrast to our first hypothesis, soil texture was not the
proximal factor controlling annual soil CO2 fluxes, but in-
stead sand content indirectly affected soil fertility (e.g., Bray-
extractable P), which, in turn, influenced soil CO2 fluxes. In
the reference land-use types, the negative correlation of an-
nual soil CO2 fluxes with the sand contents contrasted with
results in the Amazon Basin where sandy Ferralsol soil had
higher soil CO2 fluxes than the clay Ferralsol soil (Sotta et
al., 2006). In the study by Sotta et al. (2006), annual CO2
emissions were negatively correlated with total soil P con-
tent. In our loam Acrisol soil, which had lower soil fertil-
ity (i.e., lower Bray-extractable P and base saturation and
Biogeosciences, 12, 5831–5852, 2015 www.biogeosciences.net/12/5831/2015/
E. Hassler et al.: Soil fertility controls soil–atmosphere carbon dioxide 5841
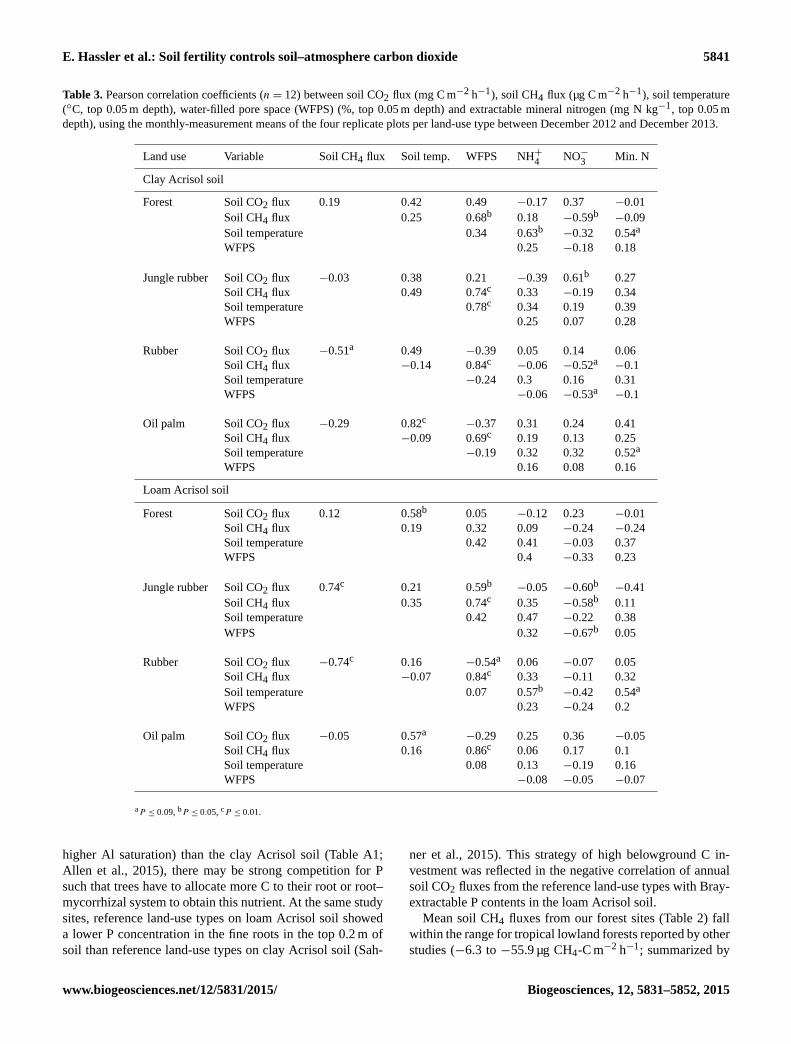
Table 3. Pearson correlation coefficients (n= 12) between soil CO2 flux (mg C m−2 h−1), soil CH4 flux (µg C m−2 h−1), soil temperature
(◦C, top 0.05 m depth), water-filled pore space (WFPS) (%, top 0.05 m depth) and extractable mineral nitrogen (mg N kg−1, top 0.05 m
depth), using the monthly-measurement means of the four replicate plots per land-use type between December 2012 and December 2013.
Land use Variable Soil CH4 flux Soil temp. WFPS NH+4
NO−3
Min. N
Clay Acrisol soil
Forest Soil CO2 flux 0.19 0.42 0.49 −0.17 0.37 −0.01
Soil CH4 flux 0.25 0.68b 0.18 −0.59b−0.09
Soil temperature 0.34 0.63b−0.32 0.54a
WFPS 0.25 −0.18 0.18
Jungle rubber Soil CO2 flux −0.03 0.38 0.21 −0.39 0.61b 0.27
Soil CH4 flux 0.49 0.74c 0.33 −0.19 0.34
Soil temperature 0.78c 0.34 0.19 0.39
WFPS 0.25 0.07 0.28
Rubber Soil CO2 flux −0.51a 0.49 −0.39 0.05 0.14 0.06
Soil CH4 flux −0.14 0.84c−0.06 −0.52a
−0.1
Soil temperature −0.24 0.3 0.16 0.31
WFPS −0.06 −0.53a−0.1
Oil palm Soil CO2 flux −0.29 0.82c−0.37 0.31 0.24 0.41
Soil CH4 flux −0.09 0.69c 0.19 0.13 0.25
Soil temperature −0.19 0.32 0.32 0.52a
WFPS 0.16 0.08 0.16
Loam Acrisol soil
Forest Soil CO2 flux 0.12 0.58b 0.05 −0.12 0.23 −0.01
Soil CH4 flux 0.19 0.32 0.09 −0.24 −0.24
Soil temperature 0.42 0.41 −0.03 0.37
WFPS 0.4 −0.33 0.23
Jungle rubber Soil CO2 flux 0.74c 0.21 0.59b−0.05 −0.60b
−0.41
Soil CH4 flux 0.35 0.74c 0.35 −0.58b 0.11
Soil temperature 0.42 0.47 −0.22 0.38
WFPS 0.32 −0.67b 0.05
Rubber Soil CO2 flux −0.74c 0.16 −0.54a 0.06 −0.07 0.05
Soil CH4 flux −0.07 0.84c 0.33 −0.11 0.32
Soil temperature 0.07 0.57b−0.42 0.54a
WFPS 0.23 −0.24 0.2
Oil palm Soil CO2 flux −0.05 0.57a−0.29 0.25 0.36 −0.05
Soil CH4 flux 0.16 0.86c 0.06 0.17 0.1
Soil temperature 0.08 0.13 −0.19 0.16
WFPS −0.08 −0.05 −0.07
aP ≤ 0.09, bP ≤ 0.05, cP ≤ 0.01.
higher Al saturation) than the clay Acrisol soil (Table A1;
Allen et al., 2015), there may be strong competition for P
such that trees have to allocate more C to their root or root–
mycorrhizal system to obtain this nutrient. At the same study
sites, reference land-use types on loam Acrisol soil showed
a lower P concentration in the fine roots in the top 0.2 m of
soil than reference land-use types on clay Acrisol soil (Sah-
ner et al., 2015). This strategy of high belowground C in-
vestment was reflected in the negative correlation of annual
soil CO2 fluxes from the reference land-use types with Bray-
extractable P contents in the loam Acrisol soil.
Mean soil CH4 fluxes from our forest sites (Table 2) fall
within the range for tropical lowland forests reported by other
studies (−6.3 to −55.9 µg CH4-C m−2 h−1; summarized by
www.biogeosciences.net/12/5831/2015/ Biogeosciences, 12, 5831–5852, 2015

5842 E. Hassler et al.: Soil fertility controls soil–atmosphere carbon dioxide
Veldkamp et al., 2013); however, our measured CH4 uptake
rates were at the upper end (towards more negative values)
of these reported rates and were also higher than the CH4 up-
take rates reported for old-growth forests in Jambi, Indonesia
(−21.3 to +4.2 µg CH4-C m−2 h−1; Ishizuka et al., 2002).
Seasonal variation in soil CH4 fluxes was strongly con-
trolled by soil water content with higher uptake in the dry
season (Fig. 1a, b), as shown by the strong positive corre-
lations with WFPS in all land-use types in both landscapes
(Table 3). Such seasonal changes reflect diffusional limita-
tion on the supply of CH4 to methanotrophs at high WFPS
(Keller and Reiners, 1994) and the possible occurrence of
anaerobic decomposition, producing CH4, which may par-
tially offset CH4 consumption (Keller and Reiners, 1994;
Verchot et al., 2000). Since we measured occasional net CH4
emissions from some reference land-use types (Fig. 2d), we
cannot exclude this anaerobic CH4 production. High micro-
bial and root activity consume oxygen in the soil, which may
contribute to the creation of anaerobic microsites where CH4
can be produced. This may have occurred in the jungle rub-
ber on the loam Acrisol soil, where we detected a positive
correlation of soil CO2 fluxes with soil CH4 fluxes (Table 3).
Positive correlations of soil CO2 fluxes and CH4 fluxes have
been reported also for tropical forests (Verchot et al., 2000).
In addition to WFPS, soil mineral N dynamics also influ-
enced the seasonal variation in soil CH4 fluxes. The negative
correlations of soil CH4 fluxes with soil NO−3 contents in the
forest on the clay Acrisol soil and in the jungle rubber on
the loam Acrisol soil (Table 3) imply that some of the ob-
served seasonal variability may have been caused by tempo-
ral N limitation of CH4 oxidation (Bodelier and Laanbroek,
2004; Veldkamp et al. 2013).
We found strong indications that CH4 uptake in this con-
verted tropical lowland was both N-limited and affected by
high, potentially toxic, exchangeable Al concentrations in the
soil. We interpreted negative correlations of annual soil CH4
fluxes from the reference land-use types with net N mineral-
ization rates (see Sect. 3.4) across landscapes as evidence for
N-limited CH4 uptake. Indications of N-limited CH4 uptake
have been reported for tropical forests in Panama (Veldkamp
et al., 2013) and Ecuador (Wolf et al., 2012), but this is the
first time that it was observed on a landscape scale in the
tropics. Furthermore, the positive correlations of annual soil
CH4 fluxes from the reference land-use types with exchange-
able Al within each landscape reflected the lower CH4 up-
take measured at sites with more exchangeable Al in the soil.
Soil Al saturation in our reference land-use types was high
(mean values ranged from 61 to 80 %; Appendix Table A1).
High Al3+ concentrations in the soil solution and higher ex-
changeable Al in the soil are known to be toxic for plants, the
root growth of which may be inhibited (Ma et al., 2001). Dis-
solved Al3+ can also be toxic for soil microorganisms, and it
has been shown that high dissolved Al concentrations in the
soil inhibited CH4 uptake in a temperate forest soil in Japan
(Tamai et al., 2003). We are not aware of any study reporting
such a relationship for tropical ecosystems, which is not sur-
prising since in most trace gas studies exchangeable Al in the
soil is either not measured or does not reach such high levels
as at our sites.
In summary, seasonal variation in soil CO2 fluxes from
the reference land-use types were related to soil water con-
tent (i.e., jungle rubber in loam Acrisol soil), while the spa-
tial control of annual soil CO2 fluxes across landscapes was
related to soil fertility: low Bray-extractable P concentra-
tions coincided with high annual soil CO2 fluxes from the
loam Acrisol soil, which had lower soil fertility than the clay
Acrisol soil. Seasonal variation in CH4 fluxes from the ref-
erence land-use types were mainly explained by soil water
content, although we found indications that temporal N lim-
itation may also have played a role. Spatial controls of an-
nual soil CH4 fluxes across landscapes were also related to
soil fertility, as shown by their negative correlation with soil
N availability, suggesting N limitation on CH4 uptake, and
their positive correlation with exchangeable Al, suggesting
Al toxicity towards methanotrophs, which has not yet been
reported for tropical ecosystems. These results are in contrast
to our first hypothesis – soil texture was not the proximal fac-
tor controlling soil CO2 and CH4 fluxes but only did so in-
directly through its influence on soil fertility, which, in turn,
controlled the spatial variations in these trace gases across
our studied landscapes.
4.2 Effects of land-use change on CO2 and CH4 fluxes
Mean soil CO2 fluxes from our rubber plantations (Table 2)
were on the same order of magnitude as those reported
for seven rubber plantations in Jambi (Indonesia) where
fluxes were measured once (171 mg C m−2 h−1; Ishizuka
et al., 2005), while soil CO2 fluxes from a rubber plan-
tation in a sandy clay loam Nitisol soil in Malaysia with
one measurement were lower (123 mg C m−2 h−1; Adachi
et al., 2005). Some other studies reported soil CO2 fluxes
that are much lower than our measured fluxes: at a rubber
plantation on a heavily weathered silty clay soil in China
(35 mg C m−2 h−1; Werner et al., 2006) and a rubber plan-
tation in Jambi (Indonesia) with nine measurements (75 mg
C m−2 h−1; Ishizuka et al., 2002). Since this last study also
reported 33–50 % lower soil CO2 fluxes from forests (see
Sect. 4.1) as well as 50 % lower soil CO2 fluxes from oil
palm (51 mg C m−2 h−1; Ishizuka et al., 2002) than our mea-
sured fluxes from the same region (Table 2), we suspect
some methodological issues in this study. Mean soil CO2
fluxes from our oil palm sites were comparable with other re-
ported fluxes from five oil palm plantations in Jambi (Indone-
sia) where fluxes were measured once (98 mg C m−2 h−1;
Ishizuka et al., 2005). Lastly, soil CO2 fluxes from an oil
palm plantation that were more than double our measured
fluxes were reported from a one-time measurement in a
sandy clay loam Nitisol soil in Malaysia (222 mg C m−2 h−1;
Adachi et al., 2005).
Biogeosciences, 12, 5831–5852, 2015 www.biogeosciences.net/12/5831/2015/

E. Hassler et al.: Soil fertility controls soil–atmosphere carbon dioxide 5843
Seasonal variation in soil CO2 fluxes from oil palm was
not as pronounced as that in fluxes from rubber (Fig. 2a,
b). In rubber plantations in loam Acrisol soil, where WFPS
were all above 55 % (Fig. 1b), the seasonal variation in soil
CO2 fluxes reflected the curvilinear relationship of soil CO2
fluxes with WFPS, whereby soil CO2 fluxes typically decline
at WFPS larger than about 55 % (e.g., Sotta et al., 2007;
Koehler et al., 2009), hence the negative correlation with
WFPS (Table 3).
The spatial variation in annual soil CO2 fluxes across land-
use types reflected the changes in soil organic-matter quality
and quantity with changes in land use, as indicated by the
negative correlations with soil 15N natural abundance signa-
tures (see Sect. 3.4) and the positive correlation with soil or-
ganic C content. Soil 15N signatures in our studied oil palm
plantations were significantly higher than in the reference
land-use types (i.e., loam Acrisol soil; Table A1; Allen et al.,
2015), which we interpreted as an indication of the degree
of decomposition of soil organic matter. The more decom-
posed the soil organic matter, the higher the soil 15N signa-
ture, as illustrated by increasing soil 15N signatures with in-
creasing depth of tropical forest soils (Sotta et al., 2008; Bal-
dos et al., 2015). The more decomposed soil organic matter
in the oil palm plantations was probably caused by reduced
litter input and lower fine- and coarse-root production com-
pared to the forests (measured at the same sites by Kotowska
et al., 2015). The low litter input and root production influ-
enced not only the degree of decomposition of the soil or-
ganic matter but also led to strong reductions in soil organic
C stocks of oil palm and rubber plantations (measured in the
same study region by van Straaten et al., 2015). This may
have contributed to the low CO2 emissions, since we also de-
tected a positive correlation of soil CO2 emissions with soil
organic C content. Similar findings were reported from the
conversion of forest to tree plantations on Acrisol soil in sub-
tropical southern China, where decreases in soil CO2 fluxes
were also explained by decreases in annual litterfall and root
biomass (Sheng et al., 2010). In addition to changes in soil
organic-matter quality, spatial variation in annual soil CO2
fluxes across land-use types in the loam Acrisol soil was also
controlled by changes in soil fertility with land-use change,
as shown by the fluxes’ negative correlations with base satu-
ration and Bray-extractable P (see Sect. 3.4). Conversion of
forest or jungle rubber to rubber and oil palm plantations was
accompanied by the burning of slashed vegetation, whereby
considerable amounts of bases and P could be released from
the plant biomass to ashes (Klinge et al., 2004). Input of
these nutrients to the soil from the ashes, combined with P
fertilization and liming (particularly in the oil palm planta-
tions), significantly increased soil pH in both rubber and oil
palm as well as base saturation and Bray-extractable P in
oil palm (Table A1; Allen et al., 2015). The negative cor-
relations of annual soil CO2 fluxes with base saturation and
Bray-extractable P across land-use types suggest that C al-
location to its root–mycorrhizal system may have decreased
with increased base cations and P availability, contributing to
the observed decrease in soil CO2 fluxes from oil palm com-
pared to the other land-use types (Table 2). In contrast, we
could not support the speculation by Ishizuka et al. (2005)
that low soil CO2 fluxes from oil palm plantations could be
explained by higher soil bulk densities related to intensive
management practices since soil bulk densities in these con-
verted land-use types were comparable to the reference land-
use types (Table A1; Allen et al., 2015).
Mean soil CH4 fluxes from rubber plantations (Table 2)
were comparable with those reported for a rubber planta-
tion in southwest China (−5.7 µg CH4-C m−2 h−1; Werner et
al., 2006) and for seven rubber plantations in Jambi (Indone-
sia) measured only once (−5.8 µg CH4-C m−2 h−1; Ishizuka
et al., 2005). From the oil palm plantations, mean soil CH4
fluxes (Table 2) were comparable with those reported for five
oil palm plantations in Jambi (Indonesia), where fluxes were
measured only once (−20.1 µg CH4-C m−2 h−1; Ishizuka et
al., 2005), but larger (or higher CH4 uptake rate) than the
values reported for an oil palm plantation in Jambi with
one measurement (−4.2 µg CH4-C m−2 h−1; Ishizuka et al.,
2002).
As was the case for the reference land-use types, sea-
sonal variation in soil CH4 fluxes from the converted land-
use types was also controlled by WFPS (Table 3), and the
possible mechanisms were the same (see Sect. 4.1). More-
over, strong negative correlations of soil CH4 uptake with
total mineral N (Fig. 3) and NO−3 contents across all land-
use types (see Sect. 3.3), with total mineral N being lowest
in the converted land-use types (Table 1), also suggest tem-
poral N limitation on methanotrophic activity (Veldkamp et
al., 2013) that may have contributed to the decrease in CH4
uptake in the converted land-use types (Fig. 2c, d; Table 2).
The negative correlations of annual soil CH4 fluxes with
net N mineralization rates across land-use types further sug-
gest N limitation on CH4 uptake, as indicated by the low-
est CH4 uptake in the converted land-use types (Table 2)
that had the lowest (i.e., rubber with no N fertilization) to
intermediate (i.e., oil palm with N fertilization) net N min-
eralization rates (see Sect. 3.4). The results from the fertil-
ization experiment in the oil palm sites that showed inhibi-
tion of CH4 uptake in the fertilized spot (chamber location
b; Table A3) within 6 weeks following fertilizer application
(Fig. B1) were probably caused by salt effect, as has been ob-
served in a fertilization experiment in tropical pastures (Veld-
kamp et al., 2001). However, this CH4 inhibition following
fertilizer application did not influence our annual flux esti-
mates because of the negligible area coverage of the fertil-
ized spots (∼ 1.3 % of 1 ha) and its short-term effect (12 %
of 1 year).
In summary, soil CO2 fluxes decreased only in oil palm
and not in rubber, which partly supports our second hypothe-
sis. These converted land-use types showed a decrease in soil
CH4 uptake, which supports our second hypothesis. Season-
ality of soil CO2 and CH4 fluxes in the converted land-use
www.biogeosciences.net/12/5831/2015/ Biogeosciences, 12, 5831–5852, 2015

5844 E. Hassler et al.: Soil fertility controls soil–atmosphere carbon dioxide
types appeared to be controlled by the same factors as in the
reference land-use types. The strong decrease in soil CO2
fluxes from the oil palm was probably caused by a combi-
nation of strongly decomposed soil organic matter and low
soil carbon stocks (caused by the low input of litterfall and
low fine-root production) and possibly by low C allocation
to the root or the root–mycorrhizal system (due to the im-
proved base cations and P availability from liming and P fer-
tilization). Reduction in annual CH4 uptake in the converted
land-use types was primarily caused by the decrease in soil
N availability in these converted land-use types.
5 Consequences of land-use change for soil trace gas
fluxes
Our study shows that land-use change had a profound ef-
fect on the soil–atmosphere fluxes of the trace gases CO2
and CH4, with reduced soil CO2 fluxes from oil palm plan-
tations and reduced soil CH4 uptake in both rubber and oil
palm plantations. The reduced soil CO2 fluxes in the oil palm
should not be interpreted as reduced net ecosystem emissions
because we did not measure the net CO2 uptake by the veg-
etation and the changes in soil and vegetation carbon stocks.
Rather the strong decrease in soil CO2 fluxes from oil palm
is a reflection of the present belowground carbon dynamics
in this land-use type. Due to decreases in litterfall and fine-
root production (Kotowska et al., 2015) as well as frond man-
agement practice (stacking fronds in interrows) that reduced
fresh litter input in the whole area, soil organic C stocks in
these oil palm plantations decreased over time (van Straaten
et al., 2015), reflecting the reductions in soil CO2 emissions.
Our estimate of the decrease in CH4 uptake resulting from
conversion of forest or jungle rubber to rubber and oil palm
in these landscapes was about 2 kg CH4-C ha−1 yr−1 (based
on the average of the values in Table 2). If we multiply this
with 0.52 Mha, the increase in areal coverage of oil palm and
rubber plantations in Jambi from 1996 to 2011 (BPS, 2012),
this suggests that the capacity of the province of Jambi to
remove this potent greenhouse gas from the atmosphere has
decreased by about 1040 Mg CH4-C yr−1 as a result of this
land-use conversion. This calculation does not take into ac-
count land-use changes that occurred in the peatlands. Fi-
nally, we detected important soil fertility controls on trace
gas exchange in this converted tropical landscape on highly
weathered Acrisol soils, including the controls of base cation
and P availability on annual soil CO2 fluxes and N availabil-
ity and Al toxicity on annual soil CH4 fluxes. Such controls
on the landscape scale have not yet been reported, and thus
we stress the importance of conducting landscape-scale stud-
ies as field studies on a few small plots or laboratory-based
studies may not be able to detect such important controls.
Biogeosciences, 12, 5831–5852, 2015 www.biogeosciences.net/12/5831/2015/
E. Hassler et al.: Soil fertility controls soil–atmosphere carbon dioxide 5845
Appendix A: Soil sampling and analysis
Soil samples were taken from 10 subplots per plot that were
randomly selected and at least 5 m distance from the plot’s
border. Soil characteristics for each replicate plot were the
average of the 10 subplots. Soil sampling was conducted be-
tween June 2013 and December 2013. Soil samples were
taken at various depth intervals down to 2 m, and we report
here the values from the top depth interval (0–0.1 m), except
for soil texture, which we report for the entire 2 m. Soil tex-
ture was analyzed using the wet sieving and pipette methods.
Soil bulk density was measured using the core method. Soil
pH (H2O) was analyzed in a 1 : 4 soil-to-water ratio. Soil or-
ganic C and total N concentrations were analyzed from air-
dried, sieved (2 mm) and ground samples using a CN ana-
lyzer (Vario EL Cube, Elementar Analysis Systems GmbH,
Hanau, Germany). Air-dried and sieved soils were used to
determine effective cation exchange capacity (ECEC) by per-
colating with unbuffered 1 mol L−1 NH4Cl, and cations (Ca,
Mg, K, Na, Al, Fe, and Mn) were measured in percolate using
an inductively coupled plasma-atomic emission spectrometer
(iCAP 6300 Duo VIEW ICP Spectrometer, Thermo Fischer
Scientific GmbH, Dreieich, Germany). Base and aluminum
saturation were calculated as the percentage of exchange-
able base cations and aluminum of the ECEC. Extractable P
was determined using the Bray 2 method, which is typically
used for acidic tropical soils. For soil 15N natural abundance
signatures, ground soil samples were analyzed using isotope
ratio mass spectrometry (IRMS; Delta Plus, Finnigan MAT,
Bremen, Germany). The net N mineralization rate was mea-
sured in two subplots per plot that were at least 10 m from
the plot’s border, using the buried-bag method on intact soil
cores incubated in situ for 7 days. This was conducted be-
tween January 2013 and May 2013 during the rainy season.
The field extraction of the soil with 0.5 M K2SO4, analysis
of NH+4 and NO−3 concentrations, and calculation of rate are
used are the same as described in our earlier work (Arnold
et al., 2008). The net N mineralization rate for each plot was
the average of two subplots.
www.biogeosciences.net/12/5831/2015/ Biogeosciences, 12, 5831–5852, 2015

5846 E. Hassler et al.: Soil fertility controls soil–atmosphere carbon dioxide
Table A1. Mean (±SE, n= 4) soil physical and biochemical characteristics in the top 0.10 m depth (except for the clay content, 0–2 m
depth with n= 3) for different land-use types within each soil landscape in Jambi, Sumatra, Indonesia. Means followed by different lower-
case letters indicate significant differences among land-use types within each soil landscape and different capital letters indicate significant
differences between soil landscapes within a land-use type (linear mixed-effect models with Fisher’s LSD test at P ≤ 0.05 and marginally
significant at ∗ P ≤ 0.09). Soil characteristics were measured by Allen et al. (unpublished data). Soil sampling and analysis are described in
Appendix A.
Soil characteristics Land use
Forest Jungle rubber Rubber Oil palm
Clay Acrisol soil
Clay (0–0.5 m) (%) 31.4± 5.4a 47.2± 12.40a 42.4± 3.1a 59.7± 5.2a,A
Clay (0.5–1.0 m) (%) 34.9± 9.0b∗ 51.4± 12.6ab∗ 36.8± 8.00b∗ 69.7± 4.8a∗A
Clay (1.0–1.5 m) (%) 39.0± 13.0a 62.8± 12.6a 40.8± 10.3a 62.8± 3.6a,A
Clay (1.5–2.0 m) (%) 41.3± 11.2a 46.6± 16.2a 36.5± 10.8a 63.3± 6.1a,A
Sand (0–0.10 m) (%) 36± 11a 27± 20a 35± 7a 11± 2a,B∗
Bulk density (gcm−3) 1.0± 0.1a 0.8± 0.1a 0.9± 0.1a 0.9± 0.1a,B
pH (1 : 4 H2O) 4.2± 0.4b 4.5± 0.0a,A 4.5± 0.1a 4.4± 0.1a
Soil organic C (kgCm−2) 3.3± 0.5a 4.3± 0.4a,A 2.8± 0.4a 3.5± 0.2a,A
Total N (gNm−2) 263.4± 67.1a 331.4± 34.1a,A 198.4± 32.5a 260.2± 22.6a,A
C : N ratio 13.1± 1.3a 13.0± 0.3a 14.3± 0.6a,A 13.5± 0.2a
Effective cation exchange capacity (cmol3 kg−1) 9.4± 4.1a 12.4± 2.6a,A 7.1± 2.2a 7.8± 0.8a,A
Base saturation (%) 23± 6a,A 23± 6a 20± 3a 38± 7a
Aluminum saturation (%) 61± 3ab,B 71± 6a 73± 4a 53± 7b
Bray-extractable phosphorus (gPm−2) 1.4± 0.1a,b,A 0.8± 0.1bc 0.4± 0.0c 4.7± 1.5a,A∗
15N natural abundance (‰) 4.5± 0.0a 4.0± 0.3a 4.6± 0.4a 5.2± 0.4a
Net N mineralization (mgNkg−1 d−1) 1.2± 0.3a 0.5± 0.0b 0.5± 0.2b 0.9± 0.2ab
Loam Acrisol soil
Clay (0–0.5 m) (%) 26.0± 2.6a 30.6± 4.6a 37.3± 10.3a 33.4± 2.2a,B
Clay (0.5–1.0 m) (%) 28.7± 4.8a 38.8± 9.0a 45.1± 11.3a 41.0± 3.1a,B
Clay (1.0–1.5 m) (%) 33.3± 7.56a 42.4± 9.9a 46.1± 9.9a 43.3± 2.8a,B
Clay (1.5–2.0 m) (%) 37.3± 8.7a 44.5± 10.0a 43.4± 6.5a 47.6± 4.5a,B
Sand (0–0.10 m) (%) 39± 8a 42± 19a 26± 13a 43± 141,A∗
Bulk density (gcm−3) 1.0± 0.0ab 0.9± 0.0b 1.1± 0.1a 1.1± 0.1a,A
pH (1 : 4 H2O) 4.3± 0.0b∗ 4.3± 0.0b∗,B 4.5± 0.1ab∗ 4.5± 0.1a∗
Soil organic C (kgCm−2) 2.6± 0.2a 2.7± 0.3a,B 2.0± 0.3a 1.8± 0.2a,B
Total N (gm−2) 182.9± 10.8a 186.19± 11.0a,B 172.6± 23.8a 145.0± 13.5a,B
C : N ratio 14.3± 0.2a 13.7± 0.8a 11.7± 0.7b,B 12.5± 0.5ab
Effective cation exchange capacity (mmol3 kg−1) 4.5± 0.5a 4.1± 0.8a,B 4.6± 0.5a 4.0± 0.8a,B
Base saturation (%) 11± 1b∗B 16± 2ab∗ 21± 8ab∗ 28± 5a∗
Aluminum saturation (%) 80± 1a,A 78± 2a 73± 8a 67± 5a
Bray-extractable phosphorus (gPm−2) 0.5± 0.1aB 0.7± 0.1a 0.5± 0.1a 0.8± 0.1aB∗
15N natural abundance (‰) 4.3± 0.2b 4.5± 0.1b 5.0± 0.4ab 5.4± 0.3a
Net N mineralization (mgNkg−1 d−1) 0.8± 0.2a 0.7± 0.1a 0.7± 0.3a 0.5± 0.2a
Biogeosciences, 12, 5831–5852, 2015 www.biogeosciences.net/12/5831/2015/
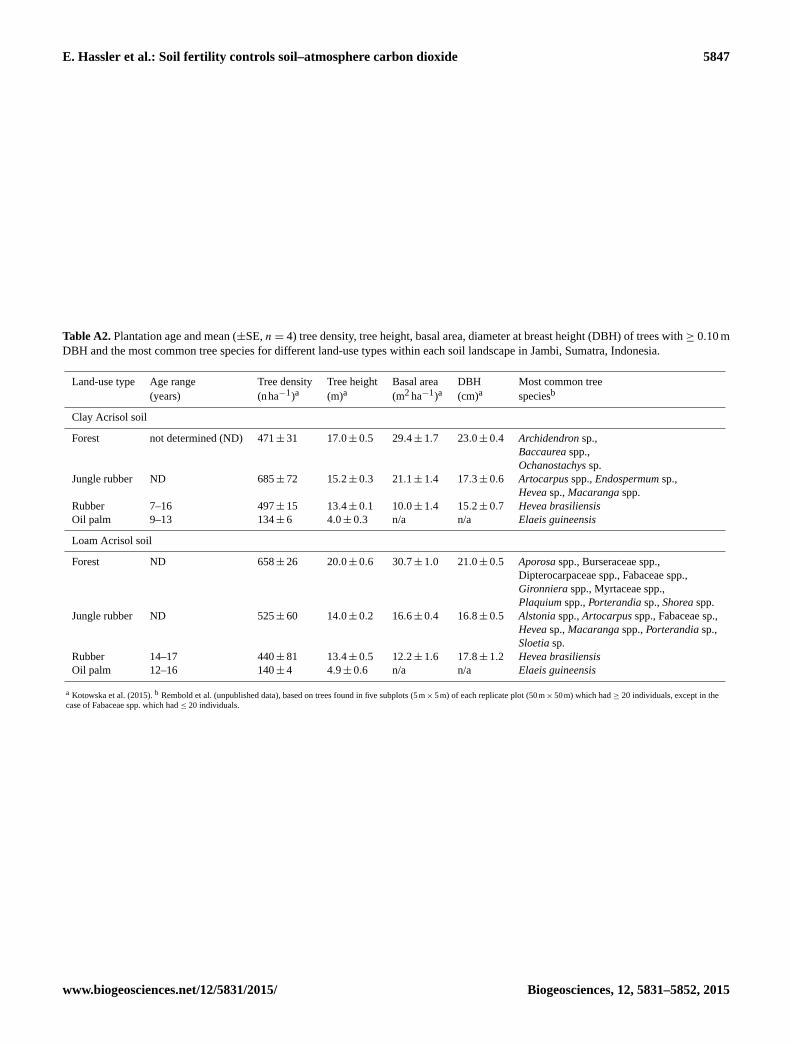
E. Hassler et al.: Soil fertility controls soil–atmosphere carbon dioxide 5847
Table A2. Plantation age and mean (±SE, n= 4) tree density, tree height, basal area, diameter at breast height (DBH) of trees with ≥ 0.10 m
DBH and the most common tree species for different land-use types within each soil landscape in Jambi, Sumatra, Indonesia.
Land-use type Age range Tree density Tree height Basal area DBH Most common tree
(years) (nha−1)a (m)a (m2 ha−1)a (cm)a speciesb
Clay Acrisol soil
Forest not determined (ND) 471± 31 17.0± 0.5 29.4± 1.7 23.0± 0.4 Archidendron sp.,
Baccaurea spp.,
Ochanostachys sp.
Jungle rubber ND 685± 72 15.2± 0.3 21.1± 1.4 17.3± 0.6 Artocarpus spp., Endospermum sp.,
Hevea sp., Macaranga spp.
Rubber 7–16 497± 15 13.4± 0.1 10.0± 1.4 15.2± 0.7 Hevea brasiliensis
Oil palm 9–13 134± 6 4.0± 0.3 n/a n/a Elaeis guineensis
Loam Acrisol soil
Forest ND 658± 26 20.0± 0.6 30.7± 1.0 21.0± 0.5 Aporosa spp., Burseraceae spp.,
Dipterocarpaceae spp., Fabaceae spp.,
Gironniera spp., Myrtaceae spp.,
Plaquium spp., Porterandia sp., Shorea spp.
Jungle rubber ND 525± 60 14.0± 0.2 16.6± 0.4 16.8± 0.5 Alstonia spp., Artocarpus spp., Fabaceae sp.,
Hevea sp., Macaranga spp., Porterandia sp.,
Sloetia sp.
Rubber 14–17 440± 81 13.4± 0.5 12.2± 1.6 17.8± 1.2 Hevea brasiliensis
Oil palm 12–16 140± 4 4.9± 0.6 n/a n/a Elaeis guineensis
a Kotowska et al. (2015). b Rembold et al. (unpublished data), based on trees found in five subplots (5 m× 5 m) of each replicate plot (50 m× 50 m) which had ≥ 20 individuals, except in the
case of Fabaceae spp. which had ≤ 20 individuals.
www.biogeosciences.net/12/5831/2015/ Biogeosciences, 12, 5831–5852, 2015

5848 E. Hassler et al.: Soil fertility controls soil–atmosphere carbon dioxide
Table A3. Mean (±SE, n= 3 oil palm trees) soil CO2 and CH4 fluxes from three different chamber locations during a fertilization in three
oil palm plantations within each soil landscape, measured 6 to 11 times during 3–8.5 weeks following fertilization. Means followed by
different letters indicate significant differences among chamber locations within each oil palm plantation site (linear mixed-effect models
with Fisher’s LSD test at P ≤ 0.05). Chamber locations a, b and c were placed at 0.3, 0.8, and 4–4.5 m, respectively, from each of the three
trees at each oil palm plantation site. Smallholders fertilized the area around the base of each tree about 0.8–1 m from the tree base, and thus
chamber location b was on this fertilized area and chamber location c serves as the reference chamber not receiving any fertilizer. The same
fertilization rate and form as applied by the smallholders were used in these studied oil palm plantations, described in Sect. 2.2 “CO2 and
CH4 flux measurement”.
Oil palm Chamber CO2 fluxes CH4 fluxes
plantation site location (mgCm−2 h−1) (µgCm−2 h−1)
Clay Acrisol soil
1 a 272.83± 36.68a−23.66± 2.56b
b 218.25± 25.91b−12.61± 5.12a
c 103.56± 11.72c−16.66± 8.68ab
2 a 226.16± 38.17a−28.44± 1.48b
b 246.39± 42.80a−6.64± 2.07a
c 86.04± 7.83b−10.60± 5.29a
3 a 222.56± 72.49b−8.13± 4.77a
b 311.63± 89.87a−10.38± 3.61a
c 105.49± 12.06c−14.49± 2.03a
Loam Acrisol soil
1 a 334.67± 32.12a−14.00± 3.31b
b 378.47± 50.97a−4.12± 2.24a
c 160.35± 20.48b−18.53± 1.32b
2 a 271.35± 17.31a−13.18± 1.22a
b 233.27± 18.98b−8.63± 0.52a
c 127.66± 17.13c−19.47± 5.08b
3 a 240.81± 23.12a−28.13± 3.40b
b 243.92± 24.23a−10.34± 2.70a
c 136.55± 19.08b−29.41± 2.39b
Biogeosciences, 12, 5831–5852, 2015 www.biogeosciences.net/12/5831/2015/

E. Hassler et al.: Soil fertility controls soil–atmosphere carbon dioxide 5849
Appendix B
Figure B1. Mean (±SE, n= 3 oil palm trees) soil CH4 fluxes dur-
ing a fertilization at one oil palm plantation site in the clay Acrisol
soil (N) and loam Acrisol soil (•). Smallholders fertilized the area
around the base of each tree at about 0.8–1 m from the tree base, and
fluxes were measured on this fertilized location (chamber location
b) at the same rate and form that smallholders applied in these oil
palm plantations (described in Sect. 2.2 “CO2 and CH4 flux mea-
surement”).
www.biogeosciences.net/12/5831/2015/ Biogeosciences, 12, 5831–5852, 2015

5850 E. Hassler et al.: Soil fertility controls soil–atmosphere carbon dioxide
Acknowledgements. We thank the village leaders, local plot
owners, PT REKI, PT Perkebunan Nusantara VI, and Bukit
Duabelas National Park for granting us access to and use of their
properties. This study was financed by the Deutsche Forschungs-
gemeinschaft (DFG) as part of the project A05 in the framework
of the German–Indonesian Collaborative Research Center 990:
Ecological and Socioeconomic Function of Tropical Lowland
Rainforest Transformation Systems. We are especially grateful
to our Indonesian assistants, Edward Januarlin Siahaan, Nelson
Apriadi Silalahi, Ardi, Fahrurrozy and Edi, as well as all the
rangers of the protected forest areas. We also acknowledge the
other members of project A05 (Allen et al., 2015; Kurniawan et
al., unpublished data) for the soil physical and biochemical data
(Table A1); projects B04 (Kotowska et al., 2015), B06 (Rembold
et al., unpublished data) and B07 (Sahner et al., 2015) for the
litterfall and root production, root nutrient concentrations and
vegetation characteristics (Table A2); and project C07 (Euler
et al., unpublished data) for information on land-use history.
We also thank Norman Loftfield, Oliver van Straaten, Andrea
Bauer, Kerstin Langs and Martina Knaust (Georg August Uni-
versity Göttingen, Germany) for their assistance with laboratory
analyses. This study was conducted using the research permits
(210/SIP/FRP/SM/VI/2012 and 45/EXT/SIP/FRP/SM/V/2013)
issued by the Ministry of Research and Technology of Indonesia
(RISTEK) and the collection permits (2703/IPH.1/KS.02/XI/2012
and S.13/KKH-2/2013) recommended by the Indonesian Institute
of Sciences (LIPI) and issued by the Ministry of Forestry of
Indonesia (PHKA).
This open-access publication was funded
by the University of Göttingen.
Edited by: M. Williams
References
Adachi, M., Bekku, Y. S., Konuma, A., Kadir, W. R., Okuda, T.,
and Koizumi, H.: Required sample size for estimating soil respi-
ration rates in large areas of two tropical forests and of two types
of plantation in Malaysia, Forest Ecol. Manag., 210, 455–459,
2005.
Allen, K., Corre, M. D., Tjoa, A., and Veldkamp, E.: Soil nitrogen-
cycling responses to conversion of lowland forests to oil palm
and rubber plantations in Sumatra, Indonesia, PLoS ONE, 10,
e0133325. doi:10.1371/journal.pone.0133325, 2015.
Arnold, J., Corre, M. D., and Veldkamp, E.: Cold storage and labo-
ratory incubation of intact soil cores do not reflect in-situ nitro-
gen cycling rates of tropical forest soils, Soil Biol. Biochem., 40,
2480–2483, 2008.
Baldos, A. P., Corre, M. D., and Veldkamp, E.: Response of N cy-
cling to nutrient inputs in forest soils across a 1000–3000m ele-
vation gradient in the Ecuadorian Andes, Ecology, 96, 749–761,
2015.
Bodelier, P. L. E. and Laanbroek, H. J.: Nitrogen as a regulatory
factor of methane oxidation in soils and sediments, FEMS Mi-
crobiol. Ecol., 47, 265–277, 2004.
BPS (Badan Pusat Statistik): Statistical Oce of Jambi
Province, available at: http://jambi.bps.go.id/index.
php?option=com_content&view=article&id=164:
jambi-dalamangka-2011&catid=5:publikasi-buku&Itemid=30
(last access: 8 January 2014), 2012.
Carlson, K. M., Curran, L. M., Asner, G. P., Pittman, A. M., Trigg,
S. N., and Marion Adeney, J.: Carbon emissions from forest
conversion by Kalimantan oil palm plantations, Nature Climate
Change, 3, 283–287, 2013.
Clay, J.: World Agriculture and the Environment: a Commodity-By-
Commodity Guide to Impacts and Practices, Island Press, Wash-
ington DC, USA, 2013.
Crawley, M. J.: The R Book, John Wiley & Sons Ltd, Chichester,
UK, 2009.
Danielsen, F., Beukema, H., Burgess, N. D., Parish, F., Bruehl, C.
A., Donald, P. F., Murdiyarso, D., Phalan, B., Reijnders, L., and
Struebig, M.: Biofuel plantations on forested lands: double jeop-
ardy for biodiversity and climate, Conserv. Biol., 23, 348–358,
2009.
Davidson, E. A., Verchot, L. V., Cattanio, J. H., Ackerman, I. L.,
and Carvalho, J. E. M.: Effects of soil water content on soil res-
piration in forests and cattle pastures of eastern Amazonia, Bio-
geochemistry, 48, 53–69, 2000.
Dechert, G., Veldkamp, E., and Anas, I.: Is soil degradation unre-
lated to deforestation?, Examining soil parameters of land use
systems in upland Central Sulawesi, Indonesia, Plant Soil, 265,
197–209, 2004.
FAO, IIASA, ISRIC, ISS-CAS, and JRC: Harmonized World Soil
Database (version 1.1), FAO, Rome, Italy & IIASA, Laxenburg,
Austria, 2009.
Food and Agricultural Organization: FAOSTAT Database, avail-
able at: http://faostat.fao.org/site/339/default.aspx (last access: 5
November 2014), 2014.
Gouyon, A., de Foresta, H., and Levang, P.: Does “jungle rubber”
deserve its name?, An analysis of rubber agroforestry systems in
southeast Sumatra, Agroforest. Syst., 22, 181–206, 1993.
Hedin, L. O., Brookshire, E. N. J., Menge, D. N. L., and Barron,
A. R.: The nitrogen paradox in tropical forest ecosystems, Annu.
Rev. Ecol. Evol. S., 40, 613–635, 2009.
Indonesian Ministry of Agriculture: Statistical Yearbook of Crops
for 2009–2013, Directorate General of Estate Crops, Jakarta,
2014.
IPCC: Climate Change 2007: The Physical Science Basis, Contribu-
tion of Working Group I to the Fourth Assessment Report of the
Intergovernmental Panel on Climate Change, Cambridge Univer-
sity Press, Cambridge, UK, New York, USA, 2007.
Ishizuka, S., Tsuruta, H., and Murdiyarso, D.: An intensive field
study on CO2, CH4, and N2O emissions from soils at four land-
use types in Sumatra, Indonesia, Global Biogeochem. Cy., 16,
22-1–22-11 doi:10.1029/2001GB001614, 2002.
Ishizuka, S., Iswandi, A., Nakajima, Y., Yonemura, S., Sudo, S.,
Tsuruta, H., and Murdiyarso, D.: The variation of greenhouse
gas emissions from soils of various land-use/cover types in Jambi
province, Indonesia, Nutr. Cycl. Agroecosys., 71, 17–32, 2005.
Keller, M. and Reiners, W. A.: Soil–atmosphere exchange of nitrous
oxide, nitric oxide and methane under secondary succession of
pasture to forest in the Atlantic lowlands of Costa Rica, Global
Biogeochem. Cy., 8, 399–409, 1994.
Biogeosciences, 12, 5831–5852, 2015 www.biogeosciences.net/12/5831/2015/
E. Hassler et al.: Soil fertility controls soil–atmosphere carbon dioxide 5851
Keller, M., Veldkamp, E., Weitz, A. M., and Reiners, W. A.: Effect
of pasture age on soil trace gas emissions from a deforested area
of Costa Rica, Nature, 365, 244–246, 1993.
Keller, M., Varner, R., Dias, J. D., Silva, H., Crill, P., and de
Oliveira, R. C.: Soil–atmosphere exchange of nitrous oxide, ni-
tric oxide, methane, and carbon dioxide in logged and undis-
turbed forest in the Tapajos National Forest, Brazil, Earth Inter-
act., 9, 1–28, 2005.
Klinge, R., Martins, A. R. A., Mackensen, J., and Folster, H.: Ele-
ment loss on rain forest conversion in East Amazonia: compari-
son of balances of stores and fluxes, Biogeochemistry, 69, 63–82,
2004.
Koehler, B., Corre, M. D., Veldkamp, E., and Sueta, J. P.: Chronic
nitrogen addition causes a reduction in soil carbon dioxide efflux
during the high stem-growth period in a tropical montane forest
but no response from a tropical lowland forest on a decadal time
scale, Biogeosciences, 6, 2973–2983, doi:10.5194/bg-6-2973-
2009, 2009.
Koh, L. P. and Ghazoul, J.: Spatially explicit scenario analysis for
reconciling agricultural expansion, forest protection, and carbon
conservation in Indonesia, P. Natl. Acad. Sci. USA, 107, 11140–
11144, 2010.
Kotowska, M. M., Leuschner, C., Triadiati, T., Meriem, S.,
and Hertel, D.: Quantifying above and belowground biomass
carbon loss with forest conversion in tropical lowlands of
Sumatra (Indonesia), Glob. Change Biol., 21, 3620–3634,
doi:10.1111/gcb.12979, 2015.
Laumonier, Y., Uryu, Y., Stüwe, M., Budiman, A., Setiabudi, B.,
and Hadian, O.: Eco-floristic sectors and deforestation threats
in Sumatra: identifying new conservation area network priorities
for ecosystem-based land use planning, Biodivers. Conserv., 19,
1153–1174, 2010.
Ma, J. F., Ryan, P. R., and Delhaize, E.: Aluminium tolerance in
plants and the complexing role of organic acids, Trends Plant
Sci., 6, 273–278, 2001.
Margono, B. A., Turubanova, S., Zhuravleva, I., Potapov, P.,
Tyukavina, A., Baccini, A., Goetz, S., and Hansen, M. C.: Map-
ping and monitoring deforestation and forest degradation in
Sumatra (Indonesia) using Landsat time series data sets from
1990 to 2010, Environ. Res. Lett., 7, 034010, doi:10.1088/1748-
9326/7/3/034010, 2012.
Melling, L., Hatano, R., and Goh, K. J.: Methane fluxes from three
ecosystems in tropical peatland of Sarawak, Malaysia, Soil Biol.
Biochem., 37, 1445–1453, 2005a.
Melling, L., Hatano, R., and Goh, K. J.: Soil CO2 flux from three
ecosystems in tropical peatland of Sarawak, Malaysia, Tellus B,
57, 1–11, 2005b.
Ohashi, M., Kumagai, T. O., Kume, T., Gyokusen, K., Saitoh, T. M.,
and Suzuki, M.: Characteristics of soil CO2 efflux variability in
an aseasonal tropical rainforest in Borneo Island, Biogeochem-
istry, 90, 275–289, 2008.
R Development Core Team: R: a Language and Environment For
Statistical Computing, R Foundation for Statistical Computing,
Vienna, Austria, 2013.
Raich, J. W. and Schlesinger, W. H.: The global carbon dioxide flux
in soil respiration and its relationship to vegetation and climate,
Tellus B, 44, 81–99, 1992.
Sahner, J., Budi, S. W., Barus, H., Edy, N., Meyer, M., Corre, M.
D., and Polle, A.: Degradation of root community traits as in-
dicator for transformation of tropical lowland rain forests into
oil palm and rubber plantations, PLoS ONE, 10, e0138077,
doi:10.1371/journal.pone.013807, 2015.
Salimon, C., Davidson, E., Victoria, R., and Melo, A.: CO2 flux
from soil in pastures and forests in southwestern Amazonia,
Glob. Change Biol., 10, 833–843, 2004.
Schwendenmann, L., Veldkamp, E., Brenes, T., O’Brien, J. J., and
Mackensen, J.: Spatial and temporal variation in soil CO2 efflux
in an old-growth neotropical rain forest, La Selva, Costa Rica,
Biogeochemistry, 64, 111–128, 2003.
Seiler, W., Conrad, R., and Scharffe, D.: Field studies of methane
emission from termite nests into the atmosphere and measure-
ments of methane uptake by tropical soils, J. Atmos. Chem., 1,
171–186, 1984.
Sheng, H., Yang, Y., Yang, Z., Chen, G., Xie, J., Guo, J., and Zou,
S.: The dynamic response of soil respiration to land-use changes
in subtropical China, Glob. Change Biol., 16, 1107–1121, 2010.
Sotta, E. D., Veldkamp, E., Guimarães, B. R., Paixão, R. K., Ruivo,
M. L. P., and Almeida, S. S.: Landscape and climatic controls on
spatial and temporal variation in soil CO2 efflux in an Eastern
Amazonian Rainforest, Caxiuanã, Brazil, Forest Ecol. Manag.,
237, 57–64, 2006.
Sotta, E. D., Veldkamp, E., Schwendenmann, L., Guimarães, B. R.,
Paixão, R. K., Ruivo, M. D. L. P., Lola da Costa, A. C., and Meir,
P.: Effects of an induced drought on soil carbon dioxide (CO2)
efflux and soil CO2 production in an Eastern Amazonian rainfor-
est, Brazil, Glob. Change Biol., 13, 2218–2229, 2007.
Sotta, E. D., Corre, M. D., and Veldkamp, E.: Differing N status and
N retention processes of soils under old-growth lowland forest in
Eastern Amazonia, Caxiuanã, Brazil, Soil Biol. Biochem., 40,
740–750, 2008.
Tamai, N., Takenaka, C., Ishizuka, S., and Tezuka, T.: Methane flux
and regulatory variables in soils of three equal-aged Japanese cy-
press (Chamaecyparis obtusa) forests in central Japan, Soil Biol.
Biochem., 35, 633–641, 2003.
van Straaten, O., Veldkamp, E., and Corre, M. D.: Simulated
drought reduces soil CO2 efflux and production in a tropical for-
est in Sulawesi, Indonesia, Ecosphere, 2, 119, doi:10.1890/ES11-
00079.1, 2011.
van Straaten, O., Corre, M. D., Wolf, K., Tchienkoua, M., Cuellar,
E., Matthews, R. B., and Veldkamp, E.: Conversion of lowland
tropical forests to tree cash crop plantations loses up to one-half
of stored soil organic carbon, carbon. P. Natl. Acad. Sci. USA,
112, 9956–9960, 2015.
Veldkamp, E., Weitz, A. M., and Keller, M.: Management effects
on methane fluxes in humid tropical pasture soils, Soil Biol.
Biochem., 33, 1493–1499, 2001.
Veldkamp, E., Purbopuspito, J., Corre, M. D., Brumme, R., and
Murdiyarso, D.: Land use change effects on trace gas fluxes in
the forest margins of Central Sulawesi, Indonesia, J. Geophys.
Res.-Biogeo., 113, G02003, doi:10.1029/2007JG000522, 2008.
Veldkamp, E., Koehler, B., and Corre, M. D.: Indications of
nitrogen-limited methane uptake in tropical forest soils, Biogeo-
sciences, 10, 5367–5379, doi:10.5194/bg-10-5367-2013, 2013.
Verchot, L. V., Davidson, E. A., Cattanio, J. H., and Ackerman, I. L.:
Land-use change and biogeochemical controls of methane fluxes
in soils of eastern Amazonia, Ecosystems, 3, 41–56, 2000.
Werner, C., Zheng, X., Tang, J., Xie, B., Liu, C., Kiese, R., and
Butterbach-Bahl, K.: N2O, CH4 and CO2 emissions from sea-
www.biogeosciences.net/12/5831/2015/ Biogeosciences, 12, 5831–5852, 2015

5852 E. Hassler et al.: Soil fertility controls soil–atmosphere carbon dioxide
sonal tropical rainforests and a rubber plantation in Southwest
China, Plant Soil, 289, 335–353, 2006.
Wolf, K., Flessa, H., and Veldkamp, E.: Atmospheric methane up-
take by tropical montane forest soils and the contribution of or-
ganic layers, Biogeochemistry, 111, 469–483, 2012.
Biogeosciences, 12, 5831–5852, 2015 www.biogeosciences.net/12/5831/2015/