Embed Size (px)
Citation preview
Seismic dynamics of offshore breakwater on liquefiableseabed foundation
Jianhong Ye a,1, Gang Wang b,n
a State Key Laboratory of Geomechanics and Geotechnical Engineering, Institute of Rock and Soil Mechanics, Chinese Academy of Sciences,Wuhan 430071, Chinab Department of Civil and Environmental Engineering, Hong Kong University of Science and Technology Clear Water Bay, Kowloon, Hong Kong SAR, China
a r t i c l e i n f o
Article history:Received 10 July 2014Received in revised form13 November 2014Accepted 1 February 2015Available online 18 February 2015
Keywords:Offshore breakwaterNumerical simulationSeabed–structure interactionLiquefactionSeismic dynamics
a b s t r a c t
Offshore structures, such as composite breakwaters, are generally vulnerable to strong seismic wavepropagating through loose or medium-dense seabed foundation. However, the seismically inducedfailure process of offshore structures is not well understood. In this study, seismic dynamics of acomposite breakwater on liquefiable seabed foundation is investigated using a fully coupled numericalmodel FSSI-CAS 2D. The computation results show that the numerical model is capable of capturing avariety of nonlinear interaction phenomena between the composite breakwater and its seabedfoundation. The numerical investigation demonstrates a three-stage failure process of the breakwaterunder seismic loading. In this process, the far-field seabed can become fully liquefied first, inducingexcessive settlement of the structure, followed by significant lateral movement and tilting of thestructure when the near-field soil progressively liquefies. The study demonstrates great promise of usingadvanced numerical analysis in geotechnical earthquake design of offshore structures.
& 2015 Elsevier Ltd. All rights reserved.
1. Introduction
Composite breakwaters have beenwidely constructed as a kind ofcoastal defense structure to protect ports and harbors. Engineersmainly concern about the stability of these offshore structures underenvironmental loading, such as ocean waves and earthquakes. Adetailed review on the dynamic response of breakwaters under waveloading can be found in [1]. On the other hand, devastating damageto offshore structures has been recorded in the past earthquakes,including failure of offshore structures in Los Angeles (USA) in 1994,Kobe (Japan) in 1995, Kocaeli (Turkey) in 1999, Athens (Greece) in1999 and Sumatra (Indonesia) in 2003 for examples [2–7]. Therefore,seismic analysis should be well considered for important offshorestructures built in active seismic regions.
To date, experimental and numerical investigations on seismicdynamics of offshore structures are still limited. Among limitedliterature, Yuksel et al. [6] analyzed the earthquake-induced defor-mation of a breakwater at the Eregli Fishery port during the 1999Koceali Turkey earthquake. Kiara et al. [8] and Memos et al. [9]conducted a series of experimental tests to investigate the seismicresponse and stability of a rubble-mound breakwater on a shakingtable. In their experiment, they found the response acceleration is
negatively correlated to the buried depth in sandy bed, and the sandybed deformation played a dominant role in breakwater failure.Numerical analysis was also performed in their study, where thedynamic water pressure acting on outer surface of the rubble-moundbreakwater was considered using Westerggard formulation. Similarshaking table tests were also conducted by Ozaki and Nagao [10].Mohajeri et al. Earthquake-induced sliding displacement of a caissonwall was also studied in a shaking table test [11].
Based on the work of [8,9], numerical analysis of seismic resp-onse of a rubble-mound breakwater was performed using a couplednumerical model [12]. However, the input excitation is only aharmonic motion, not a real seismic wave. The finite differenceprogram FLAC2D was also adopted to estimate the permanent dis-placement of a rubble-mound breakwater on a sandy bed underseismic wave loading [13]. In their study, the Mohr–Coulomb con-stitutive model and the pore pressure built-up model proposed in[14] were used. Obviously, soils and pore water are not coupled intheir analysis. Recently, deformation of a rubble-mound breakwaterunder horizontal harmonic motion was also experimentally andnumerically investigated [15]. However, the seabed foundation isnot considered as a part of the analysis.
In engineering practice, newly deposited Quaternary sedimentsare often encountered in offshore areas, and a great number ofoffshore structures have been constructed on these materials.Under seismic loading, the seabed foundation may liquefy due toprogressive build up of residual pore pressure. As a result, theoverlying offshore structures could translate, tilt, or even collapse.
Contents lists available at ScienceDirect
journal homepage: www.elsevier.com/locate/soildyn
Soil Dynamics and Earthquake Engineering
http://dx.doi.org/10.1016/j.soildyn.2015.02.0030267-7261/& 2015 Elsevier Ltd. All rights reserved.
n Corresponding author.E-mail address: [email protected] (G. Wang).
1 Formerly at HKUST.
Soil Dynamics and Earthquake Engineering 76 (2015) 86–99
Therefore, studying the liquefaction behaviors of the seabedfoundation is important in the seismic design of offshore struc-tures. In the past 30 years, significant progress has been made toadvance the state-of-the-art modeling of liquefiable soils [17–23].However, these advanced models have not yet been used to studythe nonlinear interaction mechanism of offshore structures withseabed foundation. Most of the previous investigations on seismicdynamics of offshore structures used simple constitutive modelssuch as elastic [24,25] or Mohr–Coulomb model to model theseabed soil. These simple models are not capable of simulating thecomplicated nonlinear cyclic behaviors of soils and failure processof offshore structures. Intensive nonlinear interaction betweenseabed foundation and the structure can not be effectivelycaptured. Iai et al. [16] conducted effective stress analyses of portstructures in Kobe port during the Hyogoken–Nambu earthquakein 1995. The numerical analyses calculated that the compositebreakwater constructed on loose seabed soil settled about 2 mduring the event, which is consistent with the field observation.The work highlighted the importance of using effective stressanalyses with well-calibrated cyclic soil model to realisticallycapture the nonlinear structure–seabed interaction.
In this study, the seismic dynamics of a composite breakwater onliquefiable seabed foundation is investigated using a fully couplednumerical model FSSI-CAS 2D. An advanced soil constitutive model –Pastor-Zienkiewics Mark III (PZIII) [17] is used to describe thecomplicated nonlinear dynamic behavior of the seabed soil. Thevariation of void ratio and corresponding change in the permeabilityof the soil are considered in the simulation. Additionally, the hydro-static pressure acting on outer surface of the composite breakwaterand its seabed foundation is updated in real time in accordance to themovement of the composite breakwater and the deformation ofseabed foundation. A real recorded seismic wave off Pacific coast inthe event of March 11, 2011 Tohoku-Oki earthquake in Japan isadopted as the input motion. The computational results show that thecoupled numerical model FSSI-CAS 2D is capable of capturing theprogressive liquefaction of the far-field and near-field seabed soil, aswell as subsidence, translation and tilting of the composite break-water in the failure process.
2. Coupled numerical model: FSSI-CAS 2D
2.1. Governing equations
The dynamic Biot's equation, known as “u�p” approximationproposed in [26], is used to describe the dynamic response of theporous medium under earthquake loading. In this formulation, therelative displacements of pore fluid to soil particles are ignored, butthe acceleration of the pore water and soil particles are included:
∂σ0x
∂xþ∂τxz
∂z¼ �∂ps
∂xþρ
∂2us
∂t2; ð1Þ
∂τxz∂x
þ∂σ0z
∂zþρg ¼ �∂ps
∂zþρ
∂2ws
∂t2; ð2Þ
k∇2ps�γwnβ∂ps∂t
þkρf∂2ϵv∂t2
¼ γw∂ϵv∂t
; ð3Þ
where ðus;wsÞ are displacements of the soil in horizontal and verticaldirections, respectively; n is soil porosity; σ0
x and σ0z are effective
normal stresses in the horizontal and vertical directions, respectively;τxz is shear stress; ps is the pore water pressure; ρ¼ ρf nþρsð1�nÞ isthe average density of porous seabed; ρf is the fluid density; ρs issolid density; k is the Darcy's permeability; g is the gravitationalacceleration; γω is unit weight of the water and ϵv is the volumetricstrain. In Eq. (3), the compressibility of pore fluid β and the volume
strain ϵv are defined as
β¼ 1Kf
þ1�Srpw0
� �and ϵv ¼
∂us
∂xþ∂ws
∂z; ð4Þ
where Sr is the degree of saturation of seabed, pw0 is the absolutestatic pressure and Kf is the bulk modulus of pore water. In general,Kf ¼ 2:24� 106 kPa.
The finite element method is used to solve the above governingequations (1)–(3). The discretized governing equations are
M €uþKu�Qp¼ f ð1Þ ð5Þ
G €uþQT _uþS _pþHp¼ f ð2Þ ð6ÞThe Generalized Newmark pth order scheme for jth order
equation is adopted as the numerical integrator when solvingthe above discretized equations. The definition of coefficientmatrices M, K, Q, G, S, H, f ð1Þ, f ð2Þ, and the detailed informationfor the numerical method to solve the Biot's equation can be foundin [1,27–29]. In this seismic dynamics simulation, the stiffness-proportional Rayleigh damping model is applied for the purpose ofstabilizing the numerical results. In computation, α¼0, andβ¼0.0003 is chosen as used in [30]. In this study, large deforma-tion occurs in loose liquefiable seabed under the earthquakeshaking. The updated Lagrangian method is adopted to handlethe large deformation problem. The coordinates of nodes, variablesdependent on the effective stress history, such as void ratio e andpermeability k, are updated in each time step based on deforma-tion. Correspondingly, the coefficient matrices M, K, Q, G, S, H, f ð1Þ,f ð2Þ, as well as prescribed boundary values are also updated.
From the physics point of view, the void ratio e and related Darcy'spermeability k vary according to the deformation of granular materi-als. In most previous studies, this variation process is not consideredbased on the assumption of small deformation. In this study, largedeformation occurs in the seabed foundation under seismic loading.Therefore, variation of void ratio e and permeability k cannot beignored in the near-field region, i.e., the seabed foundation close tothe offshore breakwater. The practice of numerical implementation inthis study indicated that the void ratio and permeability should beupdated in each time step following the deformation of the soil.Otherwise, non-convergence may be encountered in the numericalanalysis. Using large deformation assumption, the void ratio e isupdated in each time step according to the following expression:
enþ1 ¼ ð1þenÞexpΔpQ
þΔϵv� �
�1 ð7Þ
where Q is the compressibility of pore water, Δp is the pore pressureincrement and Δϵv is the volumetric strain increment of the soil inthis time increment. Accordingly, Darcy's permeability k can beupdated [31]:
knþ1 ¼ Cfe3nþ1
1þenþ1ð8Þ
in which Cf is an empirical coefficient, depending on the dynamicviscosity, size and arrangement of soil particles. Recently, [32] alsoproposed a similar equation to relate e and k based on the fractalcharacteristics of pore space geometry. If the initial void ratio e0 andpermeability k0 are known, the empirical coefficient Cf can be back-calculated as [33]
Cf ¼ k01þe0e30
ð9Þ
2.2. Constitutive model: Pastor–Zienkiewics–Mark III
Based on classical plasticity theory [34], the constitutiverelationship for the effective stress and strain of the soil can be
J. Ye, G. Wang / Soil Dynamics and Earthquake Engineering 76 (2015) 86–99 87
written as
σ0ij ¼Dep
ijklϵkl ð10Þ
where ϵkl is the strain of soil, Depijkl is the elasto-plastic modulus:
Depijkl ¼De
ijkl�DeijmnmmnnstD
estkl
HL=UþnstDestklmkl
ð11Þ
where Deijkl ¼ 2G δikδjlþν=ð1�2νÞδijδkl
� �, G and ν are the elastic
shear modulus and Poisson's ratio, respectively. HL=U is the plasticmodulus at loading or unloading stage. mmn is a unit tensor for theplastic flow direction, nst is the unit tensor for loading or unloadingdirection. The above directional tensors are formulated as
mmn ¼∂g
∂σ0mn
� �∂g
∂σ0mn
��������
and nst ¼∂f∂σ0
st
� �∂f∂σ0
st
��������
ð12Þ
where ‖ � ‖ represents tensor norm, f and g are the yield functionand plastic potential function in stress space. An associated flowrule will be implied if f¼g. Otherwise, a non-associated flow rulewill be applied.
In this study, the elasto-plastic constitutive model PZIII, pro-posed by [17] based on the generalized plastic theory, is adoptedto describe the dynamic behavior of loose seabed foundationunder seismic wave. In PZIII, the yield surface function f andplastic potential surface function g are defined as
f ¼ q0 �Mf p0 1þ 1
αf
� �1� p0
p0f
!αf" #
¼ 0 ð13Þ
g¼ q0 �Mgp0 1þ 1αg
� �1� p0
p0g
!αg" #
¼ 0 ð14Þ
The plastic modulus at loading and unloading stage are definedas
HL ¼H0p0 1�q0=p0
ηf
!4
1�q0=p0
Mgþβ0β1 expð�β0ξÞ
� �q=p0
ηmax
� ��γDM
ð15Þ
HU ¼Hu0
Mg
ηu
� �γUfor
Mg
ηu
41
Hu0 forMg
ηu
r1
8>>><>>>:
ð16Þ
where the p0 and q0 is the mean effective stress and deviatoricstress, respectively. ηf ¼ ð1þ1=αf ÞMf , ηmax is the maximum stressratio (p0=q0), and ηu is the stress ratio at the unloading point. Mf,Mg, αf, αg, β0, β1, γ and γDM are the parameters describing theproperties of sandy soil. The detailed information about the PZIIImodel can be found in [17] and [28]. PZIII is an excellentconstitutive model to describe the behaviors of clay and sandysoil. Its reliability has been validated by a series of laboratory testsunder monotonic and cyclic loading [28].
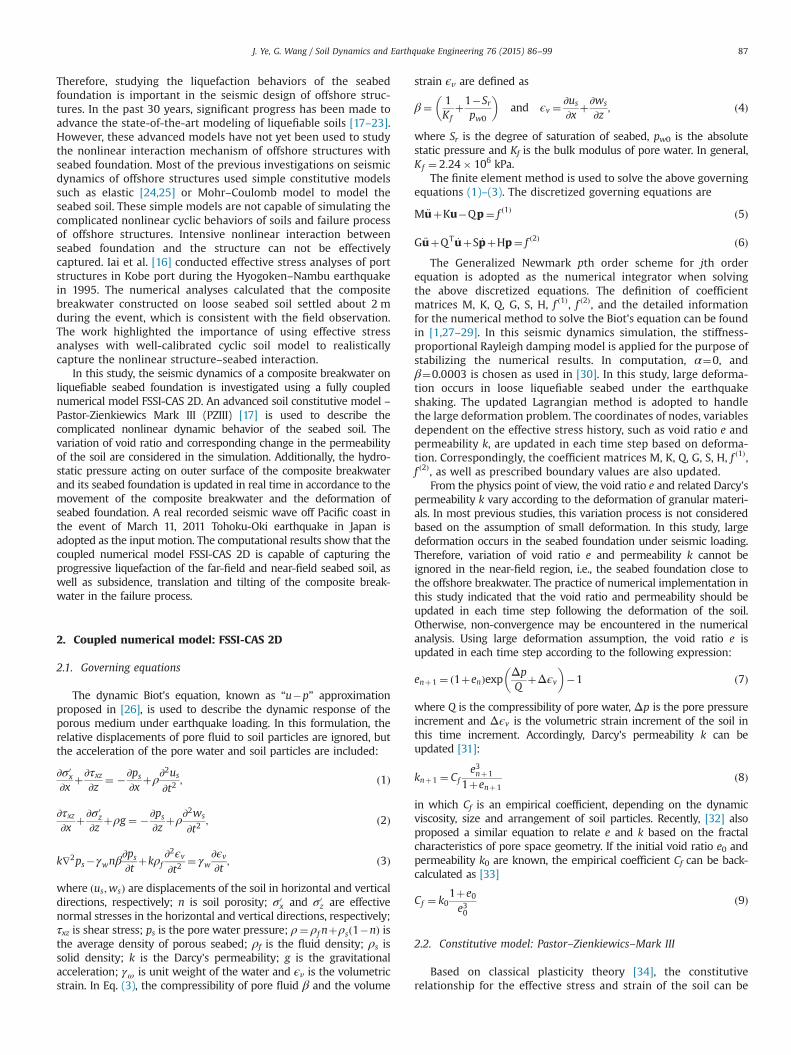
2.3. Computational domain, boundary condition and input seismicwave
The computational domain is shown in Fig. 1. It is assumed thata composite breakwater is constructed on seabed floor in theoffshore environment, consisting of a caisson and a rubble moundbeneath. The cassion is made of concrete, and can be practicallytreated as an impermeable rigid object; while the rubble mound ispermeable with a large void volume. The total length of thecomputational domain is 636 m. The distances from the break-water to lateral sides of the seabed foundation are both 300 m,
which is considered to be large enough to minimize the influenceof the lateral boundaries. In this study, the following boundaryconditions are applied in computation.
(1) The bottom of seabed foundation is treated as a rigid baseand it is impermeable:
us ¼ws ¼ 0 and∂ps∂z
¼ 0 at z¼ 0 ð17Þ
(2) Periodic boundary condition is applied at two lateral sidesof the computational domain:
us j x ¼ 0 m ¼ us j x ¼ 636 m; ws j x ¼ 0 m ¼ws j x ¼ 636 m;
ps j x ¼ 0 m ¼ ps j x ¼ 636 m ð18Þ(3) Hydrostatic pressure is applied on the surface of seabed and
the outer surface of the composite breakwater. All force inducedby the hydrostatic pressure is perpendicular to the surfaces.
It is noted that a constant water level is assumed in this study.Although seabed and structure vibration could generate smallwaves, dynamic pressure induced by the small wave can beneglected based on experimental tests conducted by Memoset al. [9]. In engineering practice, a large ocean wave is unlikelyto occur simultaneously with a strong earthquake. Therefore, thewave loading is not considered.
In this study, we consider variation of hydrostatic pressure actingon breakwater and its seabed foundation in large deformationprocess. Numerical results indicate that the breakwater could experi-ence horizontal translation up to 12 m, subsidence of 6 m, and tiltingof 15 1. The complex dynamics of the breakwater makes the hydro-static pressure acting on it and on its seabed foundation changesignificantly during seismic loading. The practice of numericalimplementation indicated that the numerical analysis will notconverge if the variation of hydrostatic pressure acting on thebreakwater and seabed foundation is not updated as boundaryvalues following the deformation of seabed and breakwater incomputation. In each time step, the hydrostatic pressure acting onbreakwater and its seabed foundation is updated as
ps ¼ ρf gðd0þdvÞ ð19Þ
where d0 is the initial water depth and dv is the vertical subsidence ofthe seabed surface and outer surface of the breakwater.
(4) Since the concrete cassion is impermeable, an upwardbuoyant force acts on the bottom of concrete caisson. Neglectingthis buoyant force leads to overestimation of the initial stresses inthe seabed foundation and subsidence of the breakwater [35,36].
In this study, real seismic waves recorded in the 2011 (Mw, 9.0)Tohoku earthquake are selected as the input motions. This seismo-graph station MYGH03 (141.6412E, 38.9178N) is located near Pacificcoast at an epicenter distance of 154 km, representing real seismicwaves propagating from the source to the offshore foundation. Inorder to capture the nonlinear soil responses and site amplification,wave traces recorded by the downhole seismograph are used. Base-line correction and noncasual butterworth filtering are applied to theacceleration time histories, with a high-pass frequency of 0.03 Hz
30m
300m 36m 300m
d=15m
1:1 1:1
6m
7 10 7
15m
x
z
O
Seabed
Cas
sion
Rubble mound1:11
6mF N
bS
Fig. 1. Computational domain and dimension for composite breakwater andseabed foundation system.
J. Ye, G. Wang / Soil Dynamics and Earthquake Engineering 76 (2015) 86–9988
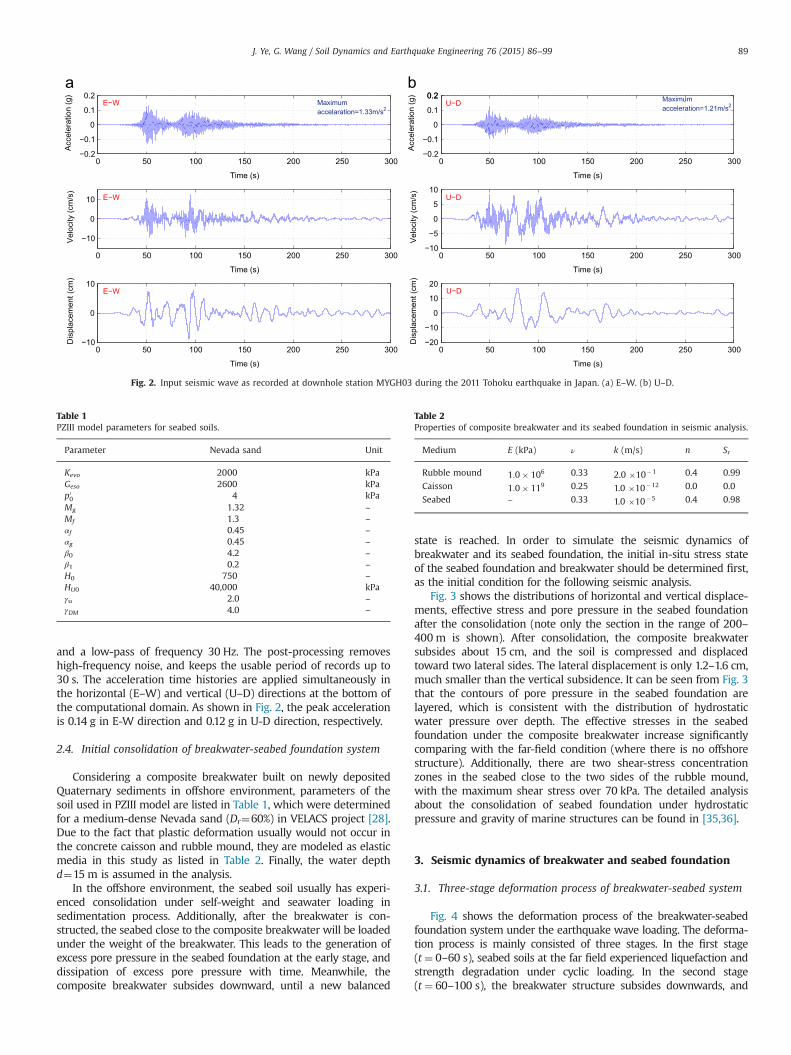
and a low-pass of frequency 30 Hz. The post-processing removeshigh-frequency noise, and keeps the usable period of records up to30 s. The acceleration time histories are applied simultaneously inthe horizontal (E–W) and vertical (U–D) directions at the bottom ofthe computational domain. As shown in Fig. 2, the peak accelerationis 0.14 g in E-W direction and 0.12 g in U-D direction, respectively.
2.4. Initial consolidation of breakwater-seabed foundation system
Considering a composite breakwater built on newly depositedQuaternary sediments in offshore environment, parameters of thesoil used in PZIII model are listed in Table 1, which were determinedfor a medium-dense Nevada sand (Dr¼60%) in VELACS project [28].Due to the fact that plastic deformation usually would not occur inthe concrete caisson and rubble mound, they are modeled as elasticmedia in this study as listed in Table 2. Finally, the water depthd¼15 m is assumed in the analysis.
In the offshore environment, the seabed soil usually has experi-enced consolidation under self-weight and seawater loading insedimentation process. Additionally, after the breakwater is con-structed, the seabed close to the composite breakwater will be loadedunder the weight of the breakwater. This leads to the generation ofexcess pore pressure in the seabed foundation at the early stage, anddissipation of excess pore pressure with time. Meanwhile, thecomposite breakwater subsides downward, until a new balanced
state is reached. In order to simulate the seismic dynamics ofbreakwater and its seabed foundation, the initial in-situ stress stateof the seabed foundation and breakwater should be determined first,as the initial condition for the following seismic analysis.
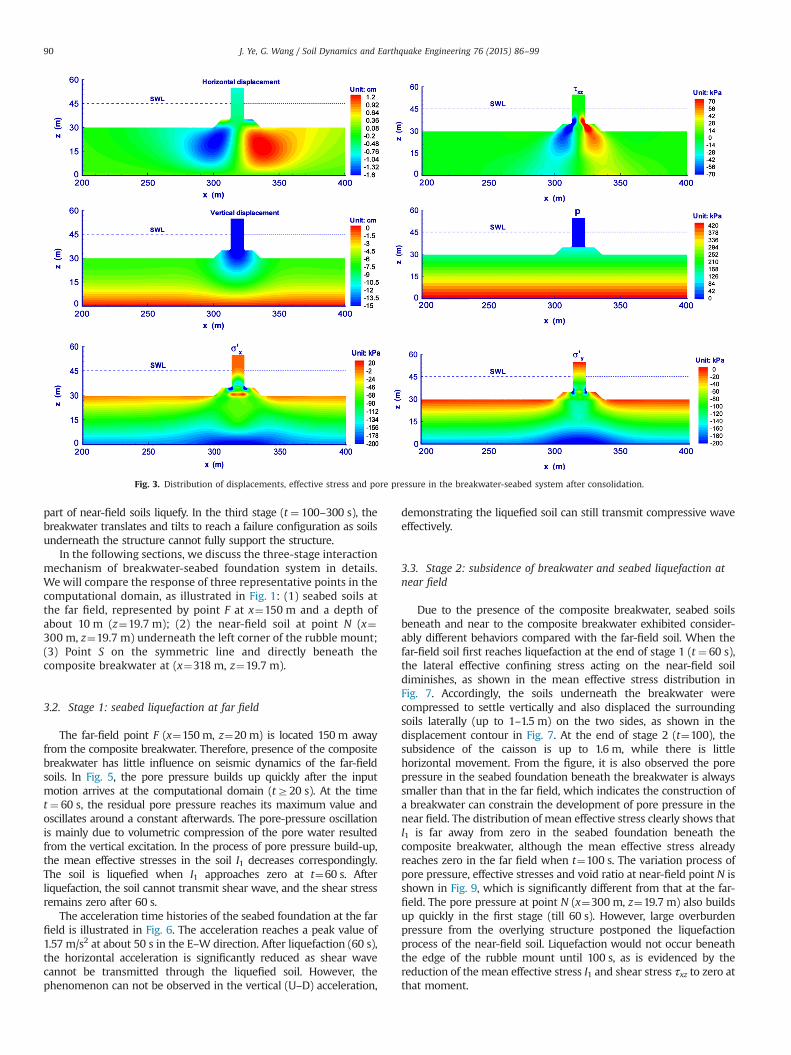
Fig. 3 shows the distributions of horizontal and vertical displace-ments, effective stress and pore pressure in the seabed foundationafter the consolidation (note only the section in the range of 200–400 m is shown). After consolidation, the composite breakwatersubsides about 15 cm, and the soil is compressed and displacedtoward two lateral sides. The lateral displacement is only 1.2–1.6 cm,much smaller than the vertical subsidence. It can be seen from Fig. 3that the contours of pore pressure in the seabed foundation arelayered, which is consistent with the distribution of hydrostaticwater pressure over depth. The effective stresses in the seabedfoundation under the composite breakwater increase significantlycomparing with the far-field condition (where there is no offshorestructure). Additionally, there are two shear-stress concentrationzones in the seabed close to the two sides of the rubble mound,with the maximum shear stress over 70 kPa. The detailed analysisabout the consolidation of seabed foundation under hydrostaticpressure and gravity of marine structures can be found in [35,36].
3. Seismic dynamics of breakwater and seabed foundation
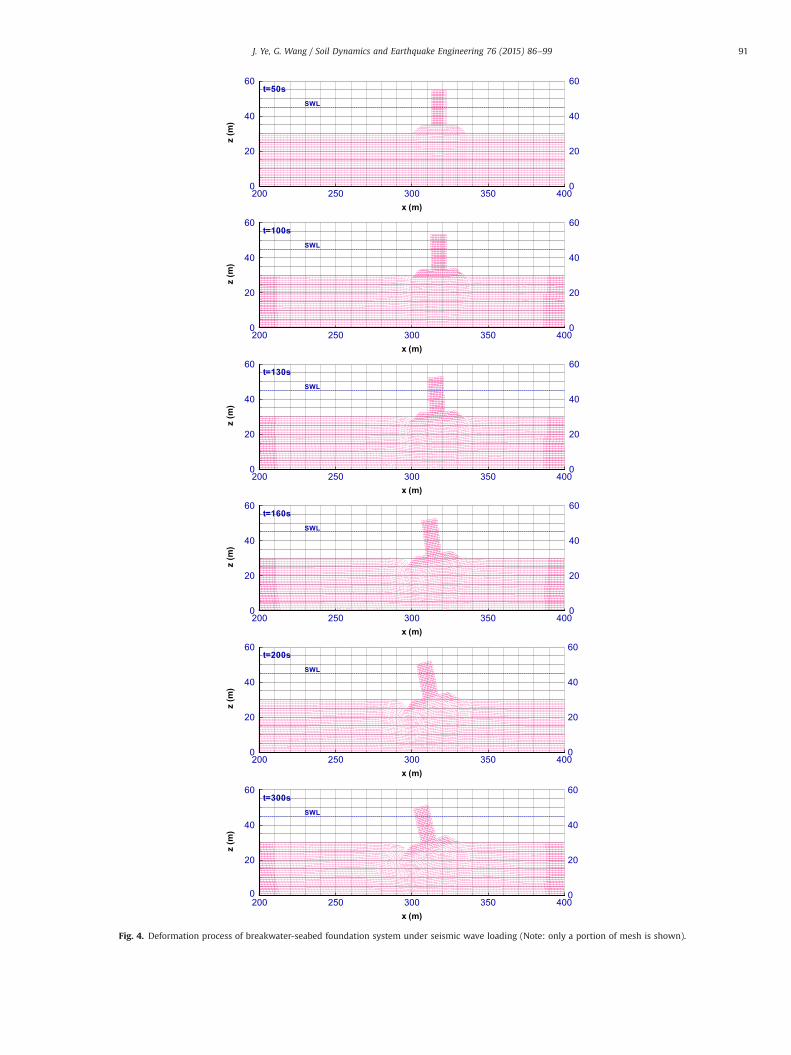
3.1. Three-stage deformation process of breakwater-seabed system
Fig. 4 shows the deformation process of the breakwater-seabedfoundation system under the earthquake wave loading. The deforma-tion process is mainly consisted of three stages. In the first stage(t ¼ 0–60 s), seabed soils at the far field experienced liquefaction andstrength degradation under cyclic loading. In the second stage(t ¼ 60–100 s), the breakwater structure subsides downwards, and
0 50 100 150 200 250 300−0.2
−0.1
0
0.1
0.2
Time (s)
Acc
eler
atio
n (g
)
0 50 100 150 200 250 300
−10
0
10
Time (s)
Vel
ocity
(cm
/s)
0 50 100 150 200 250 300−10
0
10
Time (s)
Dis
plac
emen
t (cm
)
0 50 100 150 200 250 300−0.2
−0.1
0
0.1
0.20.2
Time (s)
Acc
eler
atio
n (g
)
0 50 100 150 200 250 300−10
−5
0
5
10
Time (s)
Vel
ocity
(cm
/s)
0 50 100 150 200 250 300−20
−10
0
10
20
Time (s)
Dis
plac
emen
t (cm
)
Fig. 2. Input seismic wave as recorded at downhole station MYGH03 during the 2011 Tohoku earthquake in Japan. (a) E–W. (b) U–D.
Table 1PZIII model parameters for seabed soils.
Parameter Nevada sand Unit
Kevo 2000 kPaGeso 2600 kPap00 4 kPaMg 1.32 –
Mf 1.3 –
αf 0.45 –
αg 0.45 –
β0 4.2 –
β1 0.2 –
H0 750 –
HU0 40,000 kPaγu 2.0 –
γDM 4.0 –
Table 2Properties of composite breakwater and its seabed foundation in seismic analysis.
Medium E (kPa) ν k (m/s) n Sr
Rubble mound 1:0� 106 0.33 2.0 �10�1 0.4 0.99
Caisson 1:0� 119 0.25 1.0 �10�12 0.0 0.0
Seabed – 0.33 1.0 �10�5 0.4 0.98
J. Ye, G. Wang / Soil Dynamics and Earthquake Engineering 76 (2015) 86–99 89
part of near-field soils liquefy. In the third stage (t ¼ 100–300 s), thebreakwater translates and tilts to reach a failure configuration as soilsunderneath the structure cannot fully support the structure.
In the following sections, we discuss the three-stage interactionmechanism of breakwater-seabed foundation system in details.We will compare the response of three representative points in thecomputational domain, as illustrated in Fig. 1: (1) seabed soils atthe far field, represented by point F at x¼150 m and a depth ofabout 10 m (z¼19.7 m); (2) the near-field soil at point N (x¼300 m, z¼19.7 m) underneath the left corner of the rubble mount;(3) Point S on the symmetric line and directly beneath thecomposite breakwater at (x¼318 m, z¼19.7 m).
3.2. Stage 1: seabed liquefaction at far field
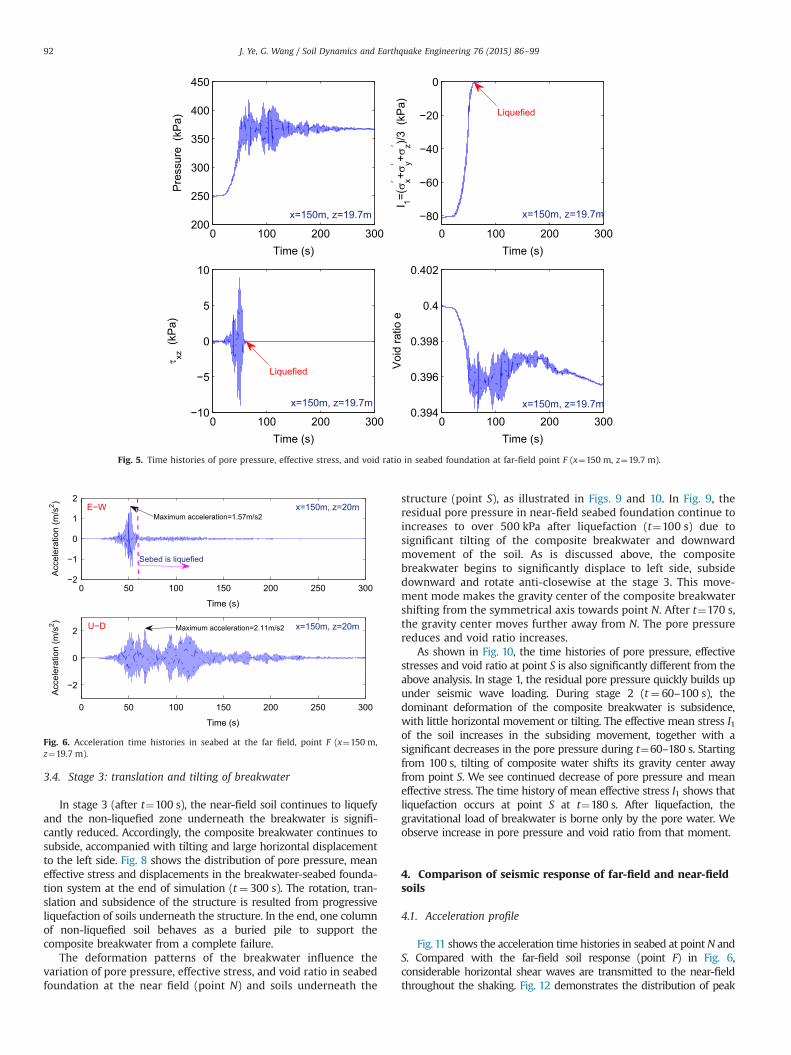
The far-field point F (x¼150m, z¼20m) is located 150m awayfrom the composite breakwater. Therefore, presence of the compositebreakwater has little influence on seismic dynamics of the far-fieldsoils. In Fig. 5, the pore pressure builds up quickly after the inputmotion arrives at the computational domain (tZ20 s). At the timet ¼ 60 s, the residual pore pressure reaches its maximum value andoscillates around a constant afterwards. The pore-pressure oscillationis mainly due to volumetric compression of the pore water resultedfrom the vertical excitation. In the process of pore pressure build-up,the mean effective stresses in the soil I1 decreases correspondingly.The soil is liquefied when I1 approaches zero at t¼60 s. Afterliquefaction, the soil cannot transmit shear wave, and the shear stressremains zero after 60 s.
The acceleration time histories of the seabed foundation at the farfield is illustrated in Fig. 6. The acceleration reaches a peak value of1.57 m/s2 at about 50 s in the E–Wdirection. After liquefaction (60 s),the horizontal acceleration is significantly reduced as shear wavecannot be transmitted through the liquefied soil. However, thephenomenon can not be observed in the vertical (U–D) acceleration,
demonstrating the liquefied soil can still transmit compressive waveeffectively.
3.3. Stage 2: subsidence of breakwater and seabed liquefaction atnear field
Due to the presence of the composite breakwater, seabed soilsbeneath and near to the composite breakwater exhibited consider-ably different behaviors compared with the far-field soil. When thefar-field soil first reaches liquefaction at the end of stage 1 (t ¼ 60 s),the lateral effective confining stress acting on the near-field soildiminishes, as shown in the mean effective stress distribution inFig. 7. Accordingly, the soils underneath the breakwater werecompressed to settle vertically and also displaced the surroundingsoils laterally (up to 1–1.5 m) on the two sides, as shown in thedisplacement contour in Fig. 7. At the end of stage 2 (t¼100), thesubsidence of the caisson is up to 1.6 m, while there is littlehorizontal movement. From the figure, it is also observed the porepressure in the seabed foundation beneath the breakwater is alwayssmaller than that in the far field, which indicates the construction ofa breakwater can constrain the development of pore pressure in thenear field. The distribution of mean effective stress clearly shows thatI1 is far away from zero in the seabed foundation beneath thecomposite breakwater, although the mean effective stress alreadyreaches zero in the far field when t¼100 s. The variation process ofpore pressure, effective stresses and void ratio at near-field point N isshown in Fig. 9, which is significantly different from that at the far-field. The pore pressure at point N (x¼300 m, z¼19.7 m) also buildsup quickly in the first stage (till 60 s). However, large overburdenpressure from the overlying structure postponed the liquefactionprocess of the near-field soil. Liquefaction would not occur beneaththe edge of the rubble mount until 100 s, as is evidenced by thereduction of the mean effective stress I1 and shear stress τxz to zero atthat moment.
Fig. 3. Distribution of displacements, effective stress and pore pressure in the breakwater-seabed system after consolidation.
J. Ye, G. Wang / Soil Dynamics and Earthquake Engineering 76 (2015) 86–9990
x (m)
z(m)
200 250 300 350 4000 0
20 20
40 40
60 60t=50s
SWL
x (m)
z(m)
200 250 300 350 4000 0
20 20
40 40
60 60t=100s
SWL
x (m)
z(m)
200 250 300 350 4000 0
20 20
40 40
60 60t=130s
SWL
x (m)
z(m)
200 250 300 350 4000 0
20 20
40 40
60 60t=160s
SWL
x (m)
z(m)
200 250 300 350 4000 0
20 20
40 40
60 60t=200s
SWL
x (m)
z(m)
200 250 300 350 4000 0
20 20
40 40
60 60t=300s
SWL
Fig. 4. Deformation process of breakwater-seabed foundation system under seismic wave loading (Note: only a portion of mesh is shown).
J. Ye, G. Wang / Soil Dynamics and Earthquake Engineering 76 (2015) 86–99 91
3.4. Stage 3: translation and tilting of breakwater
In stage 3 (after t¼100 s), the near-field soil continues to liquefyand the non-liquefied zone underneath the breakwater is signifi-cantly reduced. Accordingly, the composite breakwater continues tosubside, accompanied with tilting and large horizontal displacementto the left side. Fig. 8 shows the distribution of pore pressure, meaneffective stress and displacements in the breakwater-seabed founda-tion system at the end of simulation (t ¼ 300 s). The rotation, tran-slation and subsidence of the structure is resulted from progressiveliquefaction of soils underneath the structure. In the end, one columnof non-liquefied soil behaves as a buried pile to support thecomposite breakwater from a complete failure.
The deformation patterns of the breakwater influence thevariation of pore pressure, effective stress, and void ratio in seabedfoundation at the near field (point N) and soils underneath the
structure (point S), as illustrated in Figs. 9 and 10. In Fig. 9, theresidual pore pressure in near-field seabed foundation continue toincreases to over 500 kPa after liquefaction (t¼100 s) due tosignificant tilting of the composite breakwater and downwardmovement of the soil. As is discussed above, the compositebreakwater begins to significantly displace to left side, subsidedownward and rotate anti-closewise at the stage 3. This move-ment mode makes the gravity center of the composite breakwatershifting from the symmetrical axis towards point N. After t¼170 s,the gravity center moves further away from N. The pore pressurereduces and void ratio increases.
As shown in Fig. 10, the time histories of pore pressure, effectivestresses and void ratio at point S is also significantly different from theabove analysis. In stage 1, the residual pore pressure quickly builds upunder seismic wave loading. During stage 2 (t ¼ 60–100 s), thedominant deformation of the composite breakwater is subsidence,with little horizontal movement or tilting. The effective mean stress I1of the soil increases in the subsiding movement, together with asignificant decreases in the pore pressure during t¼60–180 s. Startingfrom 100 s, tilting of composite water shifts its gravity center awayfrom point S. We see continued decrease of pore pressure and meaneffective stress. The time history of mean effective stress I1 shows thatliquefaction occurs at point S at t¼180 s. After liquefaction, thegravitational load of breakwater is borne only by the pore water. Weobserve increase in pore pressure and void ratio from that moment.
4. Comparison of seismic response of far-field and near-fieldsoils
4.1. Acceleration profile
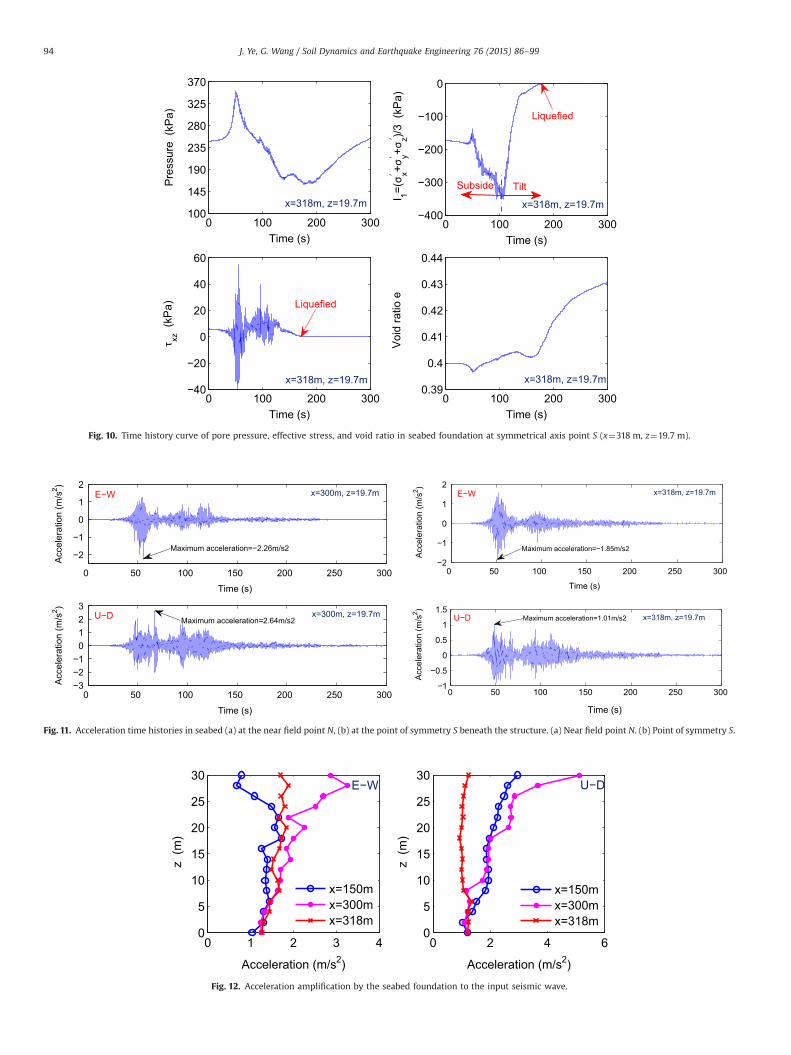
Fig.11 shows the acceleration time histories in seabed at pointN andS. Compared with the far-field soil response (point F) in Fig. 6,considerable horizontal shear waves are transmitted to the near-fieldthroughout the shaking. Fig. 12 demonstrates the distribution of peak
0 100 200 300200
250
300
350
400
450
Time (s)
Pre
ssur
e (k
Pa)
0 100 200 300−80
−60
−40
−20
0
Time (s)
I 1=(σ x+σ
y+σz)/3
(kP
a)
0 100 200 300−10
−5
0
5
10
Time (s)
τ xz (
kPa)
0 100 200 3000.394
0.396
0.398
0.4
0.402
Time (s)
Voi
d ra
tio e
x=150m, z=19.7m x=150m, z=19.7m
x=150m, z=19.7m x=150m, z=19.7m
Liquefied
Liquefied
′′
′
Fig. 5. Time histories of pore pressure, effective stress, and void ratio in seabed foundation at far-field point F (x¼150 m, z¼19.7 m).
0 50 100 150 200 250 300−2
−1
0
1
2
Time (s)
Acc
eler
atio
n (m
/s2 )
0 50 100 150 200 250 300
−2
0
2
Time (s)
Acc
eler
atio
n (m
/s2 )
x=150m, z=20mU−D
E−W x=150m, z=20m
Sebed is liquefied
Maximum acceleration=1.57m/s2
Maximum acceleration=2.11m/s2
Fig. 6. Acceleration time histories in seabed at the far field, point F (x¼150 m,z¼19.7 m).
J. Ye, G. Wang / Soil Dynamics and Earthquake Engineering 76 (2015) 86–9992
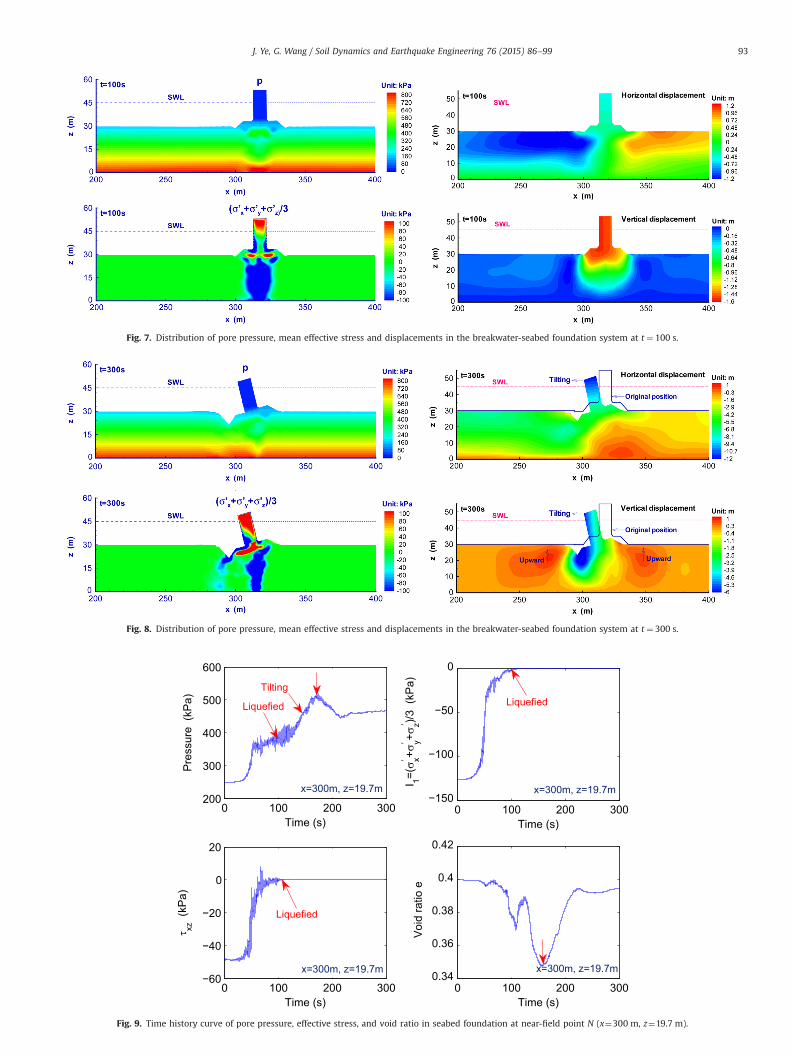
Fig. 7. Distribution of pore pressure, mean effective stress and displacements in the breakwater-seabed foundation system at t ¼ 100 s.
Fig. 8. Distribution of pore pressure, mean effective stress and displacements in the breakwater-seabed foundation system at t ¼ 300 s.
0 100 200 300200
300
400
500
600
Time (s)
Pre
ssur
e (k
Pa)
0 100 200 300−150
−100
−50
0
Time (s)
I 1=(σ x+ σ
y+σz)/3
(kP
a)
0 100 200 300−60
−40
−20
0
20
Time (s)
τ xz (
kPa)
0 100 200 3000.34
0.36
0.38
0.4
0.42
Time (s)
Voi
d ra
tio e
x=300m, z=19.7m
x=300m, z=19.7m
x=300m, z=19.7m
x=300m, z=19.7m
Liquefied
LiquefiedTilting
Liquefied
′′
′
Fig. 9. Time history curve of pore pressure, effective stress, and void ratio in seabed foundation at near-field point N (x¼300 m, z¼19.7 m).
J. Ye, G. Wang / Soil Dynamics and Earthquake Engineering 76 (2015) 86–99 93
0 100 200 300100
145
190
235
280
325
370
Time (s)
Pre
ssur
e (k
Pa)
0 100 200 300−400
−300
−200
−100
0
Time (s)
I 1=(σ x+σ
y+σz)/3
(kP
a)0 100 200 300
−40
−20
0
20
40
60
Time (s)
τ xz (
kPa)
0 100 200 3000.39
0.4
0.41
0.42
0.43
0.44
Time (s)
Voi
d ra
tio e
x=318m, z=19.7m
x=318m, z=19.7m
x=318m, z=19.7m
x=318m, z=19.7m
Liquefied
Liquefied
Subside Tilt
′′
′
Fig. 10. Time history curve of pore pressure, effective stress, and void ratio in seabed foundation at symmetrical axis point S (x¼318 m, z¼19.7 m).
0 50 100 150 200 250 300
−2
−1
0
1
2
Time (s)
Acc
eler
atio
n (m
/s2 )
0 50 100 150 200 250 300−3−2−1
0123
Time (s)
Acc
eler
atio
n (m
/s2 )
U−D
E−W x=300m, z=19.7m
x=300m, z=19.7m
Maximum acceleration=−2.26m/s2
Maximum acceleration=2.64m/s2
0 50 100 150 200 250 300−2
−1
0
1
2
Time (s)
Acc
eler
atio
n (m
/s2 )
0 50 100 150 200 250 300−1
−0.5
0
0.5
1
1.5
Time (s)
Acc
eler
atio
n (m
/s2 )
U−D
E−W
Maximum acceleration=−1.85m/s2
Maximum acceleration=1.01m/s2
x=318m, z=19.7m
x=318m, z=19.7m
Fig. 11. Acceleration time histories in seabed (a) at the near field point N, (b) at the point of symmetry S beneath the structure. (a) Near field point N. (b) Point of symmetry S.
0 1 2 3 40
5
10
15
20
25
30
z (m
)
Acceleration (m/s2)
0 2 4 60
5
10
15
20
25
30
z (m
)
Acceleration (m/s2)
x=150mx=300mx=318m
x=150mx=300mx=318m
U−DE−W
Fig. 12. Acceleration amplification by the seabed foundation to the input seismic wave.
J. Ye, G. Wang / Soil Dynamics and Earthquake Engineering 76 (2015) 86–9994
horizontal and vertical accelerations along three typical profiles in theseabed. At the far field (x¼150m), the horizontal peak accelerationslightly de-amplifies at the surface, while the vertical amplificationlinearly increases with soil thickness, reaching up to 3m/s2 on theseabed surface. No apparent amplification is observed for vertical peakacceleration at the symmetrical axis x¼ 318 m, due to the fact that theweight of composite breakwater could effectively subdue the verticalmovement of the seabed soils underneath. It is interesting to observesignificant amplification effect along the near-field profile x¼300m.
The horizontal amplification almost linearly increases with soil thick-ness from the base, and the peak horizontal acceleration reaches up toabout 3m/s2 at the seabed surface. The amplification for vertical peakacceleration is nonlinearly developed, with the maximum verticalacceleration reaching up to about 5m/s2 at the surface. The amplifica-tion of motions along three typical profiles indicates that the presenceof the offshore structure can significantly affect the seismic dynamics ofseabed foundation. Dynamic interaction between offshore structuresand their seabed foundation is intensive and cannot be overlooked.
0 50 100 150 200 250 300−8
−6
−4
−2
0
Time (s)
Dis
plac
emen
t (m
)
0 50 100 150 200 250 300−0.3
−0.2
−0.1
0
0.1
Time (s)
Dis
plac
emen
t (m
)
x=150m, z=30mx=150m, z=20mx=150m, z=10m
x=150m, z=30mx=150m, z=20mx=150m, z=10m
U−D
E−W z=10m
z=10m
z=20m
z=20m
z=30m
z=30m
0 50 100 150 200 250 300−8
−6
−4
−2
0
Time (s)
Dis
plac
emen
t (m
)
0 50 100 150 200 250 300−8
−6
−4
−2
0
Time (s)
Dis
plac
emen
t (m
)
x=300m, z=30mx=300m, z=20mx=300m, z=10m
x=300m, z=30mx=300m, z=20mx=300m, z=10m
E−W
U−D
z=30m
z=30m
z=20m
z=20m
z=10m
z=10m
0 50 100 150 200 250 300−6
−4
−2
0
2
Time (s)
Dis
plac
emen
t (m
)
0 50 100 150 200 250 300−4
−3
−2
−1
0
Time (s)
Dis
plac
emen
t (m
)
x=318m, z=30mx=318m, z=20mx=318m, z=10m
x=318m, z=30mx=318m, z=20mx=318m, z=10m
E−W
U−D
z=10m
z=10m
z=20m
z=20m
z=30m
z=30m
Fig. 13. Time history curve of response displacement in seabed foundation at nine typical positions. (a) x¼150 m (far field). (b) x¼300 m (near field). (c) x¼318 m(symmetric axis).
−8 −6 −4 −2 00
5
10
15
20
25
30
z (m
)
Displacement (m)−0.2 −0.1 0 0.10
5
10
15
20
25
30
z (m
)
Displacement (m)
t=300s
t=300s
t=200s
t=150s
t=150s
t=100s
t=100st=50s
t=50s
t=200s
x=150mx=150m
U−DE−W
Fig. 14. Displacement distribution along depth in the seabed foundation on line x¼150 m.
J. Ye, G. Wang / Soil Dynamics and Earthquake Engineering 76 (2015) 86–99 95
4.2. Displacement profiles
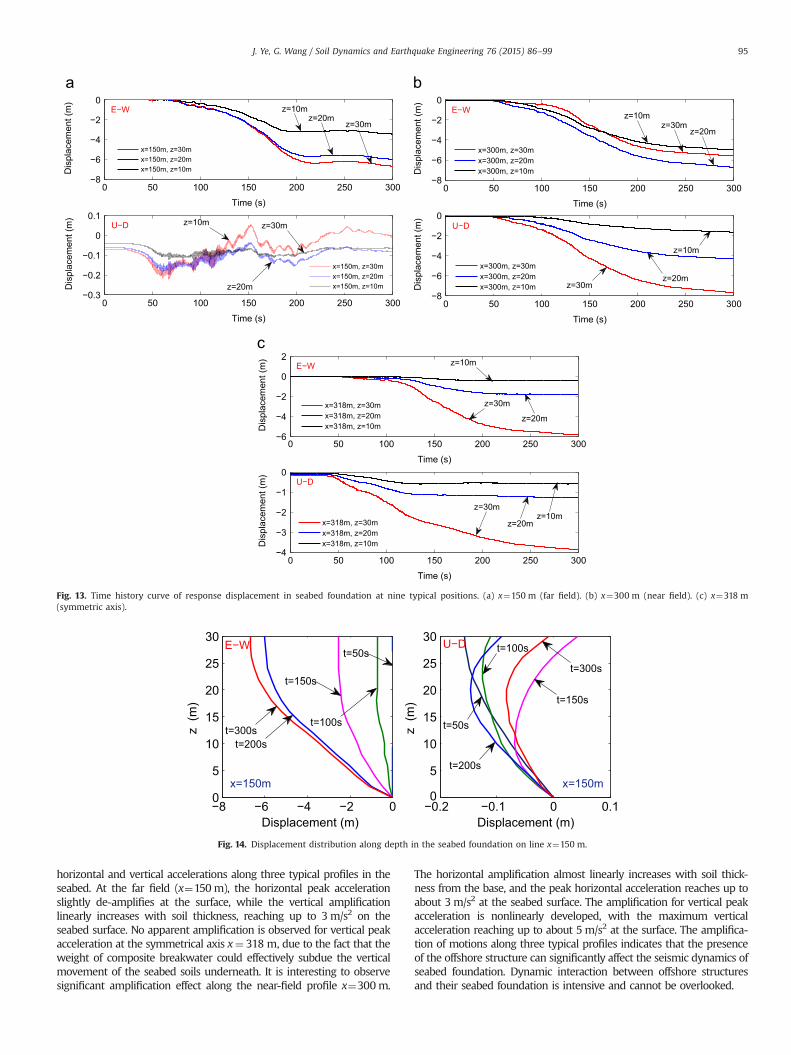
Fig. 13 demonstrates the horizontal and vertical displacement timehistories of seabed at nine typical locations at the far field (x¼150m),near field (x¼300 m) and along the line of symmetry (x¼318m).Significant lateral displacements in the far field and the near fieldbegin to accumulate at the end of stage 1 (t ¼ 60 s), when the far-fieldsoil becomes liquefied. The lateral displacement reaches up to 7 m atthe end of excitation. However, the vertical displacement at far-fieldseabed is much less (only in the order of cm). On the other hand,significant vertical movement in the near field and symmetric axisbegin to accumulate at the end of stage 1. The lateral displacement at
the structural axis only begins to grow substantially at the end ofstage 2, when the near-field soil becomes liquefied.
Fig. 14 shows the distribution of horizontal and vertical displace-ments along the vertical profile in the far field. It is clear that theshape of lateral displacement is nonlinearly developed within theseabed. Peak lateral displacement is attained on the seabed surface,where the gradient of the horizontal displacement is close to zero,indicating there is no shear deformation and shear force acting on theseabed surface. Additionally, fast development of lateral displacementoccurs from 100 to 200 s. On the other hand, vertical displacement inthe far field is small, and does not follow a clear pattern in distribution.
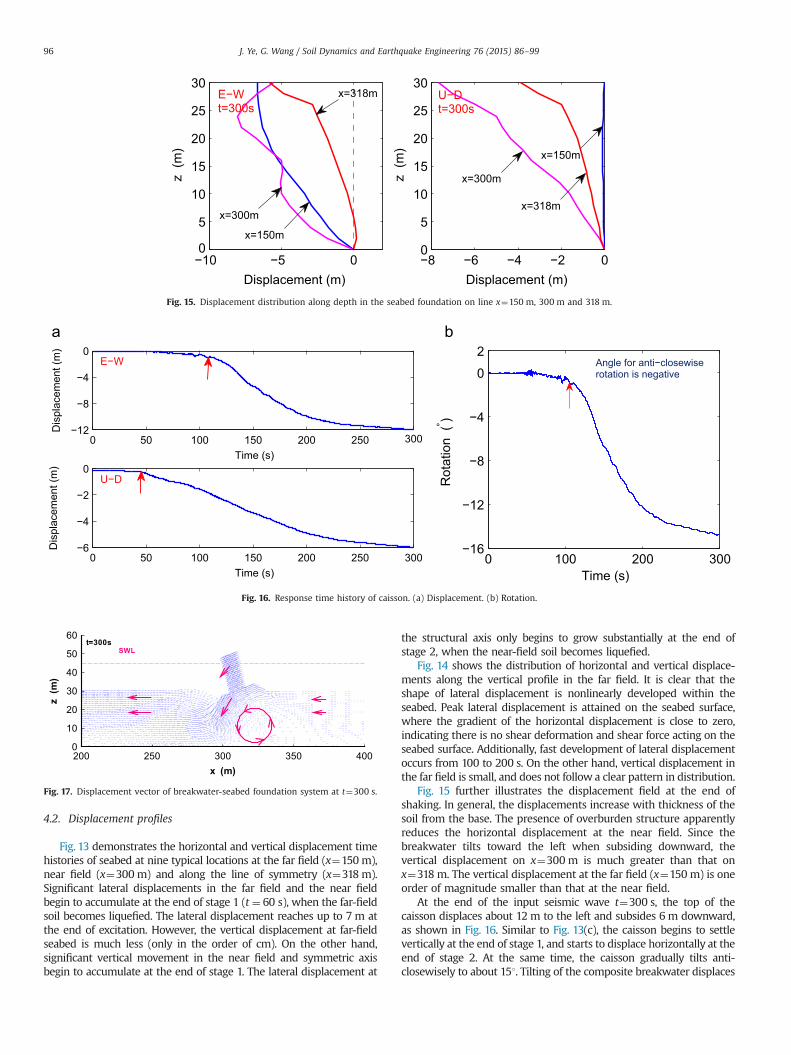
Fig. 15 further illustrates the displacement field at the end ofshaking. In general, the displacements increase with thickness of thesoil from the base. The presence of overburden structure apparentlyreduces the horizontal displacement at the near field. Since thebreakwater tilts toward the left when subsiding downward, thevertical displacement on x¼300 m is much greater than that onx¼318 m. The vertical displacement at the far field (x¼150 m) is oneorder of magnitude smaller than that at the near field.
At the end of the input seismic wave t¼300 s, the top of thecaisson displaces about 12 m to the left and subsides 6 m downward,as shown in Fig. 16. Similar to Fig. 13(c), the caisson begins to settlevertically at the end of stage 1, and starts to displace horizontally at theend of stage 2. At the same time, the caisson gradually tilts anti-closewisely to about 151. Tilting of the composite breakwater displaces
−10 −5 00
5
10
15
20
25
30
z (m
)
Displacement (m)−8 −6 −4 −2 00
5
10
15
20
25
30
z (m
)
Displacement (m)
x=318m
x=300m
x=150m
x=150m
x=318m
x=300m
E−Wt=300s
U−Dt=300s
Fig. 15. Displacement distribution along depth in the seabed foundation on line x¼150 m, 300 m and 318 m.
0 50 100 150 200 250 300−12
−8
−4
0
Time (s)
Dis
plac
emen
t (m
)
0 50 100 150 200 250 300−6
−4
−2
0
Time (s)
Dis
plac
emen
t (m
)
E−W
U−D
0 100 200 300−16
−12
−8
−4
0
2
Time (s)
Rot
atio
n (°
)
Angle for anti−closewiserotation is negative
Fig. 16. Response time history of caisson. (a) Displacement. (b) Rotation.
x (m)
z(m)
200 250 300 350 4000
10
20
30
40
50
60SWL
t=300s
Fig. 17. Displacement vector of breakwater-seabed foundation system at t¼300 s.
J. Ye, G. Wang / Soil Dynamics and Earthquake Engineering 76 (2015) 86–9996
the seabed soil beneath the composite breakwater up to 1 m to rightside. As illustrated in Fig. 17, the displacement vector forms an anti-closewise eddy beneath the composite breakwater due to tilting of thebreakwater. This displacing mode can effectively block the lateral flowof the liquefied seabed at the right-hand side of the breakwater: themaximum lateral horizontal displacement at the right-hand side ofbreakwater is only about 3 m, much less than that at the left-handside of breakwater (about 5–7m). Accordingly, the soil also heavesupward near the foot of the rubble mound.
4.3. Stress path and nonlinear stress–strain response
In this section, nine positions on three typical profiles areselected as representatives to analyze the effective-stress path andnonlinear stress-strain response of the soils in the liquefaction
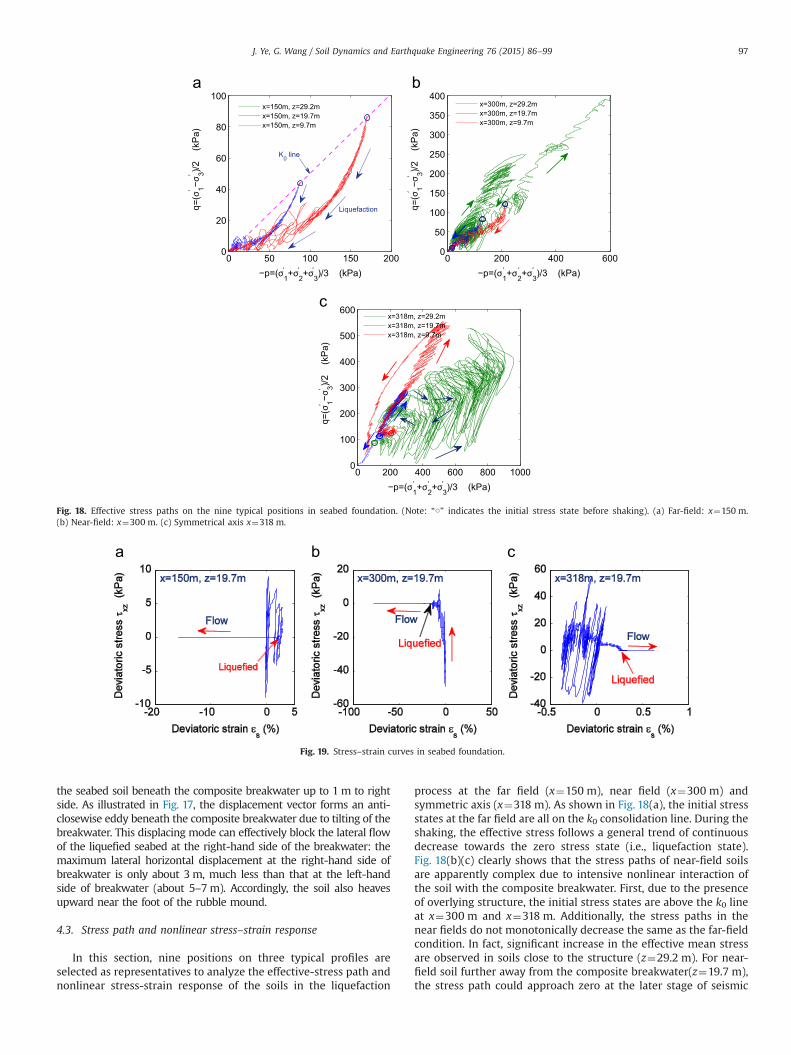
process at the far field (x¼150 m), near field (x¼300 m) andsymmetric axis (x¼318 m). As shown in Fig. 18(a), the initial stressstates at the far field are all on the k0 consolidation line. During theshaking, the effective stress follows a general trend of continuousdecrease towards the zero stress state (i.e., liquefaction state).Fig. 18(b)(c) clearly shows that the stress paths of near-field soilsare apparently complex due to intensive nonlinear interaction ofthe soil with the composite breakwater. First, due to the presenceof overlying structure, the initial stress states are above the k0 lineat x¼300 m and x¼318 m. Additionally, the stress paths in thenear fields do not monotonically decrease the same as the far-fieldcondition. In fact, significant increase in the effective mean stressare observed in soils close to the structure (z¼29.2 m). For near-field soil further away from the composite breakwater(z¼19.7 m),the stress path could approach zero at the later stage of seismic
0 50 100 150 2000
20
40
60
80
100
−p=(σ1+σ2+σ3)/3 (kPa)
q=(σ
1− σ3)/2
(k
Pa)
x=150m, z=29.2mx=150m, z=19.7mx=150m, z=9.7m
Liquefaction
K0 line
0 200 400 6000
50
100
150
200
250
300
350
400
−p=(σ1+σ2+σ3)/3 (kPa)
q=(σ
1−σ3)/2
(k
Pa)
x=300m, z=29.2mx=300m, z=19.7mx=300m, z=9.7m
0 200 400 600 800 10000
100
200
300
400
500
600
−p=(σ1+σ2+σ3)/3 (kPa)
q=( σ
1−σ3)/2
(k
Pa)
x=318m, z=29.2mx=318m, z=19.7mx=318m, z=9.7m
′
′′
′′
′′
′ ′ ′ ′ ′
′ ′ ′
Fig. 18. Effective stress paths on the nine typical positions in seabed foundation. (Note: “○” indicates the initial stress state before shaking). (a) Far-field: x¼150 m.(b) Near-field: x¼300 m. (c) Symmetrical axis x¼318 m.
Fig. 19. Stress–strain curves in seabed foundation.
J. Ye, G. Wang / Soil Dynamics and Earthquake Engineering 76 (2015) 86–99 97
loading, but not all soils beneath the composite breakwater can beliquefied. The effect of structure can also be clearly observed in thestress-strain curves from Fig. 19. Flow liquefaction results in 15%deviatoric strain in the far-field soil, while only 0.5% deviatoricstrain is developed in soils underneath the structure.
5. Conclusions and discussions
In this study, highly nonlinear dynamic interaction of an offshorebreakwater and its seabed foundation is investigated using a coupledFEM numerical model. The dynamic behavior of the seabed soil ismodeled by using a validated soil constitutive model–Pastor-Zien-kiewics Mark III (PZIII) [17,37]. In this investigation, variation of voidratio of the seabed soil and its corresponding permeability, as well asthe hydrostatic pressure acting on the surface of seabed and offshorebreakwater are updated in each time step in accordance to theseismically induced displacement of offshore breakwater and defor-mation of the seabed foundation. The practice of numerical imple-mentation indicates that the numerical solution will not converge ifthese variations are not considered in the numerical modeling,especially in the situation of large-deformation simulation. Thecomputational results show that the developed numerical modelFSSI-CAS 2D is capable of capturing the a variety of nonlinearinteraction phenomena between the offshore structure and theseabed foundation. It can find important applications in the geotech-nical earthquake engineering design of offshore structures.
Comparing with other numerical code, the advantages of numer-ical code FSSI-CAS 2D used in this study mainly include: (1) the wellvalidated advanced constitutive soil model - PZIII is included, (2) thehighly nonlinear interaction between offshore structures and theirloose seabed foundation can be simulated effectively using updatedLagrangian approach, (3) the state-dependent variables, such as voidratio e, permeability k, stiffness matrix etc. can be updated in eachtime step, and (4) the water pressure acting on surface of seabed andoffshore breakwater can be automatically updated as the boundaryvalue according to the deformation and displacement of seabed-offshore structures system. The main limitation of the currentsimulation is that the vibration of breakwater may induce waterwave and additional dynamic water pressure, which cannot besimulated at the present stage. Only the hydrostatic water pressureon breakwater and seabed foundation is applied in computation. Theeffect of this small water wave on the seismic dynamics of offshorestructures needs further investigation.
Structures constructed on newly deposited Quaternary sedi-ments could experience excessive subsidence, tilting and rotationunder seismic loading due to liquefaction and softening of theseabed soil. The computational results demonstrate intensive, com-plex nonlinear interaction between offshore structures and theirseabed foundation. We observed a three-stage failure mechanismresulted from the seabed and structure interaction. In the first stage,the far-field seabed soil liquefies and reduces confining pressure onthe near-field soil. In the second stage, the offshore structuresubsides excessively. Presence of the overlying structure postponesliquefaction process of the near-field soil and constrains its dynamicresponse. Yet, progressive liquefaction of soils close to the structurewill eventually cause significant lateral movement and tilting of thestructure (the third stage). At the same time, movement of theoffshore structures could result in complex variation process of porepressure, effective stresses, stress path and void ratio in the seabedfoundation beneath offshore structures. Through the numericalanalysis, significantly different behaviors are observed for the far-field and near-field soils. The difference can only be explained byconsidering complex interaction between the soil and structure. Theanalysis also demonstrated that shear wave cannot be transmitted inliquefied soils. This phenomenon proves to some extend that the soilconstitutive model PZIII is capable of describing the post-liquefaction behavior of the soil. Once the soil is liquefied, it behaveslike heavy fluid.
Analysis in this study shows the composite breakwater trans-lated 12 m horizontally, and subsided 6 m. This composite break-water could not still serve as the barrier to protect harbor or port.It is suggested construction of offshore structures on loose seabedfoundation should be avoided in practice. However, if the situationcannot be avoided, it is highly recommended to evaluate theseismic stability of offshore structures using advanced computa-tional tools, such as the FSSI-CAS 2D program in this study. Groundimprovement should be designed to reduce the potential andconsequence of seabed liquefaction. Again, advanced numericaltools should be used to evaluate the effectiveness of mitigationmeasures.
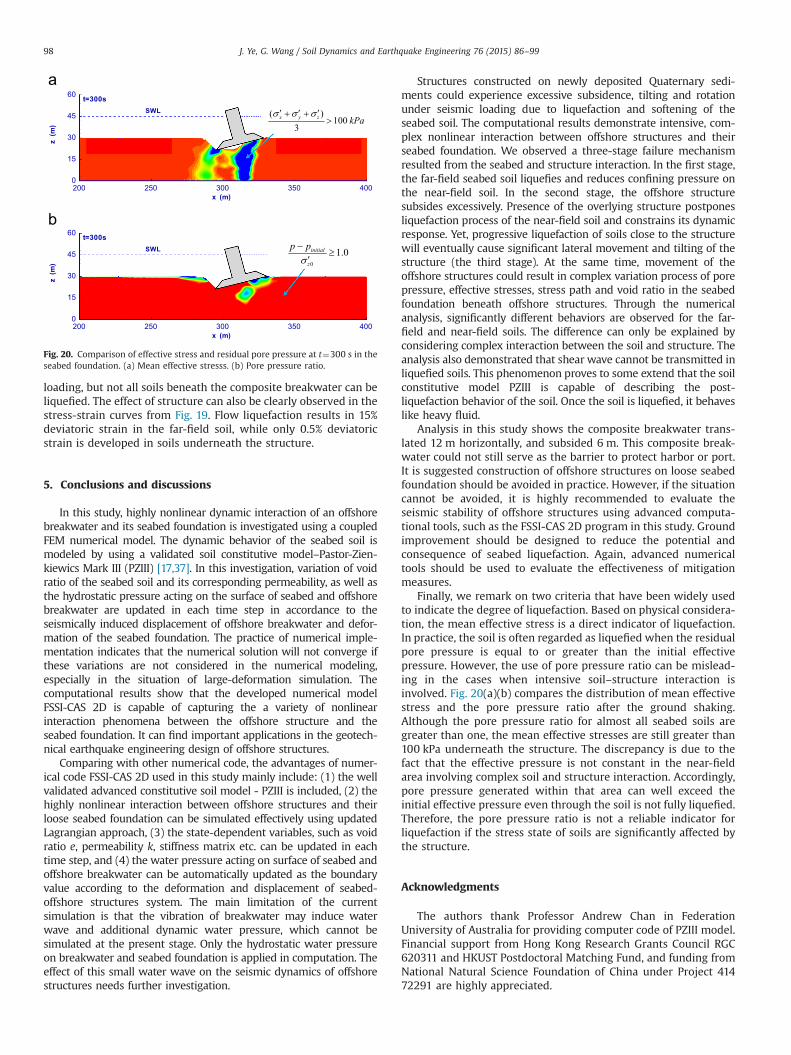
Finally, we remark on two criteria that have been widely usedto indicate the degree of liquefaction. Based on physical considera-tion, the mean effective stress is a direct indicator of liquefaction.In practice, the soil is often regarded as liquefied when the residualpore pressure is equal to or greater than the initial effectivepressure. However, the use of pore pressure ratio can be mislead-ing in the cases when intensive soil–structure interaction isinvolved. Fig. 20(a)(b) compares the distribution of mean effectivestress and the pore pressure ratio after the ground shaking.Although the pore pressure ratio for almost all seabed soils aregreater than one, the mean effective stresses are still greater than100 kPa underneath the structure. The discrepancy is due to thefact that the effective pressure is not constant in the near-fieldarea involving complex soil and structure interaction. Accordingly,pore pressure generated within that area can well exceed theinitial effective pressure even through the soil is not fully liquefied.Therefore, the pore pressure ratio is not a reliable indicator forliquefaction if the stress state of soils are significantly affected bythe structure.
Acknowledgments
The authors thank Professor Andrew Chan in FederationUniversity of Australia for providing computer code of PZIII model.Financial support from Hong Kong Research Grants Council RGC620311 and HKUST Postdoctoral Matching Fund, and funding fromNational Natural Science Foundation of China under Project 41472291 are highly appreciated.
x (m)
z(m)
200 250 300 350 4000
15
30
45
60
x (m)
z(m)
200 250 300 350 4000
15
30
45
60
Fig. 20. Comparison of effective stress and residual pore pressure at t¼300 s in theseabed foundation. (a) Mean effective stresss. (b) Pore pressure ratio.
J. Ye, G. Wang / Soil Dynamics and Earthquake Engineering 76 (2015) 86–9998
References
[1] Ye JH. Numerical analysis of wave-seabed-breakwater interactions [Ph.D.thesis], University of Dundee, Dundee, UK, May 2012.
[2] Memos C, Protonotarios JN. Patras breakwater failure due to seismic loading. In:Proceedings of the coastal engineering conference, vol. 3; 1993. pp. 3343–56.
[3] Iai S, Kameoka T. Finite element analysis of earthquake induced damage toanchored sheet pile quay walls. Soils Found 1993;33(1):71–91.
[4] Sugano T, Kaneko H, Yamamoto S. The 1999 Ji–Ji earthquake, Taiwan,investigation into the damage to civil engineering structures. In: Damage toport and harbor facilities. Japanese Society of Civil Engineers; 1999 [chapter 5].
[5] Sumer BM, Kaya A, Hansen NEO. Impact of liquefaction on coastal structures inthe 1999 Kocaeli, Turkey earthquake. In: Proceedings of the internationaloffshore and polar engineering conference, vol. 12; 2002. p. 504–11.
[6] Yuksel Y, Cetin KO, Ozguven O, Isik NS, Cevik E, Sumer BM. Seismic response ofa rubble mound breakwater in Turkey. Proc Inst Civil Eng: Marit Eng 2004;157(4):151–61.
[7] Katopodi I, Iosifidou K. Impact of the Lefkada earthquake 14-08-2003 onmarine works and coastal regions. In: Proceedings of 7th panhellenic geo-graphical conference, Mytilene, Greece; 2004. p. 363–70.
[8] Kiara A, Memos C, Tsiachris A. Some practical aspects on the seismic behaviorof rubble-mound breakwaters. In: Ports 2001: America's ports – gateways tothe global economy – Proceedings of the ports 2001 conference, vol. 108;2004. p. 1–10.
[9] Memos C, Bouckovalas G, Tsiachris A. Stability of rubble-mound breakwatersunder seismic action. In: Coastal engineering 2000 – Proceedings of the 27thinternational conference on coastal engineering, ICCE 2000, vol. 276; 2000.p. 1585–98.
[10] Ozaki R, Nagao T. Verification of seismic stability of caisson type breakwater.In: Proceedings of the 13th world conference on earthquake engineering;2004, Paper no.:0588.
[11] Mohajeri M, Ichii K, Tamura T. Experimental study on sliding block concept forcaisson walls. J Waterw Port Coast Ocean Eng 2004;130(3):134–42.
[12] Memos CD, Kiara A, Pavlidis E. Coupled seismic response analysis of rubble-mound breakwaters. Proc Inst Civil Eng: Water Marit Eng 2003;156(1):23–31.
[13] Jafarian Y, Alielahi H, Abdollahi AS, Vakili B. Seismic numerical simulation ofbreakwater on a liquefiable layer: Iran LNG port. Electron J Geotech Eng2010;15 D:1–11.
[14] Byrne P. A cyclic shear-volume coupling and pore-pressure model for sand. In:2nd International conference on recent advances in geotechnical earthquakeengineering and soil dynamics, vol. 1.24; 1991. p. 47–55.
[15] Cihan K, Yuksel Y, Berilgen EOCM. Behavior of homogenous rubble moundbreakwaters materials under cyclic loads. Soil Dyn Earthq Eng 2012;34(1):1–10.
[16] Iai S, Ichii K, Liu H-L. Effective stress analysis of port structures. Soils Found(Special Issue of Geotechnical Aspects of the January 17, 1995 Hyogoken-Nambu Earthquake) 1998;(2):97–114.
[17] Pastor M, Zienkiewicz OC, Chan AHC. Generalized plasticity and the modellingof soil behaviour. Int J Numer Anal Methods Geomech 1990;14:151–90.
[18] Elgamal A, Yang Z, Parra E, Ragheb A. Modeling of cyclic mobility in saturatedcohesionless soils. Int J Plast 2003;19(6):883–905.
[19] Yang Z, Elgamal A, Parra E. Computational model for cyclic mobilityand associated shear deformation. J Geotech Geoenviron Eng 2003;129(12):1119–27.
[20] Wang ZL, Makdisi FI, Egan J. Practical applications of a nonlinear approach toanalysis of earthquake-induced liquefaction and deformation of earth struc-tures. Soil Dyn Earthq Eng 2006;26(2–4):231–52.
[21] Taiebat1 M, Dafalias YF. Sanisand: simple anisotropic sand plasticity model.Int J Numer Anal Methods Geomech 2008;32(8):915–48.
[22] Yin ZY, Chang C. Stress-dilatancy behavior for sand under loading andunloading conditions. Int J Numer Anal Methods Geomech 2008;32(8):915–48.
[23] Wang G, Xie Y. Modified bounding surface hypoplasticity model for sandsunder cyclic loading. J Eng Mech 2014;140(1):91–104.
[24] Ye JH. Seismic response of poro-elastic seabed and composite breakwaterunder strong earthquake loading. Bull Earthq Eng 2012;10(4):1609–33.
[25] Ye JH, Jeng D-S. Earthquake induced dynamic response of 3d poro-elasticunsaturated seabed under a rubble mound breakwater. Soil Dyn Earthq Eng2013;44(1):14–26.
[26] Zienkiewicz OC, Chang CT, Bettess P. Drained, undrained, consolidating anddynamic behaviour assumptions in soils. Geotechnique 1980;30(4):385–95.
[27] Ye JH, Jeng D-S, Wang R, Zhu C. Validation of a 2-D semi-coupled numericalmodel for fluidstructure seabed interaction. J Fluids Struct 2013;42:333–57.
[28] Zienkiewicz OC, Chan AHC, Pastor M, Schrefler BA, Shiomi T. Computationalgeomechanics with special reference to earthquake engineering. England:John Wiley and Sons; 1999.
[29] Xie Y, Wang G. A stabilized iterative scheme for coupled hydro-mechanicalsystems using reproducing kernel particle method. Int J Numer Methods Eng2014;99(11):819–43.
[30] Wang G, Sitar N. Static and dynamic axial response of drilled piers. II:numerical simulation. J Geotech Geoenviron Eng 2011;137(12):1143–53.
[31] Taylor DW. Fundamentals of soil mechanics. New York: John Wiley and Sons;1948.
[32] Casta A. Permeability-porosity relationship: a reexamination of the Kozeny–Carman equation based on a fractal pore-space geometry assumption.Geophys Res Lett 2006;33:2318–22.
[33] Miyamoto J, Sassa S, Sekiguchi H. Progressive solidification of a liquefied sandlayer during continued wave loading. Géotechnique 2004;54(10):617–29.
[34] Simo JC, Hughes TJR. Computational inelasticty. New York, Berlin, Heidelberg:Springer-Verlag; 1998.
[35] Ye JH. Numerical modelling of consolidation of 2-D porous unsaturated seabedunder a composite breakwater. Mechanika 2012;18(4):373–9.
[36] Ye JH, Jeng D-S, Chan AHC. Consolidation and dynamics of 3D unsaturatedporous seabed under rigid caisson breakwater loaded by hydrostatic pressureand wave. Sci China — Technol Sci 2012;55(8):2362–76.
[37] Pastor M, Chan AHC, Mira P, Manzanal D, Fernndez MJA, Blanc T. Computa-tional geomechanics: the heritage of Olek Zienkiewicz. Int J Numer MethodsEng 2011;87(1–5):457–89.
J. Ye, G. Wang / Soil Dynamics and Earthquake Engineering 76 (2015) 86–99 99


![arXiv:1907.05707v4 [cs.LG] 25 Nov 2019Shapley Q-value: A Local Reward Approach to Solve Global Reward Games Jianhong Wang12, Yuan Zhang3, Tae-Kyun Kim2, Yunjie Gu1 1 Control and Power](https://img.pdfslide.us/doc/110x75/6077c5e760cd94433d1caa31/arxiv190705707v4-cslg-25-nov-2019-shapley-q-value-a-local-reward-approach.jpg)