Embed Size (px)
Citation preview

Soil Dynamics and Earthquake Engineering 48 (2013) 71–88
Contents lists available at SciVerse ScienceDirect
Soil Dynamics and Earthquake Engineering
0267-72
http://d
n Corr
E-m
journal homepage: www.elsevier.com/locate/soildyn
Incremental dynamic analysis of caisson–pier interaction
A. Zafeirakos, N. Gerolymosn, V. Drosos
National Technical University of Athens, Greece
a r t i c l e i n f o
Article history:
Received 2 May 2012
Received in revised form
23 January 2013
Accepted 28 January 2013
61/$ - see front matter & 2013 Elsevier Ltd. A
x.doi.org/10.1016/j.soildyn.2013.01.021
esponding author. Tel.: þ30 6974 782 521;
ail addresses: [email protected], gerolym
a b s t r a c t
This paper presents a 3D finite element Incremental Dynamic Analysis (IDA) study of caisson
foundations carrying single-degree-of-freedom (SDOF) structures on clayey soil. The emphasis is given
to the interplay between the nonlinearities developed above (superstructure) and, mainly, below
ground surface, either of material (soil plasticity) or of geometric (caisson–soil interface gapping and
slippage) origin. The study is performed with respect to the static (FS) and the seismic (FE) safety factor
of the foundation and involves SDOF oscillators of varying mass (to account for vertical loading, FS) and
height (relating to moment loading, FE) founded on similar rigid cubic caissons. Structural nonlinearity
is considered through a simplified moment-curvature law and the yield strength is deliberately chosen
so that the following three configurations are obtained: (a) a lightly loaded (FS¼5) seismically under-
designed (as compared to the superstructure) caisson, (b) a lightly loaded seismically over-designed
caisson, and (c) a heavily loaded (FS¼2.5) seismically under-designed caisson. The analysis is performed
with several earthquake records, each scaled to multiple levels of intensity. IDA curves are produced for
a single intensity measure, (peak ground acceleration, PGA), and appropriate engineering demand
parameters (EDP) describing both the maximum and the residual response of the system. The results
emphasize a potentially beneficial role of foundation nonlinearities in reducing the seismic demands on
the superstructure, but at the cost of residual foundation settlements and rotations.
& 2013 Elsevier Ltd. All rights reserved.
1. Introduction
The seismic design of deeply embedded caisson foundations hasbeen based either on solutions for shallow embedded foundation[7,8,12,26,33,35,42,43] (mostly cylindrical) or on solutions for pile(e.g. [28,41]). Gerolymos and Gazetas [16,17,18] proposed a multi-spring model for the static, cyclic, and dynamic response of massivecaisson foundations embedded in nonlinear layered or inhomoge-neous soil and loaded at the top, taking into account for soil andinterface nonlinearities. In a recent related work, Varun et al. [47]developed a dynamic Winkler model that accounts for the multitudeof soil resistance mechanisms mobilized at the base and the circum-ference of laterally loaded caissons, thus retaining the advantages ofWinkler-type models while allowing for realistic representation of thecomplex soil–structure interaction effects.
Current seismic design of structures is based on the so-called‘‘capacity design’’ approach, in which the structural response ispresumed ductile. In essence, it dictates the hierarchy of failure,ensuring that the critical components of a joint (column/pier-to-foundation or beam-to-column), which are the foundation and thecolumns respectively, are not designed by their own action effects but
ll rights reserved.
fax: þ30 210 772 2405.
[email protected] (G. N.).
to exceed, by an appropriate capacity factor, the available resistanceof the ‘‘sacrificial’’ components, the latter designed by their nominalearthquake loading coefficient. Structurally elastic behavior of thefoundation, for the case of deep embedded and caisson foundations,indicates that passive and shear failure along the sides and the baseare undesirable. Although such restrictions may, at first, appearreasonable (the inspection and rehabilitation of foundation damageafter a strong earthquake is not a trivial task), they may lead toeconomically conservative designs; elastic foundation response mightprove a rather expensive solution. Moreover, neglecting the afore-mentioned nonlinear phenomena prohibits the exploitation of thesubstantial ductility capacity offered by the failure mechanismsdeveloped below ground surface in dissipating the seismic energy.In fact, recent research on shallow (e.g. [2,9,10,14,15,22,27,36,38,39])and pile [20] foundations suggests that soil compliance and subse-quent development of nonlinearities and inelasticity in the soil–foundation system may be beneficial for the superstructure andshould be considered in the analysis and perhaps allowed in thedesign. However, the consequences of allowing for plasticity belowground surface include transient and permanent deformations whichmust be realistically assessed in design.
The impact of nonlinear soil–foundation–structure interaction(SFSI) on the seismic response of caisson foundations was illustratedin a recent numerical comparative study by the authors [49]. Thestudy comprised similar rigid cubic caissons carrying elastic single

A. Zafeirakos et al. / Soil Dynamics and Earthquake Engineering 48 (2013) 71–8872
degree of freedom (SDOF) structures, of varying mass and height, inclay. Four different configurations were examined, with respect to thestatic (FV) and seismic (FE) safety factor of the foundation, correspond-ing to lightly (FV¼5) and heavily loaded (FV¼2.5) seismically over-(FE41) and under-designed (FEo1) caissons. It was shown thatseismically under-designing a caisson foundation, thus deliberatelyallowing for plastic deformations to develop below ground level,generally leads to:
�
Reduction in ‘‘floor’’ response and spectral accelerations. � Significant reduction in flexural structural deformations. � Increased dynamic settlements and rotations but minimalresidual displacements and tilting.
Overall, the paper highlighted the effectiveness of interfacenonlinearities, prevalent in the response of the under-designedfoundations, in damping the seismic energy, owing to the largeductility capacity of the soil mass.
Incremental Dynamic Analysis is a tool to assess the global andlocal capacity of structures by subjecting the structural modelto several ground motion records, each scaled to multiplelevels of intensity. Though introduced and well documented byVamvatsikos and Cornell [44], the concept of seismic load scalinghad been formerly used by several authors to assess the perfor-mance of structural frames in buildings [3,31,34]. This method ofanalysis provides several insights regarding the dynamic character-istics of a structural system as well as useful input for applications ofperformance-based evaluation. In a recent relevant publication,Pecker and Chatzigogos [40] presented results of IDA for a simplebridge pier founded on stiff clay with a shallow circular foundationconsidering soil and geometric nonlinearities. They deduced that, ona whole, consideration of nonlinear SSI appears beneficial indrastically reducing the ductility demand in the structure, whilestressing out that this positive effect is counterbalanced by largerdisplacement and rotation of the foundation.
In this framework, the present study further extends the investi-gation on the seismic response of under-designed caisson foundations
a) m= 270b) m= 540
concentrated
superstructure: nonlinear beam elementsa) H1= 46m, H2= 12m (FS= 5)b) H3= 18m (FS= 2.5)
6 m
14m
Su= 65 kPa
Su= 130 kPa
Seism
Fig. 1. Overview of the finite element model w
through 3-D IDA. Similar rigid cubic caissons under three differentloading conditions, with respect to the static (FS) and the seismic (FE)safety factor of the foundation, are examined. Since the paper aspiresto characterize the global foundation–superstructure response inperformance based design terms, structural nonlinearity is alsoaccounted for, in order to capture the complex interplay betweenthe main sources of nonlinearities; namely those above and belowground level. The main focus, however, is on the nonlinear phenom-ena developed at the foundation level. Therefore, structural non-linearity is considered through a simplified moment-curvature law.The yield strength of the columns is deliberately chosen so that thefollowing idealized configurations are obtained: (a) a 12 m and a46 m tall column, corresponding to a seismically over-designed and aseismically under-designed (as compared to the superstructure)foundation respectively, carrying a ‘‘light’’ superstructure (FS¼5)and (b) a 18 m tall column corresponding to a seismically over-designed foundation carrying a ‘‘heavy’’ superstructure (FS¼2.5).Given that IDA covers the full spectrum of the dynamic capacity ofthe soil–caisson-superstructure system, conclusions of more generalvalidity are expected.
As a final remark, it should be stated that although computation-ally demanding and challenging, the 3D analysis was preferred tomore simplified approaches, e.g. Winkler-based models, due to thefact that while the latter models are, in theory, capable of capturingany observed interface behavior, their success lies on the appropriatecalibration of their parameters which, unfortunately, could not beknown a priori for each specific case. To the authors’ best knowledge,a thorough calibration procedure for Winkler-based modeling ofsoil–caisson interface response is still missing in the literature.
2. Problem definition and analysis methodology
2.1. Problem definition
The studied problem is portrayed in Fig. 1: A mass-and-column structure is founded through a rigid cubic caisson of sideh¼10 m in a 20 m thick 2-layer cohesive soil stratum. The soil isconsidered to be undrained with Su¼65 kPa at the upper 6 m and
Soil :Non-linear
8-noded3D elements
0 Mg, FS = 50 Mg, FS = 2.5
mass element
soil–caisson Interface
Caisson (10 x 10 x 10 m) :elastic 8-noded elements
ic excitation
ith the parameters used in the analysis.
A. Zafeirakos et al. / Soil Dynamics and Earthquake Engineering 48 (2013) 71–88 73
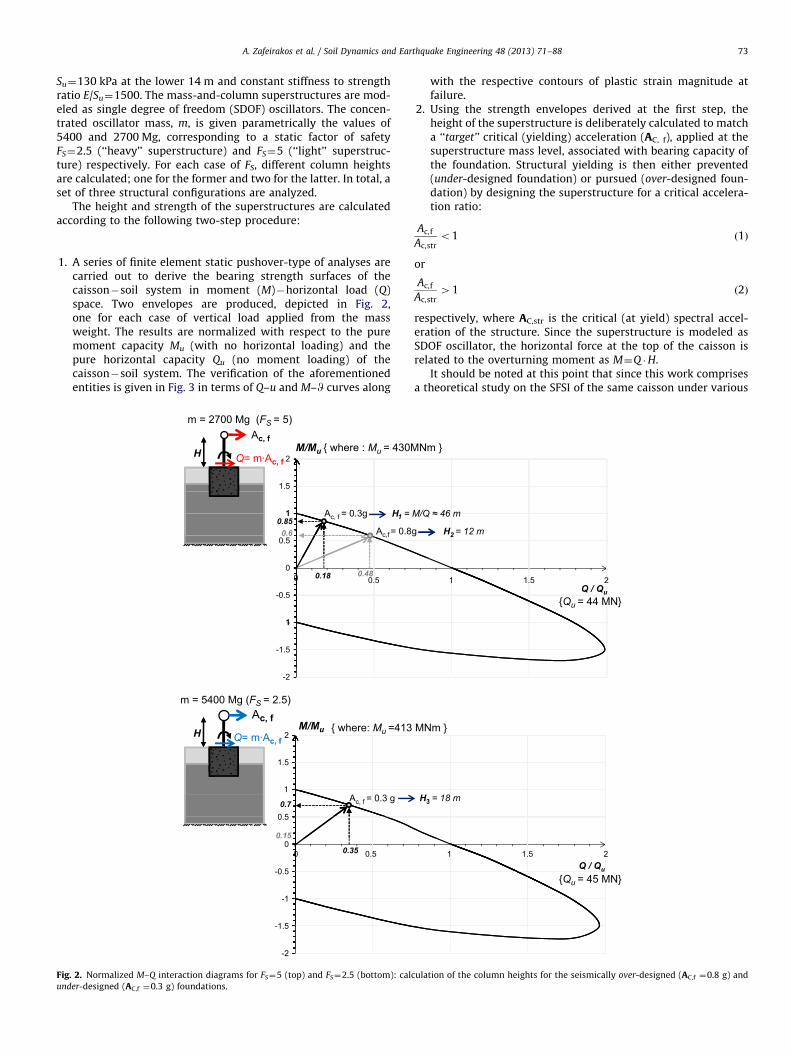
Su¼130 kPa at the lower 14 m and constant stiffness to strengthratio E/Su¼1500. The mass-and-column superstructures are mod-eled as single degree of freedom (SDOF) oscillators. The concen-trated oscillator mass, m, is given parametrically the values of5400 and 2700 Mg, corresponding to a static factor of safetyFS¼2.5 (‘‘heavy’’ superstructure) and FS¼5 (‘‘light’’ superstruc-ture) respectively. For each case of FS, different column heightsare calculated; one for the former and two for the latter. In total, aset of three structural configurations are analyzed.
The height and strength of the superstructures are calculatedaccording to the following two-step procedure:
1.
Figund
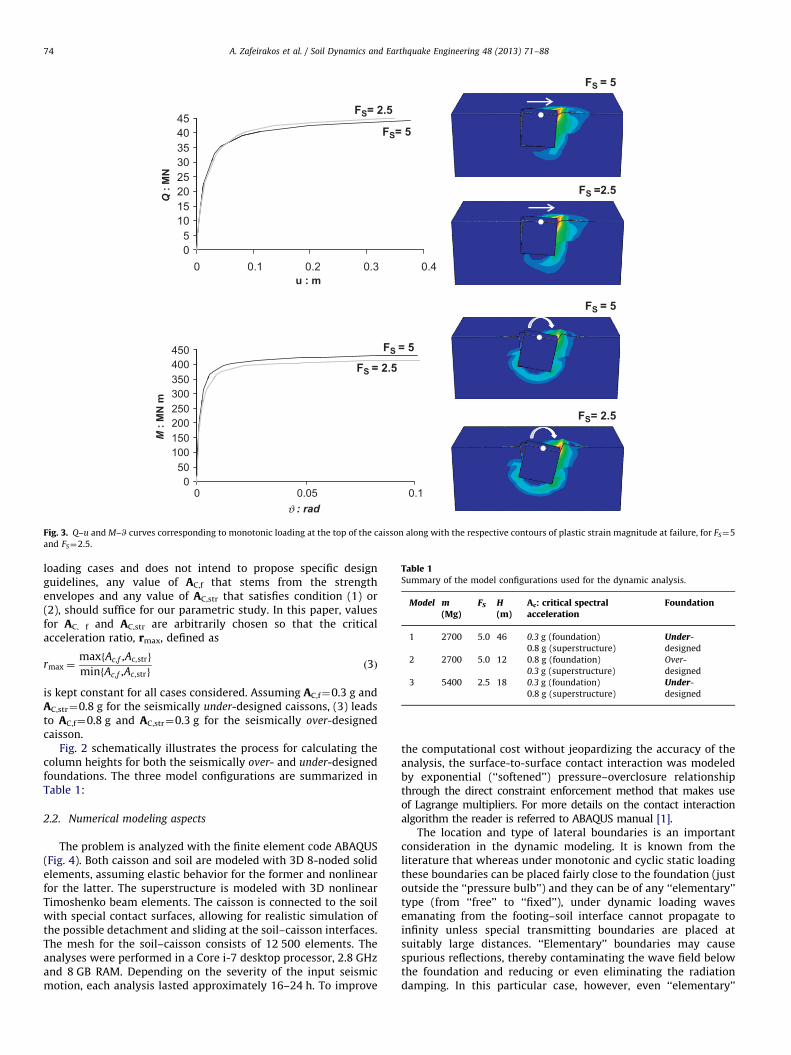
A series of finite element static pushover-type of analyses arecarried out to derive the bearing strength surfaces of thecaisson�soil system in moment (M)�horizontal load (Q)space. Two envelopes are produced, depicted in Fig. 2,one for each case of vertical load applied from the massweight. The results are normalized with respect to the puremoment capacity Mu (with no horizontal loading) and thepure horizontal capacity Qu (no moment loading) of thecaisson�soil system. The verification of the aforementionedentities is given in Fig. 3 in terms of Q–u and M–W curves along
m = 2700 Mg (FS = 5)Ac, f
M/Mu { where : Mu = 430MNmH 2Q= m·Ac, f
1.5
1 Ac, f = 0.3g H = M/Q10.85 1
Ac,f = 0.8 g0.50.6
00 0.50.18 0.48
-0.5
-11
-1.5
-2
m = 5400 Mg (FS = 2.5)
M/MuAc, f
{ where: Mu =413 MN2H Q= m·Ac, f
1.5
1
0.50.7
Ac, f = 0.3 g H3
0.150
0 0.50.35
-0.5
-1
-1.5
-2
. 2. Normalized M–Q interaction diagrams for FS¼5 (top) and FS¼2.5 (bottom): calcula
er-designed (AC,f ¼0.3 g) foundations.
with the respective contours of plastic strain magnitude atfailure.
2.
Using the strength envelopes derived at the first step, theheight of the superstructure is deliberately calculated to matcha ‘‘target’’ critical (yielding) acceleration (AC, f), applied at thesuperstructure mass level, associated with bearing capacity ofthe foundation. Structural yielding is then either prevented(under-designed foundation) or pursued (over-designed foun-dation) by designing the superstructure for a critical accelera-tion ratio:Ac,f
Ac,stro1 ð1Þ
or
Ac,f
Ac,str41 ð2Þ
respectively, where AC,str is the critical (at yield) spectral accel-eration of the structure. Since the superstructure is modeled asSDOF oscillator, the horizontal force at the top of the caisson isrelated to the overturning moment as M¼Q �H.
It should be noted at this point that since this work comprisesa theoretical study on the SFSI of the same caisson under various
}
≈ 46 m
H2 = 12 m
1.5 21Q / Qu
{Qu = 44 MN}
m }
= 18 m
1 1.5 2Q / Qu
{Qu = 45 MN}
tion of the column heights for the seismically over-designed (AC,f ¼0.8 g) and
FS = 5
Q :
MN
45FS= 2.5
FS= 5
303540
15
2520 FS =2.5
10
05
0 0.1 0.2 0.3 0.4u : m
M :
MN
m
FS = 5
450 FS = 5
350400 FS = 2.5
300
100150
250200
FS= 2.5
500
0 0.05 0.1: radϑ
Fig. 3. Q–u and M–W curves corresponding to monotonic loading at the top of the caisson along with the respective contours of plastic strain magnitude at failure, for FS¼5
and FS¼2.5.
Table 1Summary of the model configurations used for the dynamic analysis.
Model m(Mg)
FS H(m)
Ac: critical spectralacceleration
Foundation
1 2700 5.0 46 0.3 g (foundation)
0.8 g (superstructure)
Under-
designed
2 2700 5.0 12 0.8 g (foundation)
0.3 g (superstructure)
Over-
designed
3 5400 2.5 18 0.3 g (foundation)
0.8 g (superstructure)
Under-
designed
A. Zafeirakos et al. / Soil Dynamics and Earthquake Engineering 48 (2013) 71–8874
loading cases and does not intend to propose specific designguidelines, any value of AC,f that stems from the strengthenvelopes and any value of AC,str that satisfies condition (1) or(2), should suffice for our parametric study. In this paper, valuesfor AC, f and AC,str are arbitrarily chosen so that the criticalacceleration ratio, rmax, defined as
rmax ¼maxfAc,f ,Ac,strg
minfAc,f ,Ac,strgð3Þ
is kept constant for all cases considered. Assuming AC,f¼0.3 g andAC,str¼0.8 g for the seismically under-designed caissons, (3) leadsto AC,f¼0.8 g and AC,str¼0.3 g for the seismically over-designedcaisson.
Fig. 2 schematically illustrates the process for calculating thecolumn heights for both the seismically over- and under-designedfoundations. The three model configurations are summarized inTable 1:
2.2. Numerical modeling aspects
The problem is analyzed with the finite element code ABAQUS(Fig. 4). Both caisson and soil are modeled with 3D 8-noded solidelements, assuming elastic behavior for the former and nonlinearfor the latter. The superstructure is modeled with 3D nonlinearTimoshenko beam elements. The caisson is connected to the soilwith special contact surfaces, allowing for realistic simulation ofthe possible detachment and sliding at the soil–caisson interfaces.The mesh for the soil–caisson consists of 12 500 elements. Theanalyses were performed in a Core i-7 desktop processor, 2.8 GHzand 8 GB RAM. Depending on the severity of the input seismicmotion, each analysis lasted approximately 16–24 h. To improve
the computational cost without jeopardizing the accuracy of theanalysis, the surface-to-surface contact interaction was modeledby exponential (‘‘softened’’) pressure–overclosure relationshipthrough the direct constraint enforcement method that makes useof Lagrange multipliers. For more details on the contact interactionalgorithm the reader is referred to ABAQUS manual [1].
The location and type of lateral boundaries is an importantconsideration in the dynamic modeling. It is known from theliterature that whereas under monotonic and cyclic static loadingthese boundaries can be placed fairly close to the foundation (justoutside the ‘‘pressure bulb’’) and they can be of any ‘‘elementary’’type (from ‘‘free’’ to ‘‘fixed’’), under dynamic loading wavesemanating from the footing–soil interface cannot propagate toinfinity unless special transmitting boundaries are placed atsuitably large distances. ‘‘Elementary’’ boundaries may causespurious reflections, thereby contaminating the wave field belowthe foundation and reducing or even eliminating the radiationdamping. In this particular case, however, even ‘‘elementary’’

model : 1
m = 2700 Mg
FS = 5
H = 46 m
under-designed caisson
model : 2
m = 2700 Mg
FS = 5
H = 12 m
over-designed caisson
model : 3
m = 5400 Mg
FS = 2.5
H = 18 m
under-designed caisson
Fig. 4. Finite element discretization of the three configurations analyzed (column
heights not in scale).
A. Zafeirakos et al. / Soil Dynamics and Earthquake Engineering 48 (2013) 71–88 75
boundaries placed at a ‘‘reasonably large’’ distance from thefoundation might suffice, for the following reasons:
1.
Under low frequency dynamic loading, waves emitted fromsymmetrically opposite points of the foundation contactsurface, being out-of-phase, ‘‘interfere destructively’’ and thuslimit substantially the radiation of wave energy [13,25,30,48].Therefore, even in an (infinite) halfspace, boundaries placed atshort distances from the loaded surface would hardly be‘‘seen’’ by the waves emitted from the caisson.
2.
The geometric properties of the superstructures were appro-priately calculated so that the elastic fixed-base periodTstr¼0.6 s, for all cases, is deliberately larger than the firstnatural period, T¼0.41 s, of the soil profile. In this wayspurious reflections at the boundaries of the model are limitedas a result of a destructive interference (existence of a cut-offperiod for radiation damping equal to the first natural periodof the soil profile) of the outward spreading waves [12,13].‘‘Elementary’’ boundaries placed at relatively short distances(a few widths) would therefore suffice.3.
In most cases analyzed, soil inelasticity is activated, mobilizingbearing capacity failure mechanisms. The presence of theassociated localized failure surfaces (at small distances fromthe caisson) has the effect of creating a softer zone inside the(stiffer) soil; this zone would reflect the incident waves, thusfurther reducing the amount of wave energy transmitted(‘‘leaking’’) into the surrounding soil. Borja et al. [4,5] thor-oughly examined the aforementioned phenomenon for thecase of surface footings.In the absence of a cut-off frequency for the radiation damp-ing, then the ‘‘elementary’’ boundaries should be placed at fardistances from the loaded surface, e.g. at approximately L¼10 B[37], increasing prohibitively the computational cost. The use ofappropriate wave energy transmitting boundaries would alleviatethe cost of analysis even if placed at relatively short distances.However, to the authors’ knowledge, special boundaries that canabsorb accurately all types of body and surface waves at all anglesof incidence and all frequencies, consistent with a predefinedacceleration time history (input motion) at the base of the model,does not exist in the literature.
A distance of L¼5 B was therefore adopted in all studied cases.Moreover, appropriate kinematic constraints are imposed to thelateral edges of the model, allowing it to move in horizontal shearas the free field [19,21]. The nodes at the bottom of the finiteelement mesh are fixed in the vertical direction and they followthe horizontal motion imposed by the seismic records.
2.3. Constitutive modeling
2.3.1. Soil
For the total stress analysis under undrained conditions soilbehavior is modeled through a nonlinear constitutive law [18]which is a slight modification of one incorporated in ABAQUS. Ituses the Von Mises failure criterion with yield stress sy related tothe undrained shear strength Su as
sy ¼ffiffiffi3p
USu ð4Þ
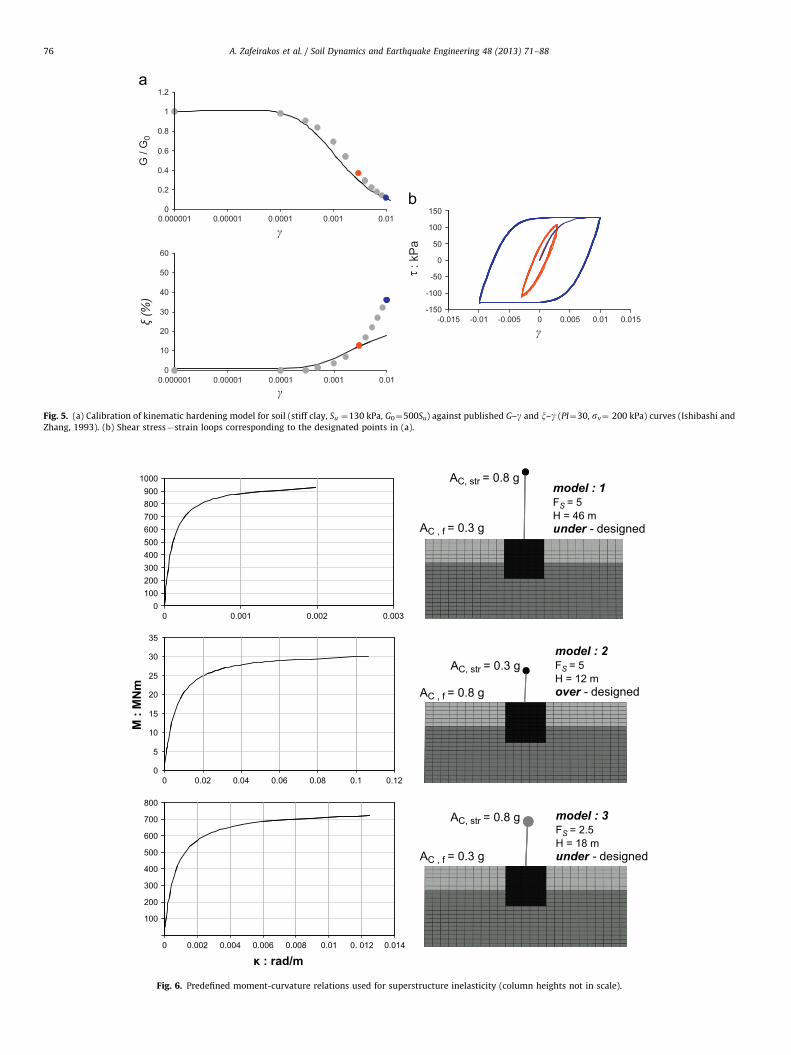
along with a nonlinear kinematic and isotropic hardening law,and an associative plastic flow rule. The model parameters arecalibrated to fit published G–g curves of the literature. Fig. 5(a)and (b) illustrates the validation of the kinematic hardeningmodel (through simple shear finite element analysis) againstpublished G–g and x–g curves by Ishibashi and Zhang [24].Mass and stiffness proportional Rayleigh damping, representingmaterial damping, are taken equal to 5% between the eigenfre-quency of the soil deposit and the dominant frequency of theearthquake ground motion.
1
1.2
0.8
0.6
0.4
G /
G0
0.2
00.000001 0.00001 0.0001 0.001 0.01
100
150
50γ
50
600: k
Pa
40 -100
-50
30 -150-0.015 -0.01 -0.005 0 0.005 0.01 0.015ξ
(%)
20 γ
0
10
0.000001 0.00001 0.0001 0.001 0.01
γτ
Fig. 5. (a) Calibration of kinematic hardening model for soil (stiff clay, Su ¼130 kPa, G0¼500Su) against published G–g and x–g (PI¼30, sv¼ 200 kPa) curves (Ishibashi and
Zhang, 1993). (b) Shear stress�strain loops corresponding to the designated points in (a).
9001000
model : 1AC, str = 0.8 g
AC, str = 0.3 g
AC, str = 0.8 g
700800 FS = 5
H = 46 m
500600 under - designed
model : 3FS = 2.5H = 18 munder - designed
model : 2FS = 5H = 12 mover - designed
AC , f = 0.3 g
AC , f = 0.8 g
AC , f = 0.3 g
300400
100200
00 0.001 0.002 0.003
35
30
25
20
15
10
M :
MN
m
0
5
0 0.02 0.04 0.06 0.08 0.1 0.12
800
600
700
500
300
400
100
200
0 0.002 0.004 0.006 0.008 0.01 0. 012 0.014
κ : rad/m
Fig. 6. Predefined moment-curvature relations used for superstructure inelasticity (column heights not in scale).
A. Zafeirakos et al. / Soil Dynamics and Earthquake Engineering 48 (2013) 71–8876
A. Zafeirakos et al. / Soil Dynamics and Earthquake Engineering 48 (2013) 71–88 77
2.3.2. Superstructure
In their previous work the authors considered elastic super-structures, thus focusing solely on the role of soil and interfacenonlinearities in the response. However, as aforementioned, theengineering motivation of this paper has arisen from the recentdevelopments of performance based design approaches, whichaim at characterizing the structural behavior in terms of displace-ment, rotation, distortion and drift rather than in terms ofstrength criteria. Since both superstructure and soil–foundationcan be potential sources of nonlinearities and energy dissipationduring a strong earthquake, they should be both characterized bynonlinear models, allowing to capture their complex nonlinearinterplay, and giving a reliable estimate of system deformation,both at the foundation and the superstructure level [6,9]. There-fore, structural nonlinearity is introduced. A simple hyperbolicbackbone moment (M)–curvature (k) curve describes this non-linear behavior of the column:
k¼ My
EIU
M
My�M
� �for MoMy ð5Þ
where EI is the initial structural bending stiffness and My is thebending moment yield strength associated with the critical
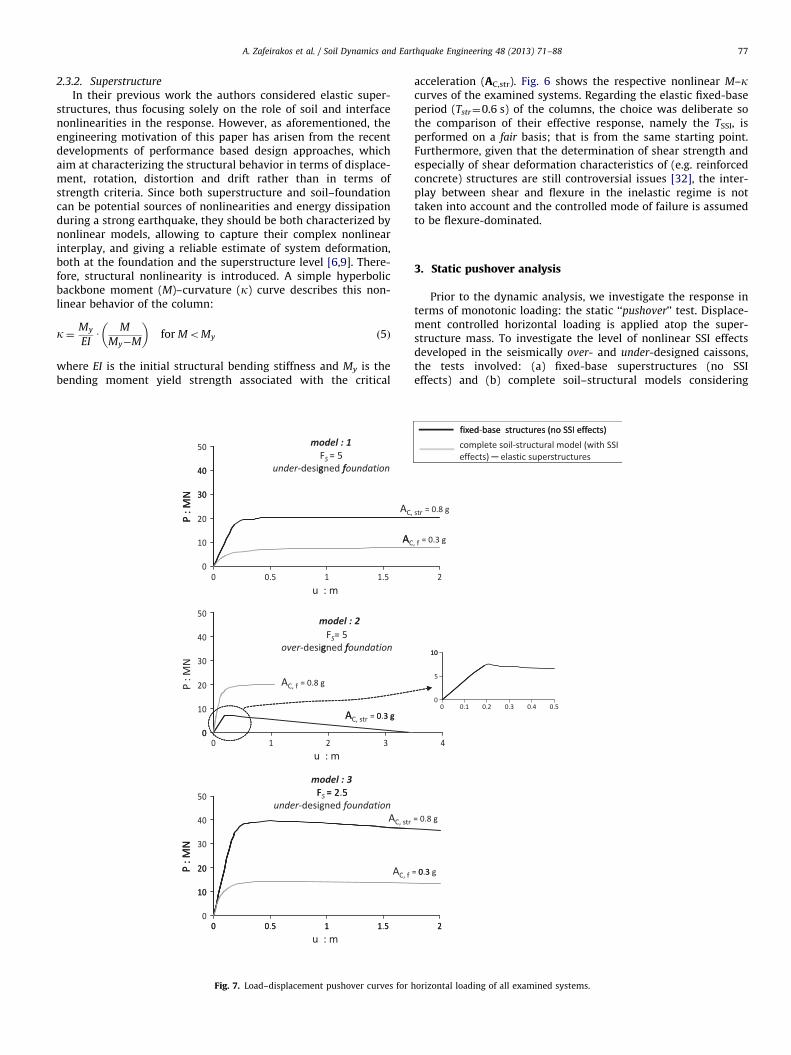
Fig. 7. Load–displacement pushover curves for h
acceleration (AC,str). Fig. 6 shows the respective nonlinear M–kcurves of the examined systems. Regarding the elastic fixed-baseperiod (Tstr¼0.6 s) of the columns, the choice was deliberate sothe comparison of their effective response, namely the TSSI, isperformed on a fair basis; that is from the same starting point.Furthermore, given that the determination of shear strength andespecially of shear deformation characteristics of (e.g. reinforcedconcrete) structures are still controversial issues [32], the inter-play between shear and flexure in the inelastic regime is nottaken into account and the controlled mode of failure is assumedto be flexure-dominated.
3. Static pushover analysis
Prior to the dynamic analysis, we investigate the response interms of monotonic loading: the static ‘‘pushover’’ test. Displace-ment controlled horizontal loading is applied atop the super-structure mass. To investigate the level of nonlinear SSI effectsdeveloped in the seismically over- and under-designed caissons,the tests involved: (a) fixed-base superstructures (no SSIeffects) and (b) complete soil–structural models considering
orizontal loading of all examined systems.
A. Zafeirakos et al. / Soil Dynamics and Earthquake Engineering 48 (2013) 71–8878
elastic superstructures, in order to determine the pure lateralcapacity of the caisson. As illustrated in Fig. 7, in terms of load–displacement relation at the structure mass, SSI effects arevirtually absent in the seismically over-designed foundation(model 2), where structural inelasticity governs entirely thesystem response. Notice the negative slope of the force–displacement curve, attributed to P–d effects and not to stiffnessdegradation of the material of the superstructure. Structural
0.4Aegion-rock TCU-068_ns
Imperial Valley #4-140
-0.8Lefkada-2003
α: gSakarya1.0
05
Sakarya
time : s5 100
3
2
Sa:g
1
00 1 2
T :
Fig. 8. Real earthquake records used for the
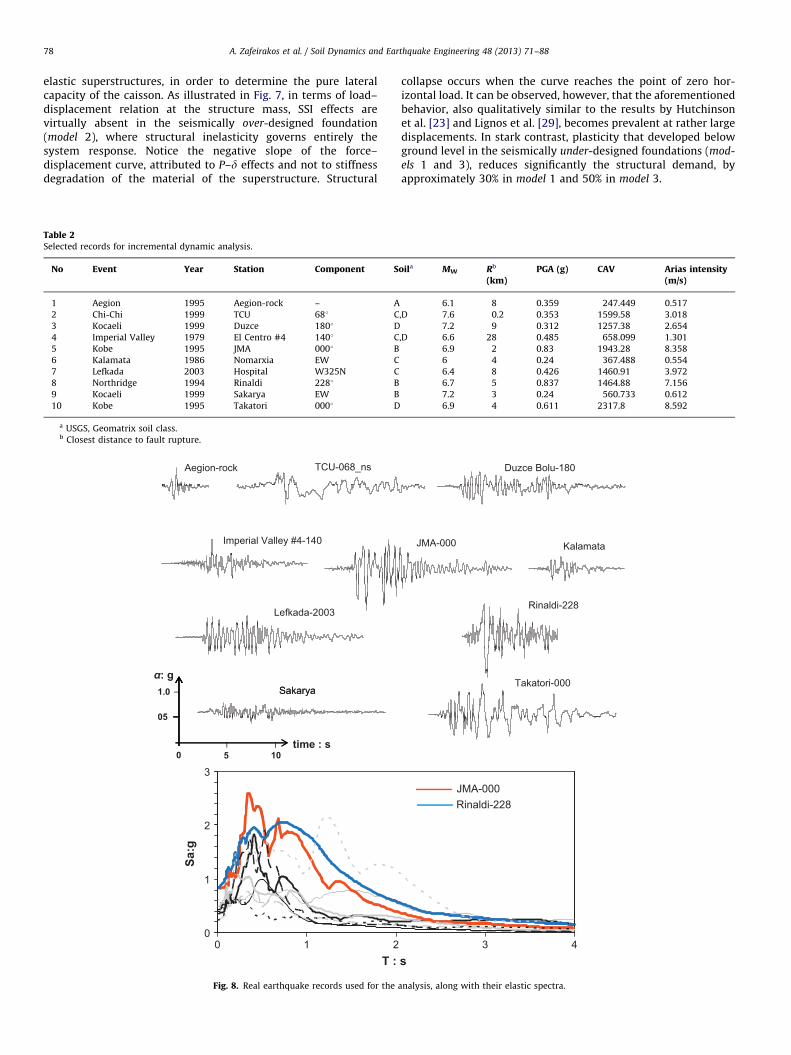
Table 2Selected records for incremental dynamic analysis.
No Event Year Station Component S
1 Aegion 1995 Aegion-rock – A
2 Chi-Chi 1999 TCU 681 C
3 Kocaeli 1999 Duzce 1801 D
4 Imperial Valley 1979 El Centro #4 1401 C
5 Kobe 1995 JMA 0001 B
6 Kalamata 1986 Nomarxia EW C
7 Lefkada 2003 Hospital W325N C
8 Northridge 1994 Rinaldi 2281 B
9 Kocaeli 1999 Sakarya EW B
10 Kobe 1995 Takatori 0001 D
a USGS, Geomatrix soil class.b Closest distance to fault rupture.
collapse occurs when the curve reaches the point of zero hor-izontal load. It can be observed, however, that the aforementionedbehavior, also qualitatively similar to the results by Hutchinsonet al. [23] and Lignos et al. [29], becomes prevalent at rather largedisplacements. In stark contrast, plasticity that developed belowground level in the seismically under-designed foundations (mod-
els 1 and 3), reduces significantly the structural demand, byapproximately 30% in model 1 and 50% in model 3.
Duzce Bolu-180
JMA-000 Kalamata
Rinaldi-228
Takatori-000
JMA-000Rinaldi-228
3 4s
analysis, along with their elastic spectra.
oila MW Rb
(km)PGA (g) CAV Arias intensity
(m/s)
6.1 8 0.359 247.449 0.517
,D 7.6 0.2 0.353 1599.58 3.018
7.2 9 0.312 1257.38 2.654
,D 6.6 28 0.485 658.099 1.301
6.9 2 0.83 1943.28 8.358
6 4 0.24 367.488 0.554
6.4 8 0.426 1460.91 3.972
6.7 5 0.837 1464.88 7.156
7.2 3 0.24 560.733 0.612
6.9 4 0.611 2317.8 8.592
1-D linear analysis
1.2 3-D nonlinear analysis
1
0.6
0.8
0.4
0.2
PG
A a
t gro
und
surfa
ce :
g
00 0.2 0.4 0.6 0.8 1 1.2
Maximum base acceleration : g
Fig. 9. Computed PGA at ground surface versus the maximum base acceleration,
through 1-D linear and 3-D nonlinear analysis. Excitation: TCU-068_ns.
umass
A. Zafeirakos et al. / Soil Dynamics and Earthquake Engineering 48 (2013) 71–88 79
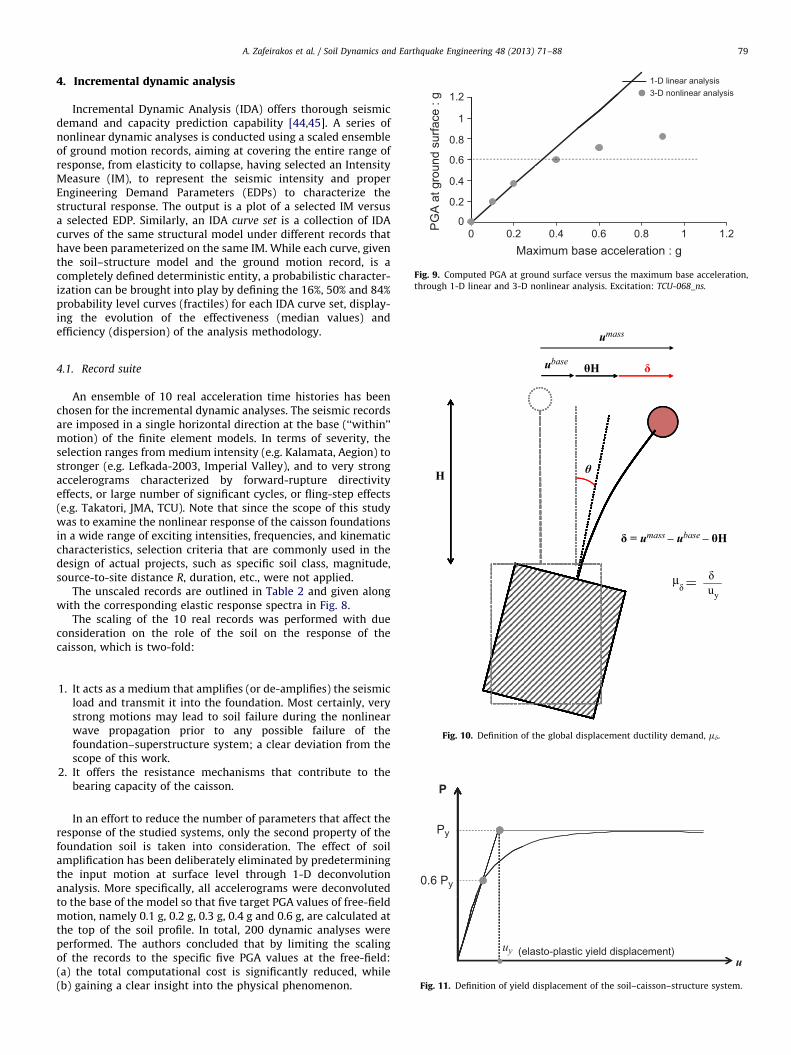
4. Incremental dynamic analysis
Incremental Dynamic Analysis (IDA) offers thorough seismicdemand and capacity prediction capability [44,45]. A series ofnonlinear dynamic analyses is conducted using a scaled ensembleof ground motion records, aiming at covering the entire range ofresponse, from elasticity to collapse, having selected an IntensityMeasure (IM), to represent the seismic intensity and properEngineering Demand Parameters (EDPs) to characterize thestructural response. The output is a plot of a selected IM versusa selected EDP. Similarly, an IDA curve set is a collection of IDAcurves of the same structural model under different records thathave been parameterized on the same IM. While each curve, giventhe soil–structure model and the ground motion record, is acompletely defined deterministic entity, a probabilistic character-ization can be brought into play by defining the 16%, 50% and 84%probability level curves (fractiles) for each IDA curve set, display-ing the evolution of the effectiveness (median values) andefficiency (dispersion) of the analysis methodology.
ubase θH δ
H θ
δ = umass – ubase – θH
δ=δμyu
4.1. Record suite
An ensemble of 10 real acceleration time histories has beenchosen for the incremental dynamic analyses. The seismic recordsare imposed in a single horizontal direction at the base (‘‘within’’motion) of the finite element models. In terms of severity, theselection ranges from medium intensity (e.g. Kalamata, Aegion) tostronger (e.g. Lefkada-2003, Imperial Valley), and to very strongaccelerograms characterized by forward-rupture directivityeffects, or large number of significant cycles, or fling-step effects(e.g. Takatori, JMA, TCU). Note that since the scope of this studywas to examine the nonlinear response of the caisson foundationsin a wide range of exciting intensities, frequencies, and kinematiccharacteristics, selection criteria that are commonly used in thedesign of actual projects, such as specific soil class, magnitude,source-to-site distance R, duration, etc., were not applied.
The unscaled records are outlined in Table 2 and given alongwith the corresponding elastic response spectra in Fig. 8.
The scaling of the 10 real records was performed with dueconsideration on the role of the soil on the response of thecaisson, which is two-fold:
1.
Fig. 10. Definition of the global displacement ductility demand, md.
It acts as a medium that amplifies (or de-amplifies) the seismicload and transmit it into the foundation. Most certainly, verystrong motions may lead to soil failure during the nonlinearwave propagation prior to any possible failure of thefoundation–superstructure system; a clear deviation from thescope of this work.
2.
P
Py
0.6 Py
uy (elasto-plastic yield displacement)u
Fig. 11. Definition of yield displacement of the soil–caisson–structure system.
It offers the resistance mechanisms that contribute to thebearing capacity of the caisson.
In an effort to reduce the number of parameters that affect theresponse of the studied systems, only the second property of thefoundation soil is taken into consideration. The effect of soilamplification has been deliberately eliminated by predeterminingthe input motion at surface level through 1-D deconvolutionanalysis. More specifically, all accelerograms were deconvolutedto the base of the model so that five target PGA values of free-fieldmotion, namely 0.1 g, 0.2 g, 0.3 g, 0.4 g and 0.6 g, are calculated atthe top of the soil profile. In total, 200 dynamic analyses wereperformed. The authors concluded that by limiting the scalingof the records to the specific five PGA values at the free-field:(a) the total computational cost is significantly reduced, while(b) gaining a clear insight into the physical phenomenon.
7.0
6.0 model 1model 2
A. Zafeirakos et al. / Soil Dynamics and Earthquake Engineering 48 (2013) 71–8880
To elaborate on this argument, Fig. 9 compares the PGA atground surface as a function of the maximum input accelerationat the base of the model computed through 1-D linear and3-D nonlinear analysis, for the TCU-068 ns record. At low tomoderate base acceleration levels (less than about 0.3 g) soilnonlinearity has an insignificant effect on the soil response.At higher base acceleration levels, however, there is a significantde-amplification of the ground accelerations compared tolinear response analysis. Observe that the effect of nonlinearitybecomes prominent for PGAs larger than 0.4–0.6 g. Therefore, toavoid excessive soil inelasticity (or even soil failure) due toseismic wave propagation, the maximum input PGA was set equalto 0.6 g.
The IDA curves, however, were based on the actually computedPGA values and not on the targeted ones. The deconvolutiontechnique was used as a crude approximation of the PGA at thesurface and the deviation from the targeted values was certainly not arestriction in our methodology.
Admittedly, simply scaling an acceleration time history tovarious PGA values representing the severity of an earthquake isnot necessarily correct. Obviously, this is not the case for Aegionrecord which can be satisfactorily approximated by a singlesinusoidal pulse.
7.0
PG
A :
m/s
2
TCU-068
6.0
5.0
4.0
3.0
2.0model 1
soil yielding
1.0
0.00 0.01 0.02 0.03
7.0
Ymax : maximum dirift
Ymax : maximum dirift
Ymax : maximum dirift
PG
A :
m/s
2
TCU-068
6.0
5.0
4.0
3.0model 2
1.0
2.0structural yielding
0.00 0.01 0.02 0.03
7.0
PG
A :
m/s
2
6.0
5.0
4.0
3.0model 3
2.0 soil yielding
1.0
0.00 0.01 0.02 0.03
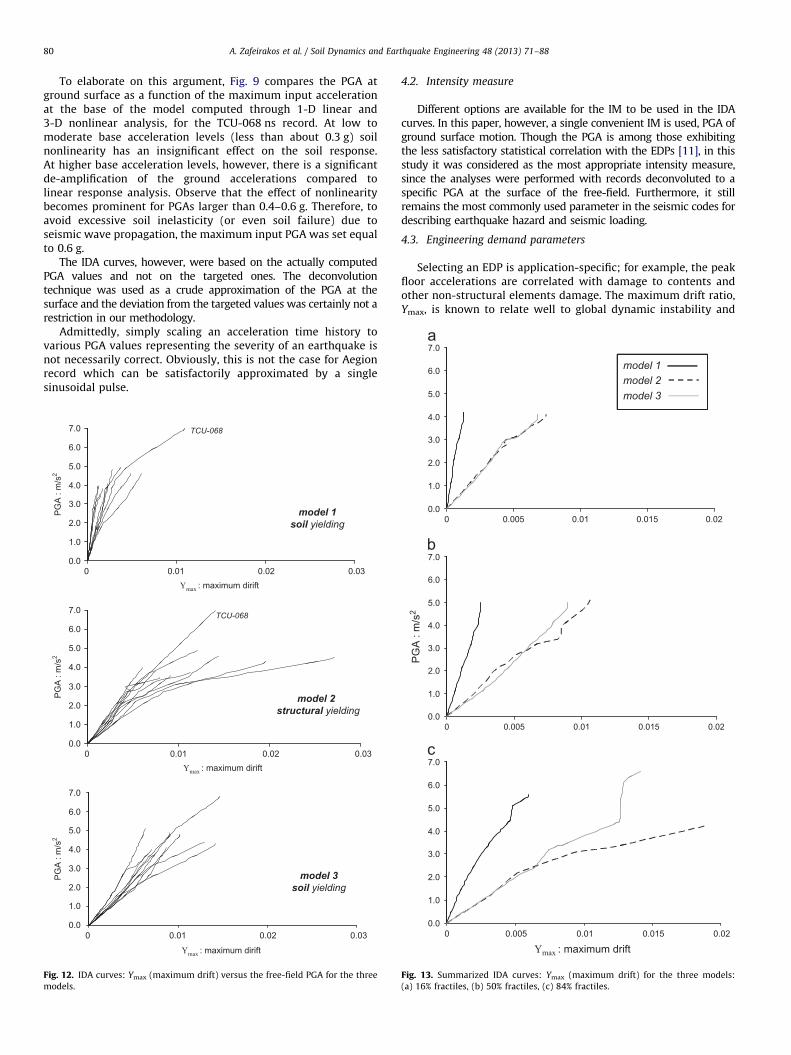
Fig. 12. IDA curves: Ymax (maximum drift) versus the free-field PGA for the three
models.
4.2. Intensity measure
Different options are available for the IM to be used in the IDAcurves. In this paper, however, a single convenient IM is used, PGA ofground surface motion. Though the PGA is among those exhibitingthe less satisfactory statistical correlation with the EDPs [11], in thisstudy it was considered as the most appropriate intensity measure,since the analyses were performed with records deconvoluted to aspecific PGA at the surface of the free-field. Furthermore, it stillremains the most commonly used parameter in the seismic codes fordescribing earthquake hazard and seismic loading.
4.3. Engineering demand parameters
Selecting an EDP is application-specific; for example, the peakfloor accelerations are correlated with damage to contents andother non-structural elements damage. The maximum drift ratio,Ymax, is known to relate well to global dynamic instability and
5.0 model 3
4.0
3.0
2.0
1.0
0.00 0.005 0.01 0.015 0.02
7.0
6.0
5.0
4.0
3.0
PG
A :
m/s
2
2.0
1.0
0.00 0.005 0.01 0.015 0.02
7.0
6.0
5.0
4.0
3.0
2.0
1.0
0.00 0.005 0.01 0.015 0.02
Ymax : maximum drift
Fig. 13. Summarized IDA curves: Ymax (maximum drift) for the three models:
(a) 16% fractiles, (b) 50% fractiles, (c) 84% fractiles.
A. Zafeirakos et al. / Soil Dynamics and Earthquake Engineering 48 (2013) 71–88 81
several structural performance limit-states upon which we intendto focus [45,46,]. In this paper, the following EDPs are considered:
�
Figmo
The maximum total horizontal drift of the oscillator, Ymax
Ymax ¼maxumass�ustructure base
H
� �ð6Þ
�
The maximum ductility demand: md.The global (displacement) ductility demand,md, includingthe SSI effects, is the maximum ratio of the induced flexural
distortion of the superstructure (free of any rigid-body motion)divided by a characteristic displacement, designated as yielddisplacement, uy :md ¼maxumass�ðustructure baseþyHÞ
uy
� �ð7Þ
where as schematically depicted in Fig. 10, y is the caisson rotationand H the structure height. The yield displacement uyis assessedthrough the static pushover analyses of the systems, consideringfixed-base structures, according to the following procedure, also
7.0
PG
A :
m/s
2
6.0
5.0
4.0
3.0
2.0model 1
soil yielding
1.0
0.03210
7.0
PG
A :
m/s
2
6.0
5.0
4.0
3.0
2.0 model 2
1.0structural yielding
0.03210
7.0
PG
A: m
/s2
6.0
5.0
4.0
3.0 model 32.0 soil yielding
1.0
0.03210
μ
: maximum ductilityδμ
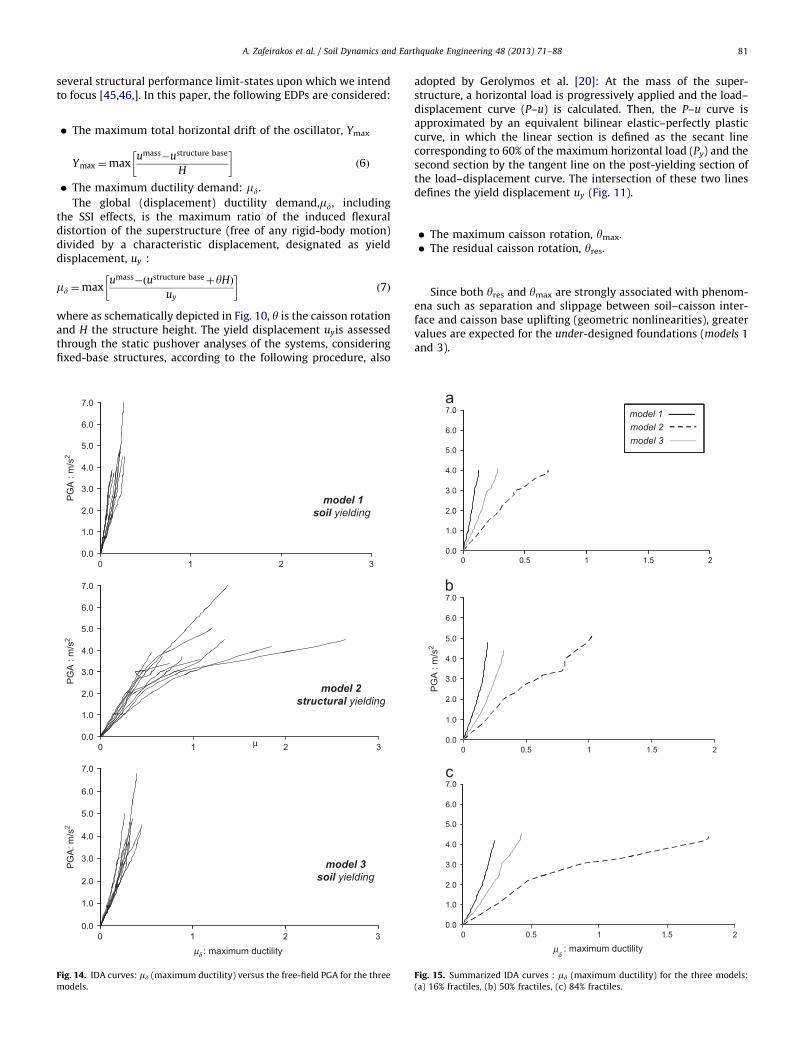
. 14. IDA curves: md (maximum ductility) versus the free-field PGA for the three
dels.
adopted by Gerolymos et al. [20]: At the mass of the super-structure, a horizontal load is progressively applied and the load–displacement curve (P–u) is calculated. Then, the P–u curve isapproximated by an equivalent bilinear elastic–perfectly plasticcurve, in which the linear section is defined as the secant linecorresponding to 60% of the maximum horizontal load (Py) and thesecond section by the tangent line on the post-yielding section ofthe load–displacement curve. The intersection of these two linesdefines the yield displacement uy (Fig. 11).
�
Fig(a)
The maximum caisson rotation, ymax.
� The residual caisson rotation, yres.Since both yres and ymax are strongly associated with phenom-ena such as separation and slippage between soil–caisson inter-face and caisson base uplifting (geometric nonlinearities), greatervalues are expected for the under-designed foundations (models 1and 3).
7.0
6.0
model 1
5.0
model 2
4.0
model 3
3.0
2.0
1.0
0.00 0.5 1 1.5 2
7.0
6.0
5.0
4.0
3.0
PG
A :
m/s
2
2.0
1.0
0.00 0.5 1 1.5 2
7.0
6.0
5.0
4.0
3.0
2.0
1.0
0.00 0.5 1 1.5 2
: maximum ductilityδ
μ
. 15. Summarized IDA curves : md (maximum ductility) for the three models:
16% fractiles, (b) 50% fractiles, (c) 84% fractiles.
A. Zafeirakos et al. / Soil Dynamics and Earthquake Engineering 48 (2013) 71–8882
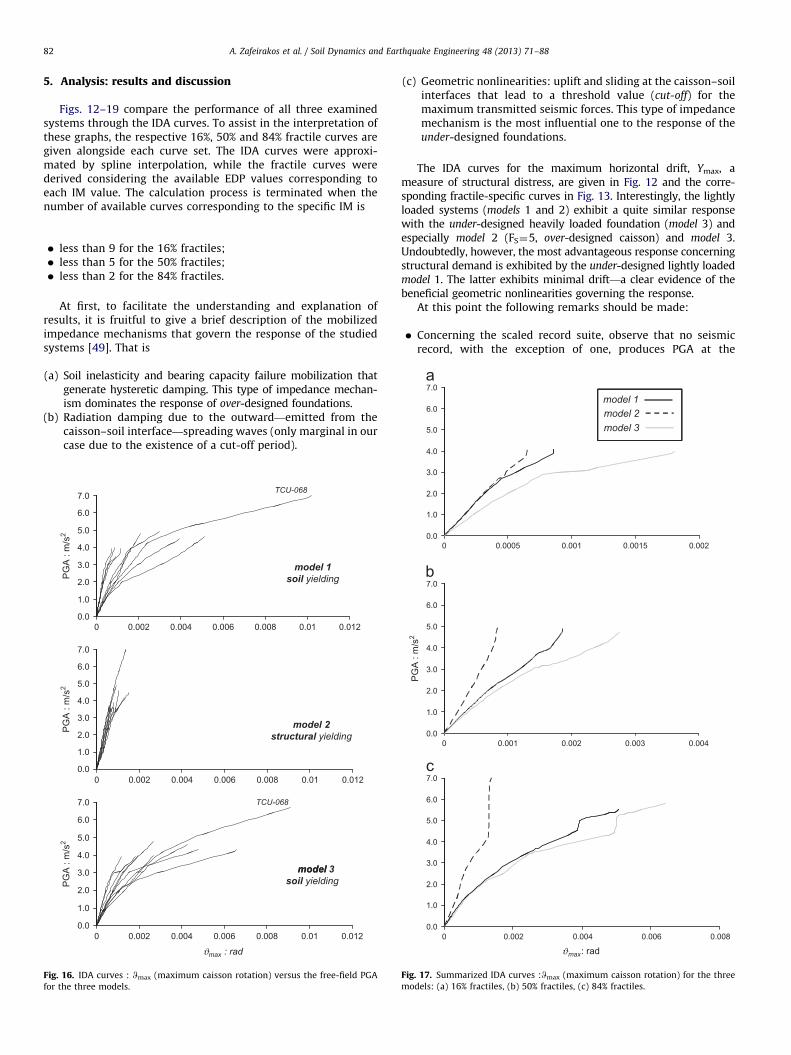
5. Analysis: results and discussion
Figs. 12–19 compare the performance of all three examinedsystems through the IDA curves. To assist in the interpretation ofthese graphs, the respective 16%, 50% and 84% fractile curves aregiven alongside each curve set. The IDA curves were approxi-mated by spline interpolation, while the fractile curves werederived considering the available EDP values corresponding toeach IM value. The calculation process is terminated when thenumber of available curves corresponding to the specific IM is
�
Figfor
less than 9 for the 16% fractiles;
� less than 5 for the 50% fractiles; � less than 2 for the 84% fractiles.At first, to facilitate the understanding and explanation ofresults, it is fruitful to give a brief description of the mobilizedimpedance mechanisms that govern the response of the studiedsystems [49]. That is
(a)
.t
7.0
6.0model 1
Soil inelasticity and bearing capacity failure mobilization thatgenerate hysteretic damping. This type of impedance mechan-ism dominates the response of over-designed foundations.
model 2
(b) 5.04.0
model 3
Radiation damping due to the outward—emitted from thecaisson–soil interface—spreading waves (only marginal in ourcase due to the existence of a cut-off period).7.0
PG
A :
m/s
2
TCU-068
6.0
5.0
3.0
4.0
2.0
model 1
soil yielding
1.0
0.00 0.002 0.004 0.006 0.008 0.01 0.012
7.0
6.0
PG
A :
m/s
2 5.0
4.0
3.0
2.0model 2
structural yielding
0.0
1.0
0 0.002 0.004 0.006 0.008 0.01 0.012
7.0
PG
A :
m/s
2
TCU-068
6.0
4.0
5.0
3.0
2.0
model 3model
soil yielding
1.0
0.00 0.002 0.004 0.006 0.008 0.01 0.012
ϑmax : rad
16. IDA curves : Wmax (maximum caisson rotation) versus the free-field PGA
he three models.
(c)
2
Fig.mod
Geometric nonlinearities: uplift and sliding at the caisson–soilinterfaces that lead to a threshold value (cut-off) for themaximum transmitted seismic forces. This type of impedancemechanism is the most influential one to the response of theunder-designed foundations.
The IDA curves for the maximum horizontal drift, Ymax, ameasure of structural distress, are given in Fig. 12 and the corre-sponding fractile-specific curves in Fig. 13. Interestingly, the lightlyloaded systems (models 1 and 2) exhibit a quite similar responsewith the under-designed heavily loaded foundation (model 3) andespecially model 2 (FS¼5, over-designed caisson) and model 3.Undoubtedly, however, the most advantageous response concerningstructural demand is exhibited by the under-designed lightly loadedmodel 1. The latter exhibits minimal drift—a clear evidence of thebeneficial geometric nonlinearities governing the response.
At this point the following remarks should be made:
�
Concerning the scaled record suite, observe that no seismicrecord, with the exception of one, produces PGA at the3.0
2.0
1.0
0.0
7.0
0 0.0005 0.001 0.0015 0.002
6.0
5.0
4.0
3.0
PG
A :
m/s
2.0
1.0
0.00 0.001 0.002 0.003 0.004
7.0
6.0
5.0
4.0
3.0
2.0
1.0
0.00 0.002 0.004 0.006 0.008
: radϑmax
17. Summarized IDA curves :Wmax (maximum caisson rotation) for the three
els: (a) 16% fractiles, (b) 50% fractiles, (c) 84% fractiles.
Figthe
A. Zafeirakos et al. / Soil Dynamics and Earthquake Engineering 48 (2013) 71–88 83
free-field greater than 0.6 g. The remarkable TCU-068 record(from Chi-Chi, 1999), however, proves the severity of the near-fault ground motions bearing fling-step, by reaching 0.71 gafter propagating through the nonlinear soil stratum, eventhough scaled for 0.6 g in a 1-D equivalent linear analysis. It isfurthermore obvious that the IM used in the analyses (PGA atthe free-field) cannot be predicted a priori.
� Note that from the analyses no ‘flatlines’ [44–46] wereproduced, which would indicate a rapid increase of the EDPtowards ‘infinite’ values for small changes in the IM, thussignaling global dynamic instability. The explanation lies inthe definition of the problem and the selection of the IM, since,as justified previously, the maximum PGA at the free-field towhich the seismic records were scaled was 0.6 g.
�7.0
model 16.0model 2
5.0
The aforementioned observations may explain why in thisstudy the widely used tracing algorithms, such as the Hunt &
Fill or the constant IM-step algorithms [45,46] could not beimplemented for the generation of the IDA curves.
The IDA curves for the maximum displacement ductilitydemand (md) are portrayed in Figs. 14 and 15. Once more, thebeneficial influence of geometric nonlinearities, dominant in theresponse of the seismically under-designed foundations (models 1and 3), on the distress of the superstructure is evident. While theover-designed model 2 exhibits ductility demands mdZ1 for mostof the seismic motions, the respective demand on the columnsfounded on the under-designed caissons is mdr1. This may beattributed to the fact that although the over-designed caisson
7.0
PG
A :
m/s
2
TCU-0686.0
4.0
5.0
3.0
2.0model 1
soil yielding
1.0
0.00 0.0005 0.001 0.0015 0.002
7.0
6.0
PG
A :
m/s
2 5.0
4.0
3.0
1.0
2.0model 2
structural yielding
0.00 0.0005 0.001 0.0015 0.002
7.0
PG
A :
m/s
2
TCU-068
6.0
4.0
5.0
3.0
2.0model 3
soil yielding1.0
0.00 0.0005 0.001 0.0015 0.002
ϑres : rad
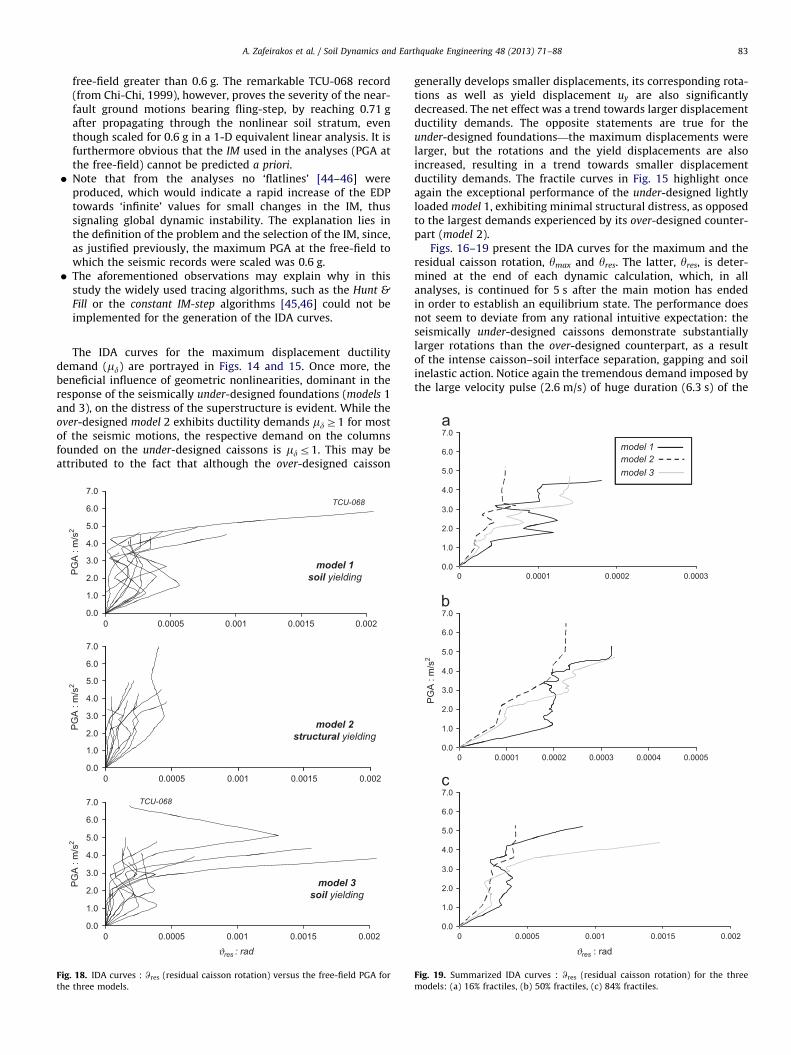
. 18. IDA curves : Wres (residual caisson rotation) versus the free-field PGA for
three models.
generally develops smaller displacements, its corresponding rota-tions as well as yield displacement uy are also significantlydecreased. The net effect was a trend towards larger displacementductility demands. The opposite statements are true for theunder-designed foundations—the maximum displacements werelarger, but the rotations and the yield displacements are alsoincreased, resulting in a trend towards smaller displacementductility demands. The fractile curves in Fig. 15 highlight onceagain the exceptional performance of the under-designed lightlyloaded model 1, exhibiting minimal structural distress, as opposedto the largest demands experienced by its over-designed counter-part (model 2).
Figs. 16–19 present the IDA curves for the maximum and theresidual caisson rotation, ymax and yres. The latter, yres, is deter-mined at the end of each dynamic calculation, which, in allanalyses, is continued for 5 s after the main motion has endedin order to establish an equilibrium state. The performance doesnot seem to deviate from any rational intuitive expectation: theseismically under-designed caissons demonstrate substantiallylarger rotations than the over-designed counterpart, as a resultof the intense caisson–soil interface separation, gapping and soilinelastic action. Notice again the tremendous demand imposed bythe large velocity pulse (2.6 m/s) of huge duration (6.3 s) of the
model 3
4.0
3.0
2.0
1.0
0.00 0.0001 0.0002 0.0003
7.0
6.0
5.0
4.0
3.0
PG
A :
m/s
2
2.0
1.0
0.00 0.0001 0.0002 0.0003 0.0004 0.0005
7.0
6.0
5.0
4.0
3.0
2.0
1.0
0.00 0.0005 0.001 0.0015 0.002
ϑres : rad
Fig. 19. Summarized IDA curves : Wres (residual caisson rotation) for the three
models: (a) 16% fractiles, (b) 50% fractiles, (c) 84% fractiles.
A. Zafeirakos et al. / Soil Dynamics and Earthquake Engineering 48 (2013) 71–8884
TCU-068 record on the under-designed caissons, causing globalinstability and system failure of the lightly loaded model 1 atPGA¼0.7 g. Nevertheless, it is remarkable that with the exception
7.0
6.0
4.0
5.0
3.0
2.0
0.0
1.0
0 1 2 3
7.0
6.0
4.0
5.0
3.0
1.0
2.0PG
A: m
/s2
0.00 1 2 3
7.0
6.0
4.0
5.0
3.0
1.0
2.0
0.00 1 2 3
a max : m/s2
Fig. 20. IDA curves of amax (maximum acceleratio
Fig. 21. Acceleration time-histories and ‘‘floor’’ response spectra comparison at the m
superstructure. Record: JMA-000, scaled at free-field PGA¼0.4 g.
of the performance under the TCU record at high PGA levels(which incidentally are 2 times higher than the actual record), theunder-designed caissons can avoid collapse sustaining rather
amax
model 1FS= 5H = 46 msoil yielding
critical A C, f
4
critical A C, str
critical A C, f
4
4
model 2FS= 5H = 12 mstructural yielding
model 3FS= 2.5H = 18 msoil yielding
amax
amax
n at the structure mass) for the three models.
ass level for the over-designed model 2 considering (a) inelastic and (b) elastic

A. Zafeirakos et al. / Soil Dynamics and Earthquake Engineering 48 (2013) 71–88 85
tolerable rotations and displacements. This observation is con-sistent with the results presented by the authors in [49], in whichit was shown that in the over-designed foundations the developeddrift is mainly due to flexural distortion, whereas in the under-
designed ones the drift is mainly due to foundation rotation.Worthy of note are the irregularities exhibited in the IDA
curves for the yres in the under-designed caissons, as depicted inFigs. 18–19. Observe the instabilities followed by regain at higherlevels, consistent with the variability of the response as a functionof the individual records, but especially with the random natureof this EDP.
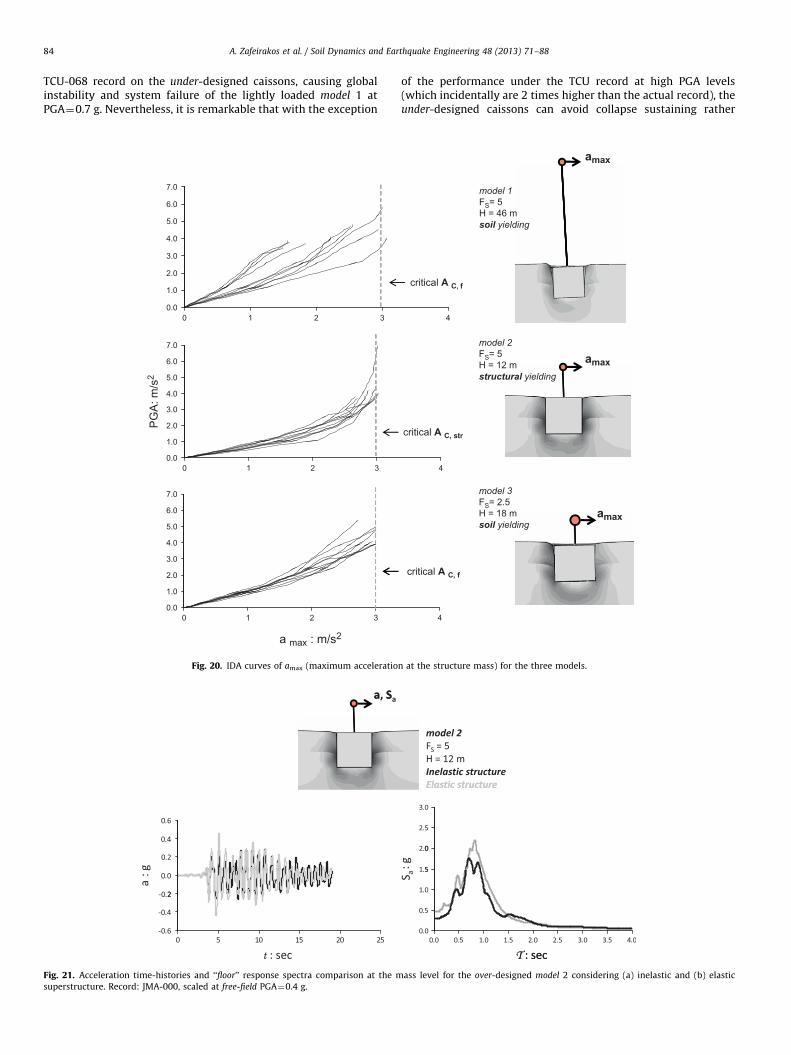
5.1. IDA curves of maximum acceleration at mass level
In Fig. 20 the comparison is performed for the maximumacceleration at mass level as the Earthquake Demand Parameter.It is immediately evident that all systems exhibit a threshold atamaxE0.3 g. However, the mechanisms for this acceleration cut-off
differ with respect to the seismic safety factor of the foundation:
(a)
Fig.base
PGA
In the under-designed foundations, it is the geometric non-linearities and soil inelasticity that dominate the response
22. Typical dynamic response comparison for the systems with FS¼5 (light structure) in
rotation, (c) caisson settlement–-column base rotation. (1) Under-designed founda
¼0.4 g.
and control the value that cannot be exceeded by thetransmitted seismic force thus providing a type of seismicisolation for the superstructure (AC,f¼0.3 g).
(b)
In the over-designed foundation it is the structural inelasticitythat sets an acceleration plateau at AC,str¼0.3 g, stemmingfrom the bending moment capacity at the base of the column.The results once again emphasize the favorable performanceexhibited by the under-designed caissons in terms of structuraldemand, which become more prominent when combined with aconservative static design: for a given PGA level, smaller accel-erations are transmitted to the under-designed lightly loadedmodel 1 than the other two systems.
To further elucidate the effect of structural inelasticity on theseismic response, Fig. 21 compares the acceleration time-historiesand the corresponding ‘‘floor’’ response spectra at the mass levelof the over-designed model 2 considering both elastic and inelas-tic superstructure. Excitation: JMA-000 record, down-scaled at afree-field PGA¼0.4 g, is used. As expected, an elastic superstruc-ture allows a large inertia force to develop at the mass, whereascolumn inelasticity provides a cut-off for the transmittedaccelerations.
terms of (a) acceleration time-history at the mass level, (b) moment–column
tion, (2) Over-designed foundation. Record: JMA-000, scaled at free-field

A. Zafeirakos et al. / Soil Dynamics and Earthquake Engineering 48 (2013) 71–8886
5.2. Some detailed results of dynamic analysis
To get a detailed insight into the nonlinear response mechan-isms, typical results of the analyses are portrayed in Figs. 22 and23 in terms of acceleration time-histories at the mass level, andmoment–rotation and settlement–rotation loops at the head ofthe caisson. Shaking: JMA-000 record, down-scaled at a free-field
PGA¼0.4 g.The strong contribution of geometric nonlinearities in de-
amplifying the seismic motion is again evident in both the lightlyand the heavily loaded systems (Figs. 22a1 and 23a3). Yet, intenseinterface gapping does not provide only a threshold for thetransmitted accelerations to the superstructure, but also affects
Fig. 23. Typical dynamic response comparison for the under-designed heavily
loaded foundation (FS¼2.5) in terms of (a) acceleration time-history at the mass
level, (b) moment-column base rotation, (c) caisson settlement-column base
rotation. Record: JMA-000, scaled at free-field PGA¼0.4 g.
the frequency content of the motions: note the long-periodmotions calculated at the structures founded on the under-designed caissons (models 1 and 3) as opposed to the higher-frequency motion developed at the over-designed model 2(Fig. 22a2).
The moment–rotation (M–y) curves at caisson head forFS¼2.5 and FS¼5.0 are presented in Figs. 22b1,b2 and 23b3respectively. P–d effects were considered in the calculations.Respecting their design principles, the over-designed foundation(model 2) experiences limited inelasticity, while the under-
designed ones (models 1 and 3) behave strongly inelastic. Oncemore, the advantageous contribution of the interface(Figs. 22b1�23b3) rather than the material (Fig. 22b2) andstructural nonlinearities in damping the seismic energy isapparent. The shape of the loops in Figs. 22b1 and 23b3 reflectsthe successive detachments/re-attachments of the caisson fromthe surrounding soil. Another noteworthy observation from theM–y loops of both heavily and lightly loaded structures is thatthey do not exhibit significant strength degradation, indicatingminor P–d effects.
However, this favorable performance is not attainable at zerocost: in this case an increase of foundation settlements isexpected. Studying the settlement–rotation (w–y) response ofthe seismically over- and under-designed caissons for FS¼5(‘‘light’’ superstructure), presented in Fig. 22c1,c2, the over-designed caisson experiences practically elastic settlementwE2 cm. Remarkably, the under-designed alternative experi-ences only marginally larger and quite tolerable seismicallyinduced settlement, wE2.5 cm and minimal residual rotation.
As anticipated, the heavily loaded (FS¼2.5) model 3 exhibitslarger accumulated settlements than the lightly loaded counter-parts: wE5.5 cm, as portrayed in Fig. 23c3. An interestingobservation that may be extracted from the (w–y) loops is thatthe low FS system not only sustains larger residual rotations thanthe high FS systems, but also the forward directivity pulse carriedby the JMA record determines its response.
6. Summary and conclusions
The present study compares the dynamic response of seismi-cally over- and seismically under-designed caisson foundationsand evaluates the effect of the nonlinear phenomena developedbelow ground surface on the seismic demand of the superstruc-tures. SDOF structures of varying mass weight, simulating heavilyor lightly loaded structures founded through similar rigid cubiccaissons on a 2-layer soil stratum are used as examples. Theinvestigation is performed considering soil and structural non-linearity through 3D finite element incremental dynamic analysis(IDA). An ensemble of 10 earthquake motions ranging frommedium intensity to very strong, scaled at different PGAs ofground surface motion, was used as base excitation. IDA curveswere generated for the maximum horizontal drift, the maximumglobal ductility demand, the maximum caisson rotation and theresidual caisson rotation. The maximum acceleration developedat the superstructure mass was introduced as an ad hoc Engineer-ing Demand Parameter.
From the study, the following conclusions could be inferred:
�
In terms of structural distress, there is a distinct predominancein the performance of the structures founded on the under-designed caissons (models 1 and 3) developing significantlyreduced horizontal drifts and ductility demands, as opposed tothe one founded on the over-designed caisson; clear evidence

A. Zafeirakos et al. / Soil Dynamics and Earthquake Engineering 48 (2013) 71–88 87
that the mechanism of interface nonlinearities acts as a ‘‘fuse’’
for the superstructure.
� Concerning the accelerations developed at the structure masslevel, both mechanisms of geometric nonlinearities and struc-tural inelasticity, prevalent in the response of the seismicallyunder- and over-designed foundations respectively, provide aplateau for the maximum transmitted accelerations. Due tothe strongly nonlinear soil–structure interaction effects pre-sent in the former mechanism, however, the superstructureexperiences a longer-period motion as compared to the onefiltered by the localized plasticity in the column.
� In terms of system performance, the under-designed founda-tions experienced increased dynamic settlements and rota-tions as compared to the over- designed one. Strikingly,however, they sustained only minimal residual displacementsand tilting, owing much to the massive weight of the caissonwhich acts as a restoring force.
Overall, the study highlighted the efficacy of under-designedcaisson foundations with high static factor of safety, providing alow-cost foundation solution with a high seismic isolation potential.
Acknowledgments
A. Zafeirakos acknowledges the financial support from theEuropean Union (European Social Fund – ESF) and Greek nationalfunds through the Operational Program ‘‘Education and LifelongLearning’’ of the National Strategic Reference Framework (NSRF) –Research Funding Program: Heracleitus II. Investing in knowledgesociety through the European Social Fund.
N. Gerolymos and V. Drosos acknowledge financial supportfrom the research project ‘‘DARE’’ funded by the EuropeanResearch Council’s Programme ‘‘Ideas’’ in support for FrontierResearch, under Contract number ERC-2008-AdG 228254-DARE.
References
[1] ABAQUS, Inc. ABAQUS analysis user’s manual, VERSION 6.8, Providence, RI,USA; 2008.
[2] Anastasopoulos I, Gazetas G, Loli M, Apostolou M, Gerolymos N. Soil failurecan be used for seismic protection of structures. Bulletin of EarthquakeEngineering 2010;8:309–26.
[3] Bertero VV. Strength and deformation capacities of buildings under extremeenvironments. In: Pister KS, editor. Structural engineering and structuralmechanics. Englewood Cliffs, NJ: Prentice Hall; 1977. p. 211–5.
[4] Borja RI, Wu WH, Smith HA. Nonlinear response of vertically oscillating rigidfoundations. Journal of Geotechnical and Geoenvironmental Engineering,ASCE 1993;119(5):893–911.
[5] Borja RI, Wu WH, Amies AP, Smith HA. Nonlinear lateral, rocking, andtorsional vibrations of rigid foundations. Journal of Geotechnical and Geoen-vironmental Engineering, ASCE 1994;94(3):491–513.
[6] Chatzigogos CT, Figini R, Pecker A, Salenc-on J. A macroelement formulationfor shallow foundations on cohesive and frictional soils. International Journalfor Numerical and Analytical Methods in Geomechanics 2011;35(8):902–31.
[7] Dominguez J. Dynamic stiffness of rectangular foundations. Research reportR78-20, MIT; 1978.
[8] Elsabee F., Morray J.P. Dynamic behavior of embedded foundations. Researchreport R77-33. MIT; 1977.
[9] Figini R, Paolucci R, Chatzigogos CT. A macro-element model for non-linearsoil–shallow foundation–structure interaction under seismic loads: theore-tical development and experimental validation on large scale tests. Earth-quake Engineering & Structural Dynamics 2012;41(3):475–93.
[10] Gajan S, Kutter BL, Phalen JD, Hutchinson TC, Martin GR. Centrifuge modelingof load-deformation behavior of rocking shallow foundations. Soil Dynamicsand Earthquake Engineering 2005;25:773–83.
[11] Garini E, Gazetas G. Destructiveness of earthquake ground motions: intensitymeasures versus sliding displacement. In: Proceedings of 2nd internationalconference on performance-based design in earthquake geotechnical engi-neering, May 28–30, 2012, Taormina, Italy. p. 886–99.
[12] Gazetas G. Analysis of machine foundation vibrations: state of the art. SoilDynamics and Earthquake Engineering 1983;2:2–42.
[13] Gazetas G. Simple physical methods for foundation impedances. In: BenerjeePK, Butterfield R, editors. Dynamics of Foundations and Buried Structures.Elsevier Applied Science; 1987. p. 44–90 [Chapter 2].
[14] Gazetas G, Apostolou M, Anastasopoulos I. Seismic uplifting of foundationson soft soil, with examples from Adapazari (Izmit 1999, Earthquake).Foundations: Innovations, Observations, Design & Practice. British Geotech-nical Association 2003:37–50.
[15] Gelagoti F, Kourkoulis R, Anastasopoulos I, Gazetas G. Rocking isolation oflow-rise frame structures founded on isolated footings. Earthquake Engineer-ing & Structural Dynamics 2012;41(7):1177–97.
[16] Gerolymos N, Gazetas G. Winkler model for lateral response of rigid caissonfoundations in linear soil. Soil Dynamics and Earthquake Engineering2006;25(5):347–61.
[17] Gerolymos N, Gazetas G. Development of Winkler model for static anddynamic response of caisson foundations with soil and interface nonlinea-rities. Soil Dynamics and Earthquake Engineering 2006;26(5):363–76.
[18] Gerolymos N, Gazetas G. Static and dynamic response of massive caissonfoundations with soil and interface nonlinearities—validation and results.Soil Dynamics and Earthquake Engineering 2006;26(5):377–94.
[19] Gerolymos N, Giannakou A, Anastasopoulos I, Gazetas G. Evidence ofbeneficial role of inclined piles: Observations and summary of numericalanalyses. Bulletin of Earthquake Engineering 2008;6(4):705–22.
[20] Gerolymos N, Drosos V, Gazetas G. Seismic response of single-column benton pile: evidence of beneficial role of pile and soil inelasticity. Bulletin ofEarthquake Engineering 2009;7(2):547–73.
[21] Giannakou A, Gerolymos N, Gazetas G, Tazoh T, Anastasopoulos I. Seismicbehavior of batter piles: elastic response. Journal of Geotechnical andGeoenvironmental Engineering, ASCE 2010;136(9):1187–99.
[22] Harden CW, Hutchinson TC. Beam-on-nonlinear-Winkler-foundation model-ing of shallow, rocking-dominated footings. Earthquake Spectra 2009;25(2):277–300.
[23] Hutchinson TC, Boulanger RW, Chai Y.H., Idriss I.M. Inelastic seismic responseof extended pile shaft supported bridge structures. PEER Report 2002/14.Department of Civil and Environmental Engineering University of California,Irvine, Department of Civil and Environmental Engineering University ofCalifornia, Davis.
[24] Ishibashi I, Zhang X. Unified dynamic shear moduli and damping ratios ofsand and clay. Soils & Foundations 1993;33(1):12–191.
[25] Kausel E. Forced vibrations of circular foundations on layered media.Research Report R74-11. MIT; 1974.
[26] Kausel E, Roesset JM. Dynamic stiffness of circular foundations. Journal of theEngineering Mechanics Division, ASCE 1975;101(6):770–85.
[27] Kawashima K., Nagai T., Sakellaraki D. Rocking seismic isolation of bridgessupported by spread foundations. In: Proceedings of the 2nd Japan–Greeceworkshop on seismic design, observation, and retrofit of foundations, Tokyo,Japan; April 3–4, 2007. p. 254–65.
[28] Lam IP, Chaudhury D. Modeling of drilled shafts for seismic design. NCEERReport II2D-2.5. The National Center for Construction Education andResearch; 1997.
[29] Lignos DG, Krawinkler H, Whittaker AS. Prediction and validation of sideswaycollapse of two scale models of a 4-story steel moment frame. EarthquakeEngineering and Structural Dynamics 2011;40(7):807–25.
[30] Luco JE, Westman RA. Dynamic response of circular footings. Journal of theEngineering Mechanics Division, ASCE 1971;97(5):1381–95.
[31] Luco N, Cornell CA. Effects of connection fractures on SMRF seismic driftdemands. Journal of Geotechnical and Geoenvironmental Engineering, ASCE2000;126:127–36.
[32] Mergos PE, Kappos AJ. Seismic damage analysis including inelastic shear–flexure interaction. Bulletin of Earthquake Engineering 2010;8:27–46.
[33] Mita A, Luco JE. Dynamic response of a square foundation embedded in an elastichalfspace. Soil Dynamics and Earthquake Engineering 1989;8(2):54–67.
[34] Nassar A.A., Krawinkler H Seismic demands for SDOF and MDOF systems.Research report No. 95. The John A. Blume Earthquake Engineering Center,Stanford University; 1991.
[35] Novak M, Beredugo YO. Vertical vibration of embedded footings. Journalof the Soil Mechanics and Foundations Division, ASCE 1972;98(SM12):1291–310.
[36] Paolucci R. Simplified evaluation of earthquake induced permanent displace-ment of shallow foundations. Journal of Earthquake Engineering 1997;1(3):563–79.
[37] Panagiotidou AI, Gazetas G, Gerolymos N. Pushover and seismic response offoundations on stiff clay: analysis with P–D effects. Earthquake Spectra2012;28(4):1589–618.
[38] Pecker A. Capacity design principles for shallow foundations in seismic areas.In: Proceedings of the 11th European conference on earthquake engineering;1998. p. 303–16.
[39] Pecker A. A seismic foundation design process, lessons learned from twomajor projects: the Vasco de Gama and the Rion Antirion bridges. In: ACIinternational conference on seismic bridge design and retrofit, University ofCalifornia at San Diego, La Jolla, USA; 2003.
[40] Pecker A, Chatzigogos C.T.. Non linear soil structure interaction: impact onthe seismic response of structures. Geotechnical, Geological, and EarthquakeEngineering (17); 2010: 79–103 [Earthquake Engineering in Europe].
[41] Suarez V, Kowalsky MJ. Displacement-based seismic design of drilled shaftbents with soil-structure interaction. Journal of Earthquake Engineering2007;11(6):1010–30.

A. Zafeirakos et al. / Soil Dynamics and Earthquake Engineering 48 (2013) 71–8888
[42] Tajirian FF, Tabatabaie M. Vibration analysis of foundations in layered media.Vibration Problems in Geotechnical Engineering, ASCE 1985:27–46.
[43] Tassoulas J.L. Elements for the numerical analysis of wave motion in layeredmedia. Research report R81-2. MIT; 1981.
[44] Vamvatsikos D, Cornell CA. Incremental dynamic analysis. EarthquakeEngineering and Structural Dynamics 2002;31(3):491–514.
[45] Vamvatsikos D, Cornell CA. Applied incremental dynamic analysis. Earth-quake Spectra 2004;20(2):523–53.
[46] Vamvatsikos D, Cornell C.A. Tracing and post-processing of IDA curves:theory and software implementation. Report No. RMS-44, RMS Program,Stanford University, Stanford; 2001.
[47] Varun, Assimaki D, Gazetas G. A simplified model for lateral response of largediameter caisson foundations-linear elastic formulation. Soil Dynamics andEarthquake Engineering 2009;29(2):268–91.
[48] Vetetsos AS, Wei YT. Lateral and rocking vibration of footings. Journal of theSoil Mechanics and Foundations Division, ASCE 1971;97:1227–48.
[49] Zafeirakos A, Gerolymos N, Gazetas G. The role of soil and interfacenonlinearities on the seismic response of caisson supported bridge piers.
In: Proceedings of the 5th international conference on geotechnical earth-quake engineering, Santiago, Chile; 2011.