Embed Size (px)
Citation preview

2.0
1.8
1.6
1.4
1.2
1.0
0.8
0.6
1.0 2.0 3.0 4.0 5.0
soil
bul
k d
ensi
ty (
g/cc
)
penetration resistance (MPa)
by Dr. Kim D. Coder, Professor of Tree Biology & Health CareWarnell School of Forestry & Natural Resources, University of Georgia
Pub. No. 38November 2016
Soil CompactionSoil CompactionSoil CompactionSoil CompactionSoil CompactionStrStrStrStrStress & ess & ess & ess & ess & TTTTTrrrrrees:ees:ees:ees:ees:
A A A A A WWWWWorororororkbook ofkbook ofkbook ofkbook ofkbook of Symptoms Symptoms Symptoms Symptoms Symptoms,,,,,MeasurMeasurMeasurMeasurMeasures & es & es & es & es & TTTTTrrrrreaeaeaeaeatmentstmentstmentstmentstments

2 Dr. Kim D. Coder Warnell School University of Georgia
ContentsIntroductionDefining Soil CompactionRoot HealthCompaction Causes & Soil ResultsMeasuring CompactionTree Impacts & Site RenovationTrees & Soil Compaction: A Selected Bibliography
Appendix 1: Compaction Tolerant TreesAppendix 2: Field Data Sheet
Soil CompactionSoil CompactionSoil CompactionSoil CompactionSoil CompactionStress & TreesStress & TreesStress & TreesStress & TreesStress & Trees
This is a third revision of a popular educational treatment for soilcompaction and tree health care. This workbook is not designed forgenerating bidding specifications, standards, commercial marketingdevices, or industrial consensus products. This is an educationalworkbook designed to assist tree health care providers appreciate andunderstand some of the complexities of soil compaction and its impacton tree health.
Information presented here is from research studies, fieldapplications literature, and the professional experience of the author.The author has selected items to include and exclude based upontheir value to forward different educational concepts and learningobjectives for the student. Because of the complexity of this work, thisauthor and this institution can not be held responsible for errors andomissions which may be present, or which may affect professionalinterpretation and associated field applications.
This revised publication is about learning basic information onsoil compaction and tree interactions, not a “how to” on decompactingsoils. Always seek the assistance of a professionally credentialed treecare provider to assure your tree receives the best possible care.
The University of Georgia is committed to principles of equal opportunity and affirmative action.

3 Dr. Kim D. Coder Warnell School University of Georgia
Soil Compaction Stress & Trees:A Workbook of Symptoms, Measures & Treatments
IntroductionHealth and structure of trees are reflections of soil health. The ecological processes which
govern tree survival and growth are concentrated around the soil / root interface. As soils, and associ-ated resources change, tree systems must change to effectively utilize and tolerate shifting resourcesquantities and qualities, as well as physical space available. Soil compaction is a major tree-limitingfeature of many developed sites and a hidden stressor of community trees.
This workbook is a summary of soil compaction processes and tree growth impacts. In addition,some general renovation principles are reviewed. Understanding how soil compaction occurs, develop-ing more accurate and precise definitions of soil compaction effects, and recognizing tree growth im-pacts stemming from compaction problems will be emphasized here. This workbook will concentrateentirely on negative growth constraints of soil compaction on trees.
Recognizing The ProblemSoil compaction is the most prevalent of all soil constraints on shade and street tree growth.
Every place where humans and machines exist, and the infrastructures which support them are built, soilcompaction is present. There are few soil areas we see without some degree of soil compaction. Soilcompaction is a fact of life for trees and for tree health care providers. Unfortunately, prevention andcorrection procedures are not readily used nor recognized for their value.
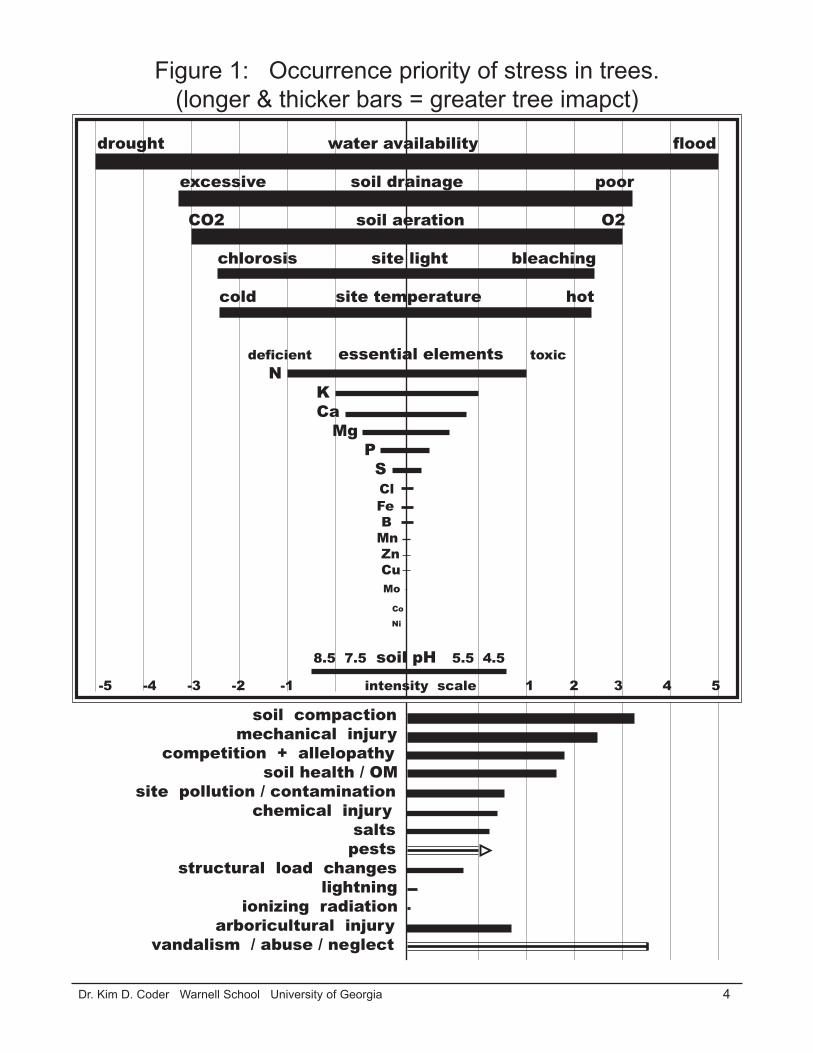
There are many environmental constraints on tree survival and growth. All limitations for treeshave impacts on daily and seasonal growth which can be measured and prioritized. Many people be-come obsessed by small constraints on trees while major life-altering impacts are ignored. Soil compac-tion is one of those major problems causing significant tree stress and strain, and whose impacts areusually blamed on other things. Figure 1 shows the individual items causing the greatest growth limita-tions for tree growth. The top three things (by far!) are soil water availability, soil aeration, and soildrainage -- all three greatly disrupted by site compaction. Drought and soil compaction head the list ofmajor tree growth stress problems.
As long as people continue to obsess about trivial tree and site growth limitations, they willcontinue to ignore the biggest items causing tree stress and strain! Tree care providers must help peopleunderstand soil compaction influences on tree growth and the need for soil renovation.
Bearing AllAs a site is used by animals, people, and machines, the bearing surface for all activities is the top
of soil. Soil is a composite material made of many different things each interconnected physically andbiologically in many ways. Site use applies force to the soil surface and this force is resisted and distrib-uted locally in soil. The extent of soil impacts depend upon many soil attributes, some inherent andsome transient. For example, the size, shape, and geology of mineral components are long term featuresof a soil, while moisture content greatly influences carriage of loads but is in constant flux.
4 Dr. Kim D. Coder Warnell School University of Georgia
Figure 1: Occurrence priority of stress in trees.(longer & thicker bars = greater tree imapct)
drought water availability flood
excessive soil drainage poor
CO2 soil aeration O2
chlorosis site light bleaching
cold site temperature hot
deficient essential elements toxic N
K Ca Mg
P S Cl Fe B Mn Zn Cu Mo
Co
Ni
8.5 7.5 soil pH 5.5 4.5
soil compaction mechanical injury
competition + allelopathysoil health / OM
site pollution / contamination chemical injury
salts pests
structural load changes lightning
ionizing radiationarboricultural injury
vandalism / abuse / neglect
-5 -4 -3 -2 -1 intensity scale 1 2 3 4 5
5 Dr. Kim D. Coder Warnell School University of Georgia
Compaction occurs when people allow light to moderate site use on a relatively continuous basis,or periodically for heavy use. As compaction measures increase by 25-33%, soil health is seriouslyimpacted. Tree health mirrors site health, and so negative compaction impacts in a soil negativelyimpact tree health and structure. As soil and tree health change, ecological health of the site declinesand approaches exhaustion as both biologics and essential resources are lost. Soil compaction, althoughusually unnoticed and unmeasured as a site quality issue, leads to severe tree problems and is difficult tocorrect once applied to a site.
Infrastructure EcologyThe small amount of land where we concentrate many thousands of people does not represent
true carrying-capacity of natural resources on a site. We are forced to concentrate natural resourceinputs and outputs from across a large surrounding area in order for our communities to exist. Themeans of concentrating resources is through building and maintaining engineered infrastructures such asstreets, pipes, wires, curbs, buildings, parking lots, water collection and treatment systems, and environ-mental management devices for building interiors. Infrastructure waste-spaces (i.e. areas not needed forbuilding or maintaining infrastructures) are delegated to “green” things.
Living systems are containerized and walled into small spaces adjacent and intertwined withmassive infrastructure systems. The ecology of infrastructures involve resource and process constraintsto such a degree that living systems are quickly damaged and exhausted. A summary of resource at-tributes around infrastructures include: many humans and machines functioning as sources for ecologi-cal disturbance and stress problems (both chronic and acute); fragmented and diminished self-regulat-ing ecological states and processes (declining living things, organic matter, biotic interactions); and, lessopen soil surface and ecologically active volumes. Compaction is a leading stressor of trees under theseresource conditions.
Summing CompactionAs infrastructure requirements increase and generate more ecological impacts, associated build-
ing, maintenance, demolition, and renovation processes cause natural resource quality and usability todecline. Key components of this decline are complex soil resource alterations including water availabil-ity, gas exchange, mechanical impedance, and pore space alterations. Soil compaction is a primaryfeature of ecological damage with which we are surrounded.
Defining Soil CompactionDefining Soil CompactionDefining Soil CompactionDefining Soil CompactionDefining Soil CompactionSoil resources are always changing. Pore space, water, gas contents, and the electron exchange
environment are dynamically changing in a soil every moment. Chemical, biological and physical soilfeatures are always changing. Within this dynamically changing environment, tree roots use geneticallycrafted growth and survival strategies.
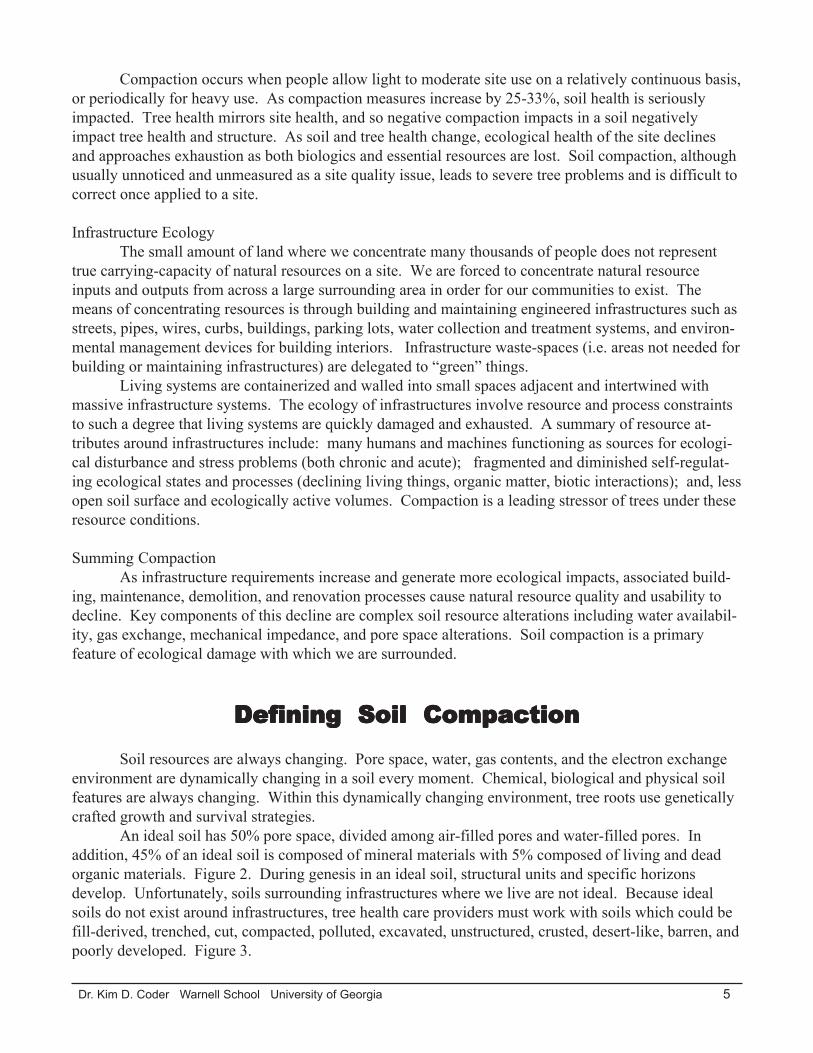
An ideal soil has 50% pore space, divided among air-filled pores and water-filled pores. Inaddition, 45% of an ideal soil is composed of mineral materials with 5% composed of living and deadorganic materials. Figure 2. During genesis in an ideal soil, structural units and specific horizonsdevelop. Unfortunately, soils surrounding infrastructures where we live are not ideal. Because idealsoils do not exist around infrastructures, tree health care providers must work with soils which could befill-derived, trenched, cut, compacted, polluted, excavated, unstructured, crusted, desert-like, barren, andpoorly developed. Figure 3.

6 Dr. Kim D. Coder Warnell School University of Georgia
mineralmaterials
orga
nics
waterpores
airpores
Figure 2: A classic diagram of the components of anidealized soil with a mineral matrix, organics (living &
dead), and pore space (water-filled & air-filled).
7 Dr. Kim D. Coder Warnell School University of Georgia
mineralmaterials
organics
waterpores
airpores
Figure 3: A diagram of the components of an urbancompacted soil with a mineral matrix, organics (living
& dead), and pore space (water-filled & air-filled).
8 Dr. Kim D. Coder Warnell School University of Georgia
Pore SpacesSoil pore space exists around three primary components: individual particles (texture units) such
as sand, silt, and clay; individual structural units (soil aggregates); and, as gaps and cracks at the inter-faces of infrastructure and soil. Large sized soil pores are usually filled with air, and so provide goodaeration but poor water holding capacity. Small soil pores are usually filled with water, but provide pooraeration. For a healthy soil, coarse textured soils dominated by large air-filled pores need more wateravailability -- fine textured soils dominated by small water-filled pores need more aeration for good rootgrowth. Figure 4. Soils dominated by small soil pores (clay) have more total pore space than soilsdominated by large pores (sand).
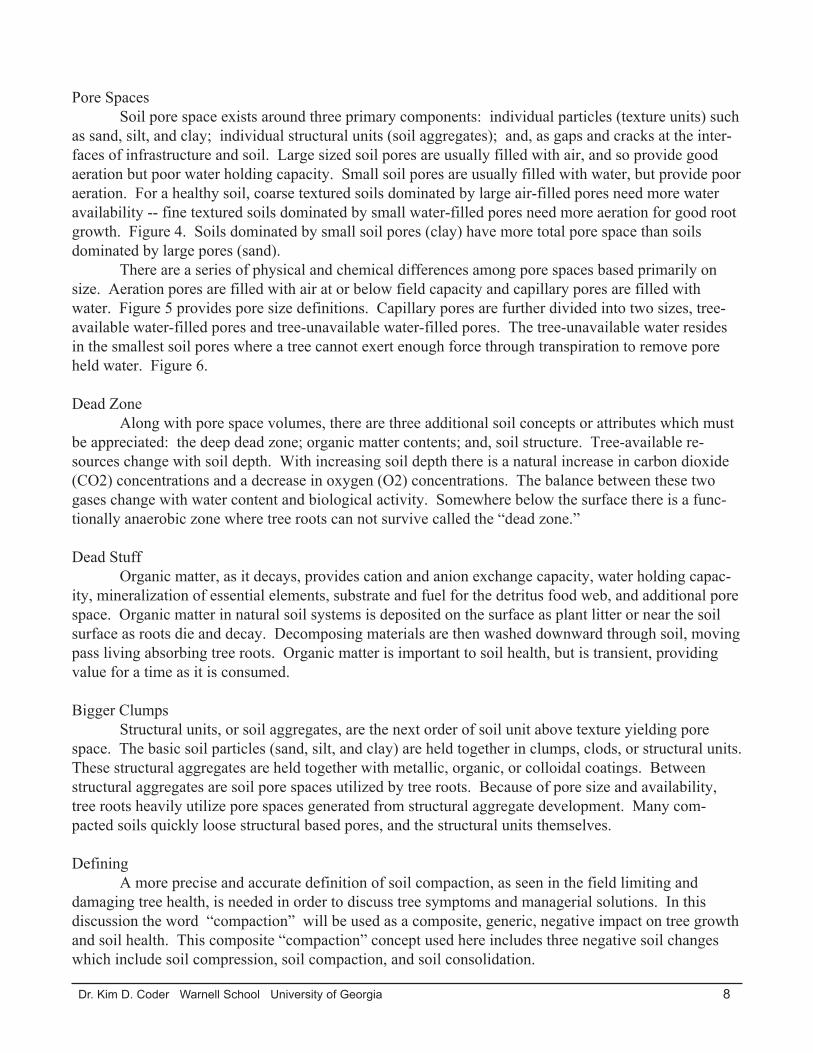
There are a series of physical and chemical differences among pore spaces based primarily onsize. Aeration pores are filled with air at or below field capacity and capillary pores are filled withwater. Figure 5 provides pore size definitions. Capillary pores are further divided into two sizes, tree-available water-filled pores and tree-unavailable water-filled pores. The tree-unavailable water residesin the smallest soil pores where a tree cannot exert enough force through transpiration to remove poreheld water. Figure 6.
Dead ZoneAlong with pore space volumes, there are three additional soil concepts or attributes which must
be appreciated: the deep dead zone; organic matter contents; and, soil structure. Tree-available re-sources change with soil depth. With increasing soil depth there is a natural increase in carbon dioxide(CO2) concentrations and a decrease in oxygen (O2) concentrations. The balance between these twogases change with water content and biological activity. Somewhere below the surface there is a func-tionally anaerobic zone where tree roots can not survive called the “dead zone.”
Dead StuffOrganic matter, as it decays, provides cation and anion exchange capacity, water holding capac-
ity, mineralization of essential elements, substrate and fuel for the detritus food web, and additional porespace. Organic matter in natural soil systems is deposited on the surface as plant litter or near the soilsurface as roots die and decay. Decomposing materials are then washed downward through soil, movingpass living absorbing tree roots. Organic matter is important to soil health, but is transient, providingvalue for a time as it is consumed.
Bigger ClumpsStructural units, or soil aggregates, are the next order of soil unit above texture yielding pore
space. The basic soil particles (sand, silt, and clay) are held together in clumps, clods, or structural units.These structural aggregates are held together with metallic, organic, or colloidal coatings. Betweenstructural aggregates are soil pore spaces utilized by tree roots. Because of pore size and availability,tree roots heavily utilize pore spaces generated from structural aggregate development. Many com-pacted soils quickly loose structural based pores, and the structural units themselves.
DefiningA more precise and accurate definition of soil compaction, as seen in the field limiting and
damaging tree health, is needed in order to discuss tree symptoms and managerial solutions. In thisdiscussion the word “compaction” will be used as a composite, generic, negative impact on tree growthand soil health. This composite “compaction” concept used here includes three negative soil changeswhich include soil compression, soil compaction, and soil consolidation.

9 Dr. Kim D. Coder Warnell School University of Georgia
50
40
30
20
10
0
smallpores%
0 10 20 30 40 50large pores %
100% sand0% clay
50% sand50% clay
0% sand100% clay
Figure 4: Large and small pore space percentagesin various sand / clay mixtures at ~1.32 g/cc bulk density.
(after Harris et.al. 1999)
10 Dr. Kim D. Coder Warnell School University of Georgia
Figure 5: Proportional soil pore sizes.
aeration pores>60μμμμμm diameter
“macro-pores”
capillary porestree-available water pores
0.2 -- 60μμμμμm diameter“meso-pores”
capillary porestree-unavailable water pores
<0.2μμμμμm diameter“micro-pores”
123456789123456789123456789123456789123456789
11 Dr. Kim D. Coder Warnell School University of Georgia
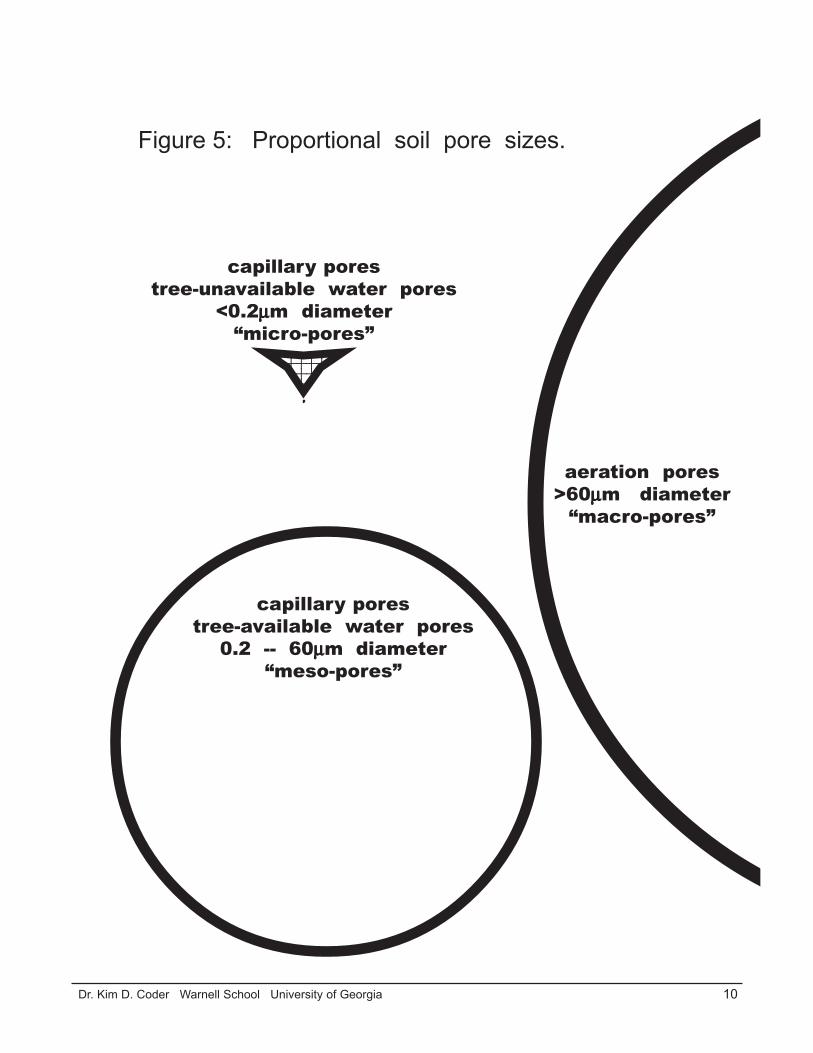
soil texture
sand sandy loam clay clayloam loam
macro-porepercentin soil
10
20
30
0
Figure 6: Macro-pore (air pore) space by soil texture.(after Craul 1999)
29%
7%

12 Dr. Kim D. Coder Warnell School University of Georgia
“C” ThreesomeThe process which damages soil around infrastructures called “compaction” starts with soil
compressibility or loss of soil volume. Compression leads to a loss of total pore space and aeration porespace, and an increase in capillary pore space. In other words, large air-filled pore spaces are crushedleading to more small water-filled pores. Compression is most prevalent in soils used under wet condi-tions.
True compaction is the translocation and resorting of textural components in the soil (sand, silt,and clay particles), destruction of soil aggregates, and further loss of aeration pores. Compaction isfacilitated by high moisture contents. Consolidation is the deformation of the soil, destroying any porespace and structure, by water squeezed from the soil matrix (hydraulic force). This process leads toincreased internal bonding and soil strength as more particle-to-particle contacts are made and porespace is eliminated.
Adding CPRIn addition to the “3Cs” of compaction listed above (compression, compaction, consolidation),
compaction problems often include crusting, puddling, and rutting. These processes are surface centeredand affect the extent and depth of damage to the top surface layer of soil. These problems generate soilconditions difficult for effective tree health maintenance and remeadiation. Crusting, puddling andrutting generate soil and tree damage similar to applying a plastic sheet across the soil surface.
Crusting is the dislocation and packing of fine particles and organic matter on the soil surface.Natural oil and wax products, and pollutants, can be associated with the soil surface having a thin hydro-phobic top layer which prevents water and oxygen infiltration. Primary causes of crusting is impacts ofrain drops on open soil surfaces, sprinkler irrigation impacts, pollutant absorption, and animal andpedestrian traffic.
Puddling and rutting are both a cause and effect of a dense, thick crust or cap on the soil surface.The primary mechanism of this damage is from destruction of soil aggregates and aeration pores throughparticle movement. In saturated soils under a top load, there is no place for non-compressible water togo except to the side, squashing structure and pores. Foot and vehicle traffic under saturated soil condi-tions, and equipment movement on the soil surface over shallow saturated soil layers, facilitate puddlingand rutting.
Generic “C”All components of the generic term “compaction” listed above do not necessarily occur in any
order, nor all occur on any given soil. A general summary of compaction as applied to tree and soilhealth problems would be: “A soil which has sustained a loss of soil aggregates, destruction of aerationpore spaces, crushing or collapse of pore spaces, and extensive resorting and packing of soil particles.”
The depth to which a soil is compacted is determined by a compacting agent or process. Everytype of site management or maintenance which requires soil contact has a characteristic compactionzone or layer, either at the surface or at some depth below the surface. Cultivation or management layers(pans) form from soil cultivation, packing of soil fills or lifts, and various types of traffic patterns. Newcompaction may develop over top of past compaction problems. One site may present several layers ofcompaction at various depths representing a history of site use and tree growth limitations.
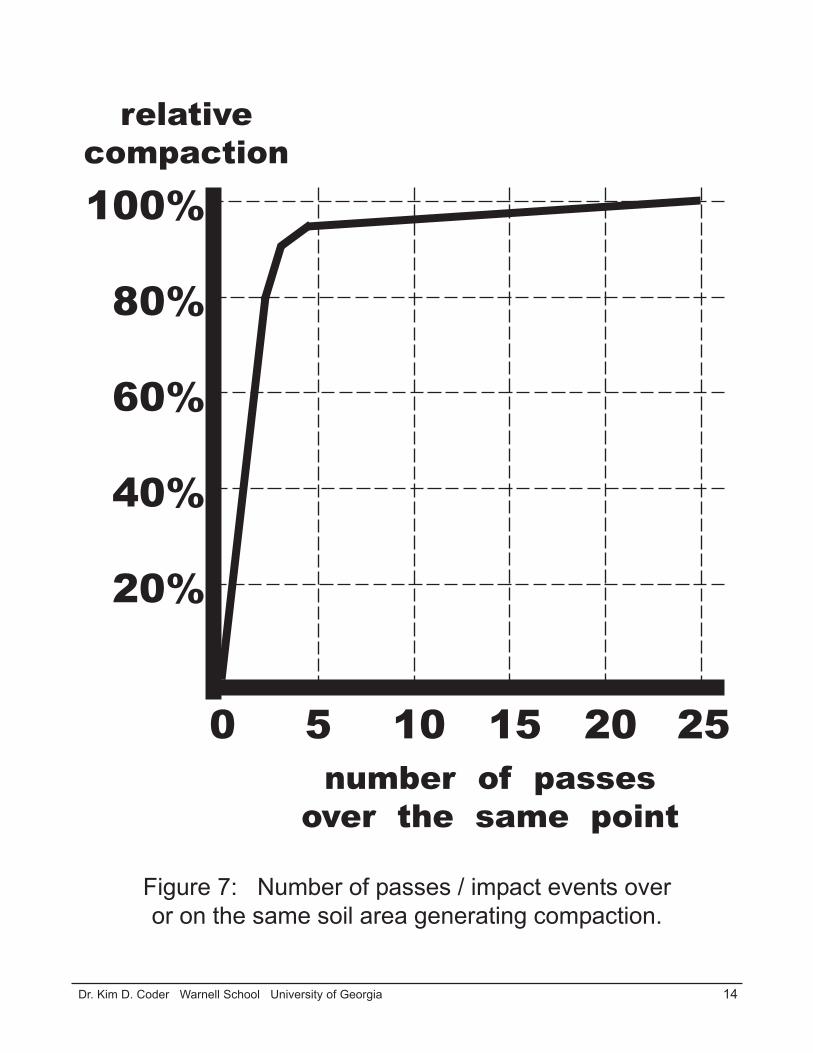
Compacted FastThe extent of soil compaction rapidly increases with the first few impacts on the soil surface
under the right conditions and then levels-off. Soils can be compacted to 90-95% of what they can be
13 Dr. Kim D. Coder Warnell School University of Georgia
compacted to in as little as 3-4 trips over a single point. In other words, it is not years of traffic, but thefirst few trips over a site which does the majority of compaction damage. Figure 7.
Compaction stresses and strains trees, damages soils, and interferes with effective tree healthmanagement. Compaction is an unseen cause for many tree problems. Tree health care providers mustbetter appreciate, quantify, and mitigate compaction.
Root HealthRoot HealthRoot HealthRoot HealthRoot HealthRoots utilize the space (pores) in soil. Volume of soil space controlled by tree roots is directly
related to tree health. The more space controlled by roots, the more potential resources available.Healthy soil contains surfaces and spaces giving roots access to required resources including water,oxygen, physical space for growth processes, and open soil surface area for replenishment of essentialresources.
The MatrixAfter accounting for soil pore space, the rest of a soil is made of organic materials in the form of
living organisms or dead materials, and a mineral matrix. The mineral matrix is only a significantconcern for evolving essential elements, for surfaces holding biological cooperators, and for frictionaland inertial forces for structural integrity. It is soil organic matter and pore space which are most criticalfor tree health.
In developed landscapes, compaction robs soil of viable rooting space and robs trees of healthyroots. Figure 8. Tree roots under soil space constraints occupy gaps and cracks around, under, andbetween hardscapes and supporting infrastructures. Because hardscapes, like pavements and founda-tions, expand and contract at different rates than soils, the interface between soil and infrastructures isusually an air filled crack. On heavily compacted sites, roots will be concentrated around the edges ofinfrastructures, running along hardscape edges, and filling any accessible moist air space.
Bad ThingsSoil surrounding tree roots are an ecological composite of living, once-living, and abiotic fea-
tures facilitating life. Soil compaction disrupts interconnections between ecological components in asoil. Compaction initiates many negative ecological impacts including: decrease volume of ecologicallyviable space available; decrease depth of tree rootable space; disrupts detritus food web -- the ecologi-cal engine responsible for powering a healthy soil; eliminate the diversity of living things and beneficialassociates, with only a few ecological niche-generalists succeeding; and, favor pests which consumebeneficial organisms and roots not able to defend themselves (i.e. Pythium & Phytophthera root rots).Compaction causes tree roots to become more prone to damage and attack at a time when their sensor,defense, growth regulation, and carbon allocation processes are functioning at marginal levels.
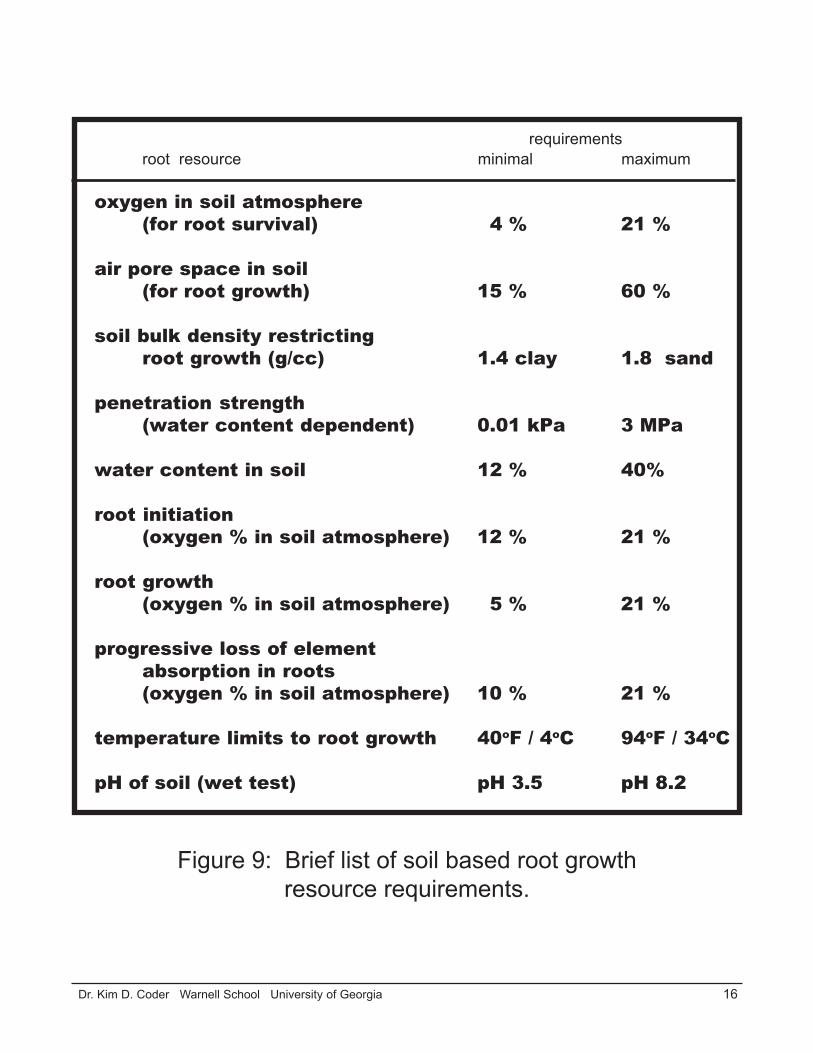
Root RequirementsGrowth in trees may not be an increase in total living mass, but does represent expansion of
tissues into new spaces. Tree roots develop adventitiously, expand into soil, and radially thicken. Rootdensity, mass, and activity vary with internal and external conditions. Soil resources required for rootgrowth are summarized in Figure 9.
Roots utilize soil spaces for access to water and essential elements, and for providing structuralsupport. Roots grow following pathways of interconnected soil pores. Pores can be the result of spaces
14 Dr. Kim D. Coder Warnell School University of Georgia
relativecompaction
100%
80%
60%
40%
20%
number of passesover the same point
0 5 10 15 20 25
Figure 7: Number of passes / impact events overor on the same soil area generating compaction.

15 Dr. Kim D. Coder Warnell School University of Georgia
rootingdepth (in.)
0
2
4
6
8
10
120 20 40 60 80 100% relative rooting density
Figure 8: Relative rooting density of fine roots in pin oak(Quercus palustris) as depth in a soil increases,
4 years after compaction. (based upon Watson & Kelsey, 2006)
compacted
non-compacted
16 Dr. Kim D. Coder Warnell School University of Georgia
requirementsroot resource minimal maximum
oxygen in soil atmosphere(for root survival) 4 % 21 %
air pore space in soil(for root growth) 15 % 60 %
soil bulk density restrictingroot growth (g/cc) 1.4 clay 1.8 sand
penetration strength(water content dependent) 0.01 kPa 3 MPa
water content in soil 12 % 40%
root initiation(oxygen % in soil atmosphere) 12 % 21 %
root growth(oxygen % in soil atmosphere) 5 % 21 %
progressive loss of elementabsorption in roots(oxygen % in soil atmosphere) 10 % 21 %
temperature limits to root growth 40oF / 4oC 94oF / 34oC
pH of soil (wet test) pH 3.5 pH 8.2
Figure 9: Brief list of soil based root growthresource requirements.
17 Dr. Kim D. Coder Warnell School University of Georgia
between textural units (sand, silt, and clay particles), between structural units (blocks, plates, grains,prisms, etc.), along fracture lines (shrink / swell clays, frost heaving, pavement interfaces, etc.), andthrough paths of biological origins (decayed roots, animal diggings, etc.).
Roots survive and grow where adequate water is available, temperatures are warm, light issubdued or blocked, and plenty of oxygen is present. Roots are generally shallow and extensive onsites, limited by oxygen contents, anaerobic conditions, and longterm water saturation. Near thebase of a tree, deep growing roots can be found, but are oxygenated through fissures and cracksgenerated as a result of mechanical forces moving the crown and stem under wind loads (sway)causing root plate wobbling.
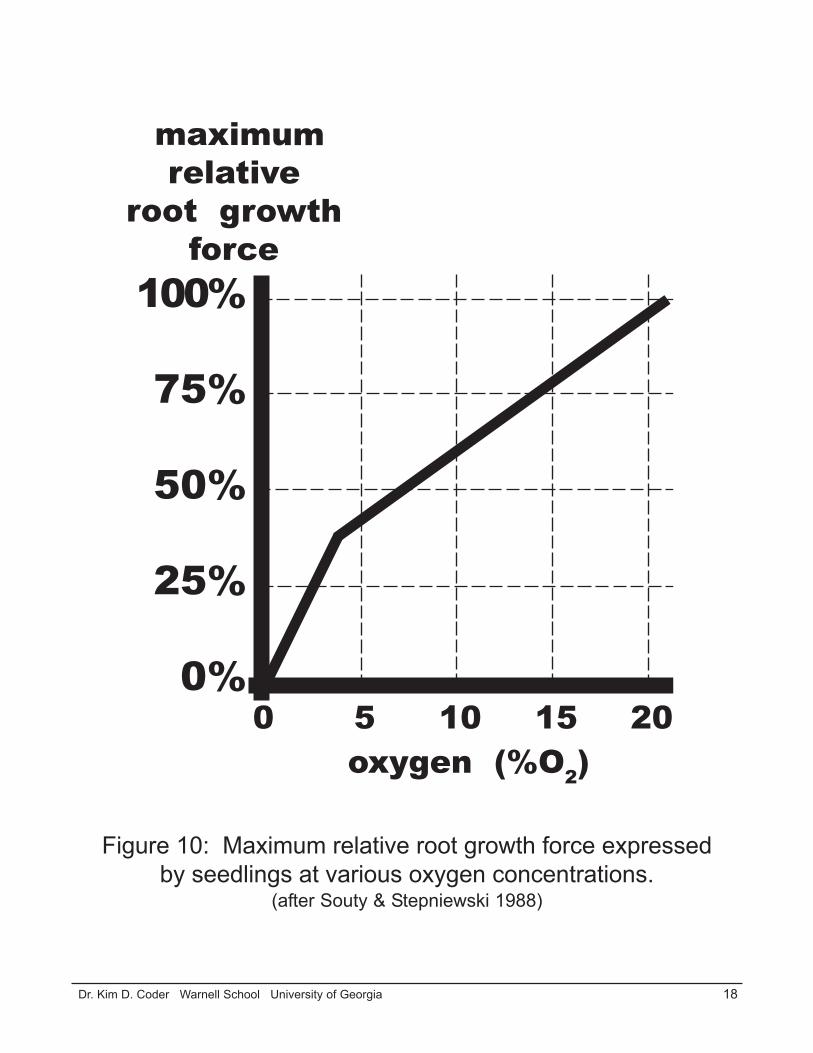
Growth ForcesThe ability of root tips to enter soil pores, further open soil pores, and elongate through soil
pores is dependent upon forces generated in the root and resisted by soil. Root growth forces aregenerated by cell division and subsequent osmotic enlargement of each new cell (hydraulic pressure).Oxygen and carbohydrate (food) for respiration, and adequate water supplies are required to produceroot hydraulic pressure. Figure 10. Tree roots can consume large amounts of oxygen during elonga-tion especailly at elevated temperatures as found on some developed sites. At 77oF (25oC) tree rootscan consume nine times (9X) their volume in oxygen each day, at 95oF (35oC) roots can use twicethat volume (18X) per day. The osmotic costs to root cells of resisting surrounding soil forces andelongating are significant.
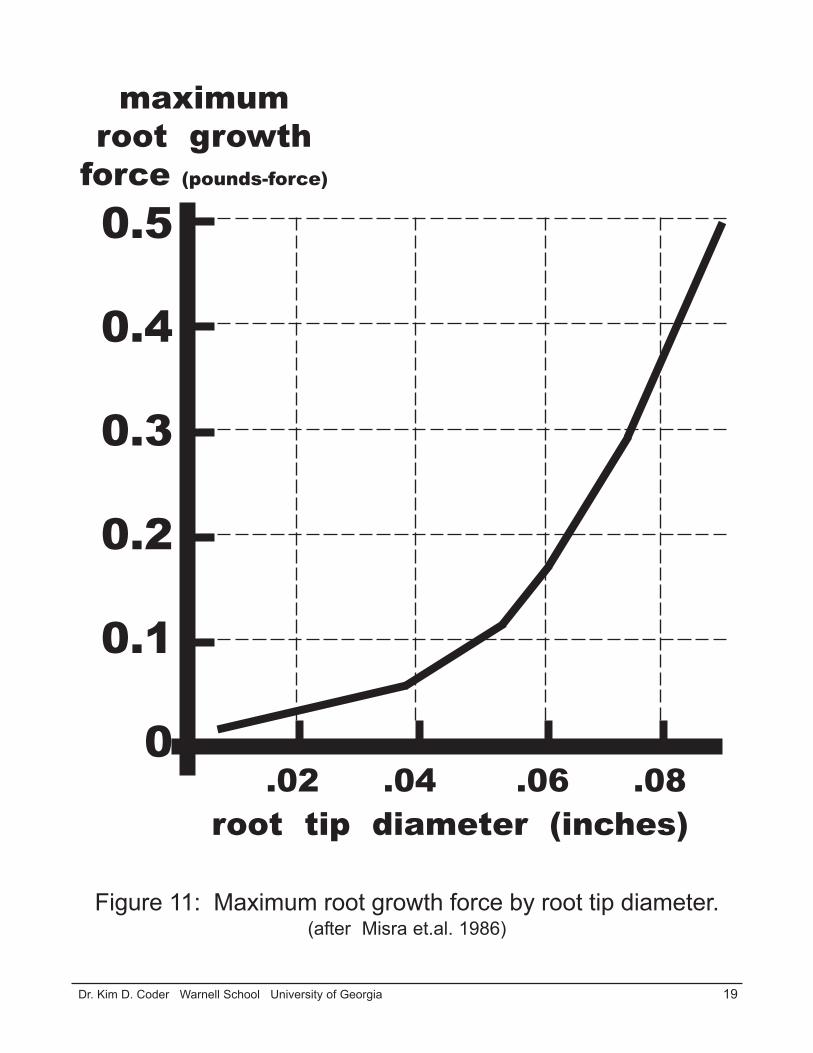
Compaction forces roots to generate increased turgor pressures concentrated farther towardthe root tip, to lignify cell walls quicker behind the growing root tip, and to utilize a shorter zone ofelongation. In response to increased soil compaction, roots also thicken in diameter. Thicker rootsexert more force and penetrate farther into compacted soil areas. Figure 11. As soil penetrationresistance increases in compacted soils, roots must thicken to minimize structural failure (buckling),to exert increased extension force per unit area, and to stress soil just ahead of the root cap whichallows easier penetration.
Size MattersFor effective root growth, many pores in a soil must be larger than root tips. With compac-
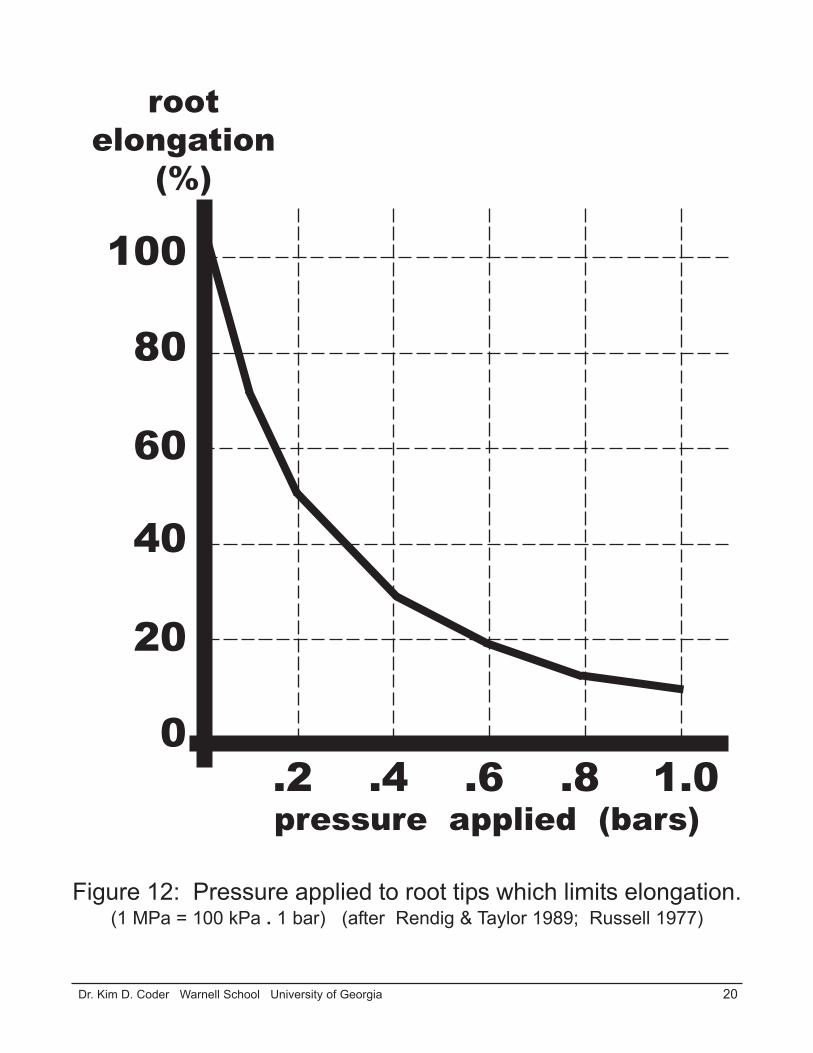
tion, pore space diameters become smaller. Once soil pore diameters are less than the diameter ofmain root tips, many growth problems occur. The first noticeable root change with compaction ismorphological -- roots thicken, growth slows, and more laterals are generated of various diameters.Lateral root tip diameter is initiated by growth regulators and extent of vascular tissue connections.If laterals are small enough to fit into the pore sizes of a compacted soil, then lateral growth willcontinue while the main axis of a root is constrained. If soil pore sizes are too small for even lateralroots, root growth will cease. Figure 12.
PavementsSoil is a complex material with unique thermal and moisture expansion and contraction
patterns. Soil expands and contracts over a day, season, and year at different rates than adjacentpavement or hard infrastructures. As a result, fracture lines filled with air occupy the interfacebetween soil and infrastructures. These aeration pore spaces can be effectively colonized by treeroots. If infrastructure construction is not completed in an ecologically-literate way, tree roots canexpand in these spaces generating enough mechanical force, and facilitating soil volume changes, toaccentuate any structural / material faults present.
18 Dr. Kim D. Coder Warnell School University of Georgia
Figure 10: Maximum relative root growth force expressedby seedlings at various oxygen concentrations.
(after Souty & Stepniewski 1988)
0 5 10 15 20oxygen (%O2)
maximumrelative
root growthforce
100%
75%
50%
25%
0%
19 Dr. Kim D. Coder Warnell School University of Georgia
Figure 11: Maximum root growth force by root tip diameter.(after Misra et.al. 1986)
.02 .04 .06 .08root tip diameter (inches)
0.5
0.4
0.3
0.2
0.1
0
maximumroot growth
force (pounds-force)
20 Dr. Kim D. Coder Warnell School University of Georgia
Figure 12: Pressure applied to root tips which limits elongation.(1 MPa = 100 kPa . 1 bar) (after Rendig & Taylor 1989; Russell 1977)
.2 .4 .6 .8 1.0pressure applied (bars)
100
80
60
40
20
0
rootelongation
(%)
21 Dr. Kim D. Coder Warnell School University of Georgia
In addition to the aeration pore space available at structure / soil interfaces, coarse sub-grade andpaving bed materials can provide pore space for tree root colonization. The interface between pavementand its bedding material can be a well aerated and moist growing environment. Compaction may havecaused anaerobic condition to be found close to the surface under pavement while the added pavementbed may provide a secure colonization space for tree roots. Physical or chemical root barriers may beneeded to prevent root colonization of aeration spaces surrounding infrastructures.
Tree Species ToleranceAcross the gene combinations which comprise tree forms, there is a great variability in reactions
to soil compaction. As there are many different soil conditions impacted by compaction, so too are theremany gradations of tree responses to compaction. A tree’s ability to tolerate compacted soil conditionsis associated with four primary internal root mechanisms: reaction to mechanical damage is effectiveand fast; continuation of respiration under chronic oxygen (O2) shortages; ability to regenerate, reori-ent, and adjust absorbing root systems; and, ability to deal with chemically reduced materials (toxics).
A list of trees with many of these compaction tolerance mechanisms are in Appendix 1.
Compaction Causes & Soil ResultsCompaction Causes & Soil ResultsCompaction Causes & Soil ResultsCompaction Causes & Soil ResultsCompaction Causes & Soil ResultsIn order to understand and visualize soil compaction more completely, underlying causes must be
appreciated. Soil compaction is primarily caused by construction and development activities, utilityinstallation, infrastructure use and maintenance, landscape maintenance activities, and concentratedanimal, pedestrian, and vehicle traffic. Below are listed common individual causes of soil compaction.
Moisture FacilitationFor every soil type and infrastructure situation there is a soil moisture content at which soil can
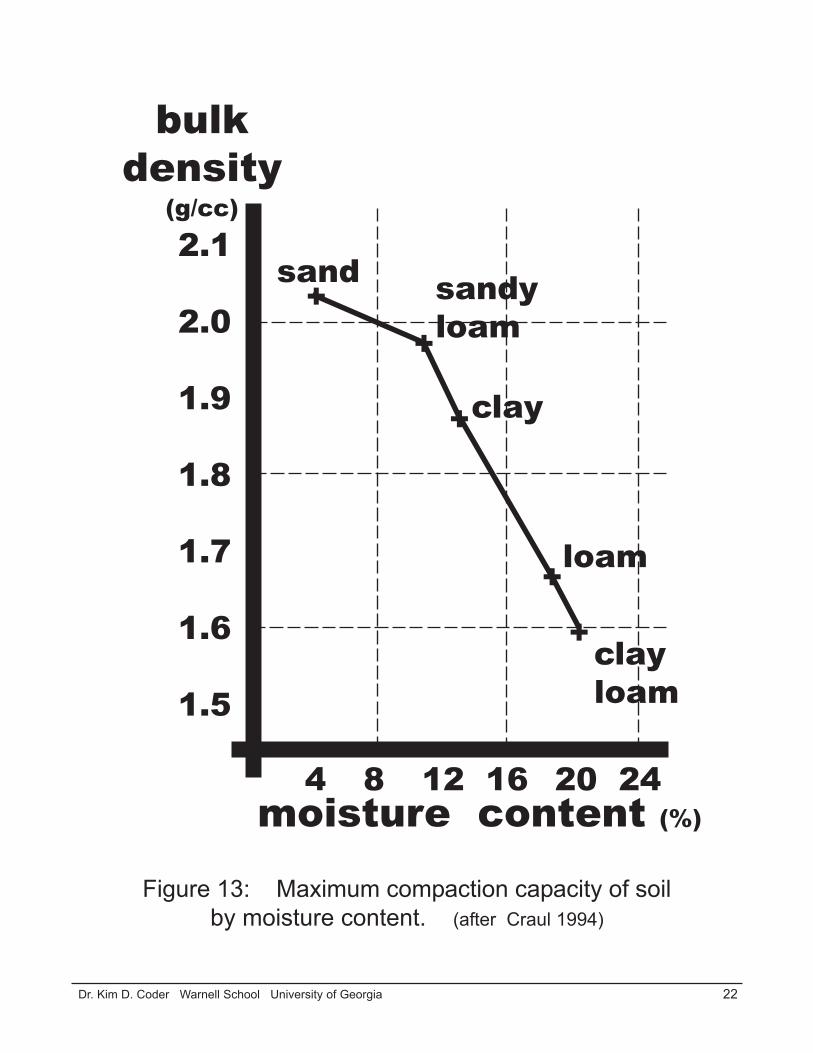
be severely compacted with minimal effort. Bringing soils to these optimum moisture content levels areused to compact soils for road construction. Compaction activities should be avoided on soils especiallynear these moisture contents. Both direct impacts and vibrational energy will cause compaction whensoil is at or near its compaction moisture content optimum. Figure 13.
Water can provide energy directly to the soil surface causing compaction. Direct irrigationimpacts from sprinklers, or rainfall hitting open soil surfaces, can cause crusting and compaction. Pilingof snow in winter when soil is frozen compacts little, but large snow drifts remaining on-site as soilsbegin to thaw can lead to compaction both from physical weight and from maintaining high moisturelevels allowing for long periods of compaction susceptibility. Saturated soil contact allows hydraulicpressure to destroy soil aggregates and move fine particles into aeration pore spaces. Flooding eventscan dissolve soil aggregate coatings and lead to soil structure loss. Erosion processes across a soilsurface, and fine particle movement within the top portions of soil, can lead to aeration pore space lossand crusting.
TrafficingThe pounds per square inch of force exerted on a soil surface by walking, grazing, standing, and
concentrating humans and other animals can be great. Problems are most prevalent on edges of infra-structures such as fences, sidewalks, pavements, and buildings. Holding, marshaling, or animal concen-tration yards allow significant force to be delivered to soil surfaces. Paths and trails provide a guidedjourney to soil compaction.
22 Dr. Kim D. Coder Warnell School University of Georgia
2.1
2.0
1.9
1.8
1.7
1.6
1.5
moisture content (%)
bulkdensity
(g/cc)
Figure 13: Maximum compaction capacity of soilby moisture content. (after Craul 1994)
4 8 12 16 20 24
+
+
+
+
+
sand sandyloam
clay
loam
clayloam
23 Dr. Kim D. Coder Warnell School University of Georgia
Vehicles with tracks, wheels, and glides provide a great deal of force on soil surfaces. Narrowrubber tires can transfer many pounds of compaction force to soil. The classic example are in-line skatesand high pressure bike tires. These wheels can impact soils beyond 60lbs per square inch. Broad, flattreads can dissipate compaction forces across more soil surface than thin tires, and reduce forces exertedper square inch.
ManipulationsThe movement, transport, handling, and stockpiling of soil destroys aeration pore spaces and
disrupts soil aggregates. Soil cuts, fills, and leveling compacts soil. Soil handling equipment can belarge and heavy leading to compaction many inches deep. Anytime soil is moved, air pore space isdestroyed and soil is compacted. The most extreme form of compaction force applied to a soil is byexplosions. One solution to compaction in the past was use of explosives to fracture soils. The endresult was explosive energy fractured soil to the sides and above the charge, but heavily compacted soilbelow. Explosives damage soil to a degree not offset by any fracturing or aeration pores formed.
Any mechanical energy that impacts individual soil particles can cause compaction. Nearby carand truck traffic can cause vibrations which compact soils effectively at higher moisture contents. Wet,boggy sites are especially prone to transferring vibrational energy through soil. Vibrational compactioncan be significant in rooftop, bridge, and train station planter boxes, for example.
Rooting SpacesIn order for infrastructures to be built and maintained, supporting soil must be properly com-
pacted. Because of how forces in soil are distributed beneath infrastructures, a compacted pad withslanted base sides must be built. This process assures that infrastructure edges, bases, and lifts (com-pacted fill layers) are heavily compacted. Under these standard construction conditions, the only spaceavailable for tree root colonization in or adjacent to these areas are fracture lines, interface zones be-tween building materials, and any pore space in or under coarse building materials. The greater soilcompaction, the closer to the surface functional anaerobic layers develop, the less ecologically viablespace available for roots, and the smaller soil pore sizes become associated with mechanically strongersoil, all minimizing tree root growth.
Organic Matter LossOrganic matter is fuel, short-term building blocks of structure, and supply warehouse for living
things in a soil. As organic matter decomposes and mineralizes without adequate replacement, soilbecomes more compacted. Soil density increases and aggregate stability declines as organic matter is“burned” out of a soil through elevated temperatures and lack of replacement. The organic matter cyclespins down as a compacted soil system is exhausted and becomes less capable of sustaining life.
Resulting ProblemsThe actions of people compact soils in intentional and unintentional ways. Whatever the cause
of compaction, soil’s ability to fully sustain tree growth is diminished. Ecological results of compactionlead to severe tree stress and strain, of which only acute and severe impacts are usually ever recognized.The chronic problems of soil compaction remain on-site as a plague to current and future trees. Thefunctional results of soil compaction on trees and their sites are many and complexly interconnected.
Aggregate DestructionAir pore spaces from soil cracks, interface surfaces, biotic excavations, organic particle decom-
position, and normal soil genesis processes help oxygenate the soil matrix. By definition, compaction

24 Dr. Kim D. Coder Warnell School University of Georgia
results in destruction of soil aggregates and aeration pore spaces. Pore spaces filled with oxygen, andinterconnected with other aeration spaces exchanging gases with the atmosphere, are critical to a healthysoil and tree root system. The destruction of aeration spaces surrounding soil aggregates can be unre-coverable.
Under compaction, particles of soil are redistributed into new locations, many into open porespaces within the soil matrix. Through packing, erosion, and cultivation processes, many fine particlescan fill-in spaces surrounding other particles, as well as spaces between structural aggregates. Some soiltypes can be compacted more easily through this process than others. Mid-textured soils with a mix ofparticle sizes can be strongly compacted due to particle size availability to fill any size of pore space.
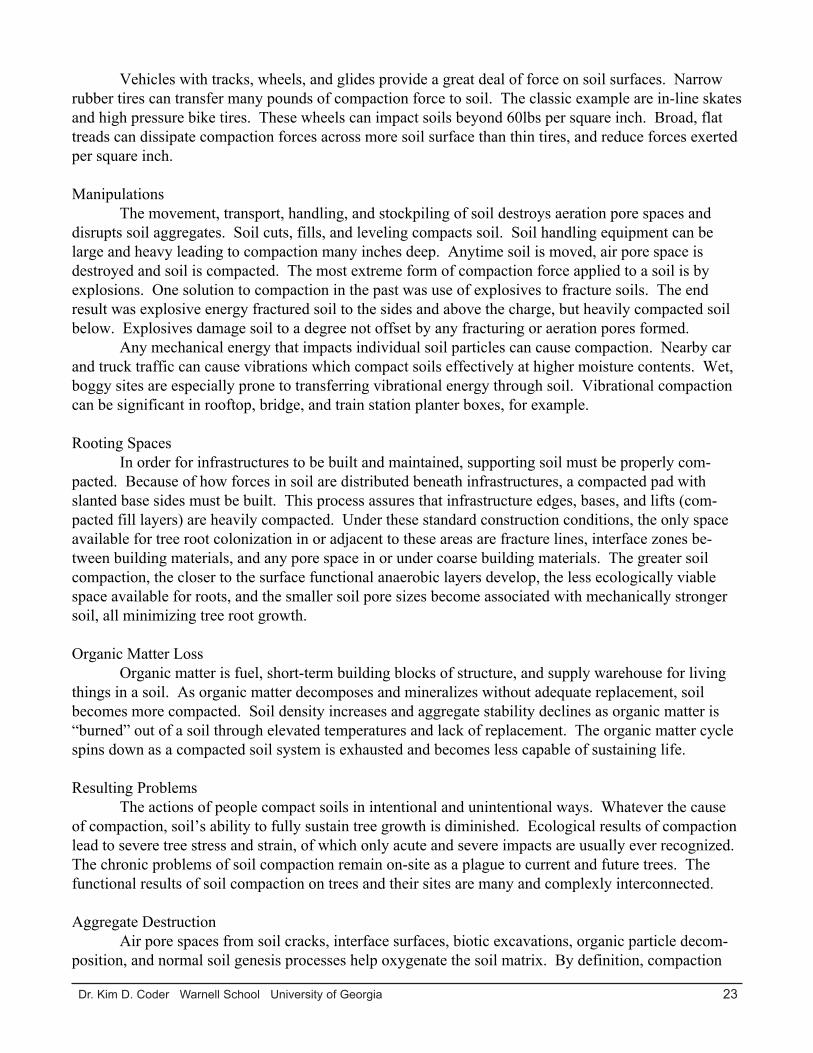
Pore Space DestructionCompaction initiates a redistribution of pore sizes within a soil matrix. Large pores are de-
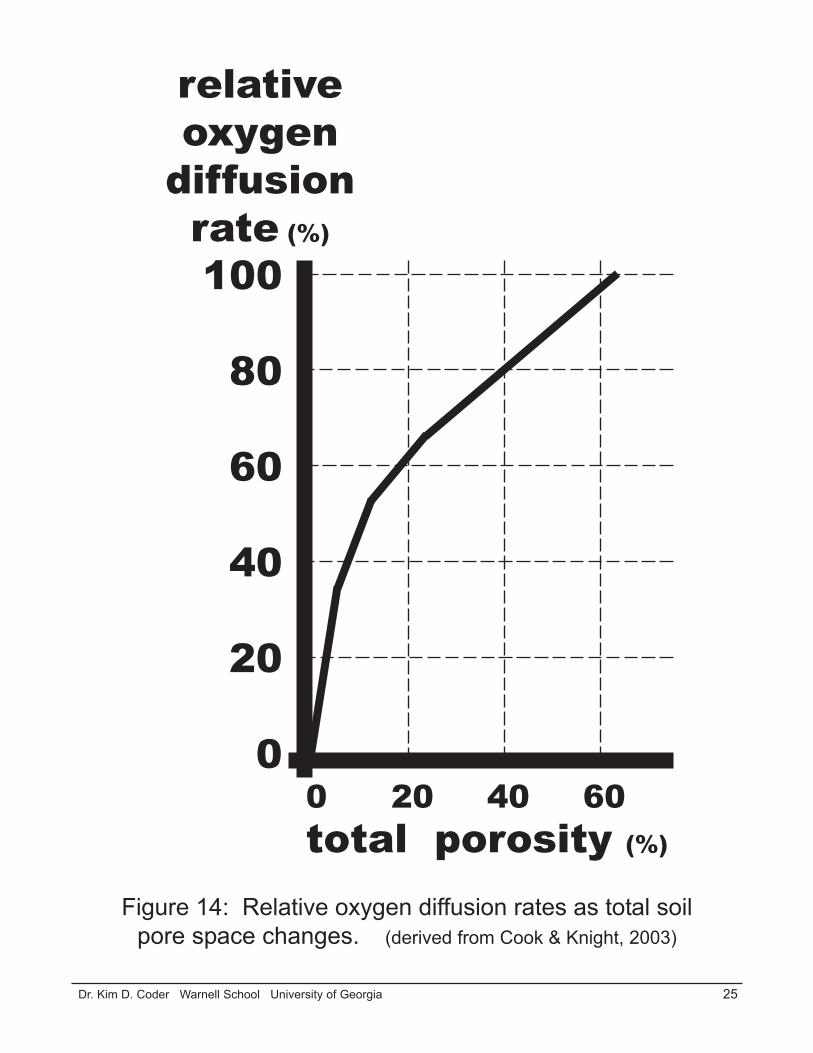
stroyed and small pore are generated. The total pore space of soil being compacted initially increases asmore capillary pores are created and as aeration pores are lost. With continuing compaction, totalporosity declines and oxygen diffusion rates plumate. Figure 14. The mid-size pores, which fill andempty with water and air, are most impacted by compaction. Figure 15.
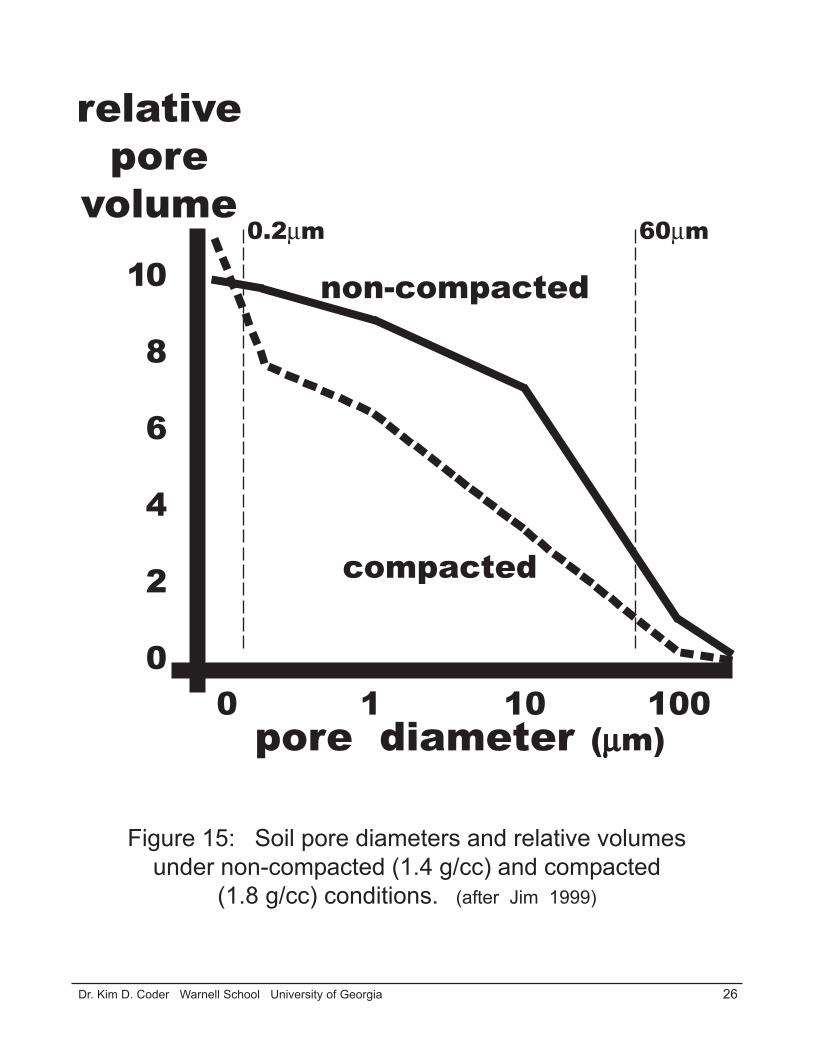
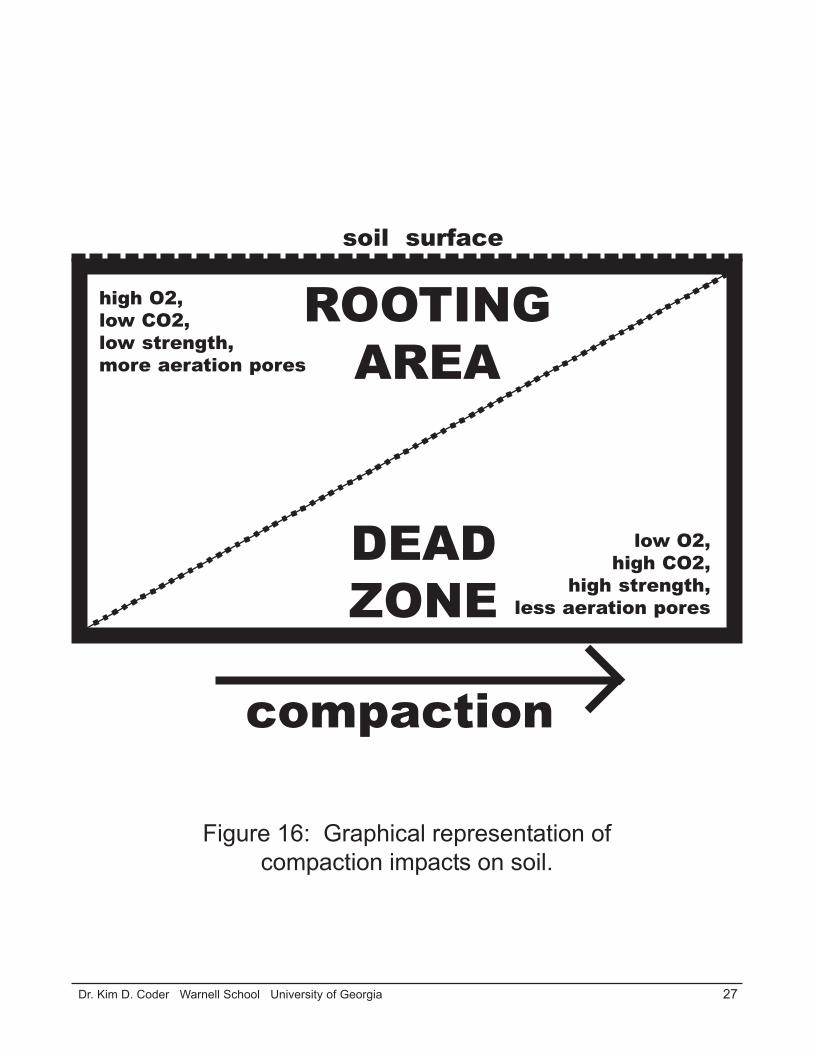
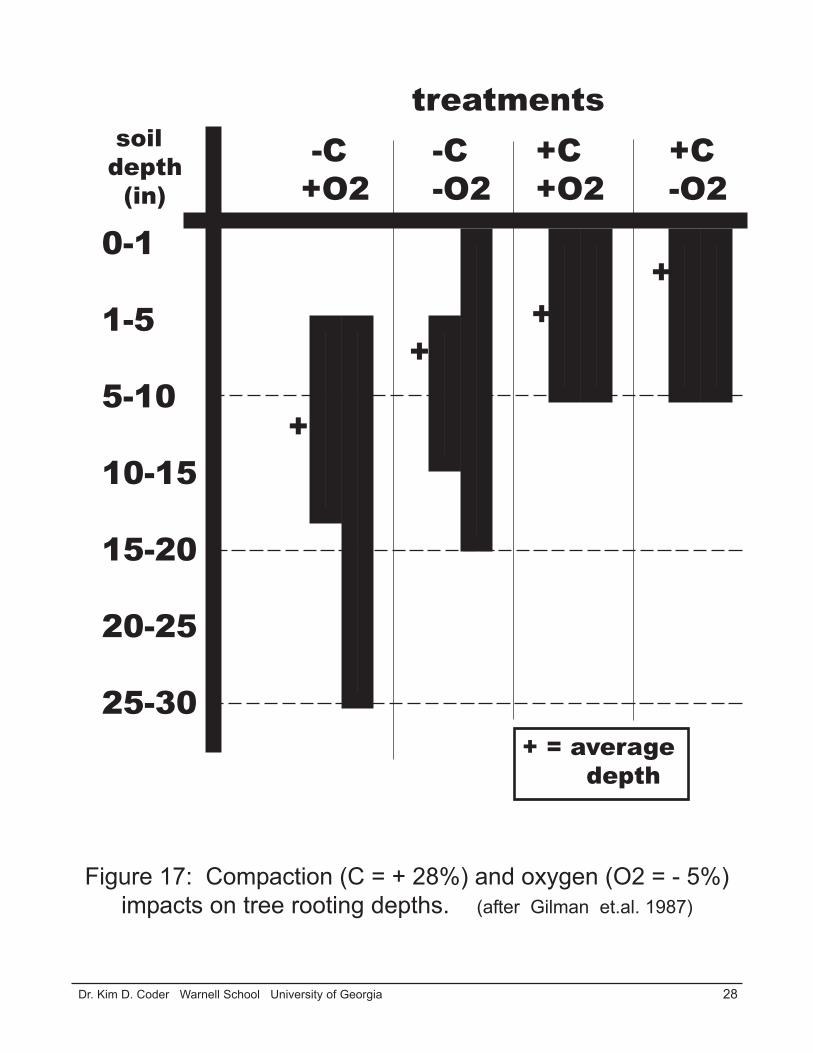
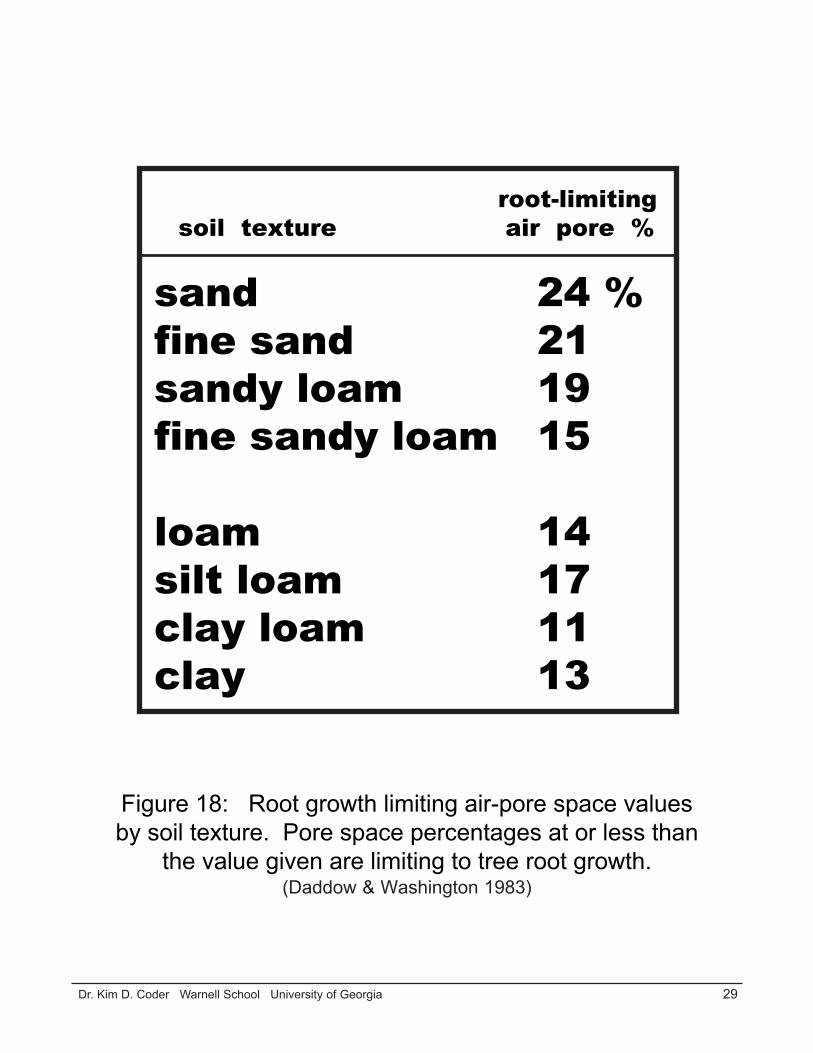
The crushing collapse of aeration pores facilitates the upward movement in a soil of a function-ally anaerobic layer. Figure 16. There are always anaerobic and aerobic micro-sites in and around soilsaggregates within surface layers of soil. The dynamic proportions of each type of micro-site changeswith each rainfall event and each day of transpiration. Compaction shifts proportional dominance in asoil toward anaerobic sites. With further compaction, aerobic sites are concentrated closer and closer tothe surface until little available rooting volume remains. Figure 17. Figure 18 lists root-limiting aera-tion pore space percentages in soils of various textures. Air pore space less than 15% is severely limit-ing.
Increased StrengthCompaction brings soil particles into closer contact with each other (less moisture and/or
greater bulk density). Closer contact increases surface friction and soil strength. As soil strength in-creases, and pore sizes and numbers decrease, the ability of roots to grow and colonize soil spacesdecline rapidly. Average diameters of pores significantly smaller than average root diameters are notutilized by tree roots.
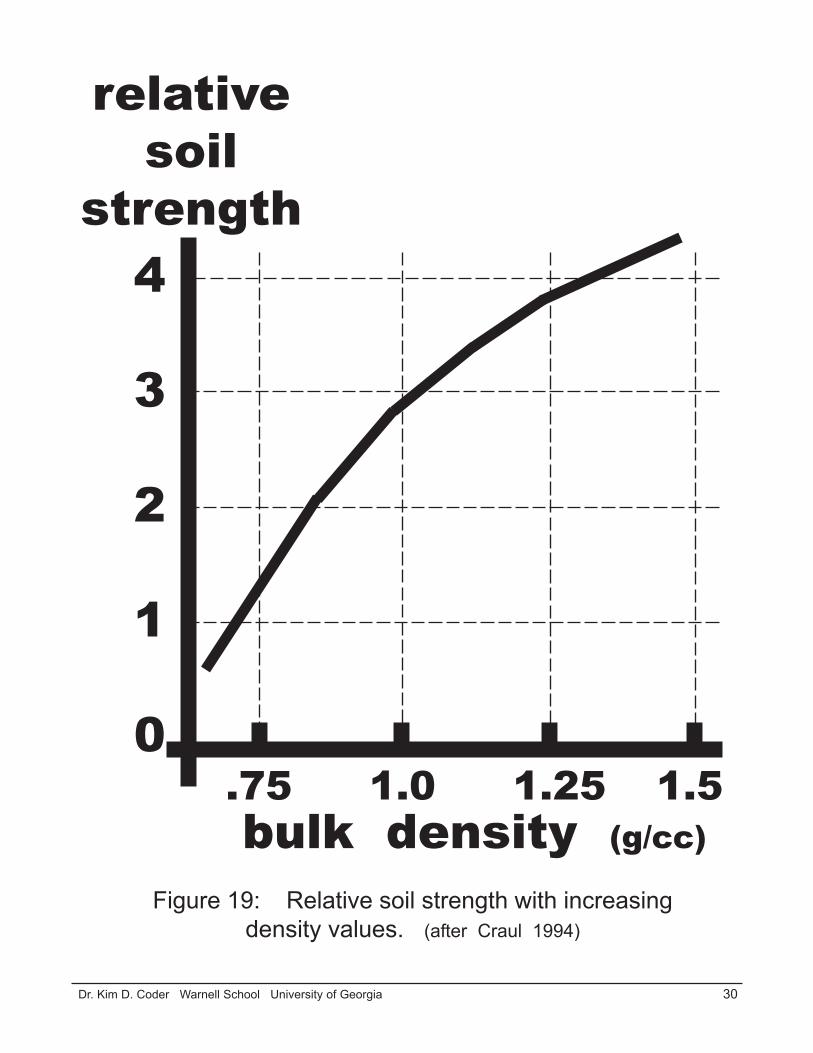
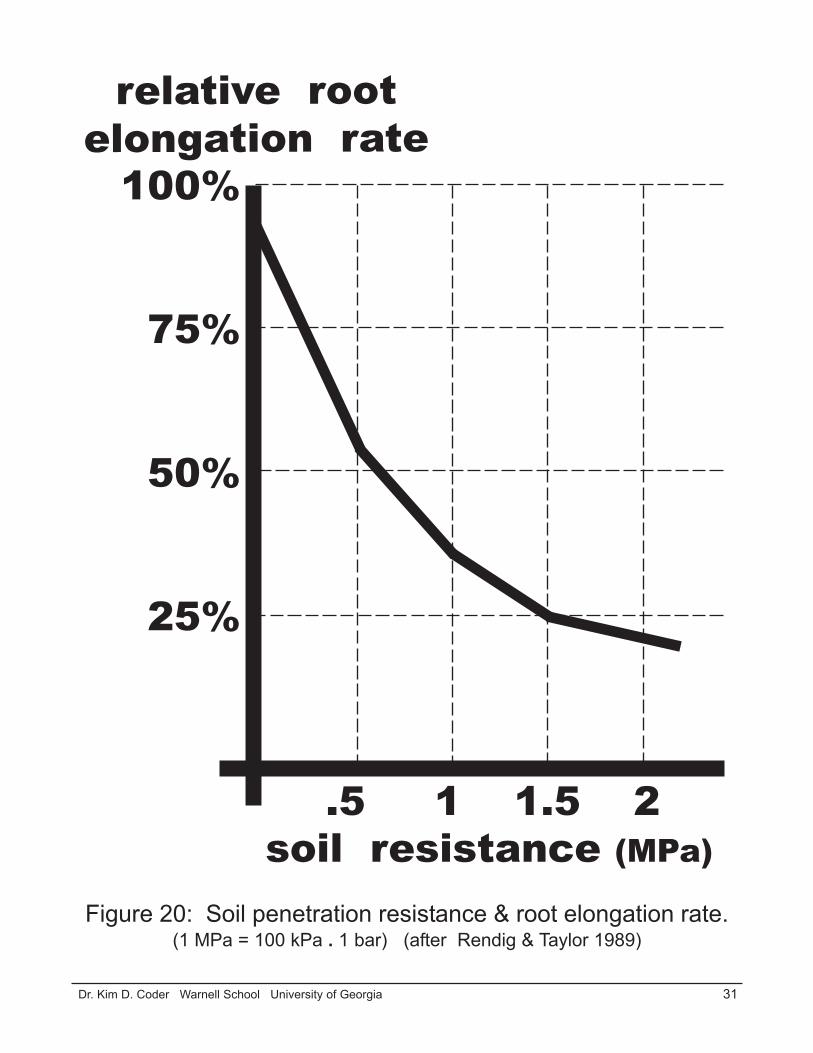
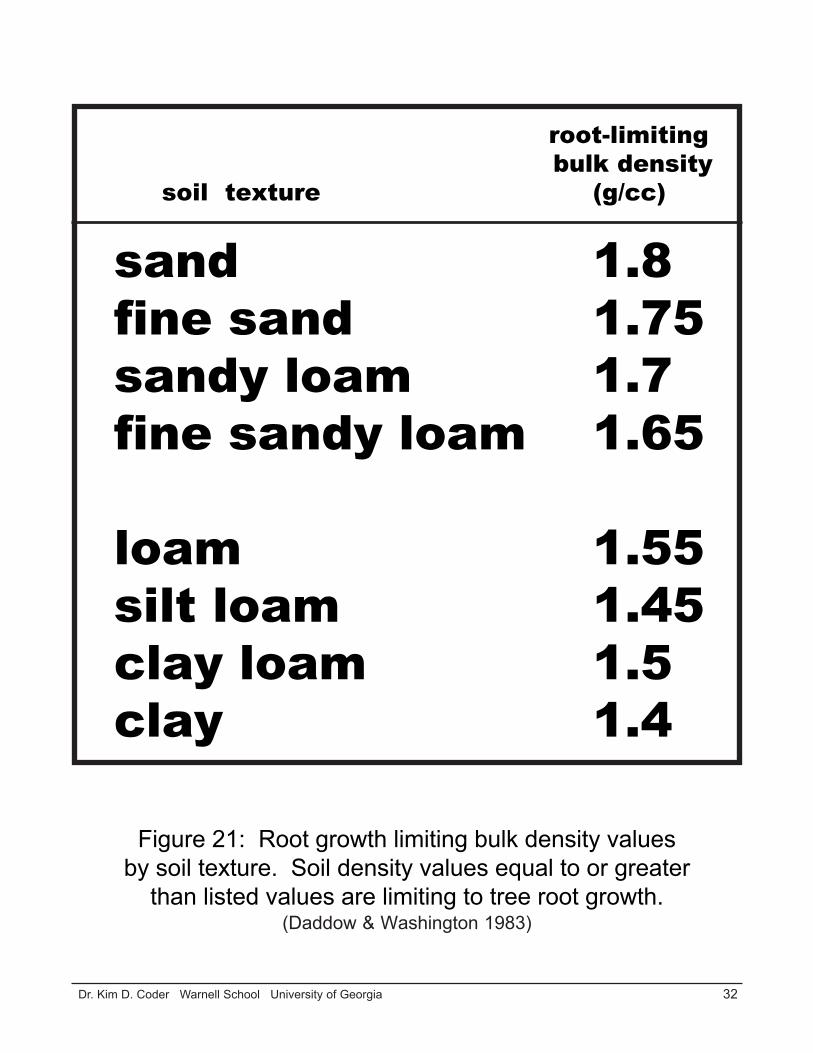
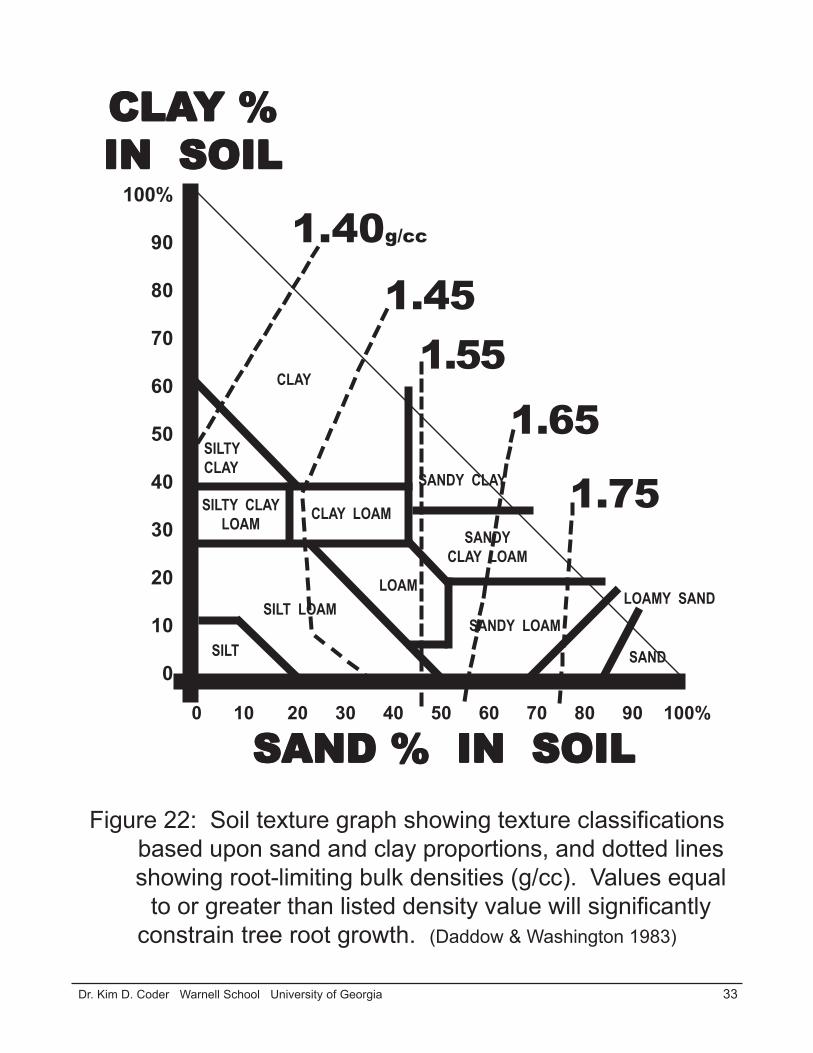
With compaction, soil strength reaches a level where roots can not exert enough force to pushinto pore spaces. Figure 19. Figure 20. Figure 21 lists root-limiting soil densities by texture. Soiltexture and density must both be determined to estimate compaction impacts on tree health. Figure 22shows a soil texture graph with root growth constraining soil density values. Regardless of soil texture,soil density values greater than 1.75g/cc severely limits growth.
SufficationThe aeration pathway (lifeline) from the atmosphere to a root surface through all the intercon-
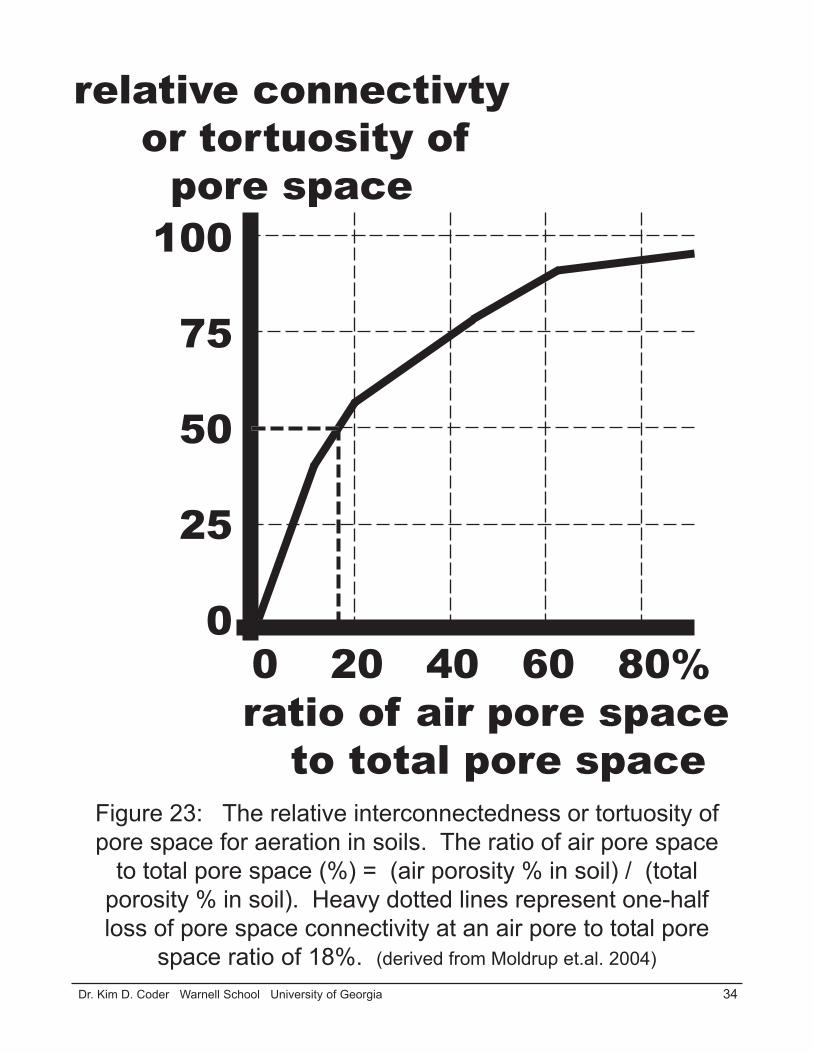
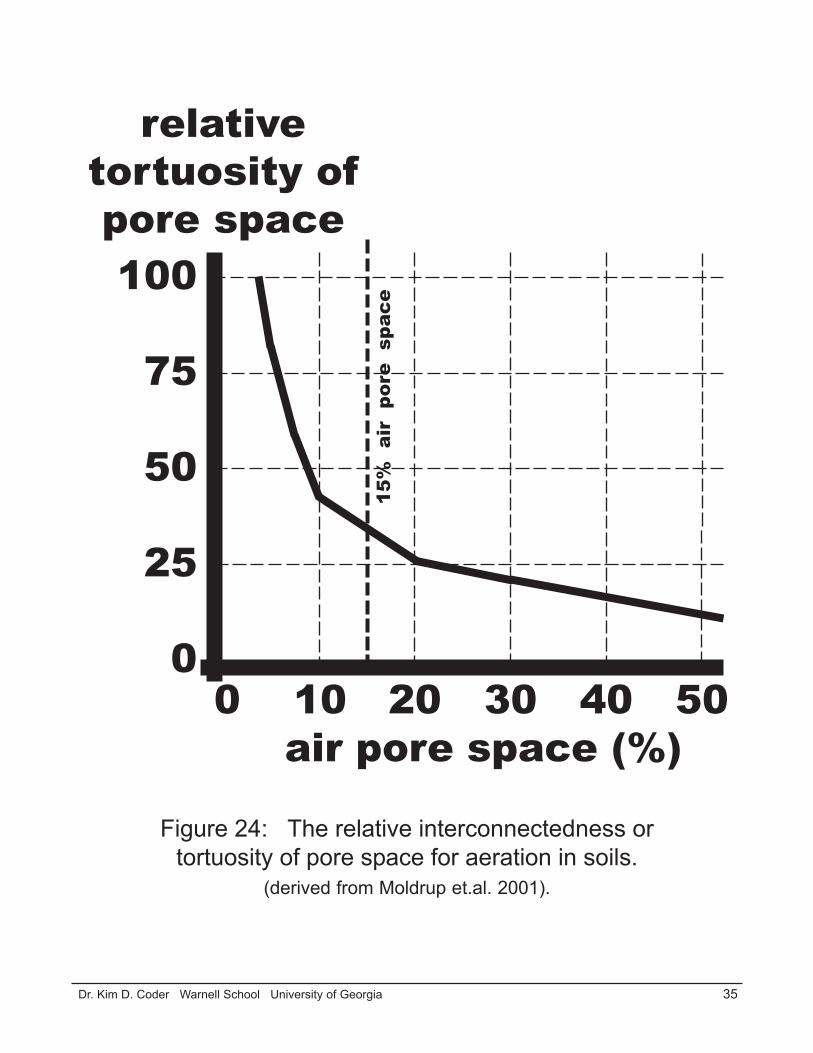
nected aeration pores declines quickly with compaction. Figure 23. Figure 24 demonstrates as air porespace falls below 15%, the pore interconnectiveness becomes highly convoluted and highly resistive togas exchange. As tortuosity of the oxygen supply path increases, the closer to the surface the anaerobiclayer moves.
As pore sizes become smaller with compaction, more pore space is filled with water. Water-filled pores diffuse oxygen at rates 7,000 to 10,000 times slower than air-filled pores. With all theaerobes and roots in a soil competing for the same oxygen, oxygen limitations can quickly become
25 Dr. Kim D. Coder Warnell School University of Georgia
relativeoxygen
diffusionrate (%)
100
80
60
40
20
00 20 40 60total porosity (%)
Figure 14: Relative oxygen diffusion rates as total soilpore space changes. (derived from Cook & Knight, 2003)
26 Dr. Kim D. Coder Warnell School University of Georgia
relativepore
volume10
8
6
4
2
00 1 10 100 pore diameter (μμμμμm)
Figure 15: Soil pore diameters and relative volumesunder non-compacted (1.4 g/cc) and compacted
(1.8 g/cc) conditions. (after Jim 1999)
non-compacted
compacted
0.2μm 60μm
27 Dr. Kim D. Coder Warnell School University of Georgia
low O2,high CO2,
high strength,less aeration pores
ROOTINGAREA
DEADZONE
high O2,low CO2,low strength,more aeration pores
compaction
Figure 16: Graphical representation ofcompaction impacts on soil.
soil surface
28 Dr. Kim D. Coder Warnell School University of Georgia
0-1
1-5
5-10
10-15
15-20
20-25
25-30
soildepth (in)
+
++
+
-C+O2
-C-O2
+C+O2
+C-O2
Figure 17: Compaction (C = + 28%) and oxygen (O2 = - 5%)impacts on tree rooting depths. (after Gilman et.al. 1987)
treatments
+ = average depth
29 Dr. Kim D. Coder Warnell School University of Georgia
root-limiting soil texture air pore %
sand 24 %fine sand 21sandy loam 19fine sandy loam 15
loam 14silt loam 17clay loam 11clay 13
Figure 18: Root growth limiting air-pore space valuesby soil texture. Pore space percentages at or less than
the value given are limiting to tree root growth.(Daddow & Washington 1983)
30 Dr. Kim D. Coder Warnell School University of Georgia
.75 1.0 1.25 1.5
4
3
2
1
0
relativesoil
strength
bulk density (g/cc)
Figure 19: Relative soil strength with increasingdensity values. (after Craul 1994)
31 Dr. Kim D. Coder Warnell School University of Georgia
Figure 20: Soil penetration resistance & root elongation rate.(1 MPa = 100 kPa . 1 bar) (after Rendig & Taylor 1989)
.5 1 1.5 2
100%
75%
50%
25%
soil resistance (MPa)
relative rootelongation rate
32 Dr. Kim D. Coder Warnell School University of Georgia
root-limiting bulk density
soil texture (g/cc)
sand 1.8fine sand 1.75sandy loam 1.7fine sandy loam 1.65
loam 1.55silt loam 1.45clay loam 1.5clay 1.4
Figure 21: Root growth limiting bulk density valuesby soil texture. Soil density values equal to or greater
than listed values are limiting to tree root growth.(Daddow & Washington 1983)
33 Dr. Kim D. Coder Warnell School University of Georgia
Figure 22: Soil texture graph showing texture classificationsbased upon sand and clay proportions, and dotted linesshowing root-limiting bulk densities (g/cc). Values equal
to or greater than listed density value will significantlyconstrain tree root growth. (Daddow & Washington 1983)
100%
90
80
70
60
50
40
30
20
10
0
0 10 20 30 40 50 60 70 80 90 100%
CLAY
SANDY CLAY
SILTYCLAY
SILT
LOAM
SANDY LOAMLOAMY SAND
SAND
SILT LOAM
CLAY LOAMSILTY CLAYLOAM
SANDYCLAY LOAM
CLACLACLACLACLAY %Y %Y %Y %Y %IN SOILIN SOILIN SOILIN SOILIN SOIL
SAND % IN SOILSAND % IN SOILSAND % IN SOILSAND % IN SOILSAND % IN SOIL
1.65
1.451.40g/cc
1.75
1.55
34 Dr. Kim D. Coder Warnell School University of Georgia
relative connectivty or tortuosity of
pore space100
75
50
25
0 0 20 40 60 80%ratio of air pore space
to total pore spaceFigure 23: The relative interconnectedness or tortuosity ofpore space for aeration in soils. The ratio of air pore space
to total pore space (%) = (air porosity % in soil) / (totalporosity % in soil). Heavy dotted lines represent one-halfloss of pore space connectivity at an air pore to total pore
space ratio of 18%. (derived from Moldrup et.al. 2004)
35 Dr. Kim D. Coder Warnell School University of Georgia
relativetortuosity ofpore space100
75
50
25
0 0 10 20 30 40 50 air pore space (%)
Figure 24: The relative interconnectedness ortortuosity of pore space for aeration in soils.
(derived from Moldrup et.al. 2001).
15%
air
por
e s
pace

36 Dr. Kim D. Coder Warnell School University of Georgia
severe. Figure 25 shows oxygen diffusion rates declining in a soil under increasing (line 1 to 3 infigure) compaction.
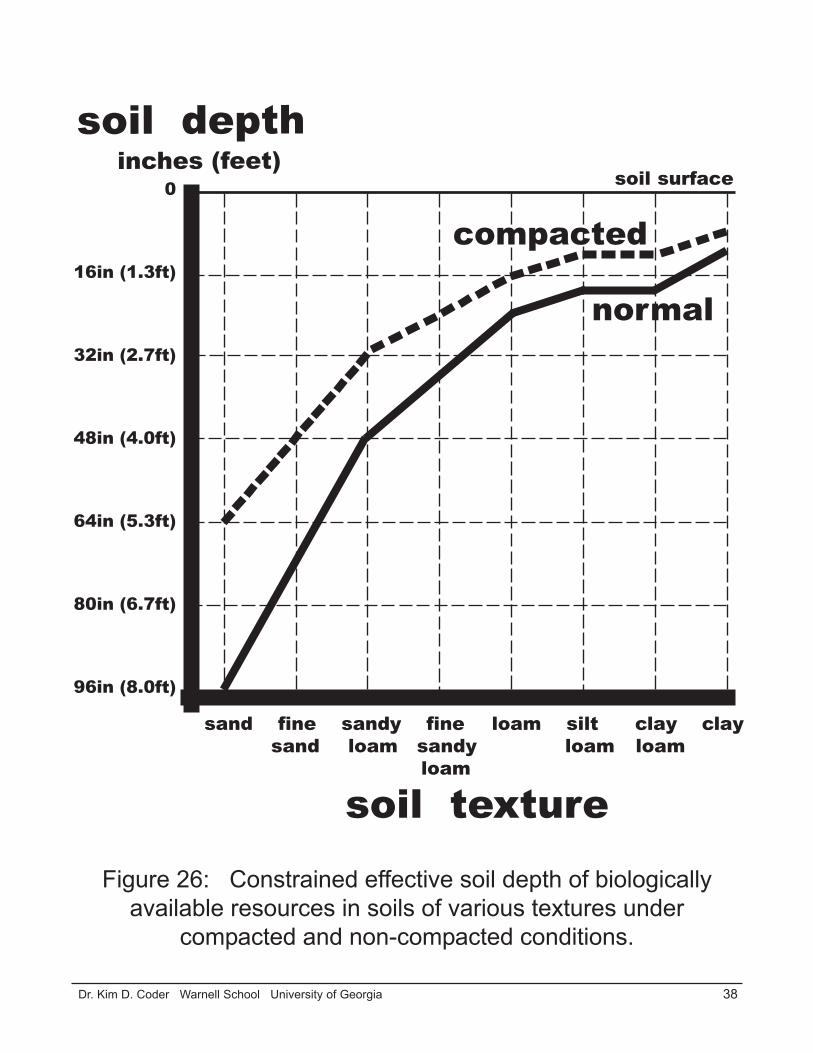
Compaction constrains oxygen movement in soil and shifts soil aggregates toward moreanaerobic conditions. Less oxygen diffusing into soil leads to a chemically reducing soil environ-ment (both in soil solution and soil atmosphere) closer to the surface. Figure 26. Under theseconditions, toxins and unusable essential element forms are generated. In addition, organic matter isnot mineralized or decomposed effectively. As oxygen is consumed, an anaerobic respiration se-quence begins among bacteria starting with the use of nitrogen and moving through manganese, iron,and sulfur, ending with carbon (i.e. fermentation of organic matter including roots).
Limited Gas ExchangeTree roots are aerobes, as are root symbionts and co-dependent species of soil organisms.
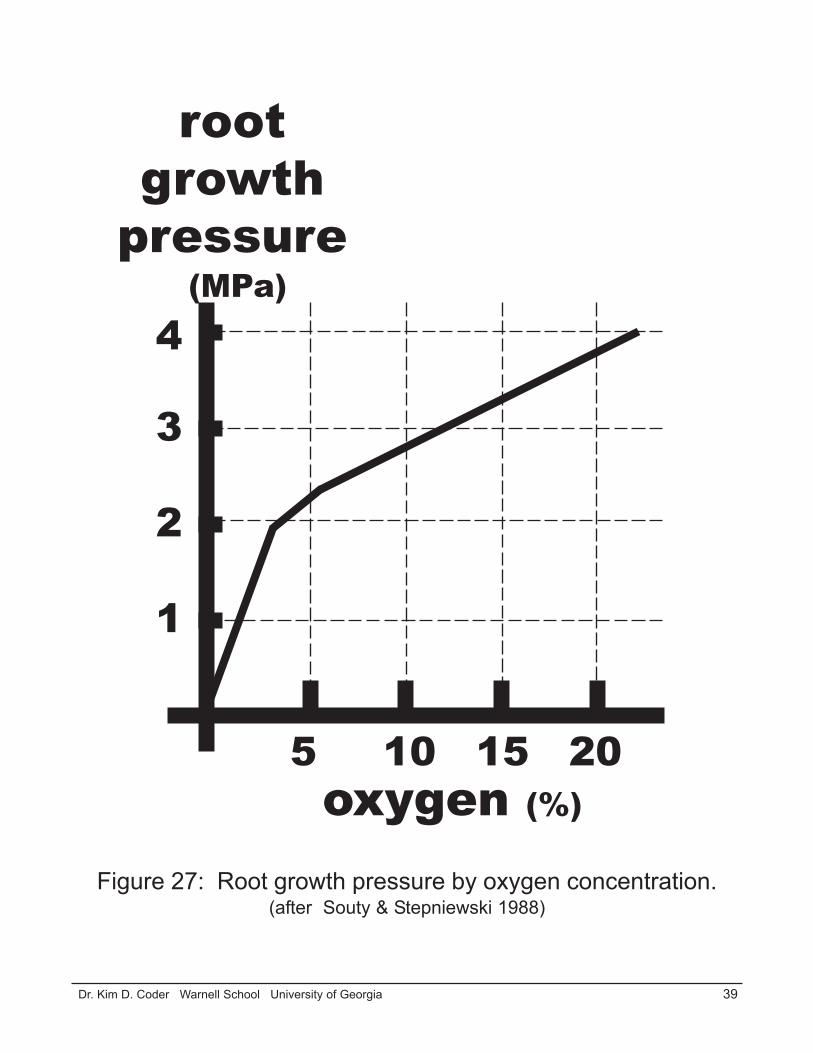
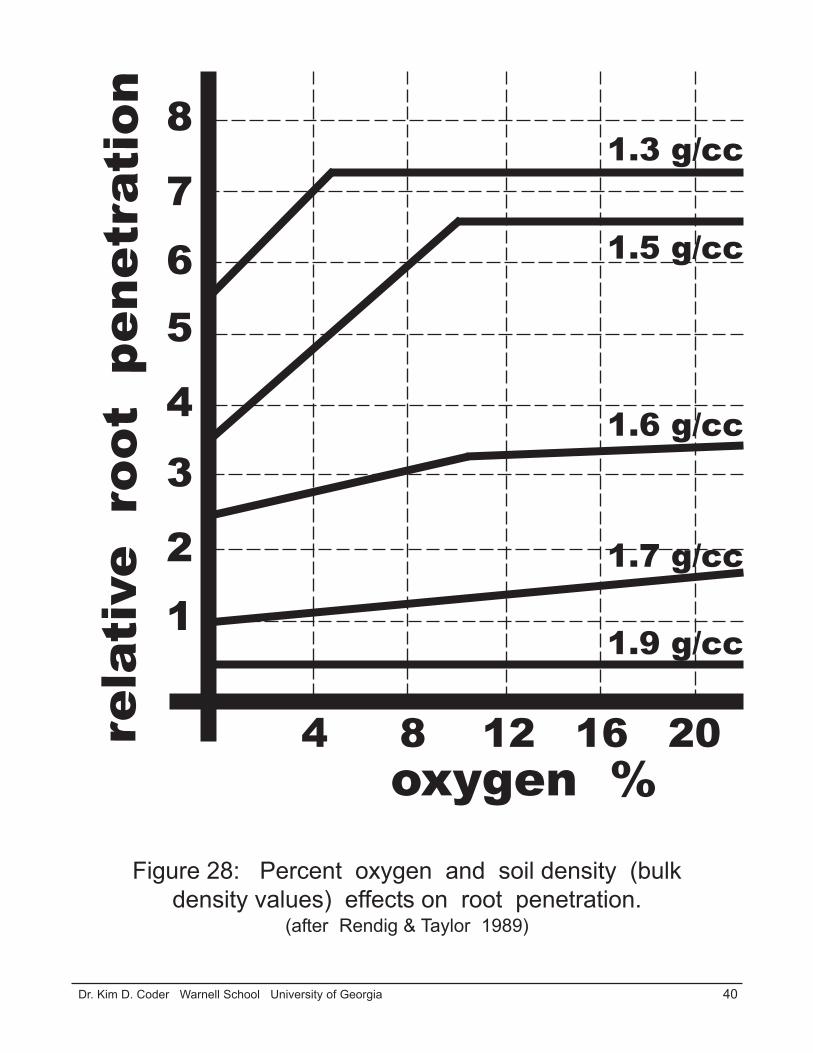
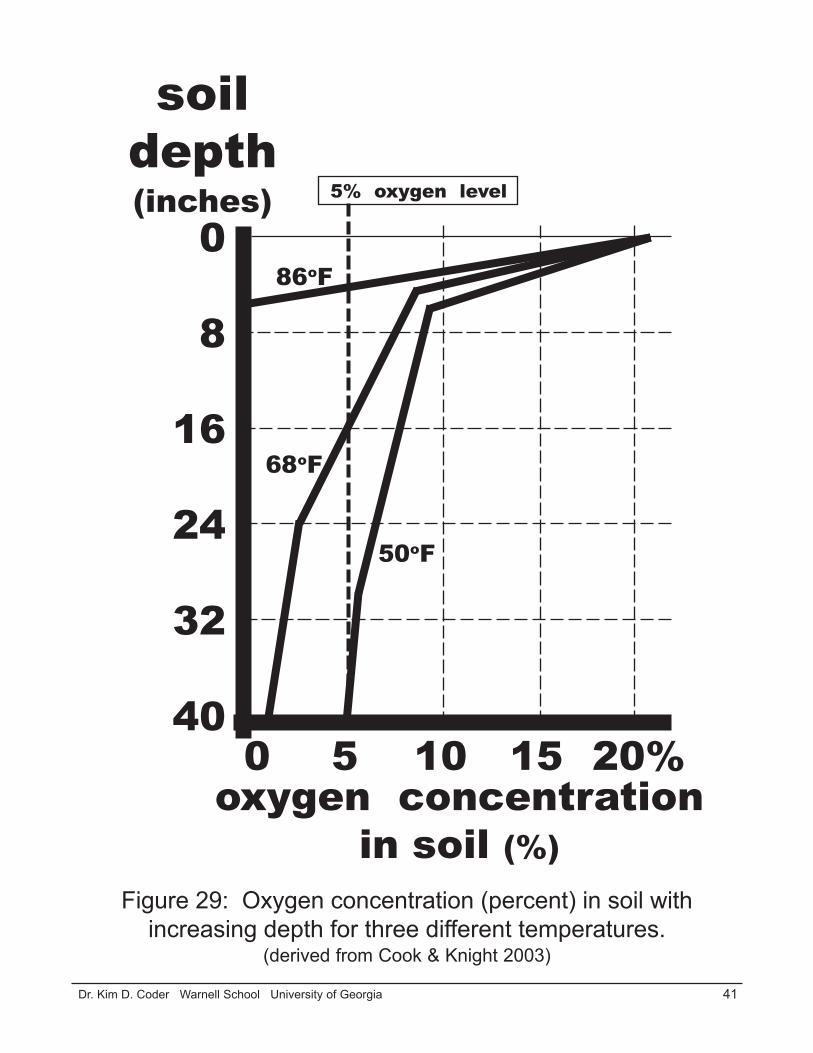
Less oxygen minimizes root growth pressure, defense, and survival. Figure 27. Tree roots useavailable food twenty times (20X) more inefficiently under near anaerobic conditions. Less oxygenalso allows common pathogenic fungi, which have oxygen demands must less than tree roots, tothrive. As oxygen concentrations fall below 5% in the soil atmosphere, severe root growth problemsoccur even at low soil densities. Figure 28. Figure 29.
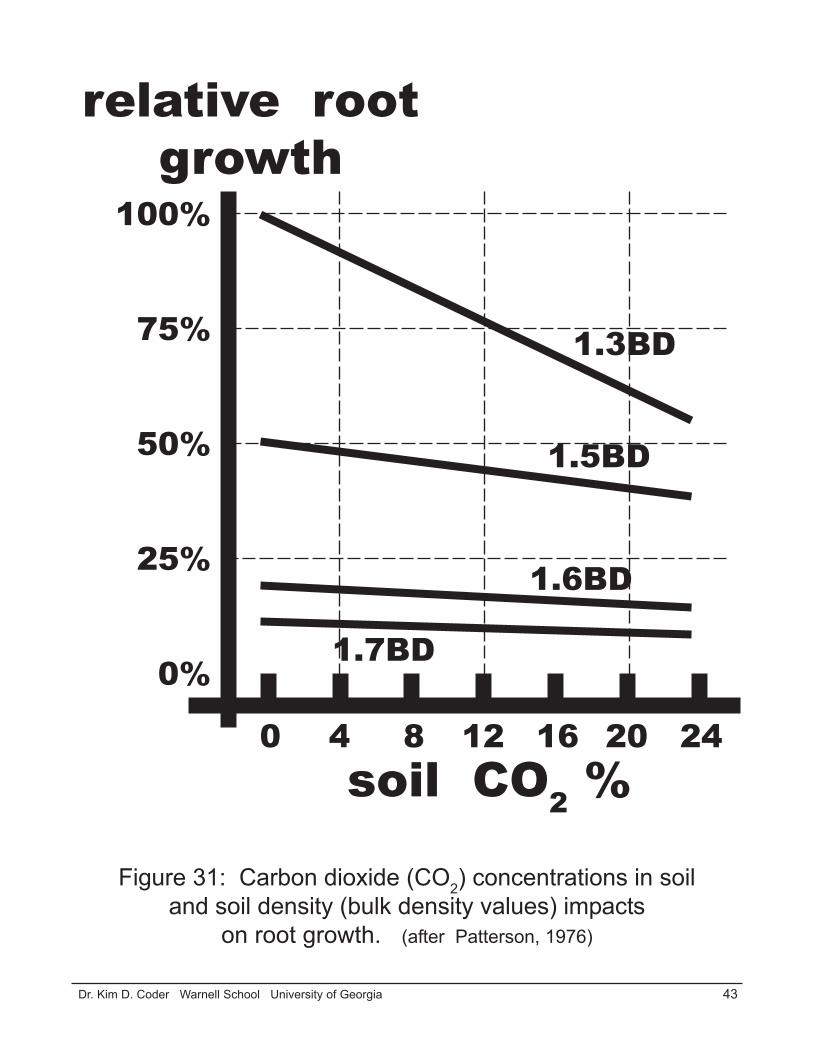
Compaction prevents gas exchange with the atmosphere. Figure 30. Compaction preventsoxygen from moving to root surfaces, but also prevents carbon-dioxide and toxics (both evolved andresident) from being removed from around roots and vented to the atmosphere. Poor gas exchangeallows the anaerobic layer to move closer to the surface and reduces rooting volume. As carbon-dioxide comprises more than 5% of the soil atmosphere, problems of aeration become compounded.As carbon-dioxide climbs above 15% in soils, growth problems accelerate. Figure 31.
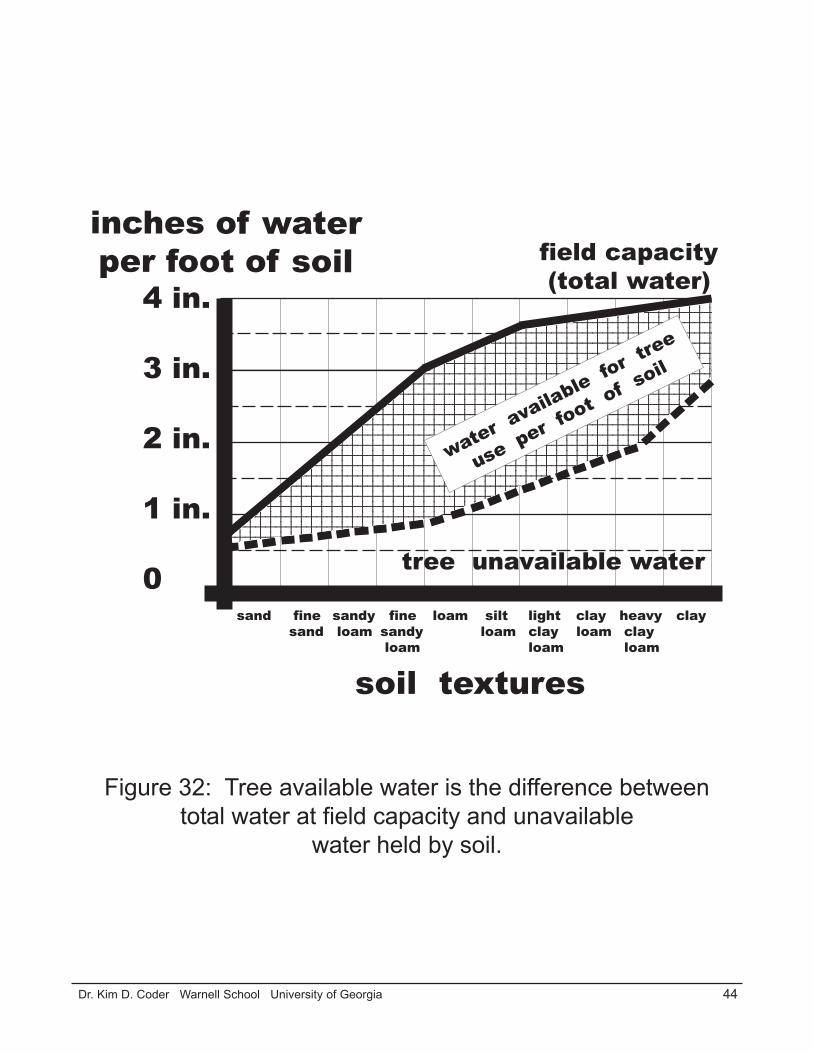
Less WaterOne of the most ignored result of compaction is it effects on soil water availability. Figure
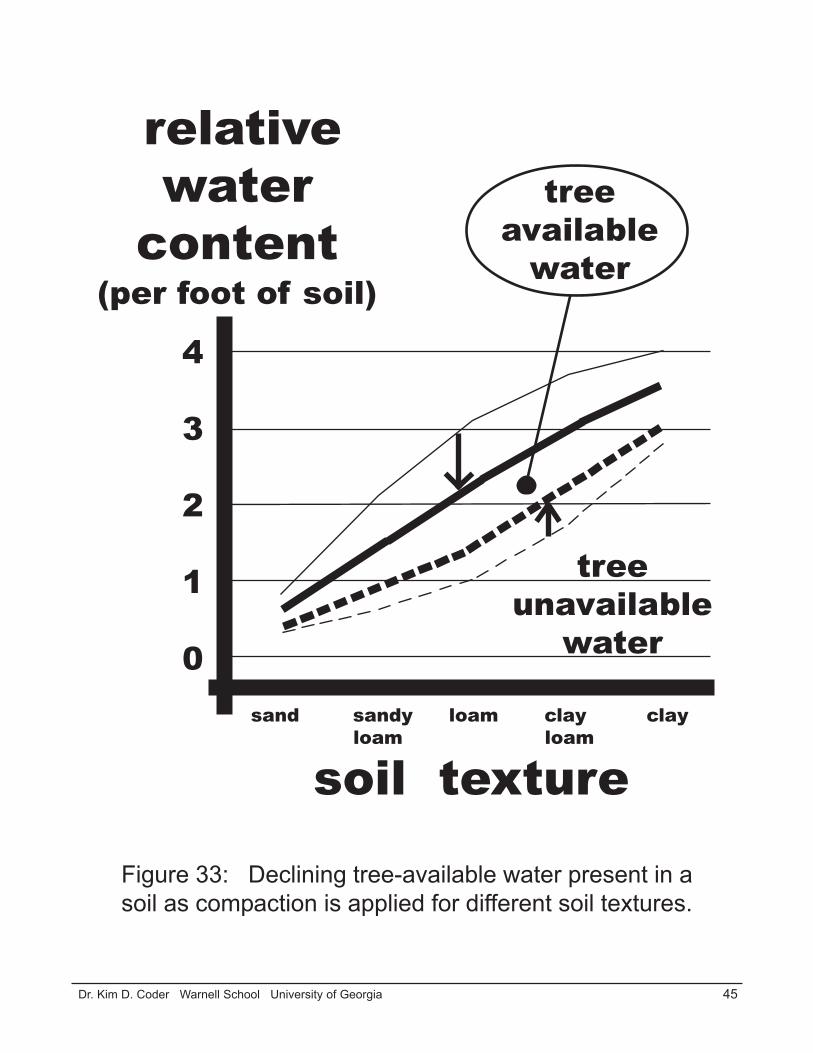
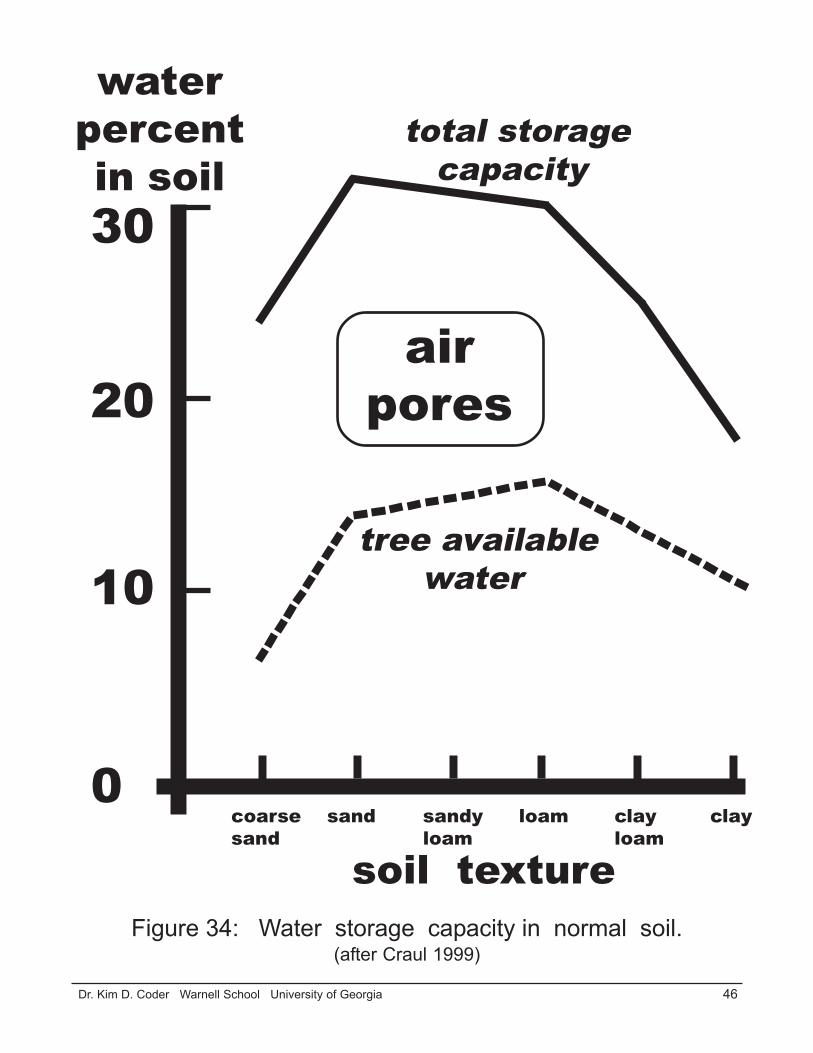
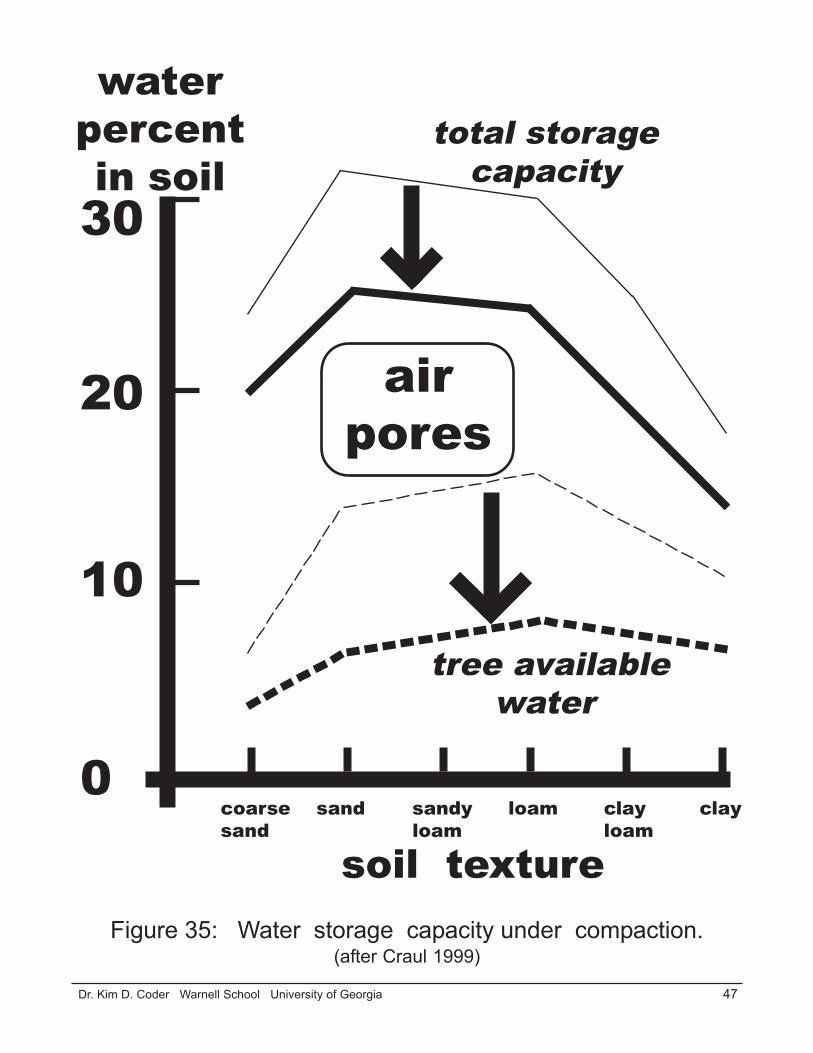
32. Soil compaction reduces tree available water held in large capillary pores and increases thevolume of small capillary pores which hold water unavailable to trees. Figure 33. With a decreasingnumber of large capillary pores and increasing number of small capillary pores, the total waterholding capacity of the soil declines. Compare Figure 34 and Figure 35.
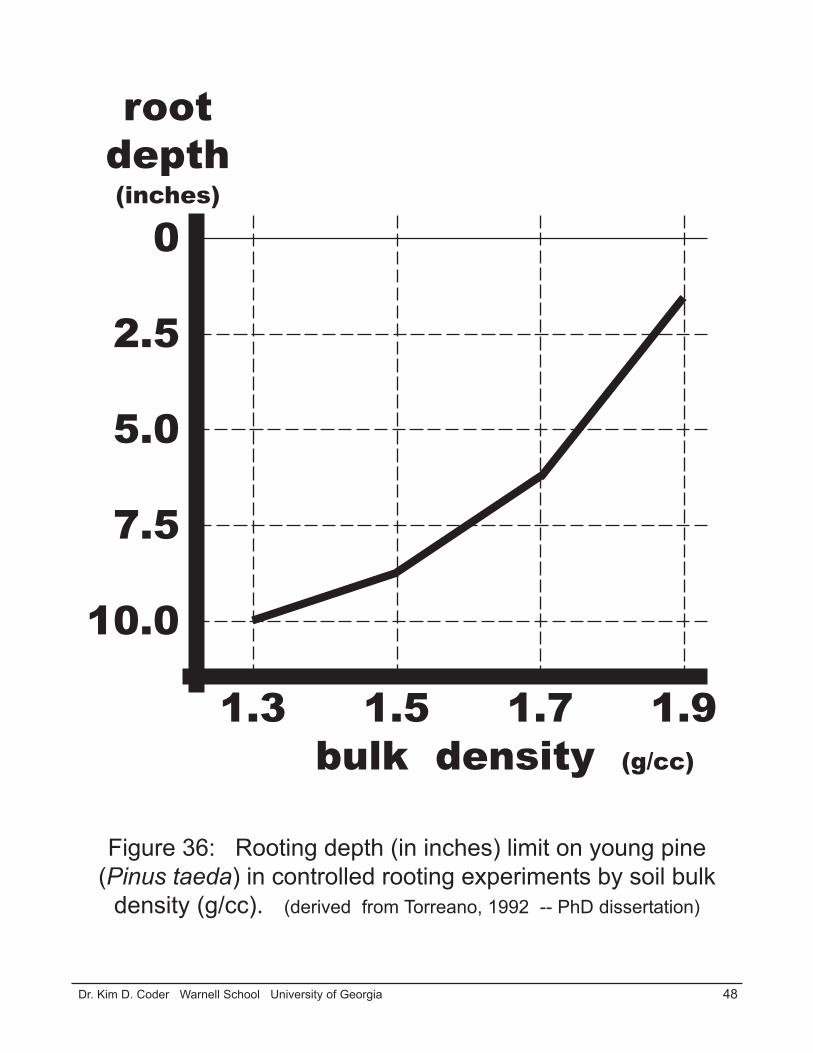
Irrigation scheduling and soil water monitoring becomes much more critical around trees incompacted soils. Compaction leads to smaller pore spaces and slower infiltration rates. With in-creasing residency time at the soil surface, water can move horizontally across the surface of the soilinitiating erosion. Over the top of compacted soil, water can reach faster velocities (more erosionpotential) than in areas where infiltration is eased. Inside a soil, compaction prevents effectivedrainage. Poor internal drainage limits tree available water, prevents oxygen movement, and in-creases production and residence time for carbon-dioxide and toxics. Figure 36.
More HeatCompaction changes the energy and water balance near a soil surface. With more particle to
particle contact, heat transfer is greater into soil. Results include burning-out of organic matterquicker, acceleration of evaporative and transpirational water loss, and increased respiration of rootsand soil organisms. As temperature increases, respiration responds along a doubling sequence – forevery 18oF (10oC) increase in temperature, root and soil microbe respiration doubles.

37 Dr. Kim D. Coder Warnell School University of Georgia
0
2
4
6
8
10
12
soildepth
(in) 0 20 40 60 80 100%relative O2 diffusion rates
root
gro
wth
lim
it1
23
Figure 25: Relative oxygen (O2) diffusion rateswith increasing soil compaction. (after Kelsey 1994)
increasing
compaction
38 Dr. Kim D. Coder Warnell School University of Georgia
sand fine sandy fine loam silt clay clay sand loam sandy loam loam
loam
0
16in (1.3ft)
32in (2.7ft)
48in (4.0ft)
64in (5.3ft)
80in (6.7ft)
96in (8.0ft)
soil texture
soil depth inches (feet)
Figure 26: Constrained effective soil depth of biologicallyavailable resources in soils of various textures under
compacted and non-compacted conditions.
soil surface
normal
compacted
39 Dr. Kim D. Coder Warnell School University of Georgia
Figure 27: Root growth pressure by oxygen concentration.(after Souty & Stepniewski 1988)
5 10 15 20oxygen (%)
1
2
3
4
rootgrowth
pressure (MPa)
40 Dr. Kim D. Coder Warnell School University of Georgia
Figure 28: Percent oxygen and soil density (bulkdensity values) effects on root penetration.
(after Rendig & Taylor 1989)
4 8 12 16 20oxygen %
8
765
4
3
21
rela
tive
roo
t p
enet
rati
on 1.3 g/cc
1.5 g/cc
1.6 g/cc
1.7 g/cc
1.9 g/cc
41 Dr. Kim D. Coder Warnell School University of Georgia
soildepth(inches)
0
8
16
24
32
400 5 10 15 20%
50oF
68oF
86oF
Figure 29: Oxygen concentration (percent) in soil withincreasing depth for three different temperatures.
(derived from Cook & Knight 2003)
5% oxygen level
oxygen concentrationin soil (%)

42 Dr. Kim D. Coder Warnell School University of Georgia
0
1
2
3
soildepth
(feet)
8 12 16 20
non-
com
pact
ed
compacted
Figure 30: Oxygen concentrations (percent) withincreasing soil depth (in feet) under compacted and
non-compacted conditions.(non-compacted data derived from Kalita, 1999)
oxygen concentration(percent)
43 Dr. Kim D. Coder Warnell School University of Georgia
0 4 8 12 16 20 24soil CO2 %
relative rootgrowth
100%
75%
50%
25%
0%
1.3BD
1.5BD
1.6BD
1.7BD
Figure 31: Carbon dioxide (CO2) concentrations in soiland soil density (bulk density values) impacts
on root growth. (after Patterson, 1976)
44 Dr. Kim D. Coder Warnell School University of Georgia
sand fine sandy fine loam silt light clay heavy clay sand loam sandy loam clay loam clay
loam loam loam
4 in.
3 in.
2 in.
1 in.
0
inches of waterper foot of soil
soil textures
123456789012345678901234567890121234567890123456123456789012345678901234567890121234567890123456123456789012345678901234567890121234567890123456123456789012345678901234567890121234567890123456123456789012345678901234567890121234567890123456123456789012345678901234567890121234567890123456123456789012345678901234567890121234567890123456123456789012345678901234567890121234567890123456123456789012345678901234567890121234567890123456123456789012345678901234567890121234567890123456123456789012345678901234567890121234567890123456123456789012345678901234567890121234567890123456123456789012345678901234567890121234567890123456123456789012345678901234567890121234567890123456123456789012345678901234567890121234567890123456123456789012345678901234567890121234567890123456123456789012345678901234567890121234567890123456123456789012345678901234567890121234567890123456123456789012345678901234567890121234567890123456123456789012345678901234567890121234567890123456123456789012345678901234567890121234567890123456123456789012345678901234567890121234567890123456123456789012345678901234567890121234567890123456123456789012345678901234567890121234567890123456123456789012345678901234567890121234567890123456
Figure 32: Tree available water is the difference betweentotal water at field capacity and unavailable
water held by soil.
water available fo
r tree
use per foot o
f soil
field capacity (total water)
tree unavailable water
45 Dr. Kim D. Coder Warnell School University of Georgia
sand sandy loam clay clay loam loam
soil texture
4
3
2
1
0
relativewater
content(per foot of soil)
treeunavailable
water
Figure 33: Declining tree-available water present in asoil as compaction is applied for different soil textures.
treeavailable
water
46 Dr. Kim D. Coder Warnell School University of Georgia
soil texturecoarse sand sandy loam clay claysand loam loam
waterpercentin soil
10
20
30
0
tree available water
total storage capacity
airpores
Figure 34: Water storage capacity in normal soil.(after Craul 1999)
47 Dr. Kim D. Coder Warnell School University of Georgia
soil texturecoarse sand sandy loam clay claysand loam loam
waterpercentin soil
10
20
30
0
tree availablewater
total storagecapacity
Figure 35: Water storage capacity under compaction.(after Craul 1999)
airpores
48 Dr. Kim D. Coder Warnell School University of Georgia
rootdepth(inches)
0
2.5
5.0
7.5
10.0
1.3 1.5 1.7 1.9bulk density (g/cc)
Figure 36: Rooting depth (in inches) limit on young pine(Pinus taeda) in controlled rooting experiments by soil bulk
density (g/cc). (derived from Torreano, 1992 -- PhD dissertation)
49 Dr. Kim D. Coder Warnell School University of Georgia
Compaction Kills!Soil compaction impacts tree and soil health in many ways. Generally, compaction associated
physiological dysfunctions cause systemic tree damage and decline, as well as failures in dealing withadditional environmental changes. Physical / mechanical constraints impact tree responses resulting ininefficient use of essential resources. The symptoms of compaction expressed by trees under compactedsoil conditions are derived from disruptions of internal sense, communication, and response processes.
Compaction disrupts respiration processes which power every function of a tree. Growth regula-tors are destroyed prematurely or allowed to buildup, causing wild changes in tissue reactions. Carbon(food) allocation patterns, following highly modified growth regulation patterns, change food produc-tion, storage, use, and transport processes. Defensive capabilities with degraded sensor functions,associated growth regulator communications failures, and ineffective food use, are slow to react andincomplete in response. With compaction, short-term fluctuations in resource quality and quantity in atree must be effectively dealt with, and resulting chronic stress must be tolerated, in order to survive.
PoisoningThe presence of toxic materials can be highly disruptive to soil health. As oxygen concentrations
decline, more reduced compounds (partially oxidized) are generated by tree roots and associated soilorganisms. These reduced compound can build-up, damage organisms, and move soil toward anaerobicconditions. In normal soils, these materials (if produced at all) are quickly oxidized or removed fromnear tree roots. In compacted soil, normally produced materials, materials produced under low oxygenconditions, and anaerobically produced compounds, are not oxidized nor removed from where they areproduced. The longer the residence time of some of these materials, the more damage to tree roots.
Structural DeclineThe structure of a tree can also be directly and indirectly impacted by compacted soils. Root
decline and death can lead to catastrophic structural failures. Tissue death and subsequent compartmen-talization processes can compound mechanical faults. Growth regulation and carbon allocation changescan modify stem and root collar taper and reaction wood development. Whole tree stress can result intissue shedding both internally to heartwood and externally as shown in top and root dieback. Branchdrop and root failures can result. Reduced rooting volume mechanically destabilizes the whole tree.
Measuring CompactionMeasuring CompactionMeasuring CompactionMeasuring CompactionMeasuring CompactionTree health management is limited in how easily and effectively we can measure absolute and
relative soil compaction. Measures can be used which approach actual values and suggest impacts onessential tree resources. Primary resources impacted by compaction and critical to tree growth in soil areoxygen availability, gas exchange with the atmosphere, and soil strength values. These resources areseverely limited by soil compaction. Mechanical impedance and gas movement in a soil for tree healthis difficult to measure directly.
Because of the difficulty in simultaneously measuring soil resource limitations quickly in thefield, a number of approximate measures for compaction have been developed. Two measures mostcommonly used are bulk density and soil penetration force. Unfortunately, both measures are soilmoisture content and organic matter dependent. Additionally, bulk density and soil penetration force arenot measuring the same features in a soil, and so, are not necessarily closely correlated. Bulk density isusually considered the best estimate of soil compaction on a site.
50 Dr. Kim D. Coder Warnell School University of Georgia
Bulk DensityBulk DensityBulk DensityBulk DensityBulk DensityBulk density is a relative measure of soil density (weight of a given volume of soil). The
most commonly used tool for measuring bulk density is a soil core slap-hammer that carefully drivesa metal sleeve of a known volume down into soil. The driving force used in sampling is shifted tosoil surrounding the sample volume. Minimizing any disruption of collected soil volume duringsampling is critical for an accurate measure. In addition, gravel, moisture content and percent oforganic matter can all disrupt collection of an accurate sample. Bulk density cores consistentlyprovide higher than actual (true) bulk density values for any sampled soil.
Dry & WaitThe collected soil volume must be dried in an oven until all measurable moisture (by weight)
is removed. Oven-dry weight of collected soil is recorded and divided by the known volume ofsample taken from the collection site. Clearly bulk density measures are not immediately available,but require drying and weighting time of usually a minimum of one day.
Bulk density characterizes both the mineral portion and pore space portion of a soil. Mostmineral soils share similar densities of solid mineral components (~2.65g/cc). Organic soils andsoils generated from parent materials with mineral densities significantly different from 2.65g/cc,will have different bulk densities simply due to different matrix component densities.
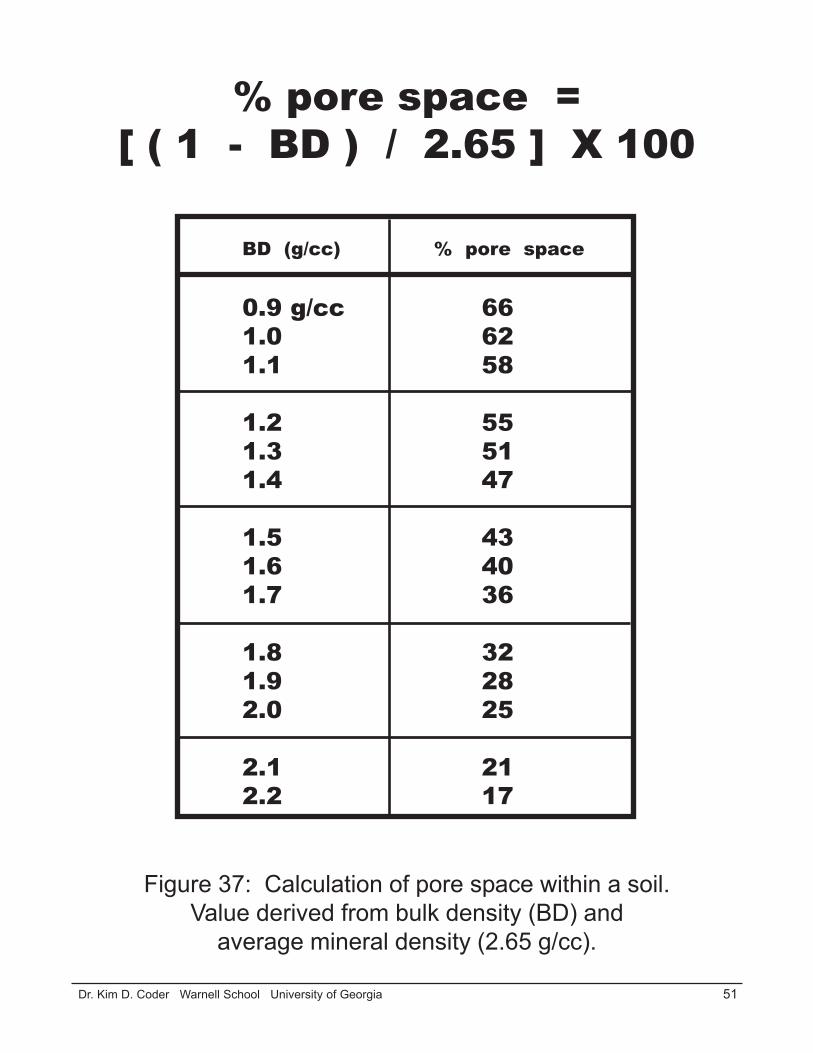
Open SpacesIf most soils share similar mineral densities, then any variability in their bulk density will be
due to differences in pore space volume. Pore space volumes (composed of water-filled “micro”pores and air-filled “macro” pores) are measured in a bulk density sample. Figure 37 provides acalculation of soil bulk density and percent of total pore space present for average mineral densitysoils. Note, the larger bulk density values, the smaller pore space volumes must be.
Bulk density, when collected under the right soil conditions in the right soils can providecritical management information. Because tree roots utilize soil spaces, any measure of these porespace volumes can help better manage tree growth. As soil bulk density increases (compactionincreases), total pore space declines and aerated pore spaces collapse. For example in one soil, a20% increase in bulk density initiated a 68% loss of aerated pore space and an increase in 7% capil-lary (water-filled) pore space. In another soil, compaction from a bulk density of 1.25g/cc (~50%total pore space) to 1.5g/cc (~40% total pore space) left the soil with 45% fewer large pores, 98%fewer intermediate sized pores, 1% fewer small pores, and 14% more extremely small pores.
Dense As A BrickMany materials can be measured using bulk density. Figure 38 provides bulk densities for
selected construction materials and associated pore space. Some compacted soils have greatermeasured bulk densities than some common construction materials. It is possible to find soilsaround infrastructures which are more dense than the walls and sidewalks of the building theyadjoin.
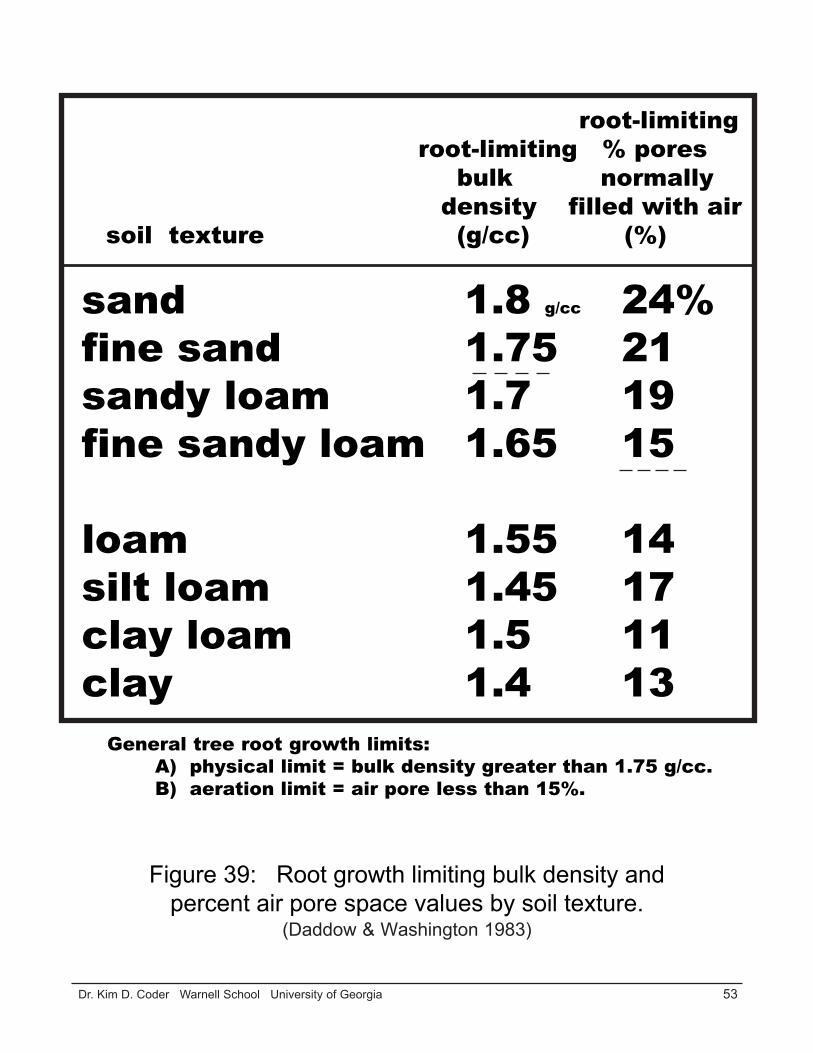
As discussed earlier, bulk density, as a measure of soil compaction, rapidly increases with thefirst few impacts on the soil surface and then only incrementally increases. Soils can be compactedto 90-95% of what they can be compacted to in as little as 3-4 trips over a single site under the rightconditions. As tree rooting space is compacted, root growth declines and stops. Figure 39 shows thebulk density and associated air pore volume, by soil texture type, where tree root growth becomeslimiting. Note bulk density limits root growth at different values for each soil texture type. Figure
51 Dr. Kim D. Coder Warnell School University of Georgia
BD (g/cc) % pore space
0.9 g/cc 661.0 621.1 58
1.2 551.3 511.4 47
1.5 431.6 401.7 36
1.8 321.9 282.0 25
2.1 212.2 17
Figure 37: Calculation of pore space within a soil.Value derived from bulk density (BD) and
average mineral density (2.65 g/cc).
% pore space =[ ( 1 - BD ) / 2.65 ] X 100

52 Dr. Kim D. Coder Warnell School University of Georgia
particle porematerial bulk density density space
cinderblock 1.70 2.64 36%
claybrick 1.75 2.72 36%
asphalt 2.19 2.35 7%
concrete 2.26 2.47 9%
units = g/cc g/cc percent volume
Figure 38: Physical attributes of selectedconstruction materials. (Patterson, 1976)
53 Dr. Kim D. Coder Warnell School University of Georgia
root-limitingroot-limiting % pores
bulk normally density filled with air
soil texture (g/cc) (%)
sand 1.8 g/cc 24%fine sand 1.75 21sandy loam 1.7 19fine sandy loam 1.65 15
loam 1.55 14silt loam 1.45 17clay loam 1.5 11clay 1.4 13
General tree root growth limits:A) physical limit = bulk density greater than 1.75 g/cc.B) aeration limit = air pore less than 15%.
Figure 39: Root growth limiting bulk density andpercent air pore space values by soil texture.
(Daddow & Washington 1983)
54 Dr. Kim D. Coder Warnell School University of Georgia
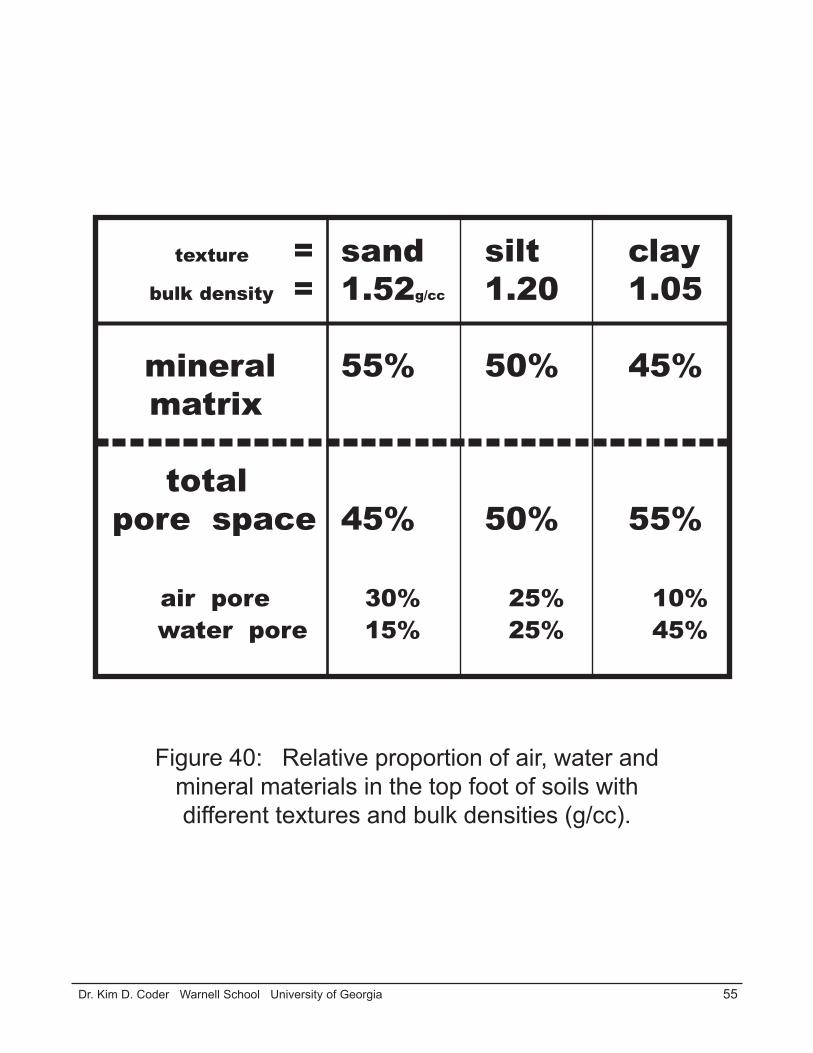
40 demonstrates it is not simply bulk density and total pore space which should be examined for treehealth but air pore space in particular. There is not a single number but trends in several measures undervarying conditions which should govern management decisions
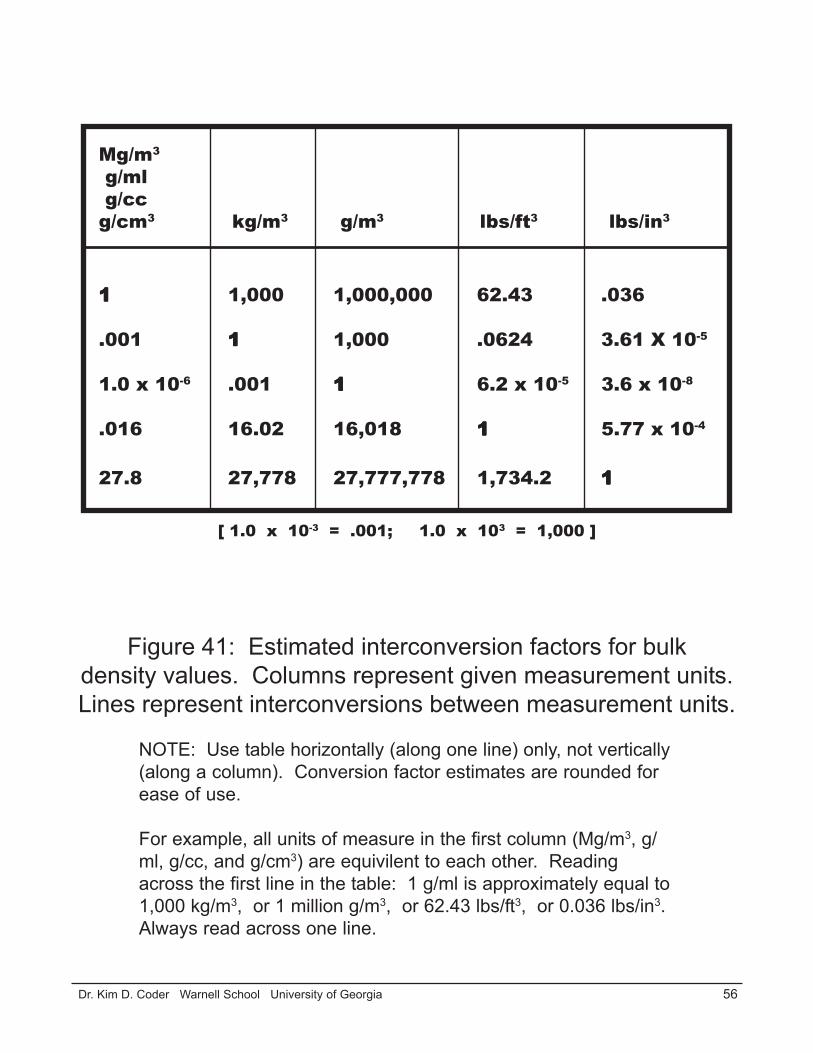
Figure 41 provides a list of bulk density measurement units and their interconversion.
Penetrometer PressurePenetrometer PressurePenetrometer PressurePenetrometer PressurePenetrometer PressureThe second primary means used to measure soil compaction and estimate resulting tree available
resources is by using a penetrometer. A penetrometer measures the energy (pressure) required to push ametal rod into soil. Penetrometers can be simple devices used to estimate packing density of mulch,surface compaction of roads beds, and bulk density of soils. Penetrometers provide immediate estimateswithout laboratory drying and weighting of samples, as needed with bulk density measures. But, pen-etrometers measure penetrative force not density of soil. Penetrometer measures are much more sensi-tive to soil moisture contents and associated soil strength values than bulk density measures.
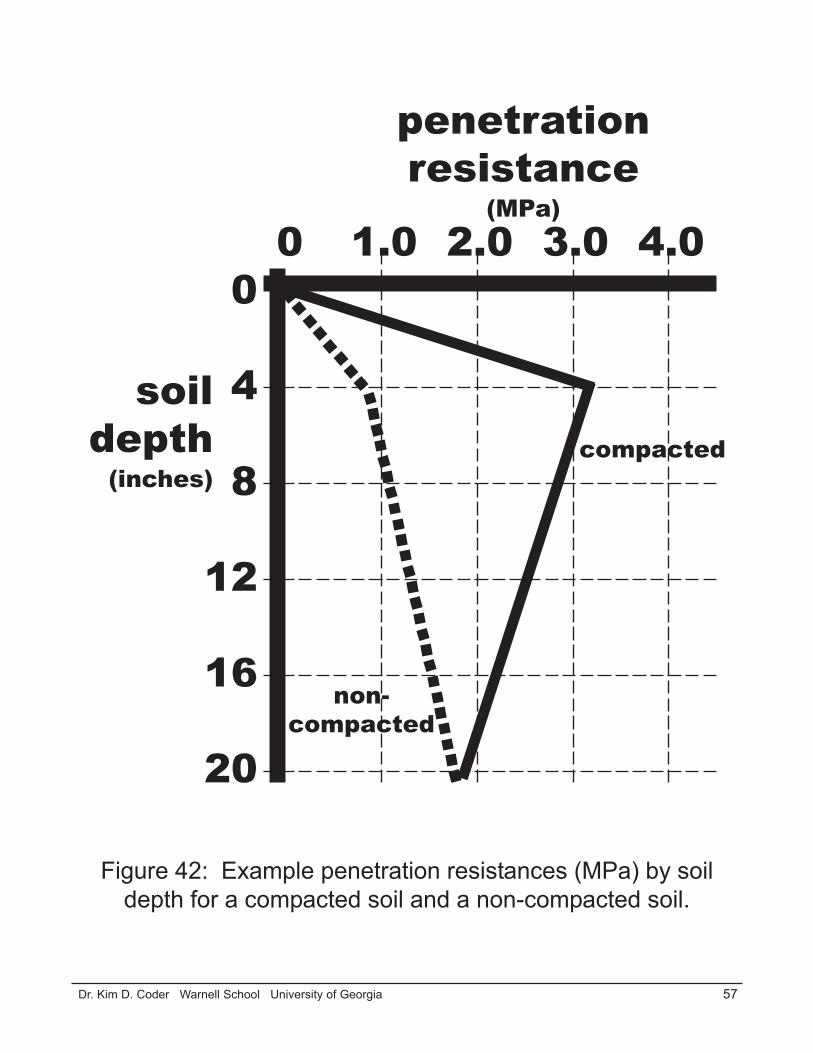
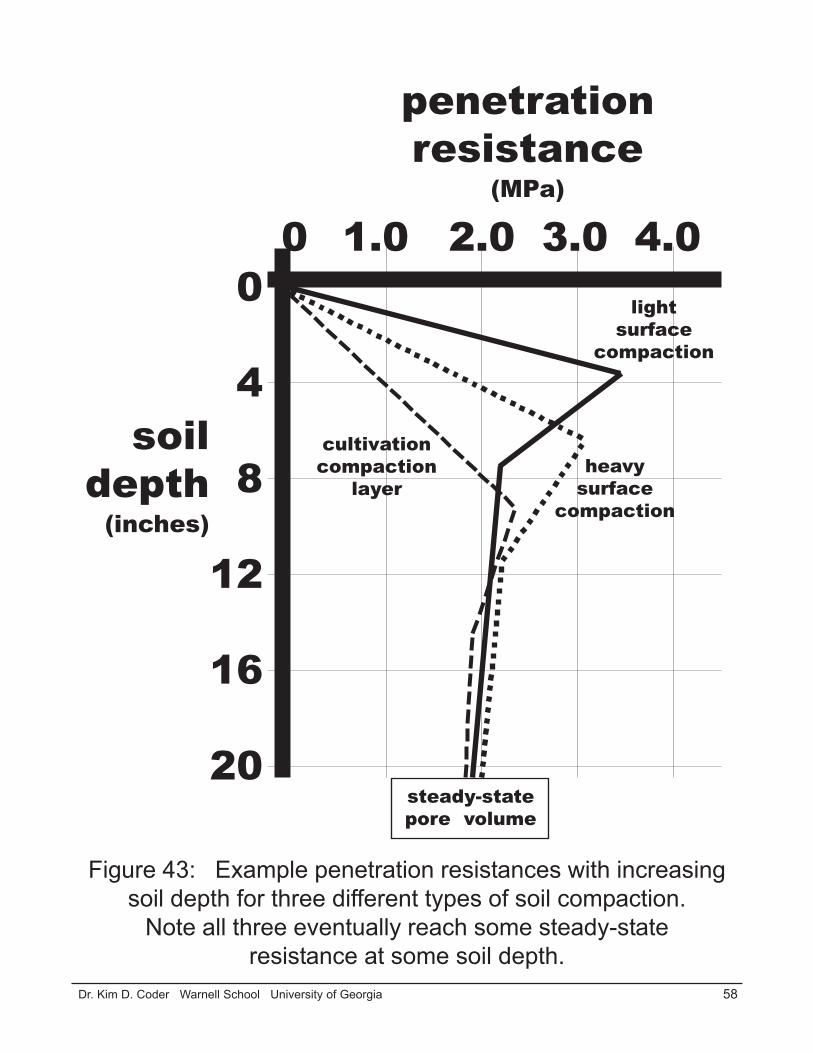
As a penetrometer is pushed into a soil, the soil resists. This resistance is measured on a dial orslide scale. As the penetrometer is inserted farther, different resistances are measured for different layersof soil, some may be significantly compacted and some not. Figure 42. Depending upon site history,different compacting events may have occurred and have left unique soil compaction signatures. Theheavier the compacting items, the deeper into soil measurable compaction will occur. Figure 43.
Pushing OnPenetrometers are unique tools, easy to use for estimating a single-number composite of soil
features and values. Penetrometers estimate resistance of a soil to root penetration (resistance = com-pression of soil in front of probe plus soil/metal friction around probe). In soils with uniform physicalcharacteristics across all dimensions, the penetrometer measure is well correlated to tree root elongation.Soils which contain large pores, fracture lines, cracks, gravel or stones are not good candidates foraccurate and precise penetrometer use.
Penetrometers do not displace soil in a manner like a tree root. Tree roots are soft, flexible, andmucilaginous with a rounded cap. The penetrometer probe is rigid, large in cross-sectional area, andusually has a conical point on its end. Penetrometers with a tapered tip having approximately a 30o anglepoint have 40% less friction moving through soil than a blunt tip, and more closely mimic root penetra-tions.
Steady & VerticalBecause of displacement and frictional forces on a penetrometer as it is pushed into soil, pen-
etrometers tend to overestimate impacts of penetration resistance on tree root growth. The deeper apenetrometer is pushed into soil, the greater soil / metal friction. When pushing a penetrometer into asoil always keep the probe vertical, do not wobble, and apply a constant pressure. A steady, moderatepressure is preferable over a suddenly-exerted high pressure.
Pushing RootsTraditionally a penetration resistance of 0.5 MPa begins to constrain root growth, 2.0 MPa cuts
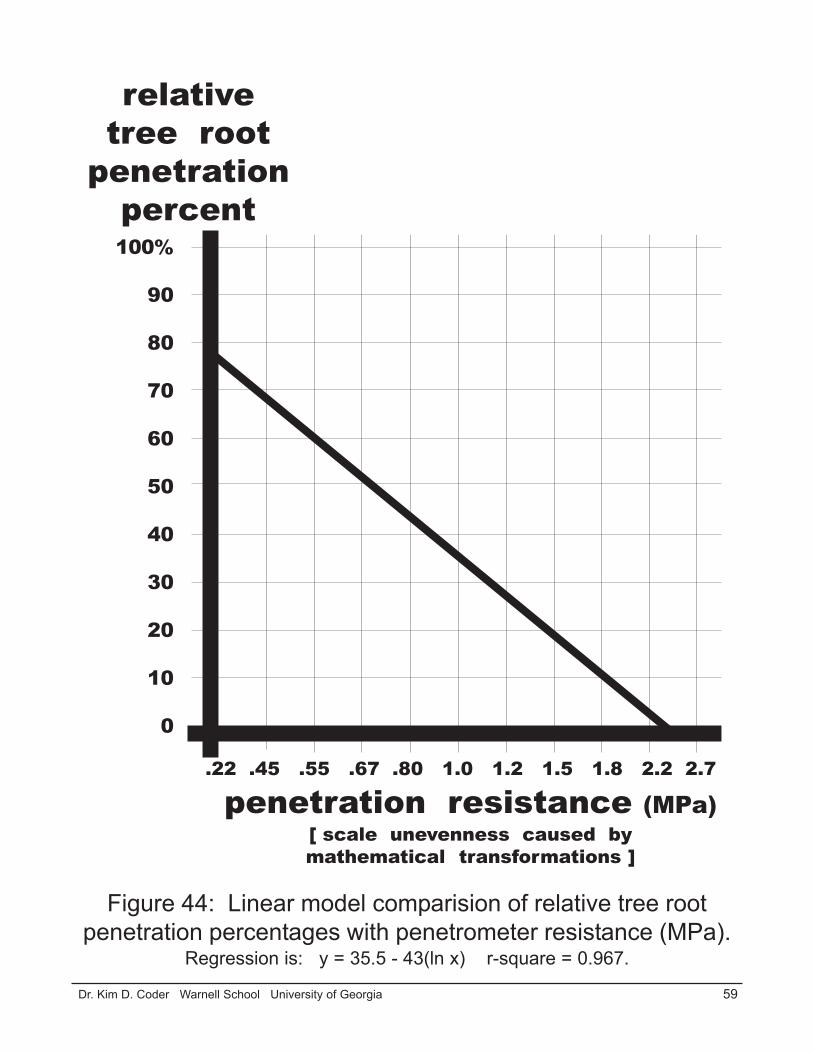
root growth by 60%, and 3.5 MPa of penetration resistance prevents elongation or expansion of treeroots. Two recent studies show root growth limitations at much smaller pressures. These studies pro-vide two views of relative tree root penetration of a soil (in percent) compared with measured penetrom-eter resistance values (in MPa).
The first study (Figure 44) shows a comparison among values of penetration resistance whichhave been transformed into natural logarithms (base e) for preparing a linear regression model. This
55 Dr. Kim D. Coder Warnell School University of Georgia
texture = sand silt claybulk density = 1.52g/cc 1.20 1.05
mineral 55% 50% 45%matrix
total pore space 45% 50% 55%
air pore 30% 25% 10% water pore 15% 25% 45%
Figure 40: Relative proportion of air, water andmineral materials in the top foot of soils withdifferent textures and bulk densities (g/cc).
56 Dr. Kim D. Coder Warnell School University of Georgia
Mg/m3
g/ml g/ccg/cm3 kg/m3 g/m3 lbs/ft3 lbs/in3
11111 1,000 1,000,000 62.43 .036
.001 11111 1,000 .0624 3.61 X 10⁻⁵
1.0 x 10⁻⁶ .001 11111 6.2 x 10⁻⁵ 3.6 x 10⁻⁸
.016 16.02 16,018 11111 5.77 x 10⁻⁴
27.8 27,778 27,777,778 1,734.2 1 1 1 1 1
Figure 41: Estimated interconversion factors for bulkdensity values. Columns represent given measurement units.Lines represent interconversions between measurement units.
NOTE: Use table horizontally (along one line) only, not vertically(along a column). Conversion factor estimates are rounded forease of use.
For example, all units of measure in the first column (Mg/m3, g/ml, g/cc, and g/cm3) are equivilent to each other. Readingacross the first line in the table: 1 g/ml is approximately equal to1,000 kg/m3, or 1 million g/m3, or 62.43 lbs/ft3, or 0.036 lbs/in3.Always read across one line.
[ 1.0 x 10-3 = .001; 1.0 x 103 = 1,000 ]
57 Dr. Kim D. Coder Warnell School University of Georgia
Figure 42: Example penetration resistances (MPa) by soildepth for a compacted soil and a non-compacted soil.
0 1.0 2.0 3.0 4.00
4
8
12
16
20
soildepth
(inches)
penetrationresistance
(MPa)
compacted
non-compacted
58 Dr. Kim D. Coder Warnell School University of Georgia
0 1.0 2.0 3.0 4.00
4
8
12
16
20
soildepth
(inches)
penetrationresistance
(MPa)
lightsurface
compaction
heavysurface
compaction
cultivationcompaction
layer
Figure 43: Example penetration resistances with increasingsoil depth for three different types of soil compaction.
Note all three eventually reach some steady-stateresistance at some soil depth.
steady-statepore volume
59 Dr. Kim D. Coder Warnell School University of Georgia
100%
90
80
70
60
50
40
30
20
10
0
Figure 44: Linear model comparision of relative tree rootpenetration percentages with penetrometer resistance (MPa).
Regression is: y = 35.5 - 43(ln x) r-square = 0.967.
penetration resistance (MPa)[ scale unevenness caused bymathematical transformations ]
relativetree root
penetrationpercent
.22 .45 .55 .67 .80 1.0 1.2 1.5 1.8 2.2 2.7 3.3
60 Dr. Kim D. Coder Warnell School University of Georgia
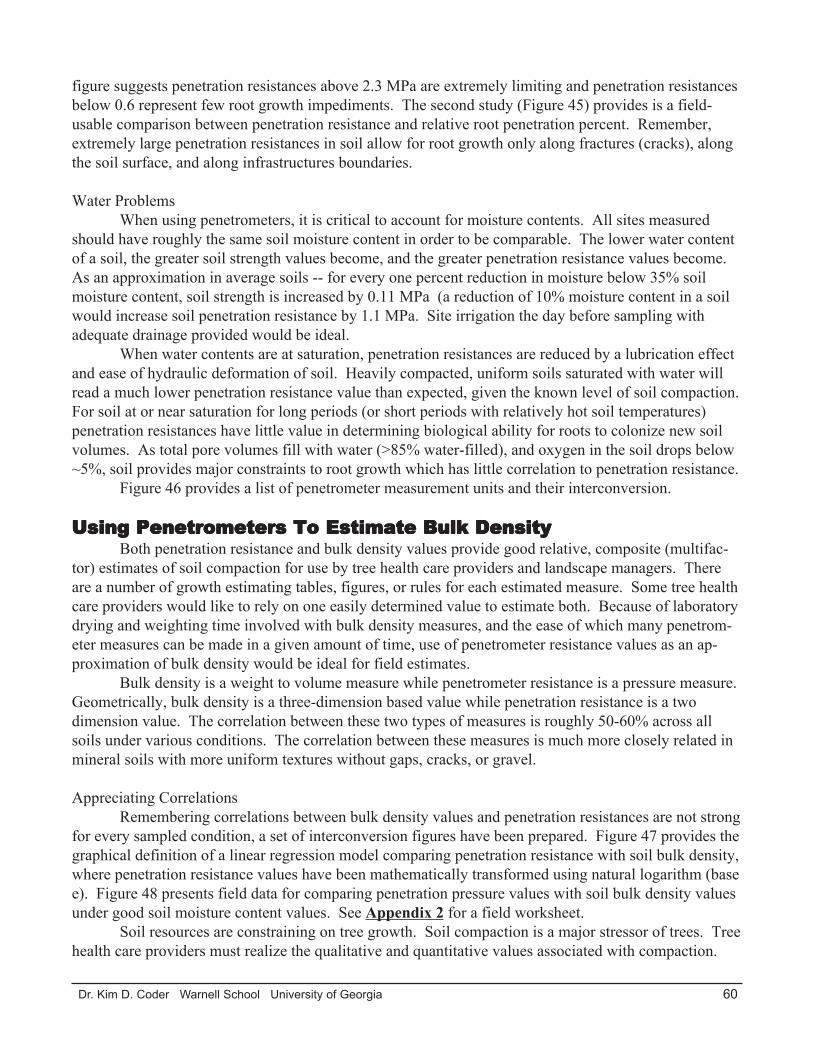
figure suggests penetration resistances above 2.3 MPa are extremely limiting and penetration resistancesbelow 0.6 represent few root growth impediments. The second study (Figure 45) provides is a field-usable comparison between penetration resistance and relative root penetration percent. Remember,extremely large penetration resistances in soil allow for root growth only along fractures (cracks), alongthe soil surface, and along infrastructures boundaries.
Water ProblemsWhen using penetrometers, it is critical to account for moisture contents. All sites measured
should have roughly the same soil moisture content in order to be comparable. The lower water contentof a soil, the greater soil strength values become, and the greater penetration resistance values become.As an approximation in average soils -- for every one percent reduction in moisture below 35% soilmoisture content, soil strength is increased by 0.11 MPa (a reduction of 10% moisture content in a soilwould increase soil penetration resistance by 1.1 MPa. Site irrigation the day before sampling withadequate drainage provided would be ideal.
When water contents are at saturation, penetration resistances are reduced by a lubrication effectand ease of hydraulic deformation of soil. Heavily compacted, uniform soils saturated with water willread a much lower penetration resistance value than expected, given the known level of soil compaction.For soil at or near saturation for long periods (or short periods with relatively hot soil temperatures)penetration resistances have little value in determining biological ability for roots to colonize new soilvolumes. As total pore volumes fill with water (>85% water-filled), and oxygen in the soil drops below~5%, soil provides major constraints to root growth which has little correlation to penetration resistance.
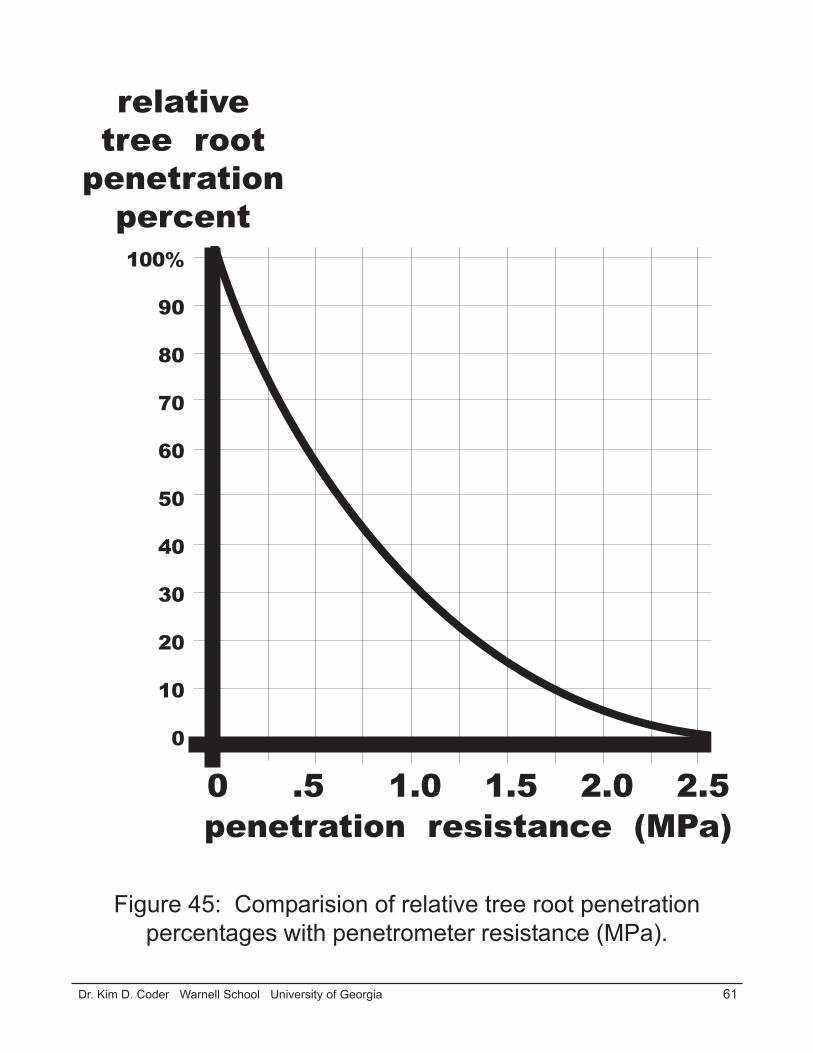
Figure 46 provides a list of penetrometer measurement units and their interconversion.
Using Penetrometers To Estimate Bulk DensityUsing Penetrometers To Estimate Bulk DensityUsing Penetrometers To Estimate Bulk DensityUsing Penetrometers To Estimate Bulk DensityUsing Penetrometers To Estimate Bulk DensityBoth penetration resistance and bulk density values provide good relative, composite (multifac-
tor) estimates of soil compaction for use by tree health care providers and landscape managers. Thereare a number of growth estimating tables, figures, or rules for each estimated measure. Some tree healthcare providers would like to rely on one easily determined value to estimate both. Because of laboratorydrying and weighting time involved with bulk density measures, and the ease of which many penetrom-eter measures can be made in a given amount of time, use of penetrometer resistance values as an ap-proximation of bulk density would be ideal for field estimates.
Bulk density is a weight to volume measure while penetrometer resistance is a pressure measure.Geometrically, bulk density is a three-dimension based value while penetration resistance is a twodimension value. The correlation between these two types of measures is roughly 50-60% across allsoils under various conditions. The correlation between these measures is much more closely related inmineral soils with more uniform textures without gaps, cracks, or gravel.
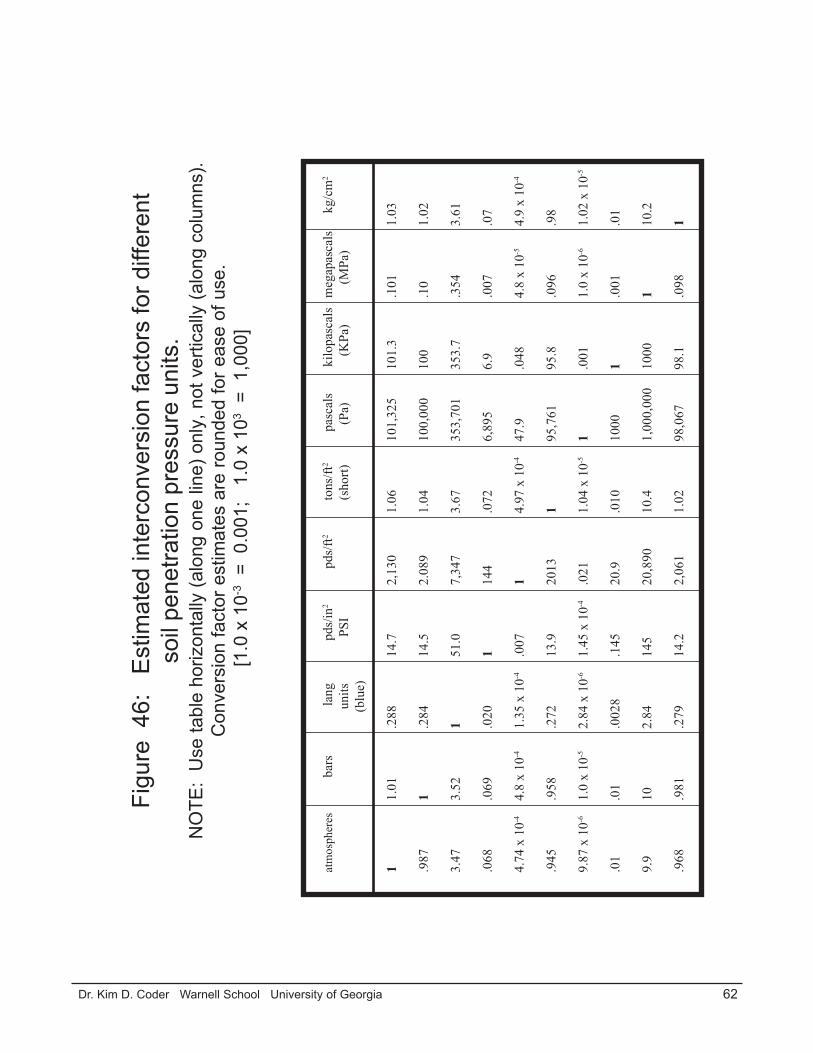
Appreciating CorrelationsRemembering correlations between bulk density values and penetration resistances are not strong
for every sampled condition, a set of interconversion figures have been prepared. Figure 47 provides thegraphical definition of a linear regression model comparing penetration resistance with soil bulk density,where penetration resistance values have been mathematically transformed using natural logarithm (basee). Figure 48 presents field data for comparing penetration pressure values with soil bulk density valuesunder good soil moisture content values. See Appendix 2 for a field worksheet.
Soil resources are constraining on tree growth. Soil compaction is a major stressor of trees. Treehealth care providers must realize the qualitative and quantitative values associated with compaction.
61 Dr. Kim D. Coder Warnell School University of Georgia
100%
90
80
70
60
50
40
30
20
10
0
penetration resistance (MPa)0 .5 1.0 1.5 2.0 2.5
relativetree root
penetrationpercent
Figure 45: Comparision of relative tree root penetrationpercentages with penetrometer resistance (MPa).
62 Dr. Kim D. Coder Warnell School University of Georgia
Figu
re 4
6:
Est
imat
ed in
terc
onve
rsio
n fa
ctor
s fo
r diff
eren
tso
il pe
netra
tion
pres
sure
uni
ts.
NO
TE:
Use
tabl
e ho
rizon
tally
(alo
ng o
ne li
ne) o
nly,
not
ver
tical
ly (a
long
col
umns
).C
onve
rsio
n fa
ctor
est
imat
es a
re ro
unde
d fo
r eas
e of
use
. [1
.0 x
10-3
= 0
.001
; 1
.0 x
103
= 1
,000
]
atm
osph
eres
bar
s
la
ng
pds
/in2
p
ds/ft
2
tons
/ft2
pa
scal
s k
ilopa
scal
sm
egap
asca
ls
kg/
cm2
units
PSI
(s
hort)
(
Pa)
(K
Pa)
(M
Pa)
(
blue
)
11.
01.2
8814
.72,
130
1.06
101,
325
101.
3.1
011.
03
.987
1.2
8414
.52.
089
1.04
100,
000
100
.10
1.02
3.47
3.52
151
.07,
347
3.67
353,
701
353.
7.3
543.
61
.068
.069
.020
114
4.0
726,
895
6.9
.007
.07
4.74
x 1
0-44.
8 x
10-4
1.35
x 1
0-4.0
071
4.97
x 1
0-447
.9.0
484.
8 x
10-5
4.9
x 10
-4
.945
.958
.272
13.9
2013
195
,761
95.8
.096
.98
9.87
x 1
0-61.
0 x
10-5
2.84
x 1
0-61.
45 x
10-4
.021
1.04
x 1
0-51
.001
1.0
x 10
-61.
02 x
10-5
.01
.01
.002
8.1
4520
.9.0
1010
001
.001
.01
9.9
102.
8414
520
,890
10.4
1,00
0,00
010
001
10.2
.968
.981
.279
14.2
2,06
11.
0298
,067
98.1
.098
1
63 Dr. Kim D. Coder Warnell School University of Georgia
2.0
1.8
1.6
1.4
1.2
1.0
0.8
0.6
soil bulkdensity(g/cc)
.03 .08 .14 .22 .34 .60 1.0 1.7 2.7 4.5 5.9 11.4
penetration resistance (MPa)
Figure 47: Linear model comparision of soil bulkdensity (g/cc) with penetrometer resistance (MPa).
Regression is: y = 1.5 + 0.3 (ln x). r-square = 0.97.[ scale unevenness caused by mathematical transformations ]
64 Dr. Kim D. Coder Warnell School University of Georgia
2.0
1.8
1.6
1.4
1.2
1.0
0.8
0.6
0 1.0 2.0 3.0 4.0 5.0
soil bulkdensity(g/cc)
penetration resistance (MPa)
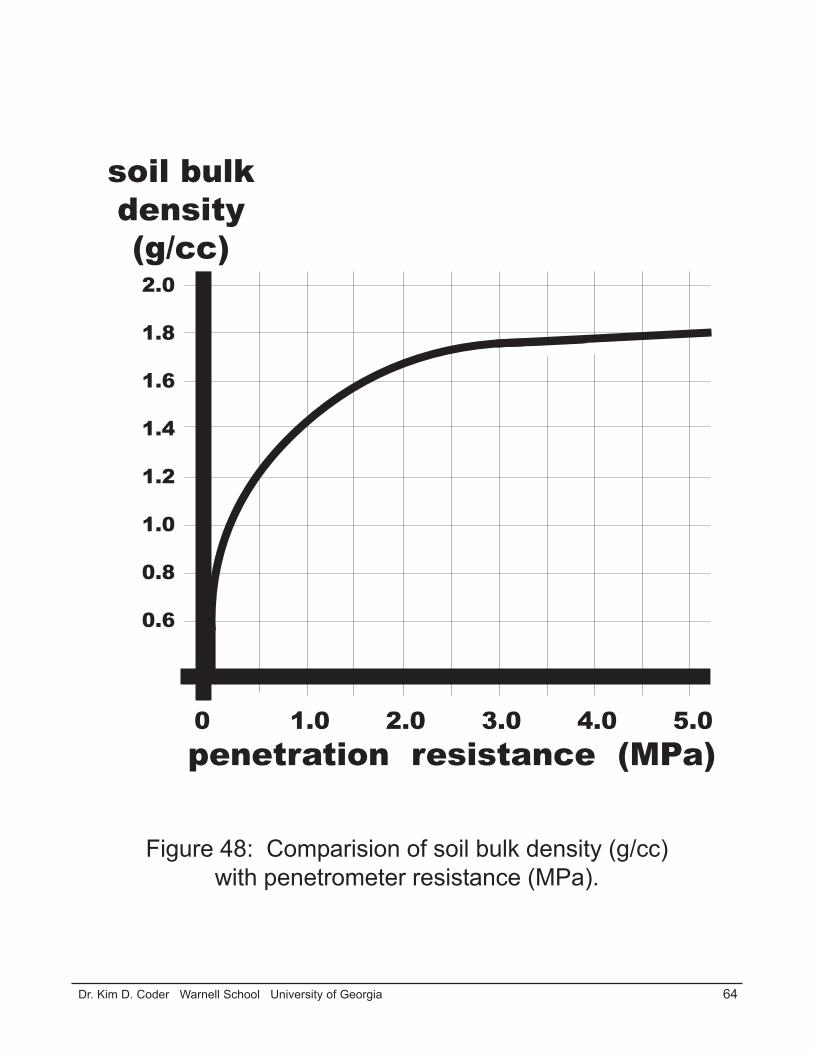
Figure 48: Comparision of soil bulk density (g/cc)with penetrometer resistance (MPa).
65 Dr. Kim D. Coder Warnell School University of Georgia
Using a bulk density sampler or a penetrometer provide a means of more fully appreciating tree growthlimitations.
Tree Impacts & Site RenovationTree Impacts & Site RenovationTree Impacts & Site RenovationTree Impacts & Site RenovationTree Impacts & Site RenovationSoil compaction lingers as an abiding stress on developed sites from which there is no escape by
trees unless tree health care providers actively renovate soil. Soil compaction can quickly limit treereactions under other stress events making them worse. Compaction is not usually visible nor measured,but controls most significant tree resources on a site. Tree health care providers must begin measuringcompaction and making clients aware of severe problems arising from increased soil density. Treesymptoms of compaction come in many forms and severities. A selected number of major tree damag-ing impacts from soil compaction are reviewed here.
Reduced GrowthAs compaction increases, roots are physically prevented from elongating into soil by lack of
oxygen, by decreasing pore size, and by increased soil strength. As roots are put under greater than 1.5MPa of pressure, elongation slows. Trees begin to generate thick, short roots with many more lateralroots as surrounding soil pressure exceeds 1.0 MPa. Oxygen shortages and soil strength increases aremajor limitations to both elongation and radial growth.
Less Resource SpaceWith less colonizable soil volume, there is less physical space to collect resources from and less
resources within that space. With declining respiration processes, energy requiring steps within activeelement uptake processes (i.e. N, P, S) fail. Part of the difficulty in collecting essential resources is abuildup of toxics which pollute any existing essential resource supply.
As roots survive in a steadily diminishing aerobic layer, and as the anaerobic layer expandstoward the soil surface, physical space available for living roots declines. The consequences of havingsmaller volumes of colonizable space at the surface of a soil means tree roots and their resources aresubject to much greater fluctuation in water content, heat loading, and mechanical damage. Drought andheat stress can quickly damage roots in this small shallow layer of oxygenated soil.
Constrained & StuntedCompaction limits depth and reach of tree root systems leading to greater probability of
windthrow and accentuating any structural problems near the stem base / root collar area. Limitingreach of a root system also prevents effective reactions to changes in mechanical loads, and concentratesstress and strain in smaller areas. Micro-site variability in compaction levels and a limited resource baseconstrain young and newly planted trees. It requires less soil density (compaction) and crusting impactsfor failure to occur in new trees compared with older, established trees.
As resources are limited by soil compaction, and more effort is required to seek and colonizeresource volumes, trees are stunted. Disruption of growth regulation produces stunting as auxin / cytoki-nin ratios shift resource allocations and use. In addition, carbohydrate and protein synthesis rates enterdecline cycles interfering with nitrogen and phosphorous uptake, which in-turn disrupts carbohydrateand protein synthesis. The result is a tree with a small living mass, with limited ability to take advantageof any short-term changes in resource availability, and with reduced resistance to other environmentalstresses.

66 Dr. Kim D. Coder Warnell School University of Georgia
Root InjuryThe mechanical forces generated in compacting a soil can crush roots, especially roots less than
1/10 inch diameter. Larger root can be abraded and damaged. Rutting can shear-off roots as soil ispushed to new locations. The amount of crushing is dependent on root size and depth, weight of thecompacting device, organic material, and depth to the saturated layer (for rutting). Figure 49.Life Decline
Soil compaction puts selective pressure against aerobes and favors low oxygen requiring organ-isms, like Pythium and Phytophthera root rots, or anaerobes. Destruction of the detritus energy web,coupled with successional changes, assures renovation of soils to pre-compaction conditions is notpossible. Management must move forward to new solutions for resource availability and deal with newpatterns of pest management, since returning to soil microbiology and rhizosphere of pre-compaction isimpossible.
Renovation PrinciplesTree health care providers and site managers must correct compaction and its limitations on tree
growth. Compaction is “forever,” being reduced by natural processes at such a slow rate (~1% reducedbulk density per six (6) years) as to be unseen in tree health changes. Compaction must be activelyprevented and actively corrected. There are a number of renovation principles to consider when reclaim-ing part of the ecological integrity of a site, as well as soil and tree health.
Principle 1 -- Past soil compaction should be considered a permanent management constraint. Studiesdemonstrate after one-half century, compaction still afflicts soils under natural forest conditions. Recov-ery times for significant compaction is at least three human generations, if no further site impacts occur.Soils do not “come back” from compaction. Soil must be actively renovated.
Principle 2 -- Every soil used by humankind has a representative compacted layer, zone, area, or crust.Changing management may not change the current compacted zone, but may well add an additionalcompacted zone in a new position. A site is a composite of many compaction events over many years,all needing remeadiation.
Principle 3 -- Management activities should concentrate on moving forward to increase aeration spaceand reduce soil strength, rather than trying to recover past ecological history.
Principle 4 -- Estimate soil compaction now as a bench-mark for gauging effectiveness of any treat-ment. Do not suggest compaction problems exist until confirmed by measurements.
Principle 5 -- Measure compaction using any or all resource availability approximations, like bulkdensity, penetration force, oxygen diffusion rates, and tree available water. These are the best proxymeasures we have to understand soil compaction and its impacts on trees. More careful and directmeasures of soil compaction constraints on tree growth are possible but are expensive, time consuming,and difficult to make.
Principle 6 -- Alleviation of soil compaction is part of a good tree and soil health management plan.Any soil renovation is a positive investment in the future.
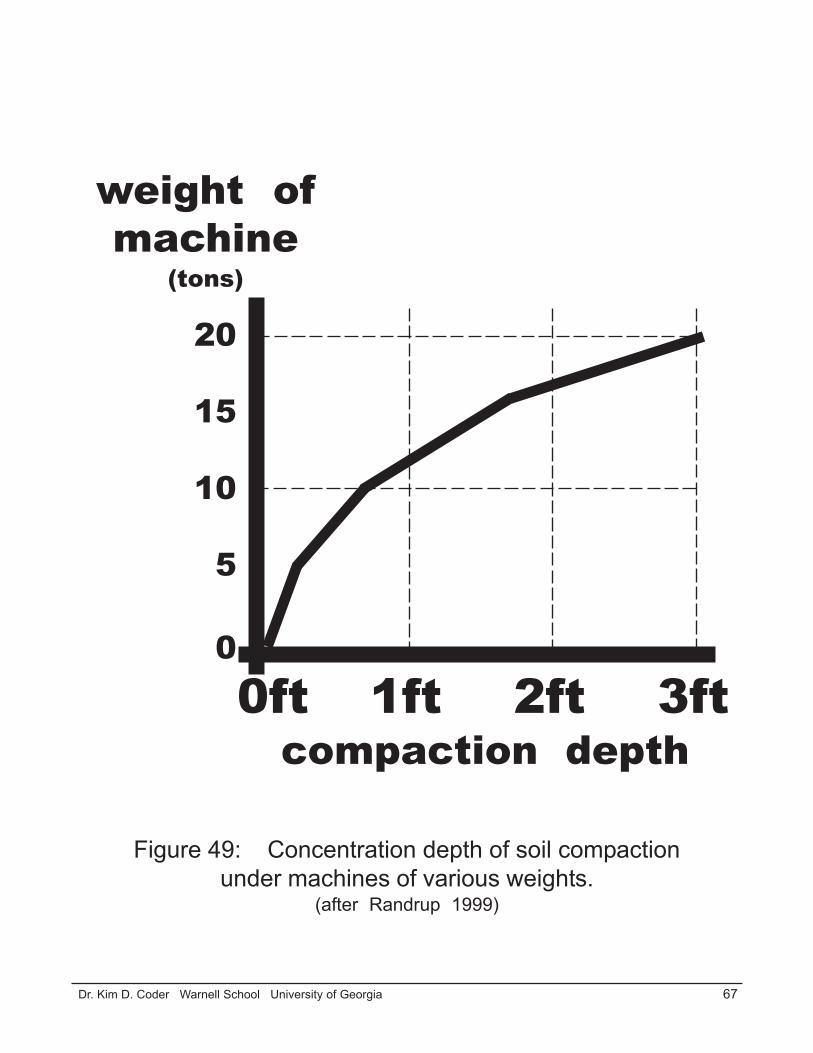
67 Dr. Kim D. Coder Warnell School University of Georgia
20
15
10
5
0 0ft 1ft 2ft 3ft
weight ofmachine
(tons)
compaction depth
Figure 49: Concentration depth of soil compactionunder machines of various weights.
(after Randrup 1999)
68 Dr. Kim D. Coder Warnell School University of Georgia
Principle 7 -- Use extreme caution in water management over and in compacted soils. Compactionprovides little margin of error for drainage, aeration, infiltration, and water holding capacity of treeavailable water. For example, a moist soil may contain a dry tree, or a wet soil may contain a root-suffocated tree under compaction.
Principle 8 -- Optimize tools and site renovation processes which have minimal negative tree biologyimpacts for the greatest soil compaction reduction.
Principle 9 -- Seek assistance of a tree and soil health specialist to avoid tree-illiteracy problems oncompacted soils. Always seek to educate clients about compaction. Awareness of the problem is criticalto initiation and maintenance of a renovation program.
Renovation TechniquesOnce general principles of working with compacted soils are digested, the next requirement in
tree health care is to identify general techniques for renovating compacted soils. These recommenda-tions are generic across many situations and soil types. Specific actions must be crafted for specific sitesand tree situations.
One of the most important decision points in decompacting soil and facilitating tree root health issetting the treatment objective. The two objectives are: 1) remove enough soil volume from compactedsoil to make a significant difference is soil bulk density, fracturing, and soil lightening; or 2) pierce thesoil enough to significantly impact gas exchange with the atmosphere and oxygen diffusion. Selectingeither a soil volume or oxygen diffusion treatment will depend upon soil texture, water saturation condi-tions over time, extent of current compaction, and potential compaction in the future.
Technique 1 -- Restrict site access to the soil surface as soon as possible with fences and fines (legalpenalties). Try to be the first one on-site and setup anti-compaction protection. Prevention is the bestway of minimizing compaction impacts on trees.
Technique 2 -- Defend the ecological “foot print” of a tree rooting area. Select working conditions(dry, dormant season, surface mulch, etc) that minimizes compaction in a tree rooting area. Figure 50.The closer to a tree compaction occurs, the geometrically greater impact of any damage. For example, a20 inch diameter tree (D=20”) has an ecological root print of 80 feet in diameter, a critical root zone of50 feet in diameter, and a structural root zone of 18 feet in diameter.
Technique 3 -- Carefully design tree growth areas or compartments using “biology-first” design pro-cesses rather than the common (and damaging) “aesthetics-first” design processes. Assure well aeratedand drained, ecologically viable space is provided, as well as adequate water supply, under the condi-tions present.
Technique 4 -- Try to soften and distribute any new compaction forces applied by using: 1) temporarycoarse, thick organic mulch, plywood or rubber driving pads; 2) designated non-tree rooting areas asmaterial and vehicle storage / parking; and, 3) develope soil moisture content awareness planning.Restrict and minimize, where possible, any vibrational compaction.
Technique 5 -- Restart or improve the detritus energy web in soil, including addition of compostedorganic matter, living organisms, essential elements in short supply, and water (both supply & drainage).Pursue soil health by changing physical, chemical and biological soil conditions.
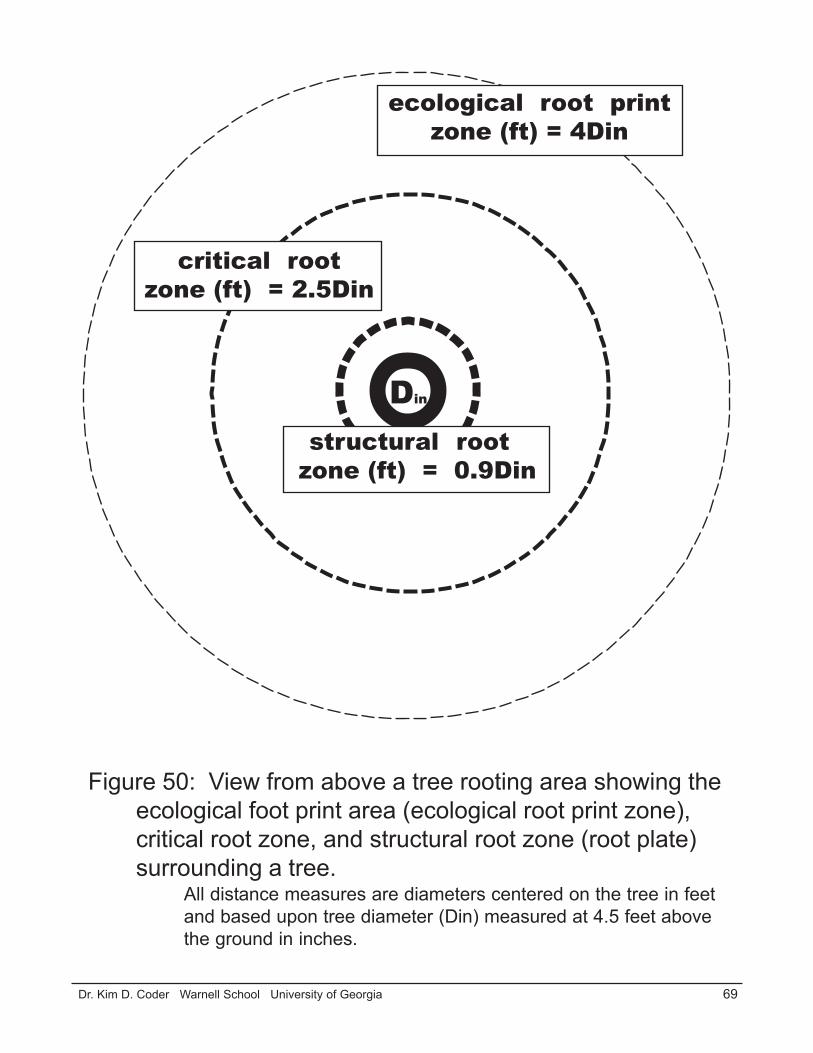
69 Dr. Kim D. Coder Warnell School University of Georgia
Figure 50: View from above a tree rooting area showing theecological foot print area (ecological root print zone),critical root zone, and structural root zone (root plate)surrounding a tree.
All distance measures are diameters centered on the tree in feetand based upon tree diameter (Din) measured at 4.5 feet abovethe ground in inches.
Din
ecological root printzone (ft) = 4Din
critical rootzone (ft) = 2.5Din
structural root zone (ft) = 0.9Din
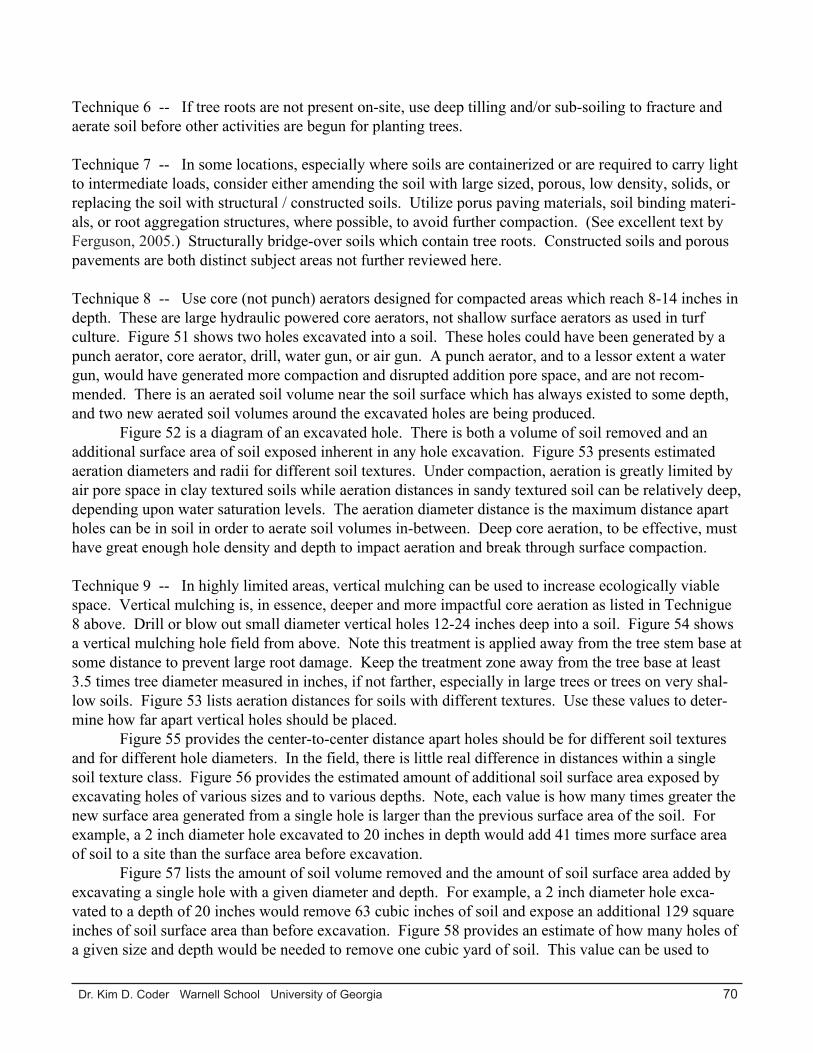
70 Dr. Kim D. Coder Warnell School University of Georgia
Technique 6 -- If tree roots are not present on-site, use deep tilling and/or sub-soiling to fracture andaerate soil before other activities are begun for planting trees.
Technique 7 -- In some locations, especially where soils are containerized or are required to carry lightto intermediate loads, consider either amending the soil with large sized, porous, low density, solids, orreplacing the soil with structural / constructed soils. Utilize porus paving materials, soil binding materi-als, or root aggregation structures, where possible, to avoid further compaction. (See excellent text byFerguson, 2005.) Structurally bridge-over soils which contain tree roots. Constructed soils and porouspavements are both distinct subject areas not further reviewed here.
Technique 8 -- Use core (not punch) aerators designed for compacted areas which reach 8-14 inches indepth. These are large hydraulic powered core aerators, not shallow surface aerators as used in turfculture. Figure 51 shows two holes excavated into a soil. These holes could have been generated by apunch aerator, core aerator, drill, water gun, or air gun. A punch aerator, and to a lessor extent a watergun, would have generated more compaction and disrupted addition pore space, and are not recom-mended. There is an aerated soil volume near the soil surface which has always existed to some depth,and two new aerated soil volumes around the excavated holes are being produced.
Figure 52 is a diagram of an excavated hole. There is both a volume of soil removed and anadditional surface area of soil exposed inherent in any hole excavation. Figure 53 presents estimatedaeration diameters and radii for different soil textures. Under compaction, aeration is greatly limited byair pore space in clay textured soils while aeration distances in sandy textured soil can be relatively deep,depending upon water saturation levels. The aeration diameter distance is the maximum distance apartholes can be in soil in order to aerate soil volumes in-between. Deep core aeration, to be effective, musthave great enough hole density and depth to impact aeration and break through surface compaction.
Technique 9 -- In highly limited areas, vertical mulching can be used to increase ecologically viablespace. Vertical mulching is, in essence, deeper and more impactful core aeration as listed in Technigue8 above. Drill or blow out small diameter vertical holes 12-24 inches deep into a soil. Figure 54 showsa vertical mulching hole field from above. Note this treatment is applied away from the tree stem base atsome distance to prevent large root damage. Keep the treatment zone away from the tree base at least3.5 times tree diameter measured in inches, if not farther, especially in large trees or trees on very shal-low soils. Figure 53 lists aeration distances for soils with different textures. Use these values to deter-mine how far apart vertical holes should be placed.
Figure 55 provides the center-to-center distance apart holes should be for different soil texturesand for different hole diameters. In the field, there is little real difference in distances within a singlesoil texture class. Figure 56 provides the estimated amount of additional soil surface area exposed byexcavating holes of various sizes and to various depths. Note, each value is how many times greater thenew surface area generated from a single hole is larger than the previous surface area of the soil. Forexample, a 2 inch diameter hole excavated to 20 inches in depth would add 41 times more surface areaof soil to a site than the surface area before excavation.
Figure 57 lists the amount of soil volume removed and the amount of soil surface area added byexcavating a single hole with a given diameter and depth. For example, a 2 inch diameter hole exca-vated to a depth of 20 inches would remove 63 cubic inches of soil and expose an additional 129 squareinches of soil surface area than before excavation. Figure 58 provides an estimate of how many holes ofa given size and depth would be needed to remove one cubic yard of soil. This value can be used to
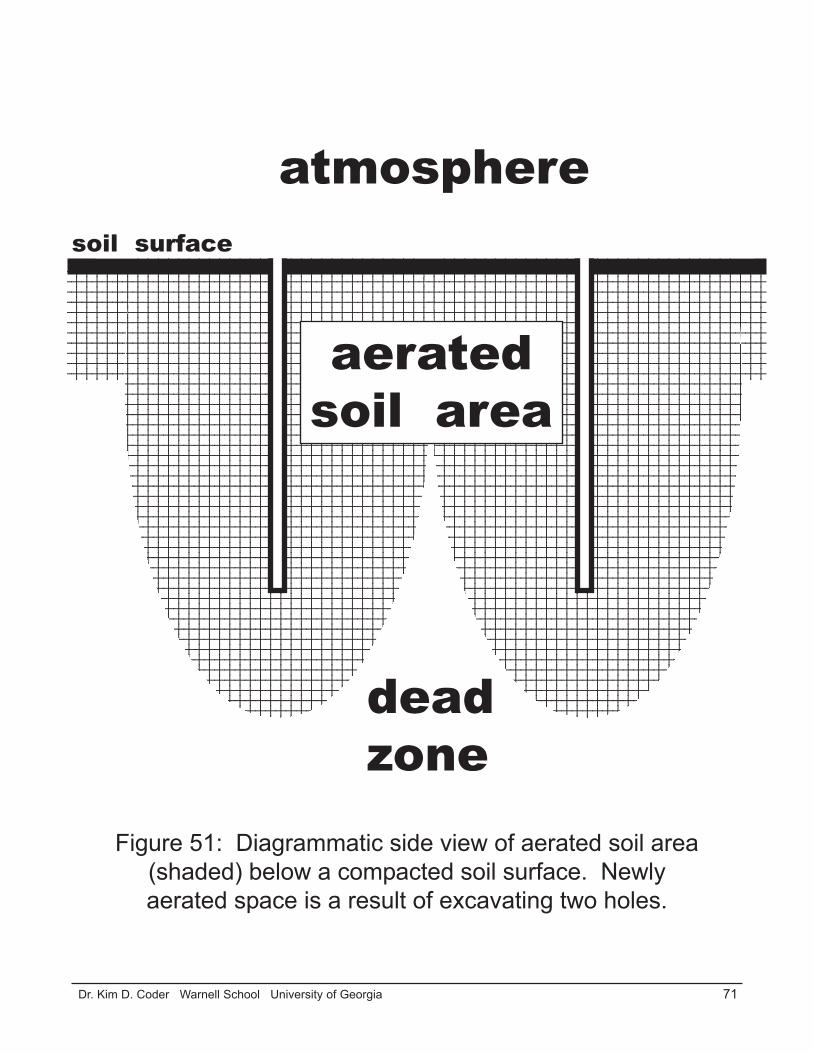
71 Dr. Kim D. Coder Warnell School University of Georgia
123456789012345678901234567890121234567890123456789012345678901212345123456789012345678901234567890121234567890123456789012345678901212345123456789012345678901234567890121234567890123456789012345678901212345123456789012345678901234567890121234567890123456789012345678901212345123456789012345678901234567890121234567890123456789012345678901212345123456789012345678901234567890121234567890123456789012345678901212345123456789012345678901234567890121234567890123456789012345678901212345123456789012345678901234567890121234567890123456789012345678901212345123456789012345678901234567890121234567890123456789012345678901212345123456789012345678901234567890121234567890123456789012345678901212345123456789012345678901234567890121234567890123456789012345678901212345123456789012345678901234567890121234567890123456789012345678901212345
1234567890123456789012345678901123456789012345678901234567890112345678901234567890123456789011234567890123456789012345678901123456789012345678901234567890112345678901234567890123456789011234567890123456789012345678901123456789012345678901234567890112345678901234567890123456789011234567890123456789012345678901123456789012345678901234567890112345678901234567890123456789011234567890123456789012345678901123456789012345678901234567890112345678901234567890123456789011234567890123456789012345678901123456789012345678901234567890112345678901234567890123456789011234567890123456789012345678901123456789012345678901234567890112345678901234567890123456789011234567890123456789012345678901123456789012345678901234567890112345678901234567890123456789011234567890123456789012345678901123456789012345678901234567890112345678901234567890123456789011234567890123456789012345678901123456789012345678901234567890112345678901234567890123456789011234567890123456789012345678901123456789012345678901234567890112345678901234567890123456789011234567890123456789012345678901123456789012345678901234567890112345678901234567890123456789011234567890123456789012345678901123456789012345678901234567890112345678901234567890123456789011234567890123456789012345678901123456789012345678901234567890112345678901234567890123456789011234567890123456789012345678901123456789012345678901234567890112345678901234567890123456789011234567890123456789012345678901123456789012345678901234567890112345678901234567890123456789011234567890123456789012345678901123456789012345678901234567890112345678901234567890123456789011234567890123456789012345678901123456789012345678901234567890112345678901234567890123456789011234567890123456789012345678901123456789012345678901234567890112345678901234567890123456789011234567890123456789012345678901123456789012345678901234567890112345678901234567890123456789011234567890123456789012345678901123456789012345678901234567890112345678901234567890123456789011234567890123456789012345678901123456789012345678901234567890112345678901234567890123456789011234567890123456789012345678901
1234567890123456789012345678901123456789012345678901234567890112345678901234567890123456789011234567890123456789012345678901123456789012345678901234567890112345678901234567890123456789011234567890123456789012345678901123456789012345678901234567890112345678901234567890123456789011234567890123456789012345678901123456789012345678901234567890112345678901234567890123456789011234567890123456789012345678901123456789012345678901234567890112345678901234567890123456789011234567890123456789012345678901123456789012345678901234567890112345678901234567890123456789011234567890123456789012345678901123456789012345678901234567890112345678901234567890123456789011234567890123456789012345678901123456789012345678901234567890112345678901234567890123456789011234567890123456789012345678901123456789012345678901234567890112345678901234567890123456789011234567890123456789012345678901123456789012345678901234567890112345678901234567890123456789011234567890123456789012345678901123456789012345678901234567890112345678901234567890123456789011234567890123456789012345678901123456789012345678901234567890112345678901234567890123456789011234567890123456789012345678901123456789012345678901234567890112345678901234567890123456789011234567890123456789012345678901123456789012345678901234567890112345678901234567890123456789011234567890123456789012345678901123456789012345678901234567890112345678901234567890123456789011234567890123456789012345678901123456789012345678901234567890112345678901234567890123456789011234567890123456789012345678901123456789012345678901234567890112345678901234567890123456789011234567890123456789012345678901123456789012345678901234567890112345678901234567890123456789011234567890123456789012345678901123456789012345678901234567890112345678901234567890123456789011234567890123456789012345678901123456789012345678901234567890112345678901234567890123456789011234567890123456789012345678901123456789012345678901234567890112345678901234567890123456789011234567890123456789012345678901123456789012345678901234567890112345678901234567890123456789011234567890123456789012345678901
soil surface
Figure 51: Diagrammatic side view of aerated soil area(shaded) below a compacted soil surface. Newlyaerated space is a result of excavating two holes.
aeratedsoil area
atmosphere
deadzone

72 Dr. Kim D. Coder Warnell School University of Georgia
Figure 52: Diagrammatic definition of a round verticalexcavated hole in soil. Volume of the hole is a right cylinder
volume. Surface area of the hole is a right cylindersurface area minus the area of the hole top.
hole
dep
th
holeradius
holediameter
soil surface
holebottom
hole top
hole
sid
e
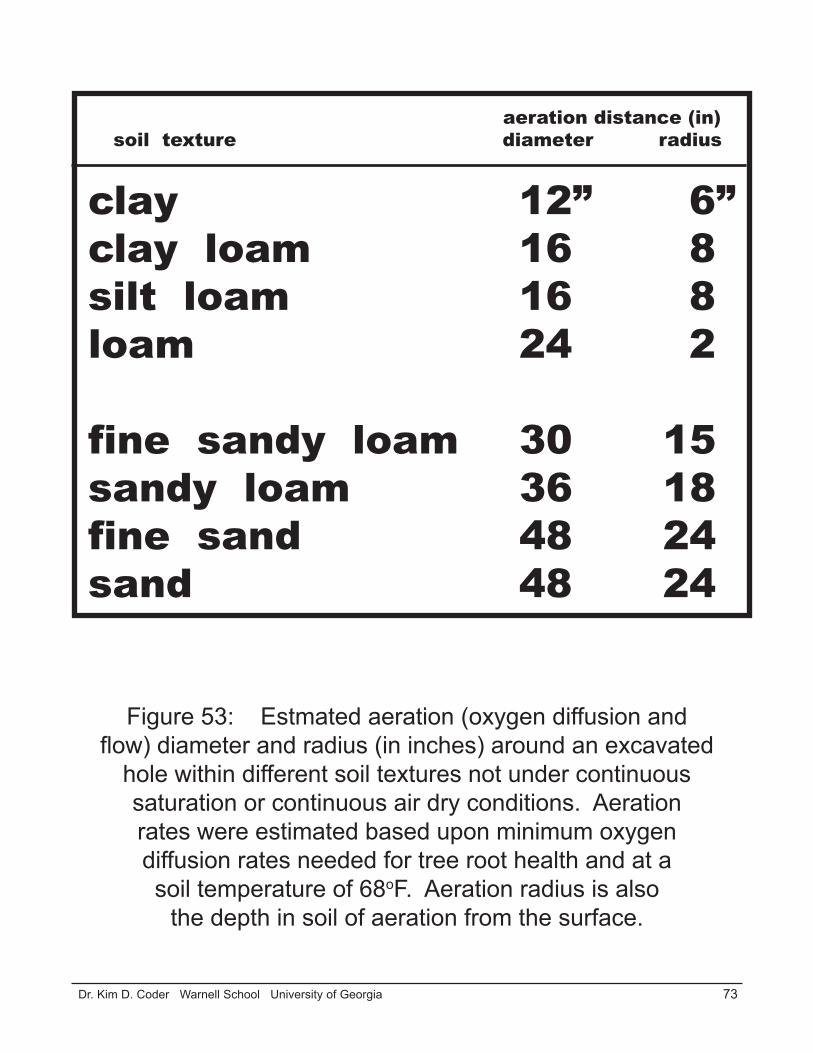
73 Dr. Kim D. Coder Warnell School University of Georgia
Figure 53: Estmated aeration (oxygen diffusion andflow) diameter and radius (in inches) around an excavated
hole within different soil textures not under continuoussaturation or continuous air dry conditions. Aerationrates were estimated based upon minimum oxygendiffusion rates needed for tree root health and at asoil temperature of 68oF. Aeration radius is also
the depth in soil of aeration from the surface.
aeration distance (in) soil texture diameter radius
clay 12” 6”clay loam 16 8silt loam 16 8loam 24 2
fine sandy loam 30 15sandy loam 36 18fine sand 48 24sand 48 24
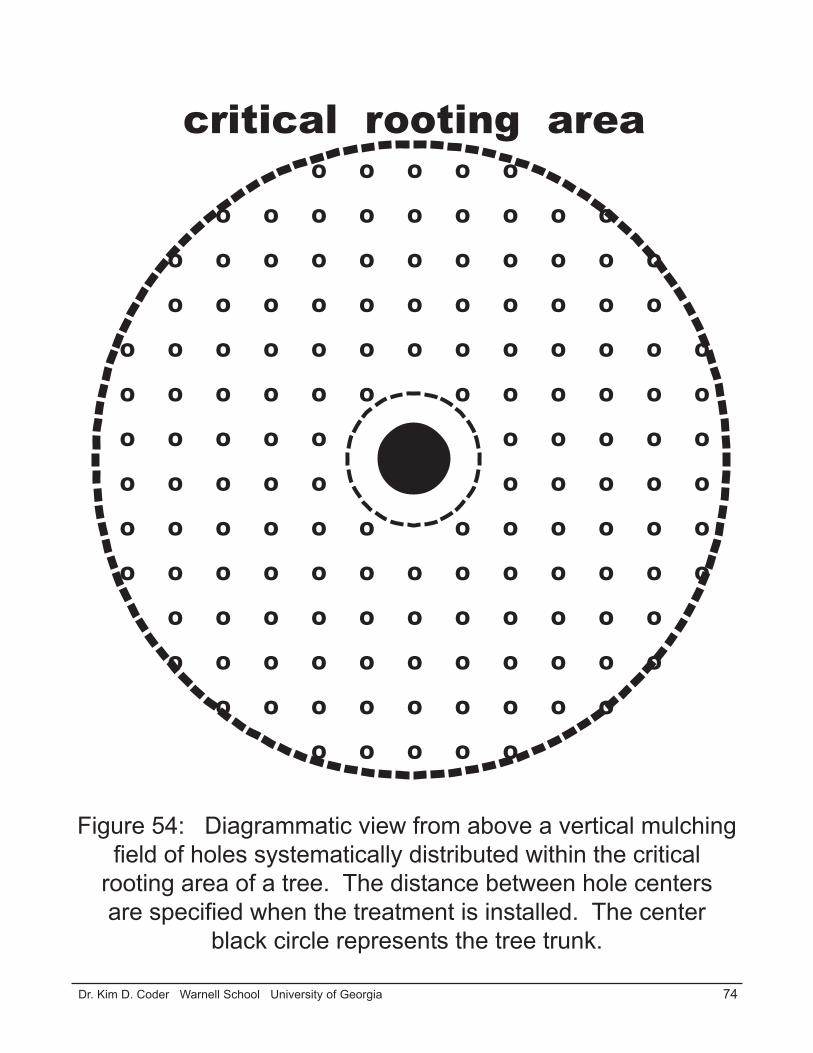
74 Dr. Kim D. Coder Warnell School University of Georgia
critical rooting area
Figure 54: Diagrammatic view from above a vertical mulchingfield of holes systematically distributed within the critical
rooting area of a tree. The distance between hole centersare specified when the treatment is installed. The center
black circle represents the tree trunk.
O O O O O
O O O O O O O O O
O O O O O O O O O O O
O O O O O O O O O O O
O O O O O O O O O O O O O
O O O O O O O O O O O O
O O O O O O O O O O O
O O O O O O O O O O O
O O O O O O O O O O O O
O O O O O O O O O O O O O
O O O O O O O O O O O
O O O O O O O O O O O
O O O O O O O O O
O O O O O
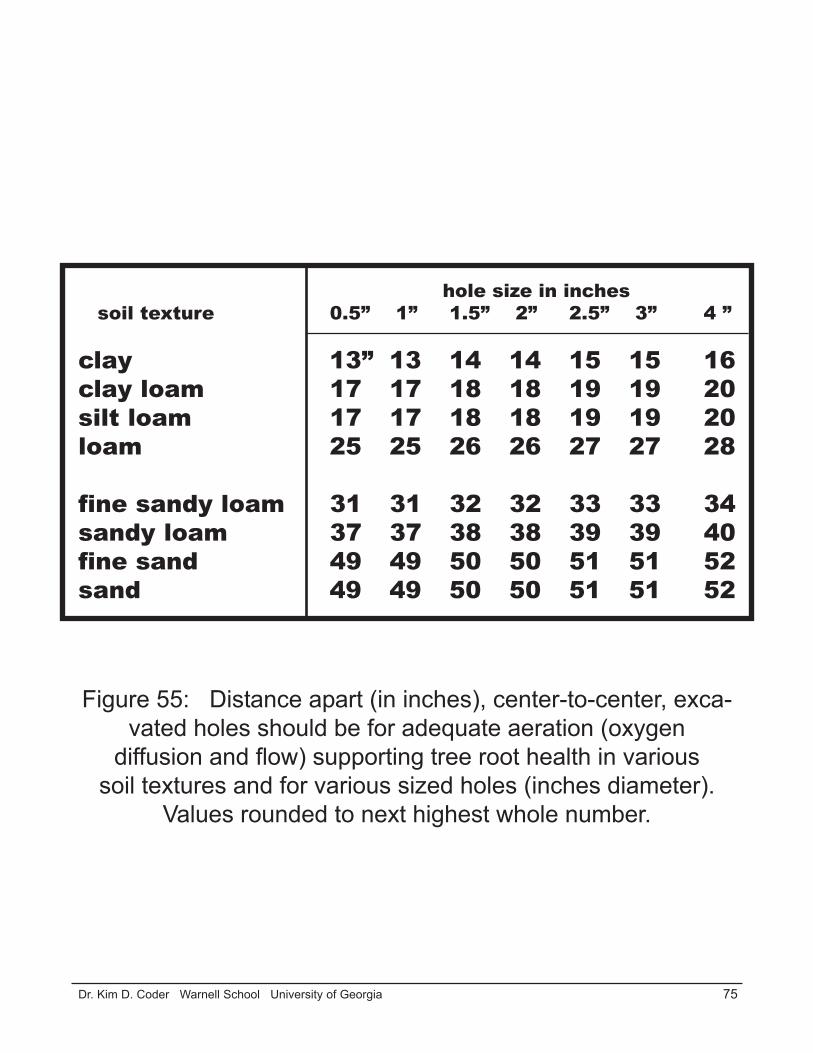
75 Dr. Kim D. Coder Warnell School University of Georgia
hole size in inches soil texture 0.5” 1” 1.5” 2” 2.5” 3” 4 ”
clay 13” 13 14 14 15 15 16clay loam 17 17 18 18 19 19 20silt loam 17 17 18 18 19 19 20loam 25 25 26 26 27 27 28
fine sandy loam 31 31 32 32 33 33 34sandy loam 37 37 38 38 39 39 40fine sand 49 49 50 50 51 51 52sand 49 49 50 50 51 51 52
Figure 55: Distance apart (in inches), center-to-center, exca-vated holes should be for adequate aeration (oxygen
diffusion and flow) supporting tree root health in varioussoil textures and for various sized holes (inches diameter).
Values rounded to next highest whole number.
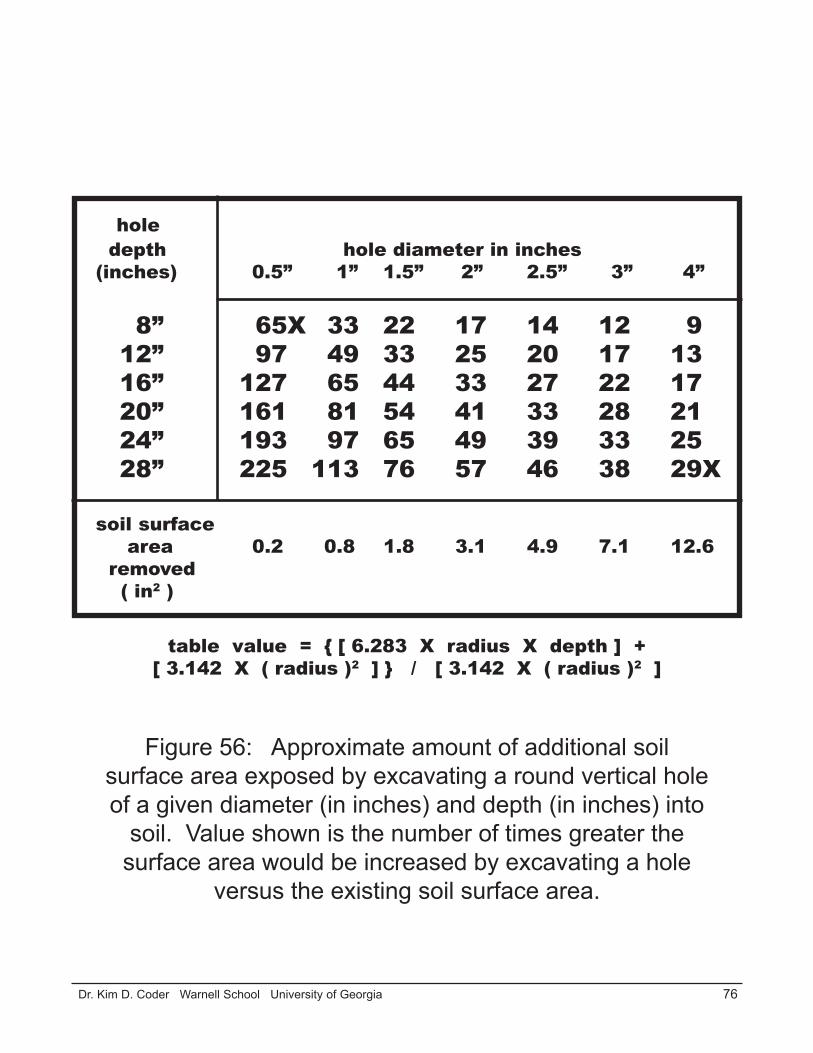
76 Dr. Kim D. Coder Warnell School University of Georgia
Figure 56: Approximate amount of additional soilsurface area exposed by excavating a round vertical holeof a given diameter (in inches) and depth (in inches) into
soil. Value shown is the number of times greater thesurface area would be increased by excavating a hole
versus the existing soil surface area.
hole depth hole diameter in inches(inches) 0.5” 1” 1.5” 2” 2.5” 3” 4”
8” 65X 33 22 17 14 12 9 12” 97 49 33 25 20 17 13 16” 127 65 44 33 27 22 17 20” 161 81 54 41 33 28 21 24” 193 97 65 49 39 33 25 28” 225 113 76 57 46 38 29X
soil surface area 0.2 0.8 1.8 3.1 4.9 7.1 12.6 removed ( in2 )
table value = { [ 6.283 X radius X depth ] +[ 3.142 X ( radius )2 ] } / [ 3.142 X ( radius )2 ]

77 Dr. Kim D. Coder Warnell School University of Georgia
hole depth diameter of hole in inches(inches) 0.5” 1” 1.5” 2” 2.5” 3” 4”
8” 1.6 in3 6.3 14 25 39 57 10113 in2 26 40 53 68 83 113
12” 2.4 9.4 21 38 59 85 15119 39 58 79 99 120 163
16” 3.1 13 28 50 79 113 20125 51 77 104 131 158 214
20” 3.9 16 35 63 98 141 25132 64 96 129 162 196 264
24” 4.7 19 42 75 118 170 30238 76 115 154 193 233 314
28” 5.5 22 50 88 137 198 35244 89 134 179 225 271 364
upper table value =[ 3.142 X ( radius )2 X depth ] = volume in cubic inches
lower table value = [ 6.283 X radius X depth ] + [ 3.142 X ( radius )2 ] =
surface area in square feet
Figure 57: Approximate open volume (upper value incubic inches) and increased surface area of soil (lowervalue in square inches) exposed by excavating a round
vertical hole of a given diameter (in inches) anddepth (in inches) into soil.
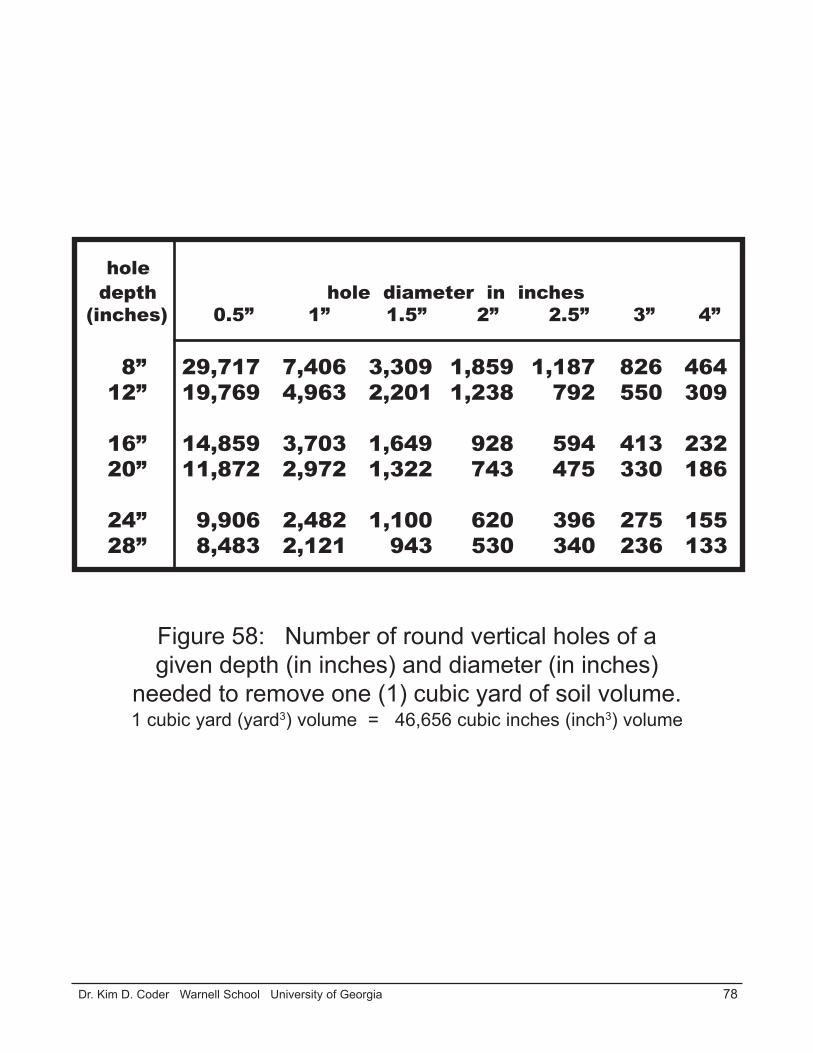
78 Dr. Kim D. Coder Warnell School University of Georgia
Figure 58: Number of round vertical holes of agiven depth (in inches) and diameter (in inches)
needed to remove one (1) cubic yard of soil volume.1 cubic yard (yard3) volume = 46,656 cubic inches (inch3) volume
hole depth hole diameter in inches(inches) 0.5” 1” 1.5” 2” 2.5” 3” 4”
8” 29,717 7,406 3,309 1,859 1,187 826 464 12” 19,769 4,963 2,201 1,238 792 550 309
16” 14,859 3,703 1,649 928 594 413 232 20” 11,872 2,972 1,322 743 475 330 186
24” 9,906 2,482 1,100 620 396 275 155 28” 8,483 2,121 943 530 340 236 133
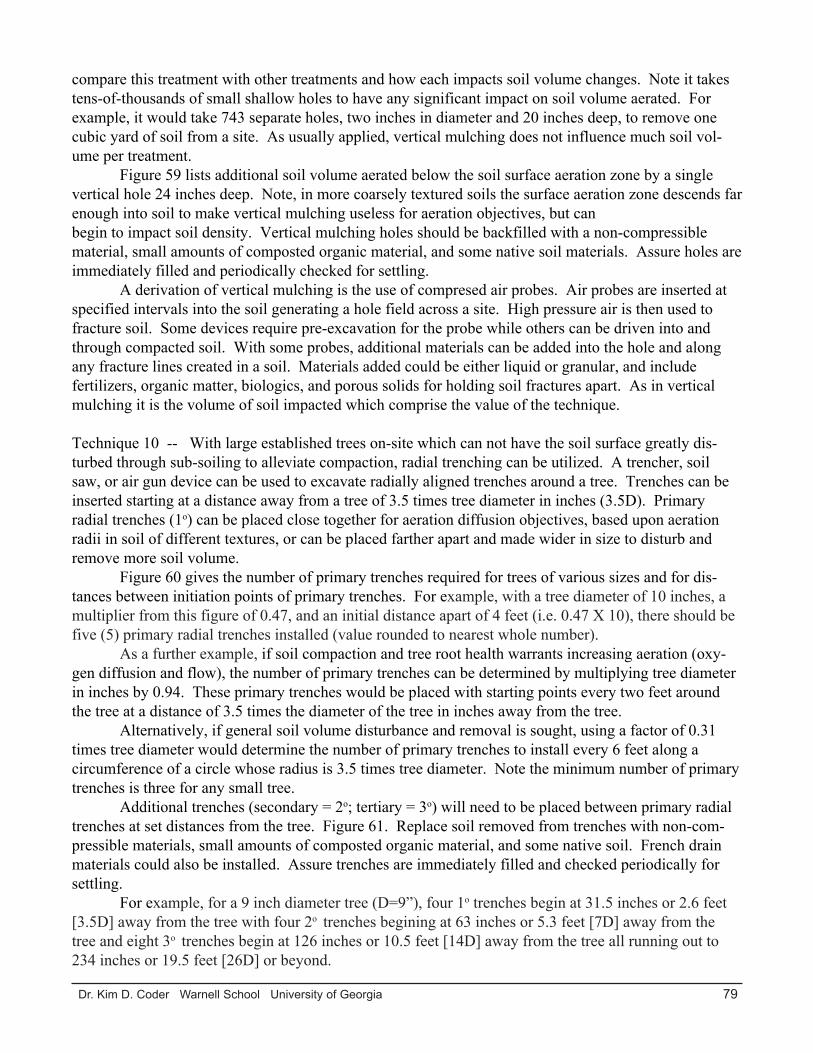
79 Dr. Kim D. Coder Warnell School University of Georgia
compare this treatment with other treatments and how each impacts soil volume changes. Note it takestens-of-thousands of small shallow holes to have any significant impact on soil volume aerated. Forexample, it would take 743 separate holes, two inches in diameter and 20 inches deep, to remove onecubic yard of soil from a site. As usually applied, vertical mulching does not influence much soil vol-ume per treatment.
Figure 59 lists additional soil volume aerated below the soil surface aeration zone by a singlevertical hole 24 inches deep. Note, in more coarsely textured soils the surface aeration zone descends farenough into soil to make vertical mulching useless for aeration objectives, but canbegin to impact soil density. Vertical mulching holes should be backfilled with a non-compressiblematerial, small amounts of composted organic material, and some native soil materials. Assure holes areimmediately filled and periodically checked for settling.
A derivation of vertical mulching is the use of compresed air probes. Air probes are inserted atspecified intervals into the soil generating a hole field across a site. High pressure air is then used tofracture soil. Some devices require pre-excavation for the probe while others can be driven into andthrough compacted soil. With some probes, additional materials can be added into the hole and alongany fracture lines created in a soil. Materials added could be either liquid or granular, and includefertilizers, organic matter, biologics, and porous solids for holding soil fractures apart. As in verticalmulching it is the volume of soil impacted which comprise the value of the technique.
Technique 10 -- With large established trees on-site which can not have the soil surface greatly dis-turbed through sub-soiling to alleviate compaction, radial trenching can be utilized. A trencher, soilsaw, or air gun device can be used to excavate radially aligned trenches around a tree. Trenches can beinserted starting at a distance away from a tree of 3.5 times tree diameter in inches (3.5D). Primaryradial trenches (1o) can be placed close together for aeration diffusion objectives, based upon aerationradii in soil of different textures, or can be placed farther apart and made wider in size to disturb andremove more soil volume.
Figure 60 gives the number of primary trenches required for trees of various sizes and for dis-tances between initiation points of primary trenches. For example, with a tree diameter of 10 inches, amultiplier from this figure of 0.47, and an initial distance apart of 4 feet (i.e. 0.47 X 10), there should befive (5) primary radial trenches installed (value rounded to nearest whole number).
As a further example, if soil compaction and tree root health warrants increasing aeration (oxy-gen diffusion and flow), the number of primary trenches can be determined by multiplying tree diameterin inches by 0.94. These primary trenches would be placed with starting points every two feet aroundthe tree at a distance of 3.5 times the diameter of the tree in inches away from the tree.
Alternatively, if general soil volume disturbance and removal is sought, using a factor of 0.31times tree diameter would determine the number of primary trenches to install every 6 feet along acircumference of a circle whose radius is 3.5 times tree diameter. Note the minimum number of primarytrenches is three for any small tree.
Additional trenches (secondary = 2o; tertiary = 3o) will need to be placed between primary radialtrenches at set distances from the tree. Figure 61. Replace soil removed from trenches with non-com-pressible materials, small amounts of composted organic material, and some native soil. French drainmaterials could also be installed. Assure trenches are immediately filled and checked periodically forsettling.
For example, for a 9 inch diameter tree (D=9”), four 1o trenches begin at 31.5 inches or 2.6 feet[3.5D] away from the tree with four 2o trenches begining at 63 inches or 5.3 feet [7D] away from thetree and eight 3o trenches begin at 126 inches or 10.5 feet [14D] away from the tree all running out to234 inches or 19.5 feet [26D] or beyond.
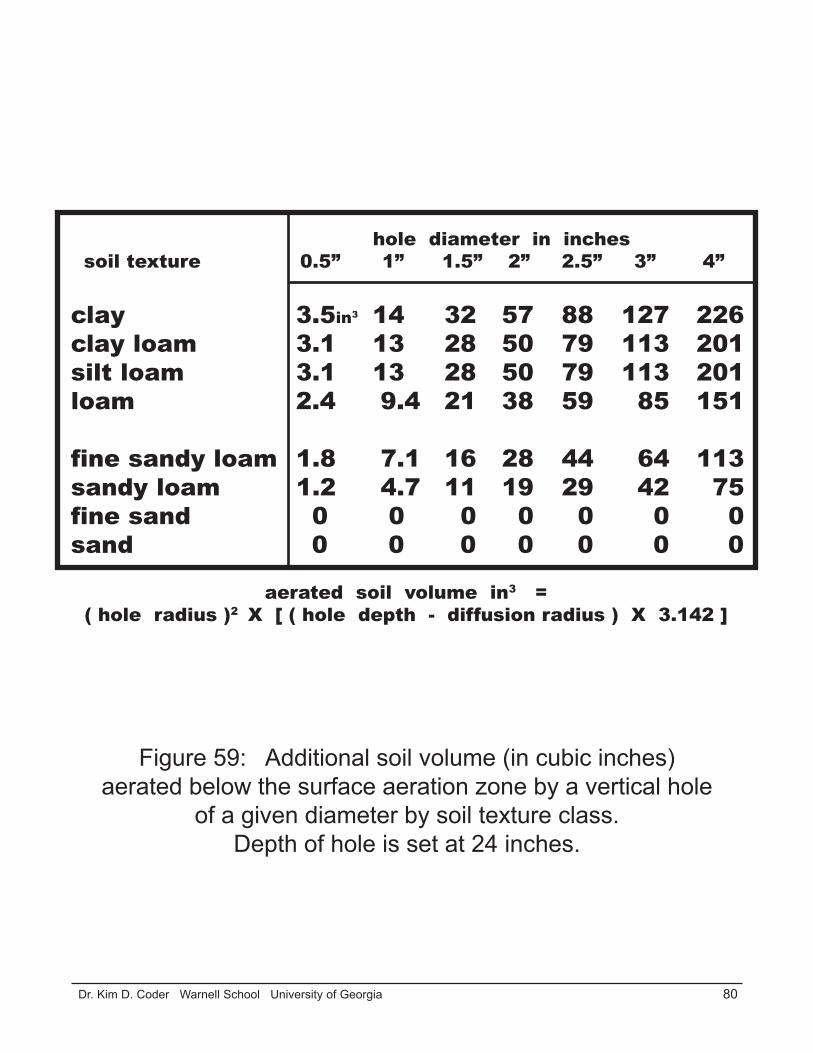
80 Dr. Kim D. Coder Warnell School University of Georgia
Figure 59: Additional soil volume (in cubic inches)aerated below the surface aeration zone by a vertical hole
of a given diameter by soil texture class.Depth of hole is set at 24 inches.
hole diameter in inches soil texture 0.5” 1” 1.5” 2” 2.5” 3” 4”
clay 3.5in3 14 32 57 88 127 226clay loam 3.1 13 28 50 79 113 201silt loam 3.1 13 28 50 79 113 201loam 2.4 9.4 21 38 59 85 151
fine sandy loam 1.8 7.1 16 28 44 64 113sandy loam 1.2 4.7 11 19 29 42 75fine sand 0 0 0 0 0 0 0sand 0 0 0 0 0 0 0
aerated soil volume in3 =( hole radius )2 X [ ( hole depth - diffusion radius ) X 3.142 ]
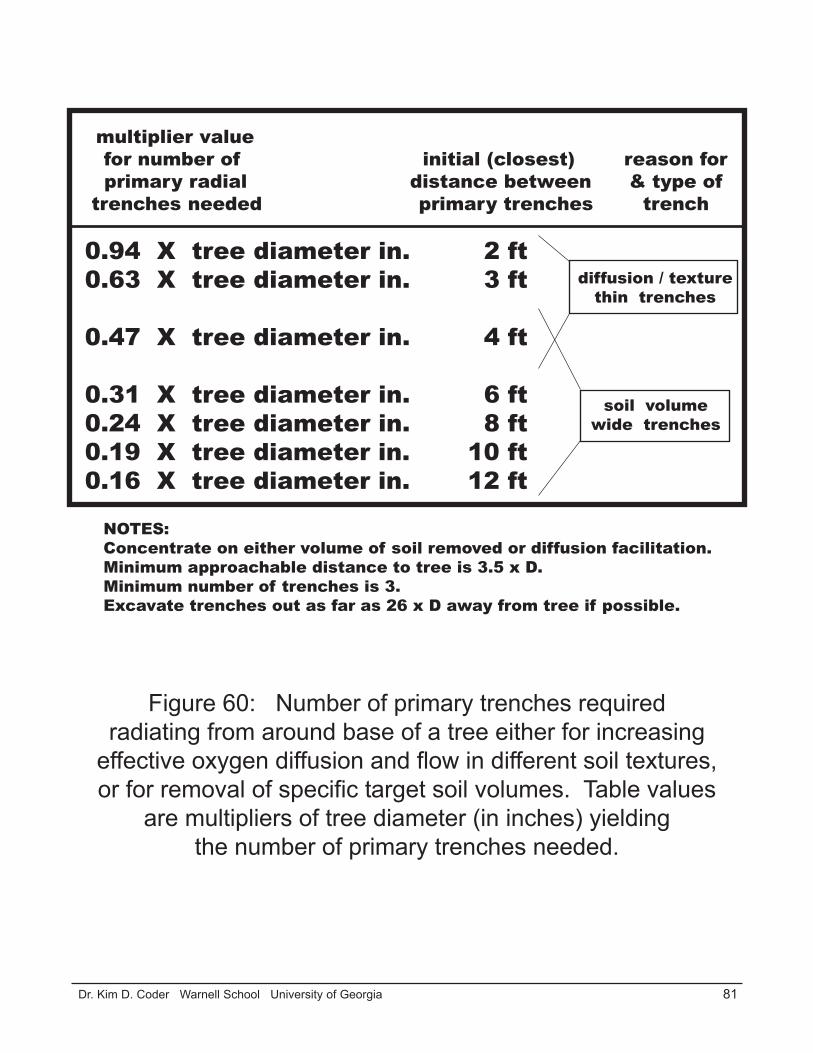
81 Dr. Kim D. Coder Warnell School University of Georgia
Figure 60: Number of primary trenches requiredradiating from around base of a tree either for increasing
effective oxygen diffusion and flow in different soil textures,or for removal of specific target soil volumes. Table values
are multipliers of tree diameter (in inches) yieldingthe number of primary trenches needed.
multiplier value for number of initial (closest) reason for primary radial distance between & type of trenches needed primary trenches trench
0.94 X tree diameter in. 2 ft0.63 X tree diameter in. 3 ft
0.47 X tree diameter in. 4 ft
0.31 X tree diameter in. 6 ft0.24 X tree diameter in. 8 ft0.19 X tree diameter in. 10 ft0.16 X tree diameter in. 12 ft
diffusion / texturethin trenches
soil volumewide trenches
NOTES:Concentrate on either volume of soil removed or diffusion facilitation.Minimum approachable distance to tree is 3.5 x D.Minimum number of trenches is 3.Excavate trenches out as far as 26 x D away from tree if possible.
82 Dr. Kim D. Coder Warnell School University of Georgia
Figure 61: View from above a tree rooting area showingdistances away from a tree where primary (1o),
secondary (2o), and tertiary (3o) radial trenches begin.All distance measures are multipliers of tree diameter (D in inches at 4.5 feet
above the ground) yielding the distance in inches away from tree.
1o
1o 1o
1o
2o3o
2o
2o
2o
3o
3o
3o
3o
3o3o
3o
14 x D
7 x D 3.5 x D
26 x Dradial trench line

83 Dr. Kim D. Coder Warnell School University of Georgia
Figure 62 shows the estimated volume in cubic inches and the surface area in square inchesgenerated along each linear foot of trench for a given width and depth. For example, a trench exca-vated 4 inches wide and 3 feet deep would generate 1,728 cubic inches of soil volume removed andreplaced, and 1,200 square inches of soil surface area exposed, per linear foot of trench. The amountof soil influenced by radial trenching is much greater than in vertical mulchng.
Technique 11 -- Use soft excavation techniques like air guns to cultivate (stir-up) soil in selectedareas under a tree over several months or growing seasons (i.e. Bartlett renovation technique). Thesoil area for treatment can be divided into subdivisions and each segment eventually treated down to6-12 inches of depth. Soil moisture content and level of compaction is critical for effective cultiva-tion.
Figure 63 shows the critical rooting area of a tree divided into eight equal areas with everyother area treated this year and the remaining areas treated the following year for a 50% area per yeartreatment process. Figure 64 shows the critical rooting area of a tree from above divided into 12equal areas with every third area treated this year and each neighboring area to the left (counter-clockwise in this example) treated in year two, and the remaining areas treated in year three, for a33% area per year treatment process. Immediately after cultivation, watering is essential.
Figure 65 provides an estimate of how many square feet of the pretreatment soil surface areawould be impacted in any one year for various sized trees. This figure lists 100%, 50%, 33%, and25% treatment intensity. For example, a 40 inch diameter tree would have 3,927 square feet of soilsurface beneath its canopy treated each year for two years (50% of the area treated per year.)
Figure 66 shows the volume of soil decompacted beneath every square foot of a treatmentarea for a variety of soil depths. For example, if the decompaction treatment depth was 8 inches,then 1,152 cubic inches (0.67 cubic feet) of soil is influenced for every square foot treated. Deepdecompaction treatments using soft excavation techniques become progressively more difficult andvariable in application below 8 inches. Composted organic matter and other soil and growth materi-als can be incorporated during this operation. Note this technique greatly exceeds the soil impactvolume of radial trenching.
Technique 12 -- As seen is the previuos techniques, increasing depth of aeration and volume of soilimpacted are key elements in successful compaction renovation. For extremely compacted soilswhere air gun decompaction is inadequate and complete soil removal is not warranted, a moreinvasive process can be used. Micro-slits or mini-trenches can be excavated deeply (>24 inches) in athin radial line away from the trunk base with a soil saw or thin-kerf trencher (mini-trencher) in largetreatment fields around a tree (i.e. Coder renovation technique).
Figure 67 shows micro-slits installed in four wedge shaped areas around a tree. These treat-ment segements or wedges do not begin until the distance from the tree is 3.5 times tree diameter ininches (3.5D). This technique is designed for extreme compaction and does have potential to signifi-cantly increase root damage and tree structural failures. The trade-off between biology and biome-chanics must be evaluated. Micro-slits begin at 3.5D distance and slit number are increased at 6Dand 10D distances away from a tree. The micro-slits should be installed out to at least a distance of15D from a tree.
Micro-slits must be inserted deep into soil for best effect and placed close together. Figure68. For example, if a tree diameter is 35 inches and is growing in heavily compacted clay soil, themicro-slit number per treatment segement is “5+4+6.” The first number (5) denotes five micro-slitsare started at the 3.5D distance and run radially out to at least the 15D distance. At the 6D distance,
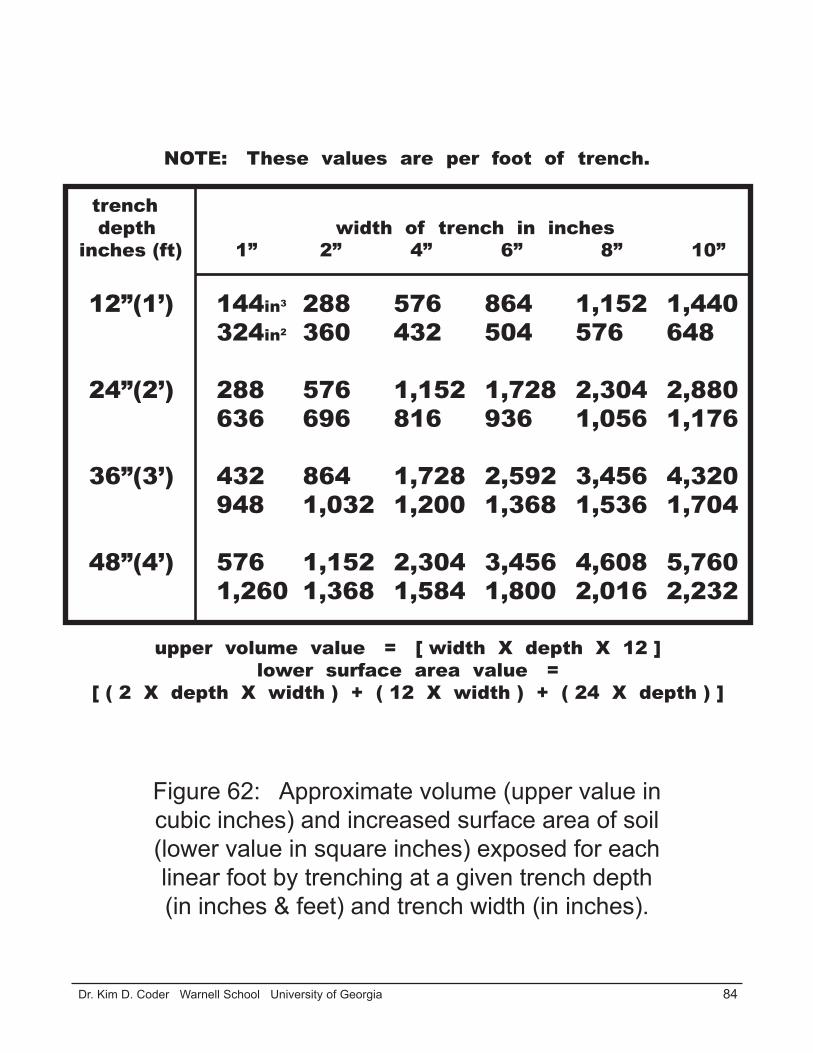
84 Dr. Kim D. Coder Warnell School University of Georgia
Figure 62: Approximate volume (upper value incubic inches) and increased surface area of soil(lower value in square inches) exposed for eachlinear foot by trenching at a given trench depth(in inches & feet) and trench width (in inches).
trench depth width of trench in inches inches (ft) 1” 2” 4” 6” 8” 10”
12”(1’) 144in3 288 576 864 1,152 1,440324in2 360 432 504 576 648
24”(2’) 288 576 1,152 1,728 2,304 2,880636 696 816 936 1,056 1,176
36”(3’) 432 864 1,728 2,592 3,456 4,320948 1,032 1,200 1,368 1,536 1,704
48”(4’) 576 1,152 2,304 3,456 4,608 5,7601,260 1,368 1,584 1,800 2,016 2,232
NOTE: These values are per foot of trench.
upper volume value = [ width X depth X 12 ]lower surface area value =
[ ( 2 X depth X width ) + ( 12 X width ) + ( 24 X depth ) ]
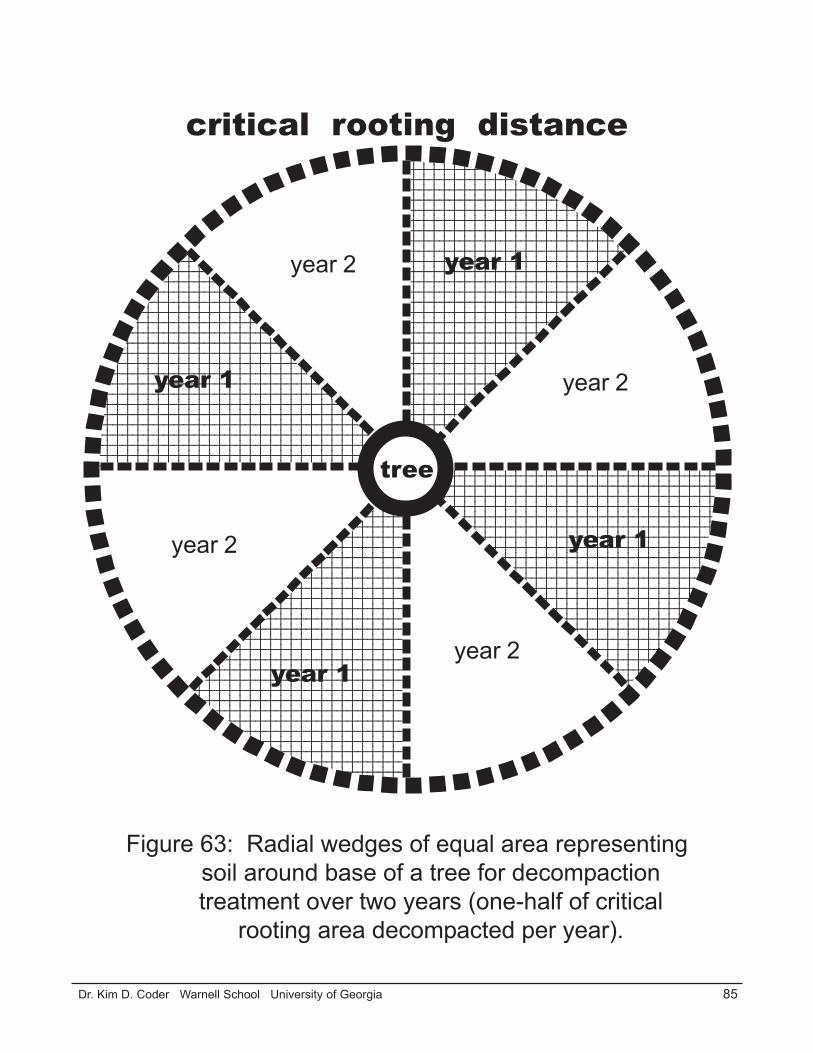
85 Dr. Kim D. Coder Warnell School University of Georgia
12345678901234567890123456789011234567890123456789012345678901123456789012345678901234567890112345678901234567890123456789011234567890123456789012345678901123456789012345678901234567890112345678901234567890123456789011234567890123456789012345678901123456789012345678901234567890112345678901234567890123456789011234567890123456789012345678901123456789012345678901234567890112345678901234567890123456789011234567890123456789012345678901123456789012345678901234567890112345678901234567890123456789011234567890123456789012345678901123456789012345678901234567890112345678901234567890123456789011234567890123456789012345678901123456789012345678901234567890112345678901234567890123456789011234567890123456789012345678901
12345678901234567890123123456789012345678901231234567890123456789012312345678901234567890123123456789012345678901231234567890123456789012312345678901234567890123123456789012345678901231234567890123456789012312345678901234567890123123456789012345678901231234567890123456789012312345678901234567890123123456789012345678901231234567890123456789012312345678901234567890123123456789012345678901231234567890123456789012312345678901234567890123123456789012345678901231234567890123456789012312345678901234567890123123456789012345678901231234567890123456789012312345678901234567890123123456789012345678901231234567890123456789012312345678901234567890123123456789012345678901231234567890123456789012312345678901234567890123123456789012345678901231234567890123456789012345678901212345678901234567890123456789012123456789012345678901234567890121234567890123456789012345678901212345678901234567890123456789012123456789012345678901234567890121234567890123456789012345678901212345678901234567890123456789012123456789012345678901234567890121234567890123456789012345678901212345678901234567890123456789012123456789012345678901234567890121234567890123456789012345678901212345678901234567890123456789012123456789012345678901234567890121234567890123456789012345678901212345678901234567890123456789012123456789012345678901234567890121234567890123456789012345678901212345678901234567890123456789012123456789012345678901234567890121234567890123456789012345678901212345678901234567890123456789012123456789012345678901234567890121234567890123456789012345678901212345678901234567890123456789012
1234567890123456789012123456789012345678901212345678901234567890121234567890123456789012123456789012345678901212345678901234567890121234567890123456789012123456789012345678901212345678901234567890121234567890123456789012123456789012345678901212345678901234567890121234567890123456789012123456789012345678901212345678901234567890121234567890123456789012123456789012345678901212345678901234567890121234567890123456789012123456789012345678901212345678901234567890121234567890123456789012123456789012345678901212345678901234567890121234567890123456789012123456789012345678901212345678901234567890121234567890123456789012123456789012345678901212345678901234567890121234567890123456789012
tree
critical rooting distance
year 1
year 1
year 1
year 1
year 2
year 2
year 2
year 2
Figure 63: Radial wedges of equal area representingsoil around base of a tree for decompactiontreatment over two years (one-half of critical
rooting area decompacted per year).

86 Dr. Kim D. Coder Warnell School University of Georgia
1234567890123456789012345678901212345678901234567890123456789012123456789012345678901234567890121234567890123456789012345678901212345678901234567890123456789012123456789012345678901234567890121234567890123456789012345678901212345678901234567890123456789012123456789012345678901234567890121234567890123456789012345678901212345678901234567890123456789012123456789012345678901234567890121234567890123456789012345678901212345678901234567890123456789012123456789012345678901234567890121234567890123456789012345678901212345678901234567890123456789012
12345678901234567123456789012345671234567890123456712345678901234567123456789012345671234567890123456712345678901234567123456789012345671234567890123456712345678901234567123456789012345671234567890123456712345678901234567123456789012345671234567890123456712345678901234567123456789012345671234567890123456712345678901234567123456789012345671234567890123456712345678901234567123456789012345671234567890123456712345678901234567123456789012345671234567890123456712345678901234567123456789012345671234567890123456712345678901234567123456789012345671234567890123456789012345678901212345678901234567890123456789012123456789012345678901234567890121234567890123456789012345678901212345678901234567890123456789012123456789012345678901234567890121234567890123456789012345678901212345678901234567890123456789012123456789012345678901234567890121234567890123456789012345678901212345678901234567890123456789012123456789012345678901234567890121234567890123456789012345678901212345678901234567890123456789012123456789012345678901234567890121234567890123456789012345678901212345678901234567890123456789012
123456789012345678123456789012345678123456789012345678123456789012345678123456789012345678123456789012345678123456789012345678123456789012345678123456789012345678123456789012345678123456789012345678123456789012345678123456789012345678123456789012345678123456789012345678123456789012345678123456789012345678123456789012345678123456789012345678123456789012345678123456789012345678123456789012345678123456789012345678123456789012345678123456789012345678123456789012345678123456789012345678123456789012345678123456789012345678123456789012345678123456789012345678123456789012345678123456789012345678
critical rooting distance
year 2
Figure 64: Radial wedges of equal area representingsoil around the base of a tree for decompactiontreatment over three years (one-third of critical
rooting area decompacted per year in acounter-clockwise progression).
tree
year 1
year 1
year 1
year 1
year 2
year 2
year 2
year 3
year 3 year 3
year 3
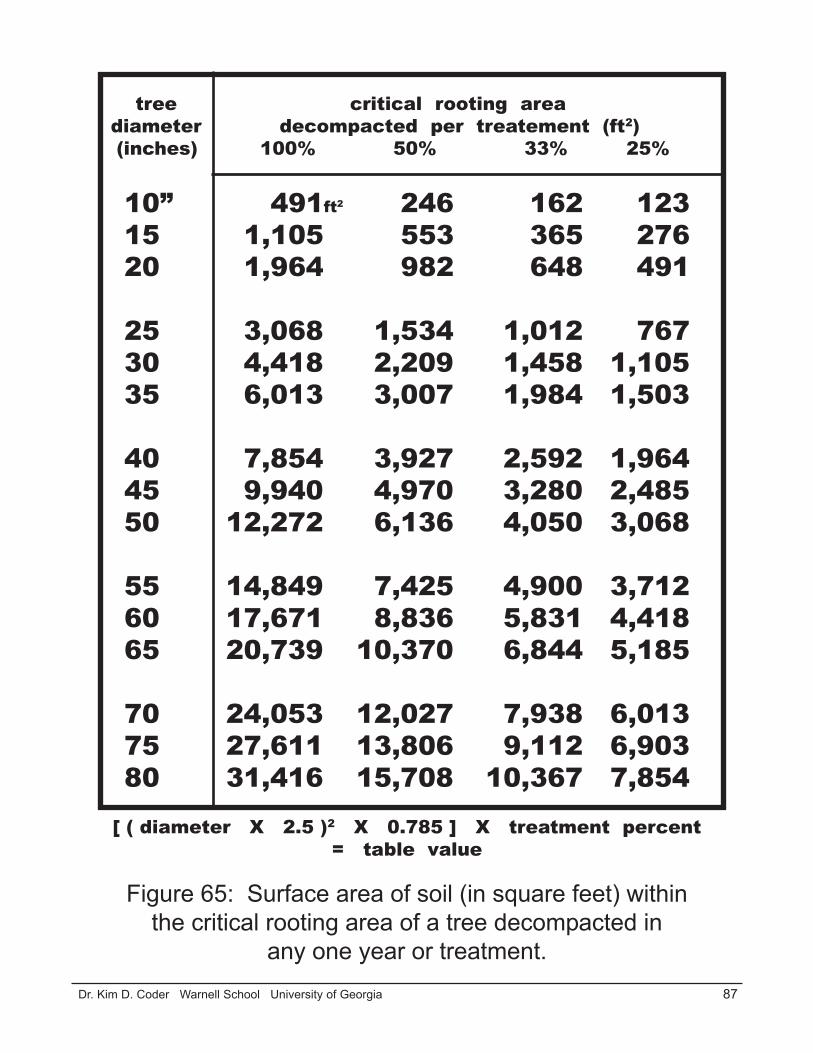
87 Dr. Kim D. Coder Warnell School University of Georgia
Figure 65: Surface area of soil (in square feet) withinthe critical rooting area of a tree decompacted in
any one year or treatment.
tree critical rooting area diameter decompacted per treatement (ft2) (inches) 100% 50% 33% 25%
10” 491ft2 246 162 123 15 1,105 553 365 276 20 1,964 982 648 491
25 3,068 1,534 1,012 767 30 4,418 2,209 1,458 1,105 35 6,013 3,007 1,984 1,503
40 7,854 3,927 2,592 1,964 45 9,940 4,970 3,280 2,485 50 12,272 6,136 4,050 3,068
55 14,849 7,425 4,900 3,712 60 17,671 8,836 5,831 4,418 65 20,739 10,370 6,844 5,185
70 24,053 12,027 7,938 6,013 75 27,611 13,806 9,112 6,903 80 31,416 15,708 10,367 7,854
[ ( diameter X 2.5 )2 X 0.785 ] X treatment percent= table value
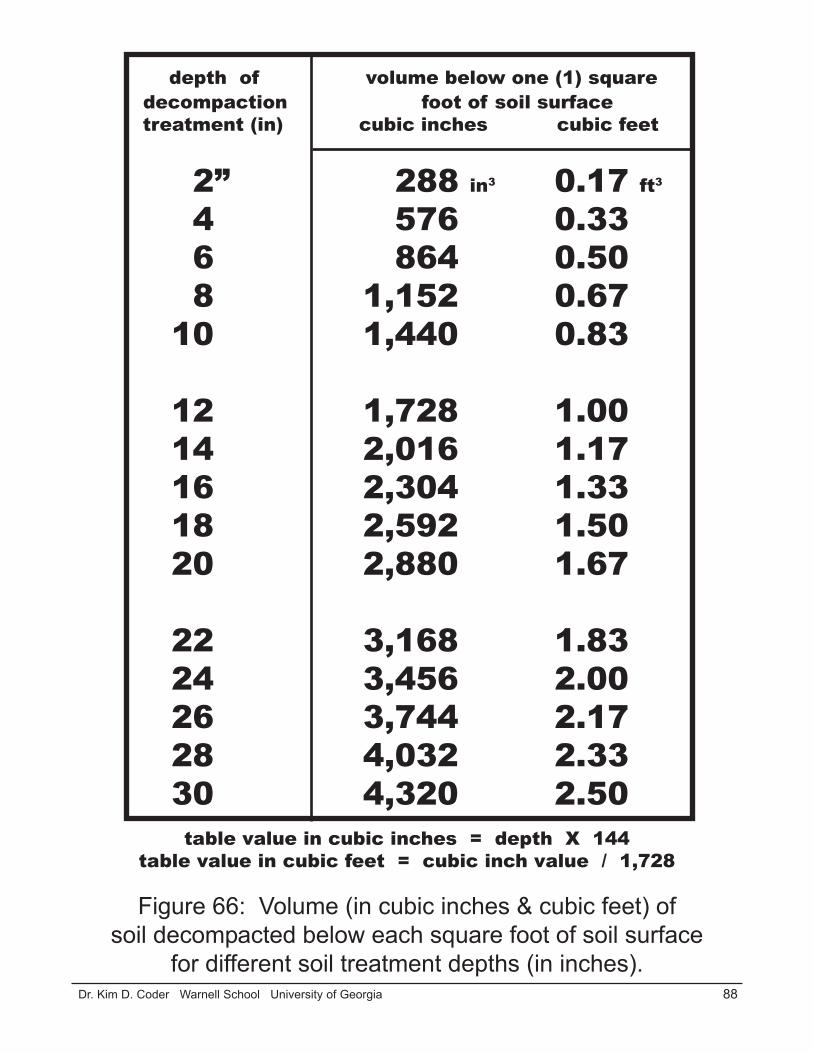
88 Dr. Kim D. Coder Warnell School University of Georgia
Figure 66: Volume (in cubic inches & cubic feet) ofsoil decompacted below each square foot of soil surface
for different soil treatment depths (in inches).
depth of volume below one (1) square decompaction foot of soil surface treatment (in) cubic inches cubic feet
2” 288 in3 0.17 ft3
4 576 0.33 6 864 0.50 8 1,152 0.6710 1,440 0.83
12 1,728 1.0014 2,016 1.1716 2,304 1.3318 2,592 1.5020 2,880 1.67
22 3,168 1.8324 3,456 2.0026 3,744 2.1728 4,032 2.3330 4,320 2.50
table value in cubic inches = depth X 144table value in cubic feet = cubic inch value / 1,728
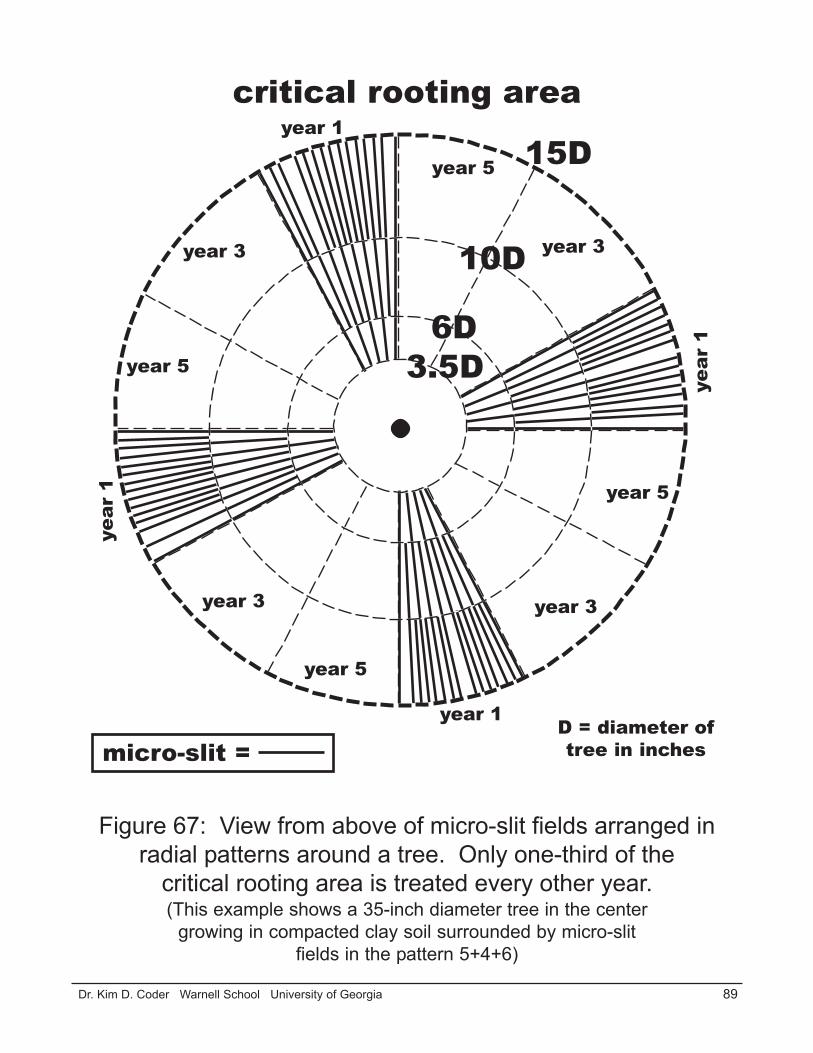
89 Dr. Kim D. Coder Warnell School University of Georgia
Figure 67: View from above of micro-slit fields arranged inradial patterns around a tree. Only one-third of the
critical rooting area is treated every other year.(This example shows a 35-inch diameter tree in the center
growing in compacted clay soil surrounded by micro-slitfields in the pattern 5+4+6)
critical rooting area
year
1year 1
year
1year 1
year 3 year 3
year 3 year 3
year 5
year 5
year 5
year 5
micro-slit =D = diameter oftree in inches
10D
6D3.5D
15D

90 Dr. Kim D. Coder Warnell School University of Georgia
Figure 68: Number of radial micro-slits in each segmentwedge (one of four wedges installed) within critical rooting
area of a tree of a given diameter (in inches).First number is micro-slits per segment between 3.5 times tree diameter inches(3.5D) and 15 times tree diameter inches (15D) away from a tree. Second numberis additional micro-slits added beyond 6D radial distance per segment. Third numberis additional micro-slits added beyond 10D radial distance per segment. Micro-slitsshould run out to at least 15D radial distance, if not beyond.
soil
text
ure fi
ne
tre
ecl
aysi
ltsa
ndy
sand
yfi
ne d
iam
eter
clay
loam
loam
loam
loam
loam
sand
sand
5
in0+
1+1
0+1+
00+
1+0
0+0+
10+
0+0
0+0+
00+
0+0
0+0+
0
10
1+1+
21+
1+1
1+1+
10+
1+1
0+1+
10+
0+1
0+0+
10+
0+1
15
2+2+
21+
2+2
1+2+
21+
1+1
1+1+
10+
1+1
0+1+
10+
1+1
20
3+2+
32+
2+2
2+2+
21+
1+2
1+1+
11+
1+1
0+1+
10+
1+1
25
3+3+
53+
2+3
3+2+
32+
1+2
1+1+
21+
1+1
1+1+
11+
1+1
30
4+4+
53+
3+3
3+3+
32+
2+2
1+2+
21+
1+2
1+1+
11+
1+1
35
5+4+
64+
3+4
4+3+
42+
2+3
2+2+
21+
2+2
1+1+
11+
1+1
40
6+4+
74+
4+5
4+4+
53+
2+3
2+2+
32+
2+2
1+1+
21+
1+2
45
7+4+
85+
4+5
5+4+
53+
3+3
2+2+
32+
2+2
1+2+
21+
2+2
50
7+6+
85+
4+7
5+4+
73+
3+5
3+2+
32+
2+3
2+2+
22+
2+2
55
8+6+
106+
4+8
6+4+
84+
3+5
3+2+
42+
2+4
2+2+
22+
2+2
60
9+6+
117+
4+8
7+4+
84+
4+5
3+3+
43+
2+4
2+2+
22+
2+2
65
10+7
+11
7+5+
97+
5+9
5+4+
54+
3+4
3+2+
42+
2+3
2+2+
3
70
10+8
+12
8+5+
108+
5+10
5+4+
64+
3+5
3+3+
42+
2+3
2+2+
3
75
11+8
+13
8+6+
108+
6+10
5+4+
74+
4+5
3+3+
53+
2+3
3+2+
3
3.5D
# =
( 0
.153
D )
/ di
ffus
ion
valu
e.
6D
# =
( 0
.262
D )
/ di
ffus
ion
valu
e.10
D #
= (
0.4
36D
) /
diff
usio
n va
lue.
91 Dr. Kim D. Coder Warnell School University of Georgia
four (4) new micro-slits are started and ran out to at least the 15D distance. At the 10D distance,another six (6) micro-slits are started and ran out to at least the 15D distance.
For each soil texture (based upon oxygen diffusion and flow level), and for each tree diam-eter, three numeric values are provided giving the number of micro-slits to install and where eachshould be started. It is not critical the micro-slits are perfectly aligned, spaced, or even straight. It isthe soil volume impact which is critical. Note, the value of this technique is concentrated in the finertextured soils which are heavily compacted.
Only one-third of a tree’s critical rooting area should be treated in every other year. No soildistrubance should occur closer than 3.5 times the tree diameter in inches (3.5D) from the tree tunk.Figure 69 provides the surface area of soil impacted by this technique. Figure 66 provides thevolume of soil impacted for various treatment depths for each square foot of surface area. Micro-slits can be filled by raking in non-compressable materials, some composted organic material, andsome native soil.
Additional tree growth and soil health materials can be added to the soil surface and raked in.Watering should be completed immediately after treatment. In heavily compacted soils which aredry, thin-kerf micro-trenchers and soil saws will usually provide quicker and more effective treamentthan soft excavation methods.
Other Techniques -- Other methods for decompacting sites are being developed and tested. Com-plete soil and tree replacement may be realities for some extremely damaged and growth constrain-ing sites. Artificial soil support structures may also be of value.
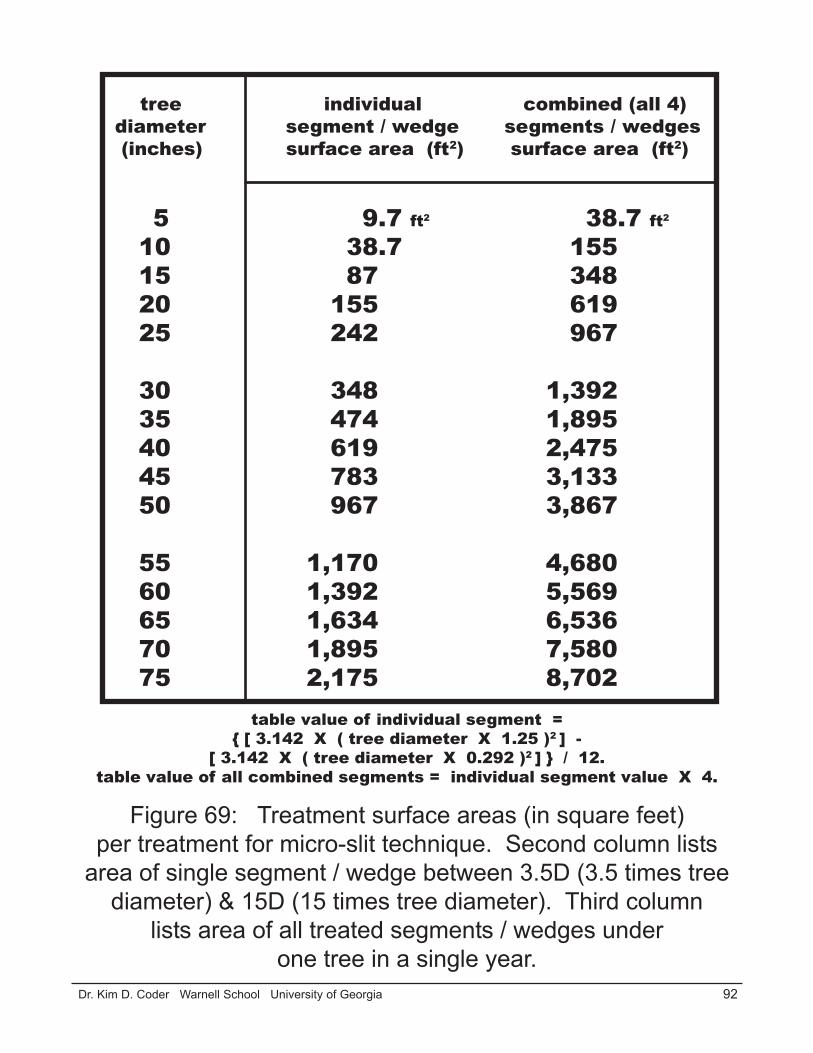
92 Dr. Kim D. Coder Warnell School University of Georgia
Figure 69: Treatment surface areas (in square feet)per treatment for micro-slit technique. Second column lists
area of single segment / wedge between 3.5D (3.5 times treediameter) & 15D (15 times tree diameter). Third column
lists area of all treated segments / wedges underone tree in a single year.
tree individual combined (all 4)diameter segment / wedge segments / wedges (inches) surface area (ft2) surface area (ft2)
5 9.7 ft2 38.7 ft2
10 38.7 155 15 87 348 20 155 619 25 242 967
30 348 1,392 35 474 1,895 40 619 2,475 45 783 3,133 50 967 3,867
55 1,170 4,680 60 1,392 5,569 65 1,634 6,536 70 1,895 7,580 75 2,175 8,702
table value of individual segment ={ [ 3.142 X ( tree diameter X 1.25 )2 ] -
[ 3.142 X ( tree diameter X 0.292 )2 ] } / 12.table value of all combined segments = individual segment value X 4.
93 Dr. Kim D. Coder Warnell School University of Georgia
ConclusionsSoil compaction is a hidden stressor which
steals health and sustainability fromsoil and tree systems.
Causes of compaction are legionand solutions limited.
Without creative actions regardingsustainable greening of
inter-infrastructural spaces in ourcommunities, we will spend most
of our budgets and careerstreating compaction symptoms
and replacing trees.
Understanding the hideous scourge ofsoil compaction is essential to better,
enlightened, and corrective treehealth management.
94 Dr. Kim D. Coder Warnell School University of Georgia
Trees & Soil Compaction:A Selected Bibliography
Abercrombie, R.A. 1990. Root distribution of avocado trees on a sandy loam soil as affected by soilcompaction. Acta Horticulturae. 275:505-512.
Alberty, C.A., Pellett, H.M., & Taylor, D.H. 1984. Characterization of soil compaction at constructionsites and woody plant response. Journal of Environmental Horticulture 2(2):48-53.
Barber, R.G. & Romero, D. 1994. Effects of bulldozer and chain clearing on soil properties and cropyields. Soil Science Society of America Journal. 58 (6):1768-1775.
Coder, K.D. 1998. Soil constraints on root growth. University of Georgia Cooperative ExtensionService Forest Resources Publications FOR98-10. 8pp.
Cook, F.J. & J.H. Knight. 2003. Oxygen transport to plant roots: Modeling for physical understandingof soil aeration. Soil Science Society of America Journal 67:20-31.
Corns, I.G.W. & Maynard, D.G. 1998. Effects of soil compaction and chipped aspen residue on aspenregeneration and soil nutrients. Canadian Journal of Soil Science. 78(1):85-92.
Craul, P.J. 1992. Urban Soil in Landscape Design. John Wiley & Sons, New York. Pp. 396.
Craul, P.J. 1994. Soil compaction on heavily used sites. Journal of Arboriculture 20(2):69-74.
Craul, P.J. 1999. Urban Soils: Applications and Practices. John Wiley & Sons, New York. Pp. 366.
Daddow, R.L. & G.E. Washington. 1983. Growth-limiting soil bulk densities as influenced by soiltexture. USDA-Forest Service Report WSD6-TN-00005. Pp.17.
Day, S.D. & Bassuk, N.L. 1994. A review of the effects of soil compaction and amelioration treatmentson landscape trees. Journal of Arboriculture 20(1):9-17.
Day, S.D. Bassuk, N.L. & VanEs, H. 1995. Effects of four compaction remediation methods forlandscape trees on soil aeration, mechanical impedance and tree establishment. Journal of Environmen-tal Horticulture. 13(4):64-71.
Donnelly, J.R. & Shane, J.B. 1986. Forest ecosystem responses to artificially induced soil compaction.I. Soil physical properties and tree diameter growth. Canadian Journal of Forest Research 16 (4):750-754.
Ferguson, B.K. 2005. Porous Pavements. CRC Press, Boca Raton, FL. Pp.577.
Gilman, E.F., Leone, I.A., & Flower, F.B. 1987. Effect of soil compaction and oxygen content onvertical and horizontal root distribution. Journal of Environmental Horticulture 5(1):33-36.
95 Dr. Kim D. Coder Warnell School University of Georgia
Greene, T.A. & Nichols, T.J. 1996. Effects of long-term military training traffic on forest vegetationin central Minnesota. Northern Journal of Applied Forestry. 13 (4):157-163.
Gregory, J.H., M.D. Dukes, P.H. Jones, & G.L. Miller. 2006. Effects of urban soil compaction oninfiltration rate. Journal of Soil & Water Conservation 61(3):117-124.
Helms, J.A. & Hipkin, C. 1986. Effects of soil compaction on tree volume in a California ponderosapine plantation. Western Journal of Applied Forestry. 1(4):121-124.
Hitchmough, J.D. 1994. Urban Landscape Management. Inkata Press, Sydney, AUS. Pp.115, 129,273.
Jim, C.Y. 1998. Soil compaction at tree-planting sites in urban Hong Kong. Pp. 166-178 in The Land-scape Below Ground II: Proceedings of a Second International Workshop on Tree Root Develop-ment in Urban Soils (San Francisco, CA). (Neely, D. & Watson, GW. editors). International Societyof Arboriculture, Champaign, IL.
Jordan, D., F. Ponder, & V.C. Hubbard. 2003. Effects of soil compaction, forest leaf litter and nitorgenfertilizer on two oak species and microbial activity. Applied Soil Ecology 23(1):33-41.
Kalita, P. 1999. Transient finite element method solution of oxygen diffusion in soil. EcologicalModelling 118:227-236.
Licher, J.M. & Lindsey, P.A. 1994. Soil compaction and site construction: Assessment and casestudies. Pp. 126-130 in The Landscape Below Ground: Proceedings of an International Workshopon Tree Root Development in Urban Soils (Chicago, IL). (Watson, GW. & Neely, D. editors). Inter-national Society of Arboriculture, Champaign, IL.
Matheny, N. & J.R. Clark. 1998. Trees & Development: A technical guide to preservation of treesduring land development. International Society of Arboriculture, Champaign, IL. Pp. 84-85, 126-127.
Moldrup, P., T. Olesen, S. Yoshikawa, T. Komatsu, & D.E. Rolston. 2004. Three-porosity model forpredicting the gas diffusion coefficient in undisturbed soil. Soil Science Society of America Journal68:750-759.
Moldrup, P., T. Olesen, T. Komatsu, P. Schjonning, & D.E. Rolston. 2001. Tortuosity, diffusivity, andpermeability in the soil liquid and gaseous phases. Soil Science Society of America Journal 65:613-623.
Page-Dumroese, D.S. Harvey, A.E. Jurgensen, M.F. & Amaranthus, M.P. 1998. Impacts of soilcompaction and tree stump removal on soil properties and out-planted seedlings in northern Idaho, USA.Canadian Journal of Soil Science. 78(1):29-34.
Patterson, J.C. 1976. Soil compaction and its effects upon urban vegetation. Pages 91-102 in proceed-ings of symposium “Better trees for metropolitan landscapes.” USDA-Forest Service General TechnicalReport NE-22.
96 Dr. Kim D. Coder Warnell School University of Georgia
Pittenger, D.R. & Stamen, T. 1990. Effectiveness of methods used to reduce harmful effects of com-pacted soil around landscape trees. Journal of Arboriculture 16(3):55-57.
Randrup, T.B. 1998. Soil compaction on construction sites. Pp. 146-153 in The Landscape BelowGround II: Proceedings of a Second International Workshop on Tree Root Development in UrbanSoils (San Francisco, CA). (Neely, D. & Watson, GW,. editors). International Society of Arboriculture,Champaign, IL.
Randrup, T.B. & Dralle, K. 1997. Influence of planning and design on soil compaction in constructionsites. Landscape & Urban Planning 38:87-92.
Rolf, K. 1994. Soil compaction and loosening effects on soil physics and tree growth. Pp.131-148 inThe Landscape Below Ground: Proceedings of an International Workshop on Tree Root Develop-ment in Urban Soils (Chicago, IL). (Watson, GW. & Neely, D. editors). International Society ofArboriculture, Champaign, IL.
Smiley, E.T. 1994. The effects of soil aeration equipment on tree growth. Pp. 207-210 in The Land-scape Below Ground: Proceedings of an International Workshop on Tree Root Development inUrban Soils (Chicago, IL). (Watson, GW. & Neely, D. editors). International Society of Arboriculture,Champaign, IL.
Stone, D.M. & Elioff, J.D. 1998. Soil properties and aspen development five years after compactionand forest floor removal. Canadian Journal of Soil Science. 78(1):51-58.
Torbert, J.L. & Burger, J.A. 1990. Tree survival and growth on graded and ungraded minesoil.USDA-Forest Service. Tree Planters’ Notes 41(2):3-5.
Torreano, S.J. 1992. Effects of soil water availability, aeration,and soil mechnical impedance onloblolly pine (Pinus taeda) root development. PhD dissertation, University of Georgia Warnell School.Pp.125.
Watson, G.W. & P.K. Kelsey. 2006. The impact of soil compaction on soil aeration and fine rootdensity of Quercus palustris. Urban Forestry & Urban Greening 4:69-74.
Worrell, R. & Hampson, A. 1997. The influence of some forest operations on the sustainable manage-ment of forest soils -- a review. Forestry 70 (1):61-85.
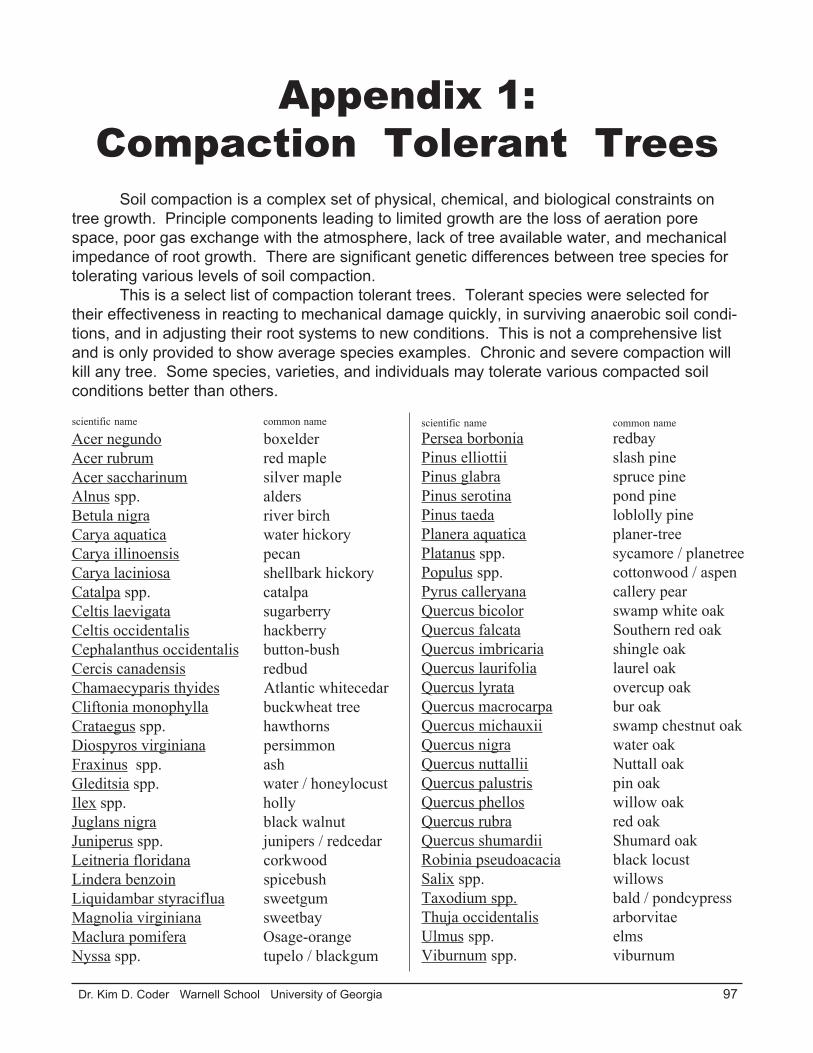
97 Dr. Kim D. Coder Warnell School University of Georgia
Appendix 1:Compaction Tolerant Trees
Soil compaction is a complex set of physical, chemical, and biological constraints ontree growth. Principle components leading to limited growth are the loss of aeration porespace, poor gas exchange with the atmosphere, lack of tree available water, and mechanicalimpedance of root growth. There are significant genetic differences between tree species fortolerating various levels of soil compaction.
This is a select list of compaction tolerant trees. Tolerant species were selected fortheir effectiveness in reacting to mechanical damage quickly, in surviving anaerobic soil condi-tions, and in adjusting their root systems to new conditions. This is not a comprehensive listand is only provided to show average species examples. Chronic and severe compaction willkill any tree. Some species, varieties, and individuals may tolerate various compacted soilconditions better than others.
scientific name common name
Acer negundo boxelderAcer rubrum red mapleAcer saccharinum silver mapleAlnus spp. aldersBetula nigra river birchCarya aquatica water hickoryCarya illinoensis pecanCarya laciniosa shellbark hickoryCatalpa spp. catalpaCeltis laevigata sugarberryCeltis occidentalis hackberryCephalanthus occidentalis button-bushCercis canadensis redbudChamaecyparis thyides Atlantic whitecedarCliftonia monophylla buckwheat treeCrataegus spp. hawthornsDiospyros virginiana persimmonFraxinus spp. ashGleditsia spp. water / honeylocustIlex spp. hollyJuglans nigra black walnutJuniperus spp. junipers / redcedarLeitneria floridana corkwoodLindera benzoin spicebushLiquidambar styraciflua sweetgumMagnolia virginiana sweetbayMaclura pomifera Osage-orangeNyssa spp. tupelo / blackgum
scientific name common namePersea borbonia redbayPinus elliottii slash pinePinus glabra spruce pinePinus serotina pond pinePinus taeda loblolly pinePlanera aquatica planer-treePlatanus spp. sycamore / planetreePopulus spp. cottonwood / aspenPyrus calleryana callery pearQuercus bicolor swamp white oakQuercus falcata Southern red oakQuercus imbricaria shingle oakQuercus laurifolia laurel oakQuercus lyrata overcup oakQuercus macrocarpa bur oakQuercus michauxii swamp chestnut oakQuercus nigra water oakQuercus nuttallii Nuttall oakQuercus palustris pin oakQuercus phellos willow oakQuercus rubra red oakQuercus shumardii Shumard oakRobinia pseudoacacia black locustSalix spp. willowsTaxodium spp. bald / pondcypressThuja occidentalis arborvitaeUlmus spp. elmsViburnum spp. viburnum
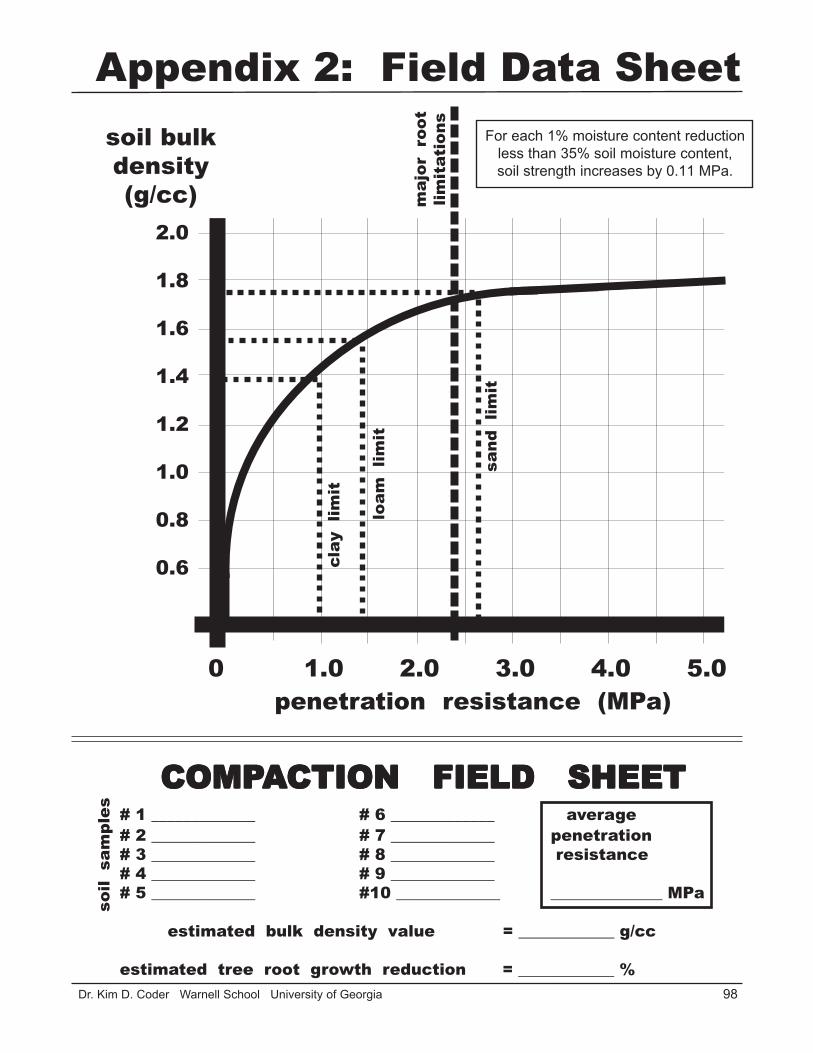
98 Dr. Kim D. Coder Warnell School University of Georgia
2.0
1.8
1.6
1.4
1.2
1.0
0.8
0.6
0 1.0 2.0 3.0 4.0 5.0penetration resistance (MPa)
soil bulkdensity(g/cc)
sand
lim
it
loam
lim
it
clay
lim
it
maj
or r
oot
limit
atio
ns
COMPCOMPCOMPCOMPCOMPAAAAACTION FIELD SHEETCTION FIELD SHEETCTION FIELD SHEETCTION FIELD SHEETCTION FIELD SHEET# 1 _____________ # 6 _____________ average# 2 _____________ # 7 _____________ penetration# 3 _____________ # 8 _____________ resistance# 4 _____________ # 9 _____________# 5 _____________ #10 _____________ ______________ MPa
estimated bulk density value = ____________ g/cc
estimated tree root growth reduction = ____________ %
soil
sam
ples
Appendix 2: Field Data SheetFor each 1% moisture content reduction
less than 35% soil moisture content,soil strength increases by 0.11 MPa.