Embed Size (px)
Citation preview
8/8/2019 Soil Classification 5-8
http://slidepdf.com/reader/full/soil-classification-5-8 1/36
FM 5-410
CHAPTER 5
S o i l C l a s s i f i c a t i o n
Early attemp ts to classify soils w ere basedprimarily on grain size. These are the tex-tural classification systems. In 1908, asystem that recognized other factors was
developed by Atterberg in Sweden andprimarily used for agricultural purp oses.Somewhat later, a similar system wasdeveloped and used by the Swedish Geotech-nical Comm ission. In the United States, theBureau of Public Roads System wasdeveloped in the late twen ties and was inwidespread use by highway agencies by themid dle thirties. This system has been revisedover time and is widely used tod ay. The Air-fieid Classification System was developed byProfessor Arthu r Casagrand e of Harvard
University du ring World War II. A mod ifica-tion of this system, the USCS, was ad opted bythe US Army Corps of Engineers and theBureau of Reclamation in January 1952. Anumber of other soil classification systemsare in u se throughou t the world, and themilitary engineer shou ld be familiar with th emost common ones.
The principal objective of any soil classifica-tion system is predicting the engineeringprop erties and behavior of a soil based on afew simple laboratory or field tests.
Laboratory and / or field test results are thenused to iden tify the soil and pu t it into a groupthat has soils with similar engineering char-acteristics. Probab ly no existing classifi-cation system completely achieves the statedobjective of classifying soils by engineeringbehavior because of the number of variables
involved in soil behavior and the variety of soil problems encountered. Considerableprogress has been m ade toward this goal, par-ticularly in r elationship to soil problems
encountered in h ighway and airport en-gineering. Soil classification should not beregarded as an end in itself but as a toolto further your knowledge of soil behavior.
Section I. Unified SoilClassif ication System
SOIL CATEGORIES
Soils seldom exist in nature separately assand, gravel, or any other single component.Usually they occur as mixtures with varyingproportions of particles of different sizes.Each component contributes its charac-teristics to the mixture. The USCS is basedon the characteristics of the soil that ind icatehow it will behave as a construction material.
In the USCS, all soils are p laced into one of three major categories. They are—
Coarse-grained.Fine-grained.Highly organic.
The USCS further d ivides soils that havebeen classified into th e m ajor soil categoriesby letter symbols, such as—
S for sand.G for gravel.M for silt.C for clay.
Soil Classification 5-1
8/8/2019 Soil Classification 5-8
http://slidepdf.com/reader/full/soil-classification-5-8 2/36
8/8/2019 Soil Classification 5-8
http://slidepdf.com/reader/full/soil-classification-5-8 3/36
FM 5-410
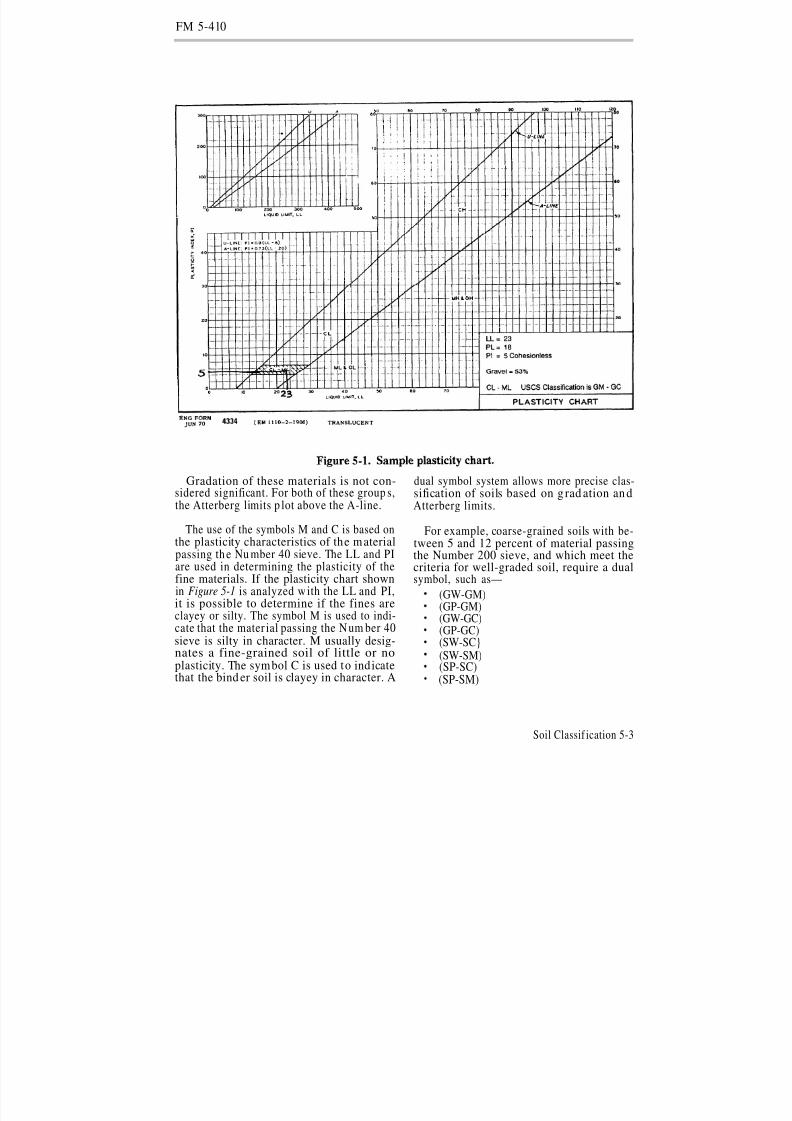
Gradation of these materials is not con-sidered significant. For both of these group s,the Atterberg limits p lot above the A-line.
The use of the symbols M and C is based onthe plasticity characteristics of the materialpassing th e Nu mber 40 sieve. The LL and PIare used in determining the plasticity of thefine materials. If the plasticity chart shownin Figure 5-1 is analyzed w ith the LL and PI,
it is possible to determine if the fines areclayey or silty. The symbol M is used to indi-cate that the mater ial passing the N um ber 40sieve is silty in character. M usually desig-nates a fine-grained soil of little or noplasticity. The symbol C is used to indicatethat the bind er soil is clayey in character. A
dual symbol system allows more precise clas-sification of soils based on g rad ation andAtterberg limits.
For example, coarse-grained soils with be-tween 5 and 12 percent of material passingthe Number 200 sieve, and which meet thecriteria for well-graded soil, require a dualsymbol, such as—
(GW-GM)
(GP-GM)(GW-GC)(GP-GC)(SW-SC}(SW-SM)(SP-SC)(SP-SM)
Soil Classif ication 5-3
8/8/2019 Soil Classification 5-8
http://slidepdf.com/reader/full/soil-classification-5-8 4/36
FM 5-410
Similarly, coarse-grained soils containingmore than 12 percent of material passing theNumber 200 sieve, and for which the limitsplot in the hatched portion of the plasticitychart (see Figure 5-1 , page 5-3), are borderlinebetween silt and clay and are classified as
(SM-SC) or (GM-GC).In rare instances, a soil may fall into more
than one borderline zone. If appropriate sym-bols were used for each possible classification,the result would be a multiple designationusing three or more sym bols. This app roachis unnecessarily comp licated . It is consideredbest to use only a double symbol in thesecases, selecting the two believed most repre-sentative of pr obable soil behavior. If there isdoubt, the symbols representing the poorer of the possible group ings should be used. For
example, a well-graded sandy soil with 8 per-cent passing the Number 200 sieve, with anLL of 28 and a PI of 9, wou ld be designated as(SW-SC). If the Atterberg limits of this soilwere such as to p lot in the h atched p ortion of the plasticity chart (for example, an LL of 20and a PI of 5), the soil could be designatedeither (SW-SC) or (SW-SM), depending on the
jud gmen t of the soils technician.
Fine-Grained SoilsFine-g-rained soils are those in w hich more
than half the material passes a Number 200sieve. The fine-grained soils are n ot classifiedby grain size but according to plasticity andcompressibility. Laboratory classificationcriteria are based on the relationship betweenthe LL and th e PI, determined from the p las-ticity chart shown in Figure 5-1 , page 5-3.The chart indicates two major groupings of fine-g-rained soils. These a re—
The L group s, which have LLs <50.The H grou ps, w hich have LLs of 50.
The symbols L and H represent low andhigh compressibility, respectively. Fine-grained soils are further d ivided based ontheir position above or below the A-line of theplasticity chart.
Typical soils of the (ML) and (MH) grou psare inorganic silts. Those of low p lasticity are
Soil Classification 5-4
in the (ML) group; others are in the (MH)group. Atterberg limits of these soils all plotbelow the A-line. The (ML) group includ es-
Very fine sands.Rock flours.Silty or clayey fine sand s w ith slightplasticity.
Micaceous and diatom aceous soils gen-erally fall into the (MH) group but m ay extendinto the (ML) group with LLs<50. The samestatemen t is true of certain types of kaolinclays, which have low plasticity. Plastic siltsfall into the (MH) group.
In (CL) and (CH) groups, the C stands forclay, with L and H denoting low or high com-pressibility. These soils plot above the A-line
and are p rincipally inorganic clays. The (CL)group includes gravelly clays, sandy clays,silty clays, and lean clays. In the (CH) grou pare inorganic clays of high plasticity, includ -ing fat clays, the gumbo clays of the southernUnited States, volcanic clays, and bentonite.The glacial clays of the northern UnitedStates cover a wide band in the (CL) and (CH)groups.
Soils in the (OL) and (OH) groups are char-acterized by the presence of organic matter,
hence the sym bol O. The Atterberg limits of these soils generally plot below the A-line.Organic silts and organic silt clays of lowplasticity fall into the (OL) group , while or-ganic clays p lot in the (OH) zone of theplasticity chart. Many organic silts, silt-clays,and clays deposited by rivers along the lowerreaches of the Atlantic seaboard have LLs be-tween 40 and 100 and plot below the A-line.Peaty soils may have LLs of several hun dr edpercent and their Atterberg limits generallyplot below the A-line.
Fine-grained soils having limits tha t plot inthe shaded portion of the plasticity chart aregiven d ual symbols (for exam ple, (CL-ML)).Several soil types exhibiting low plasticityplot in this general region on the chart and nodefinite boundary between silty and clayeysoils exists.
8/8/2019 Soil Classification 5-8
http://slidepdf.com/reader/full/soil-classification-5-8 5/36
FM 5-410
High ly Organic Soils
A special classification , (Pt), is reserved forthe highly organic soils, such as peat, whichhave many undesirable engineering charac-teristics. No laboratory criteria areestablished for these soils, as they generally
can be easily identified in the field by theirdistinctive color and odor , spongy feel, andfrequently fibrous texture. Particles of leaves, grass, branches, or other fibrousvegetable matter are common comp onents of these soils.
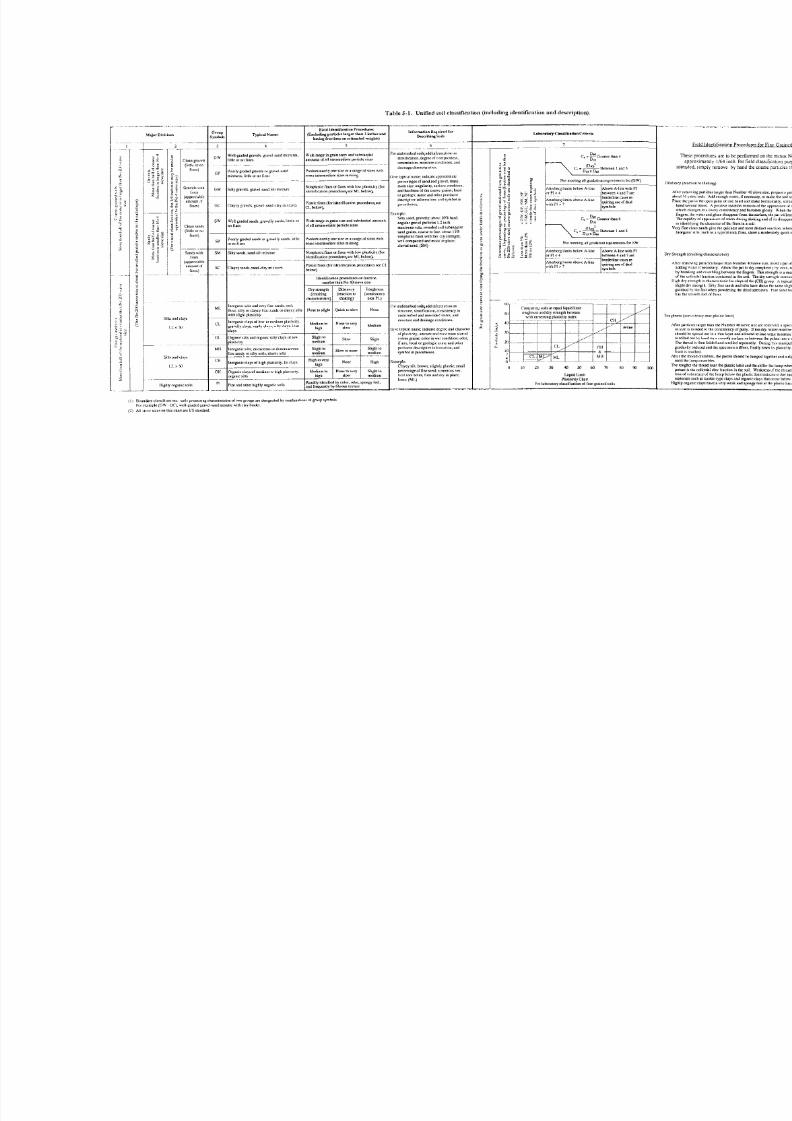
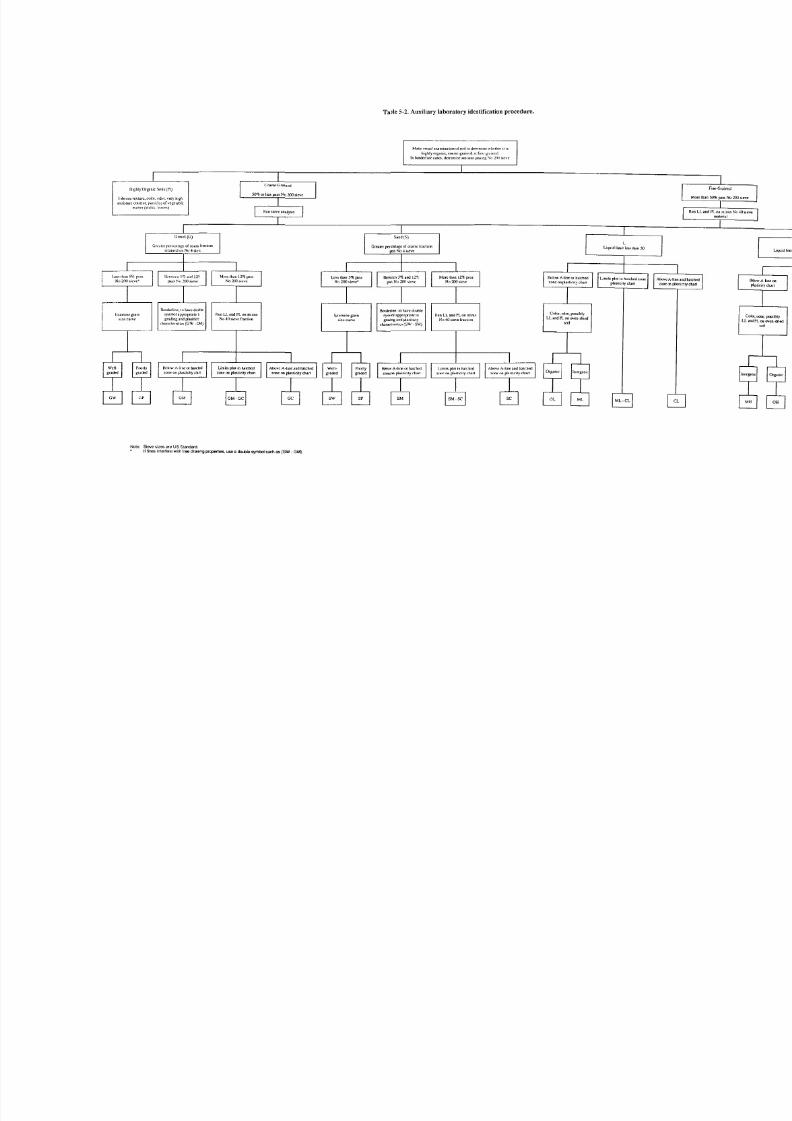
Table 5-1, page 5-7, and Table 5-2, page 5-9,are major charts which present informationapp licable to the USCS and pr ocedures to befollowed in identifying and classifying soilsunder this system. Principal categories
shown in the chart include—Soil grou ps, soil grou p sym bols, andtypical soil names.Laboratory classification criteria.Field identification procedures.Information for describing soils.
These char ts are va luable aids in soil clas-sification problems. They provide a simplesystematic means of soil classification.
LABORATORY TESTINGUsually soil samples are obtained during
the soil survey and are tested in thelaboratory to determine test properties forclassifying the soils. The pr incipa l tests are—
Mechanical analysis.Liquid limit.Plastic limit.
These tests are u sed for all soils exceptthose in the (Pt) grou p. With the percentagesof gravel, sand, and fines and the LL and PI,
the group symbol can be obtained from thechart in Table 5-2 , page 5-9, by reading thediagram from top to bottom. For the gravelsand sands containing 5 percent (or less) fines,the shap e of the grain-size distribu tion cur vecan be used to establish w hether the m aterialis well-grad ed or poorly grad ed. For the
fine-grained soils, it is necessary to plot th eLL and PI in the d rawing on Figure 5-1 , page5-3, to establish the proper symbol. Organicsilts or clays (ML) and (MH) are su bjected toLL and PL tests before and after oven dr ying.An organic silt or clay shows a radical drop in
these limits as a result of oven dry ing. An in-organ ic soil show s a slight d rop th at is notsignificant. Where there is an appreciabledrop, the predrying values should be usedwhen the classification is determined fromTable 5-2 , page 5-9.
DESIRABLE SOIL PROPERTIESFOR ROAD S AND AIRFIELDS
The prop erties desired in soils for found a-tions und er roads and airfields are—
Adequate strength.Resistance to frost action (in areaswh ere frost is a factor).Acceptable comp ression and expan-sion.Adequate drainage.Good compaction.
Some of these prop erties may be sup pliedby p roper construction m ethods. For in-stance, materials having good drainagecharacteristics are desirable, bu t if suchmaterials are not available locally, adequatedrainage may be obtained by installing aproperly designed water-collecting system.Strength requirements for base coursematerials are high, and only good qualitymaterials are acceptable. However, lowstrengths in subgrad e materials may be com-pensated for in many cases by increasing thethickness of overlying base materials or usinga geotextile (see Chapter 11). Proper designof road and airfield p avements requires theevaluation of soil properties in more detail
than possible by u se of the general soils clas-sification system. How ever, the group ing of soils in the classification system gives an ini-tial indication of their behavior in road andairfield construction, which is useful in site orroute selection and borrow source reconnais-sance.
Soil Classification 5-5
8/8/2019 Soil Classification 5-8
http://slidepdf.com/reader/full/soil-classification-5-8 6/36
FM 5-410
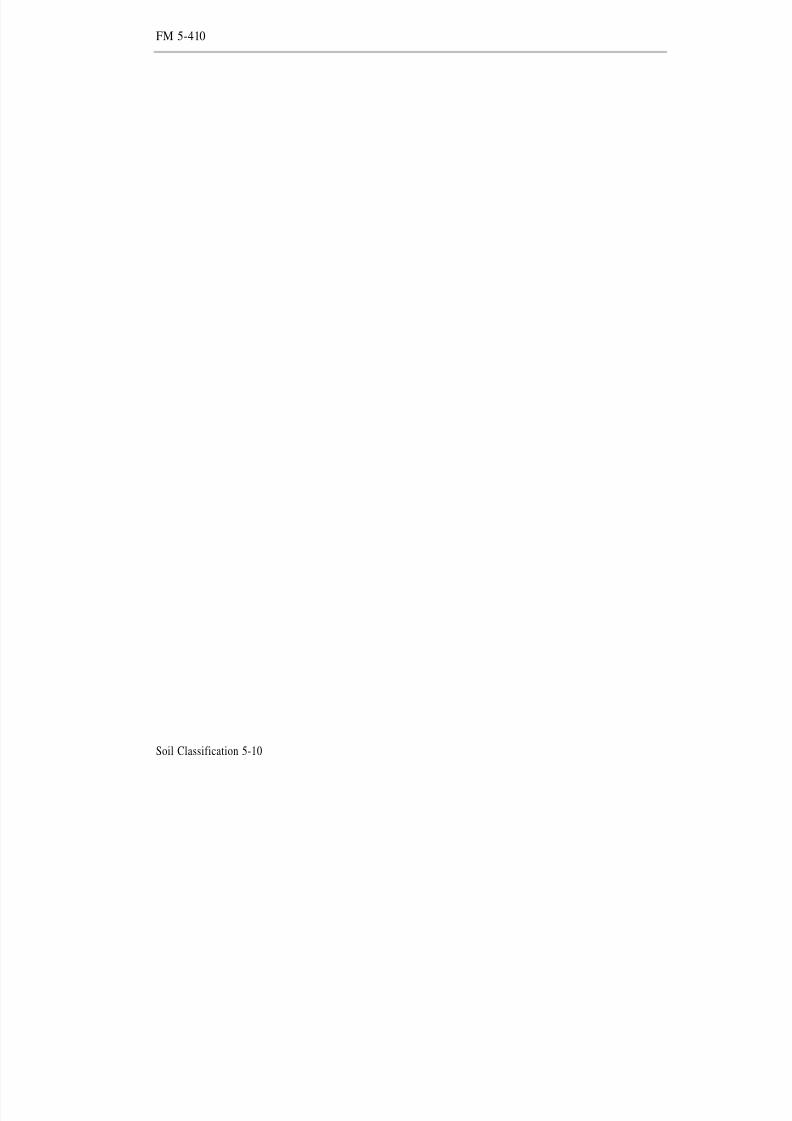
General characteristics of the soil groupspertinent to roads and airfields are in the soilclassification sheet in Table 5-3 , page 5-11, asfollows:
Columns 1 through 5 show major soildivisions, group symbols, hatching,
and color symbols.Column 6 gives names of soil types.Colum n 7 evaluates the performance(strength) of the soil group s w henused as subgrade m aterials that arenot su bject to frost action.Columns 8 and 9 make a similarevaluation for the soils wh en used assubbase and base materials.Column 10 shows potential frost ac-tion.Column 11 show s compressibility and
expansion characteristics.Column 12 presents drainage charac-teristics.Column 13 shows types of comp actionequipment that perform satisfactorilyon the various soil groups.Colum n 14 shows ranges of unit dryweight for compacted soils.Column 15 shows ranges of typicalCalifornia Bearing Ratio (CBR) val-ues to be anticipated for use in air-field d esign.Column 16 gives ranges of mod ulu s of subgrade reaction, k.
The various features are discussed in thefollowing paragrap hs.
StrengthIn colum n 3 of Table 5-3, page 5-11, th e
basic soil groups (GM) and (SM) have eachbeen subdivided into two grou ps d esignatedby the following suffixes:
d (represents desirable base and sub-
base materials).u (represents un desirable base andsubbase materials).
This subdivision applies to roads and air-fields only and is based on field observa tionand laboratory tests on soil behavior in thesegroups. The basis for the subdivision is theLL and PI of the fraction of the soil passing
Soil Classification 5-6
the N um ber 40 sieve. The suffix d is usedwh en the LL is 25 and the PI isfix u is used otherwise.
The descriptions in colum ns 7, 8, and 9generally indicate the suitability of the soil
groups for use as subgrad e, subbase, or basematerials not subjected to frost action. Inareas where frost heaving is a problem, thevalue of materials as subgrad es is reduced,dep end ing on the poten tial frost action of thematerial (see column 10). Proper d esign pro-cedu res should be used in situations wherefrost action is a problem.
Coarse-Grained Soils. Generally, thecoarse-grained soils make the best subgrad e,subbase, and base materials. The (GW)group has excellent qualities as a basematerial. The adjective “excellent” is notused for any of these soils for base courses, be-cause “excellent” should only be used todescribe a high quality processed crushedstone. Poorly graded gravels and some siltygravels (groups (GP) and (GMd)) are usu allyonly slightly less desirable as subgrade orsubbase materials. Under favorable condi-tions, these gravels ma y be u sed as basematerials; however, poor grad ation an d otherfactors sometimes reduce the value of thesesoils so they offer only moderate strength.
For examp le—The (GMu), (GC), and (SW) grou psare reasonably good subgrade orselect materials but are generallypoor to not su itable as base materials.
The (SP) and (SMd) soils usually areconsidered fair to good su bgrade andsubbase materials but are generailypoor to not su itable as base materials.
Fine-Grained Soils. The fine-grained soilsrange from fair to very poor subgrade
materials as follows—Silts and lean clays (ML) and (CL)
are fair to poor.Organic silts, lean organic clays, andmicaceous or d iatom aceous soils (OL)and (MH) are poor.
Fat clays and fat organic clays (CH)and (OH) are poor to very poor.
5; the sur-
8/8/2019 Soil Classification 5-8
http://slidepdf.com/reader/full/soil-classification-5-8 7/36

8/8/2019 Soil Classification 5-8
http://slidepdf.com/reader/full/soil-classification-5-8 8/36
FM 5-410
Soil Classification 5-8
8/8/2019 Soil Classification 5-8
http://slidepdf.com/reader/full/soil-classification-5-8 9/36
8/8/2019 Soil Classification 5-8
http://slidepdf.com/reader/full/soil-classification-5-8 10/36
FM 5-410
Soil Classification 5-10
8/8/2019 Soil Classification 5-8
http://slidepdf.com/reader/full/soil-classification-5-8 11/36
8/8/2019 Soil Classification 5-8
http://slidepdf.com/reader/full/soil-classification-5-8 12/36
FM 5-410
Soil Classification 5-12
8/8/2019 Soil Classification 5-8
http://slidepdf.com/reader/full/soil-classification-5-8 13/36
FM 5-410
These qualities are compensated for inflexible pavement design by increasing thethickness of overlying base m aterial. In r igidpavement design, these qualifications arecomp ensated for by increasing the p avementthickness or by ad ding a base course layer.Non e of the fine-grained soils are su itable asa subbase und er bitum inous pavements, butsoils in the (ML) and (CL) group s may be u sedas select material. The fibrous organic soils(group (Pt)) are very poor subgrade materialsand should be removed wherever possible;otherwise, special construction measuresshould be ad opted. They are not suitable assubbase and base ma terials. The CBR valuesshown in column 15 give a relative indicationof the strength of the various soil groups whenused in flexible pavement design. Similarly,values of subgrade modulus (k) in column 16are relative indications of strengths fromplate-bearing tests wh en u sed in rigid p ave-ment design. Actual test values should beused for this purpose instead of the ap-proximate values show n in the tabulation.
For w earing surfaces on u nsurfaced r oads,slightly plastic sand-clay-gravel mixtures(GC) are generally considered the m ost satis-factory. However, they should not contain toolarge a percentage of fines, and the PI shou ldbe in the range of 5 to about 15.
Frost Action
The relative effects of frost action on thevarious soil groups are shown in colum n 10.Regardless of the frost susceptibility of thevarious soil groups, two conditions must bepresent simultaneously before frost action isa m ajor consideration. These are-
A source of water during the freezingperiod.A sufficient period for th e freezingtemperature to penetrate the ground.
Water necessary for the formation of ice
lenses may become available from a highground water table, a capillary supp ly, waterheld within the soil voids, or through infiltra-tion. The d egree of ice formation tha t w illoccur is marked ly influenced by p hysical fac-tors, such as—
Topographic position.
Stratification of the parent soil,Transitions into a cut section.Lateral flow of water from side cuts.Localized pockets of perched ground-water,Drainage conditions.
In general, the silts and fine silty sands a remost susceptible to frost. Coarse-grainedmaterials with little or no fines are affectedonly slightly or not at all. Clays ((CL) and(CH)) are subject to frost action, bu t the loss of strength of such m aterials may not be asgreat as for silty soils. Inorganic soils con-taining less than 3 percent (by w eight) of grains finer than 0.02 mm in diameter areconsidered non frost-susceptible. Wherefrost-susceptible soils occur in subgrades andfrost is a problem, tw o acceptable meth ods of pavem ent d esign are available:
Place a su fficient d epth of acceptablegranu lar material over the soils tolimit the depth of freezing in the sub-grade and thereby prevent the det-rimental effects of frost action.Use a d esign load capacity during theperiod of the year when freezing con-ditions are expected.
In the second case, design is based on thereduced strength of the subgrade d uring the
frost-melting period. Often an appropriatedrainage measure to prevent the accumula-tion of water in the soil pores help s limit icedevelopment in the subgrade and subbase.
Compression
The comp ression or consolidat ion of soilsbecomes a d esign factor p rimarily w henheavy fills are made on compressible soils.The two typ es of compression are—
Relatively long-term compression orconsolidation under the dead weight
of the structure.Short-term comp ression an d reboundund er moving wheel loads.
If adequate p rovision is mad e for this typeof settlement during construction, it will havelittle influence on th e load -carrying capacity
Soil Classification 5-13
8/8/2019 Soil Classification 5-8
http://slidepdf.com/reader/full/soil-classification-5-8 14/36
FM 5-410
of the pavemen t. However, when elastic soilssubject to compression and rebound underwh eel loads are encountered, adequateprotection m ust be pr ovided . Even smallmovements of this type soil may be detrimen-tal to the base and wearing course of pavements. Fortunately, the free-draining,coarse-grained soils ((GW), (GP), (SW), and
(SP)), which generally make the best sub-grade and subbase materials, exhibit almostno tend ency toward high compressibility orexpansion. In general, the compressibility of soil increases with an increasing LL. How-ever, compressibility is also influenced by soilstructure, grain shape, previous loading his-tory, and other factors not evaluated in theclassification system. Undesirable compres-sion or expansion characteristics may bereduced by distributing the load through agreater th ickness of overlying m aterial.These factors are adequately handled by the
CBR method of design for flexible pavements.However, rigid pavements may require theadd ition of an acceptable base course und erthe pavement.
DrainageThe drainage characteristics of soils are a
direct reflection of their permeability. Theevaluation of d rainage characteristics for usein roads and ru nw ays is shown in colum n 12of Table 5-3 , page 5-11. The presence of waterin base, subbase, and subgrade m aterials, ex-
cept for free-draining, coarse-grained soils,may cause pore water pressures to developresulting in a loss of strength. The water m aycome from infiltration of groundwater or rain-water or by capillary rise from an un derlyingwater table. While free-draining m aterialspermit rap id d raining of water, they also per-mit rap id ingress of water. If free-drainingmaterials are adjacent to less perviousmaterials and become inun dated w ith water,they may serve as reservoirs. Adjacent,poorly drained soils may become saturated.The gravelly and sandy soils with little or no
fines (groups (GW), (GP), (SW), (SP)) have ex-cellent drainage characteristics. The (GMd)and (SMd) group s have fair to poor drain-age characteristics, wh ereas the (GMu),(GC), (SMu ), and (SC) groups have verypoor drainage characteristics or are practi-cally impervious. Soils of the (ML), (MH),and (Pt) group s have fair to poor drainage
characteristics. All other groups have poordrainage characteristics or are p ractically im-pervious.
Compaction
Comp acting soils for road s and airfields re-quires attaining a high d egree of den sity
during construction to prevent detrimentalconsolidation from occurring under anemban kmen t’s weight or und er traffic. In ad -dition, compaction reduces the detrimentaleffects of water. Processed materials, such ascrushed rock, are often used as a base courseand require special treatment during com-paction. Types of comp action equ ipmen t thatmay be u sed to achieve the desired soil den-sities are show n in Table 5-3 , column 13, page5-11. For some of the soil groups, severaltypes of equipment are listed because varia-tions in soil type within a group may require
the use of a specific type of compaction equip-ment. On some construction projects, morethan one type of compaction equipm ent maybe necessary to produce the desired densities.For example, recommendations include—
Steel-wheeled rollers for angularmaterials with limited amounts of fines.Crawler-type tractor or ru bber-tiredrollers for gravels and san d.Sheepsfoot rollers for coarse-grainedor fine-grained soils having some
cohesive qualities.Rubber-tired rollers for final compac-tion operations for most soil exceptthose with a high LL (group H ).
Suggested minimum weights of the varioustypes of equipment are shown in note 2 of Table 5-3, page 5-11. Column 14 shows rangesof un it dry w eight for soil compacted accord-ing to the moisture-density testingprocedures outlined in Military Standard621A, method 100. These va lues ar e includ edprimarily for guidance; base design or controlof construction should be based on laboratorytest results.
D ESIRABLE SO IL PROPERTIES FOREMBANKMENTS AND FOUND ATIONS
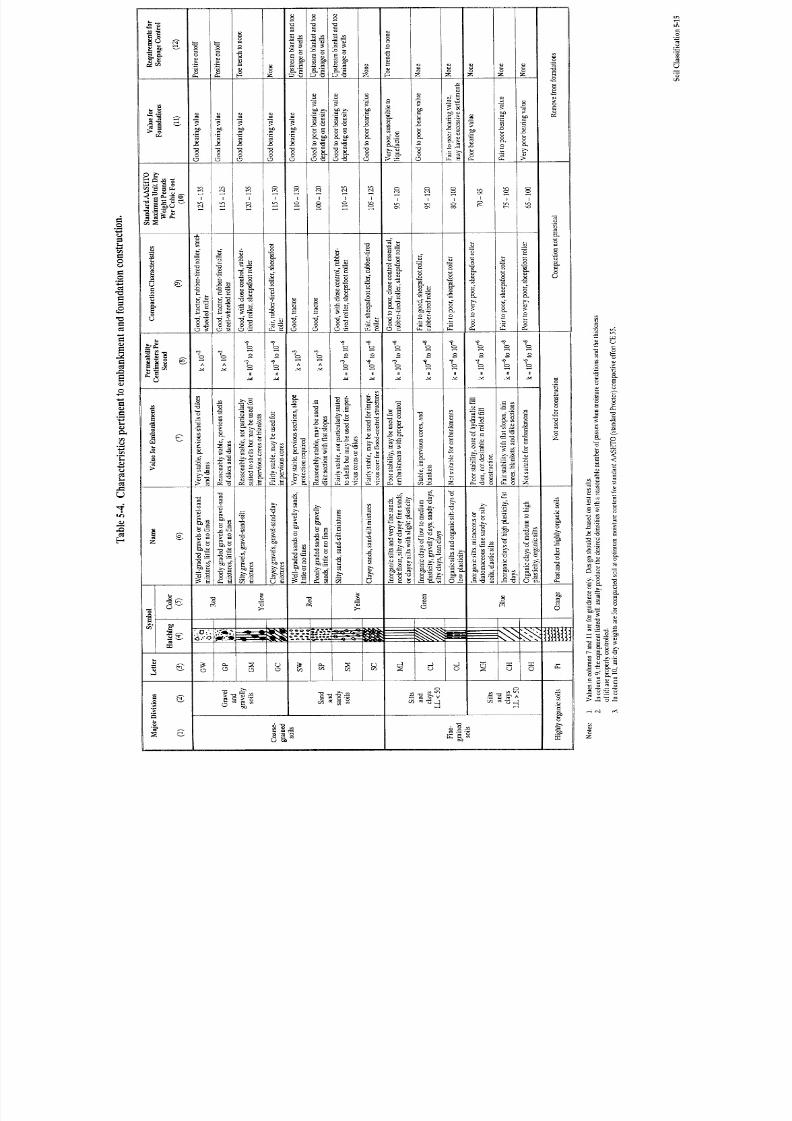
Table 5-4 lists the soil characteristics per-tinent to embankment and foundation
Soil Classification 5-14
8/8/2019 Soil Classification 5-8
http://slidepdf.com/reader/full/soil-classification-5-8 15/36
8/8/2019 Soil Classification 5-8
http://slidepdf.com/reader/full/soil-classification-5-8 16/36
FM 5-410
Soil Classi fication 5-16
8/8/2019 Soil Classification 5-8
http://slidepdf.com/reader/full/soil-classification-5-8 17/36
FM 5-410
construction. After the soil has been clas-sified, look at column 3 and follow itdow nw ard to the soil class. Table 5-4 , page5-15, contains the same type of information asTable 5-3 , page 5-11, except that colum n 8lists the soil permeability and colum n 12 listspossible measures to control seepage.Material not pertinent to embankments andfoundations, such as probable CBR values,are not contained in Table 5-4, page 5-15.Both tables are used in the same manner.Read the notes at the bottom of both tablescarefully.
SOIL GRAPHICSIt is customary to p resent the results of
soils explorations on drawings as schematicrepresentations of the borings or test pits oron soil profiles with th e various soils en-countered shown by appropriate symbols.One app roach is to write the group letter sym-bol in the appropriate section of the log. As analternative, hatching symbols shown incolumn 4 of Table 5-3 , page 5-11, may beused. In add ition, show the natu ral watercontent of fine-grained soils along the side of the log. Use other descriptive remarks as ap-propriate. Colors may be used to delineatesoil types on maps and draw ings. A sug-gested color scheme to show the major soilgroup s is described in colum n 5. Boring logs
are discussed in more detail in Chapter 3.Soil graphics generated in terrain studiesusually use numeric symbols, each of whichrepresents a USCS soil type.
FIELD IDENTIFICATION
The soil types of an area are an imp ortantfactor in selecting the exact location of air-fields and roads. The military engineer,construction foreman, and members of en-gineer reconnaissance parties must be able toidentify soils in the field so that the engineer-
ing characteristics of the various soil typesencountered can be compared. Because of theneed to be economical in time, personnel,equipm ent, materiel, and money, selection of the p roject site mu st be mad e with th ese fac-tors in mind. Lack of time and facilities oftenmake laboratory soil testing impossiblein military construction. Even where
laboratory tests are to follow, field identifica-tion tests must be mad e du ring the soilexploration to distinguish between the dif-ferent soil types encountered so thatdu plication of samples for laboratory testingis minim ized. Several simp le field id entifica-tion tests are described in this manual. Eachtest may be performed with a minimum of time and equipment, although seldom will allof them be requ ired to identify a given soil.The number of tests required d epends on thetype of soil and the exper ience of the in-dividual performing them. By using thesetests, soil prop erties can be estimated andmaterials can be classified. Such classifica-tions are app roximations and shou ld not beused for designing permanent or semiper-manent construction.
ProceduresThe best way to learn field identification is
under the guidance of an experienced soilstechnician. To learn withou t su ch assistance,systematically compare laboratory testresults for typical soils in each group with the“feel” of these soils at various m oisture con-tents.
An app roximate identification of a coarse-grained soil can be made by spreading a d rysamp le on a flat surface and examining it,
noting particularly grain size, gradation,grain shape, and particle hardness. Alllumps in the sample must be thoroughly pul-verized to expose individual grains and toobtain a uniform m ixture w hen w ater isadded to the fine-grained portion. A rubber-faced or w ooden p estle and a mixing bowl isrecommended for pulverizing. Lumps mayalso be pulverized by p lacing a portion of thesample on a firm, smooth surface and usingthe foot to mash it. If an iron p estle is used forpu lverizing, it w ill breakup the m ineral
grains and change the character of the soil;therefore, using an iron pestle is discouraged.
Tests for iden tification of the fine-g-rainedportion of any soil are performed on the por-tion of the material that passes a Number 40sieve. This is the same soil fraction used inthe laboratory for Atterberg limits tests, such
8/8/2019 Soil Classification 5-8
http://slidepdf.com/reader/full/soil-classification-5-8 18/36
FM 5-410
as plasticity. If this sieve is not available, arough separation may be made by spreadingthe material on a flat surface and removingthe gravel and larger sand particles. Fine-grained soils are examined p rimarily forcharacteristics related to plasticity.
EquipmentPractically all the tests to be d escribed m ay
be performed with no equipment or acces-sories other than a small amount of water.However, the accuracy and uniformity of results is greatly increased by the pr oper u seof certain equipment. The following equip-ment is available in nearly all engineer units(or may be improvised) and is easilytransported:
A Number 40 US standard sieve.
Any screen w ith about 40 openingsper lineal inch could be used , or anapproximate separation may be u sedby sorting the materials by hand.Nu mber 4 and N um ber 200 sieves areuseful for separa ting gravels, sand s,and fines.A pick and shovel or a set of entrenching tools for obtaining sam-ples. A han d earth au ger is useful if samp les are desired from depth s morethan a few feet below the su rface.
A spoon issued as part of a messequipment for obtaining samples andfor mixing materials with water todesired consistency.A bayonet or pocket knife for obtain-ing samples and trimming them tothe d esired size.A small mixing bowl w ith a rubber-faced or w ooden pestle for p ulverizingthe fine-grained portion of the soil.Both may be improv ised by using acanteen cup and a wooden dowel.
Several sheets of heavy nonabsorbentpap er for rolling samp les.A pan and a heating element fordrying samples.A balance or scales for weighingsamples.
FactorsThe soil prop erties that form the basis for
the Unified Soil Classification System arethe—
Percentage of gravels, sands, andfines.Shape of the grain-size distributioncurve.Plasticity.
These same prop erties are to be consid eredin field identification. Other characteristicsobserved shou ld also be included in d escrib-ing the soil, whether th e iden tification ismade by field or laboratory methods.
Properties normally includ ed in a d escrip-tion of a soil are—
Color.
Grain size, including estimated max-imum grain size and estimated percentby w eight of fines (material passingthe N um ber 200 sieve),Gradation.Grain shape.Plasticity.Predominant type.Secondary components.Classification symbol.Other remarks, such as organic,chemical, or metallic content; com-pactness; consistency; cohesivenessnear PL; dry strength; and source—residual or transported (such aseolian, water-borne, or glacial de-posit).
An example of a soil description using thesequence and considering the p ropertiesreferred to above might be—
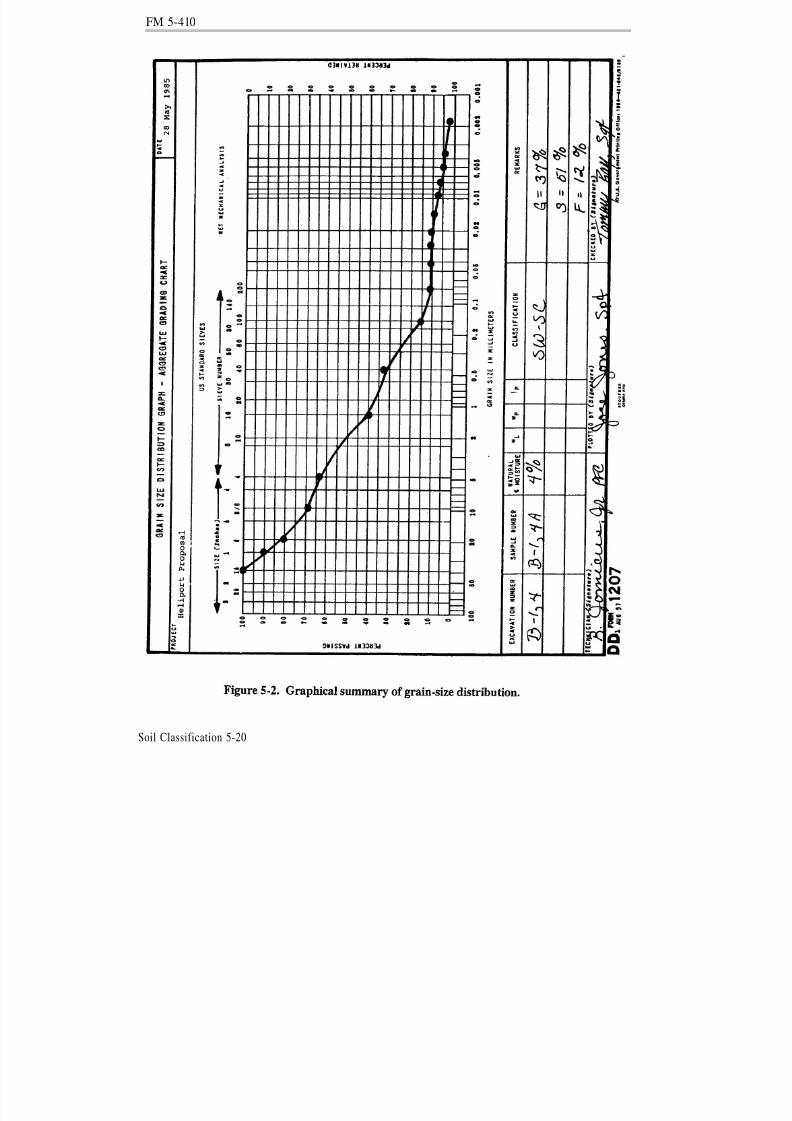
Dark brown to w hite.Coarse-grained soil, maximum par-ticle size 2 ¾ inches, estimating 60percent gravel, 36 percent sand, and
4 percent p assing th e Nu mber 200sieve.Poorly graded (insufficient fine gravel,gap-graded).Gravel particles subrounded torounded.
Soil Classi fication 5-18
8/8/2019 Soil Classification 5-8
http://slidepdf.com/reader/full/soil-classification-5-8 19/36
FM 5-410
Nonplastic.Predominan tly gravel.Considerable sand and a smallamou nt of n onp lastic fines (silt).(GP)Slightly calcareous, no dry strength,dense in the und isturbed state.
A complete description with the proper clas-sification symbol conveys much more to thereader than the symbol or any other isolatedportion of the description u sed alone.
Tests
The following tests can be performed to aidin field identification of soils:
Visual Examinat ion Test. Determine th ecolor, grain size, and grain shape of the
coarse-grained por tion of a soil by visual ex-amination, The grain-size distribution maybe estimated . To observe these properties,dry a sample of the material and spread it ona flat su rface.
In soil surveys in the field, color is oftenhelpful in distinguishing am ong various soilstrata, and from experience with local soils,color m ay aid in iden tifying soil types. Sincethe color of a soil often varies with its mois-ture content, the condition of the soil whencolor is determined must always be recorded.Generally, more contrast occur s in thesecolors when the soil is moist, with all thecolors becoming lighter as the moisture con-tents are reduced. In fine-grained soils,certain dark or d rab shad es of gray or brow n(includ ing alm ost-black colors) are ind icativeof organ ic colloidal matter ((OL) and (OH)).In contrast, clean and bright-looking colors(including med ium and light gray, olivegreen, brown, red, yellow, and wh ite) areusu ally associated with inorganic soils. Soilcolor m ay also ind icate the presence of certain
chemicals. Red, yellow, and yellowish-brow nsoil may be a r esult of the presence of ironoxides. White to p inkish colors m ay ind icatethe presence of considerable silica, calciumcarbonate, or (in som e cases) alum inum com-pounds. Grayish-blue, gray, and yellowmottled colors frequently indicate poordrainage.
Estimate the maximum particle size foreach sample, thereby establishing the upperlimit of the grain-size distribution curve forthat sample. The naked eye can normally dis-tinguish the individual grains of soil down toabout 0,07 mm. All particles in the gravel andsand ranges are visible to the naked eye.
Most of the silt particles are smaller than thissize and are invisible to the naked eye.Material smaller than 0.75 mm will pass theNu mber 200 sieve.
Perform the laboratory mechanicalanalysis whenever the grain-size distribu tionof a soil sample must be determined accu-rately; however, the grain-size distributioncan be approximated by visual inspection.The best way to evaluate a material withoutusing laboratory equipm ent is to spread a
portion of the dry sample on a flat surface.Then, using your hands or a piece of paper,separate the material into its various grain-size components. By this method, the gravelparticles and some of the sand par ticles canbe separated from the remaind er. This will atleast give you an op portu nity to estimatewhether the total sample is to be consideredcoarse-grained or fine-grained, depending onwhether or not more than 50 percent of thematerial would pass the Number 200 sieve.Percentage of values refers to the dry weightof the soil fractions ind icated as compar ed tothe d ry w eight of the original samp le. Agraphical summary of the procedure is shownin Figure 5-2 , page 5-20.
If you believe the material is coarse-grained, then consider the following criteria:
Does less than 5 percent p ass theNumber 200 sieve?Are the fines nonplastic?
If both criteria can be satisfied and thereapp ears to be a good representation of allgrain sizes from largest to smallest, withoutan excessive deficiency of any one size, thematerial may be said to be well-graded ((GW)or (SW)). If any intermed iate sizes app ear tobe missing or if there is too mu ch of any onesize, then th e material is poor ly graded ((GP)or (SP)). In some cases, it may only be
Soil Classification 5-19
8/8/2019 Soil Classification 5-8
http://slidepdf.com/reader/full/soil-classification-5-8 20/36
FM 5-410
Soil Classification 5-20
8/8/2019 Soil Classification 5-8
http://slidepdf.com/reader/full/soil-classification-5-8 21/36
FM 5-410
possible to take a few of the standard sievesinto the field. When this is the case, take theNumber 4, Number 40, and Number 200sieves. The sample may be separated intogravels, sand s, and fines by use of the Nu m-ber 4 and Nu mber 200 sieves. However, if there is a considerable qu antity of fines, par-
ticularly clay particles, separation of the finescan only be readily accomplished by washingthem through the N um ber 200 sieve. In suchcases, a determination of the percentage of fines is made by comparing the dry weight of the original samp le with that retained on theNu mber 200 sieve after washing. The d if-ference between these two is the weight of thefines lost in the washing process. To deter-mine the plasticity, use only that portion of the soil passing through a N um ber 40 sieve.
Estimating the gra in-size distribution of asample using no equipm ent is probably themost difficult part of field id entification andplaces great importance on the experience of the individu al making the estimate. A betterapproximation of the relative proportions of the comp onents of the finer soil fraction m aysometimes be obtained by shaking a portionof this sample into a jar of water and allowingthe m aterial to settle. It w ill settle in layers,with th e gravel and coarse sand p articles set-tling out almost immediately. The fine sandparticles settle within a minute; the silt par-ticles require as much as an hou r; and the clay
particles remain in suspension indefinitely orun til the water is clear. In u sing this method ,remember that th e gravels and sands settleinto a mu ch more dense formation than eitherthe silts or clays.
The grain shap e of the sand and gravel par-ticles can be determ ined by close examinationof the individual grains. The grain shape af-fects soil stability because of the increasedresistance to displacement found in the moreirregular particles. A material with roundedgrains has only the friction between the su r-
faces of the particles to help hold them inplace. An angular material has this samefriction force, which is increased by th e rough-ness of the surface. In addition, aninterlocking action is developed betw een thepar ticles, wh ich gives the soil mu ch greaterstability.
A complete description of a soil should in-clude prominent characteristics of theund isturbed material. The aggregate p roper-ties of sand and gravel are describedqualitatively by the terms “loose,” “medium,”and “dense.” Clays are d escribed as “hard ,”“stiff,” “medium, ” and “soft.”
These characteristics are usu ally evaluatedon th e basis of several factors, includ ing therelative ease or difficulty of advancing thedrilling and sampling tools and the consis-tency of the samples. In soils that aredescribed as “soft,” there should be an indica-tion of wheth er the m aterial is loose andcompressible, as in an area under cultivation,or spongy (elastic), as in high ly organ ic soils.The moisture condition at the time of evalua-tion influences these cha racteristics andshould be includ ed in the r eport.
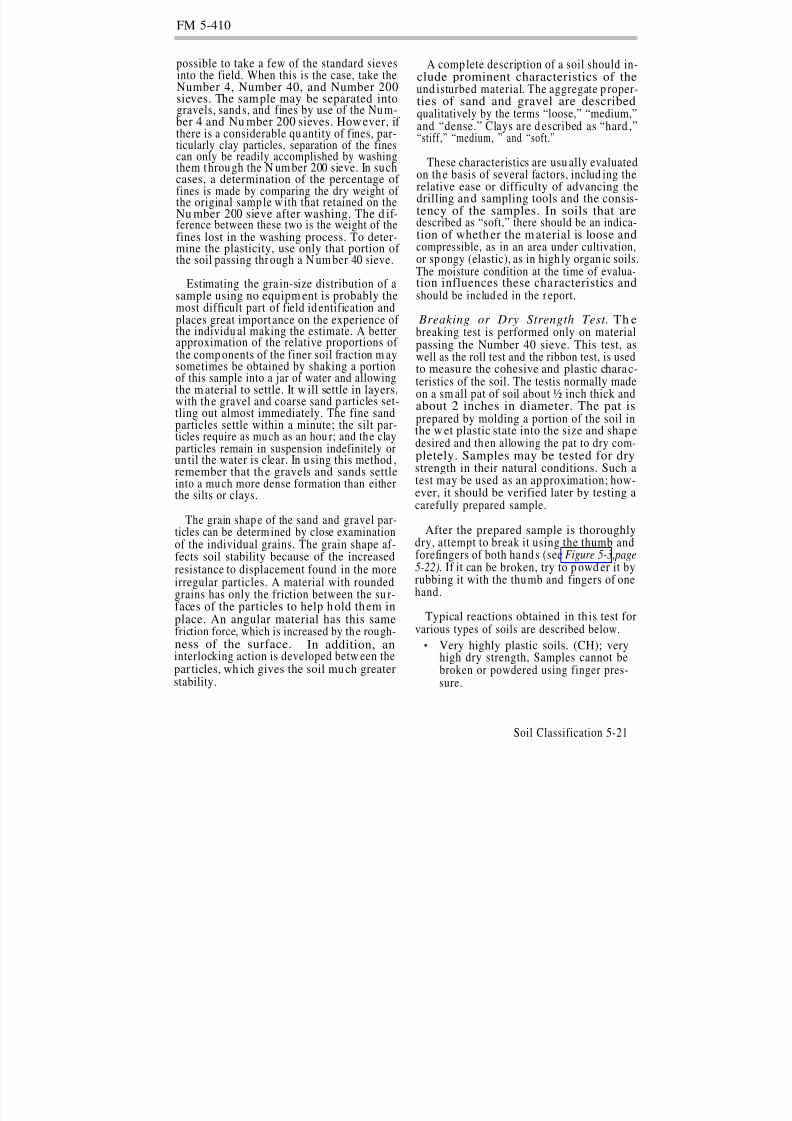
Breaking or Dry Strength Test. Th ebreaking test is performed only on materialpassing the Number 40 sieve. This test, aswell as the roll test and the ribbon test, is usedto measure the cohesive and plastic charac-teristics of the soil. The testis normally madeon a sm all pat of soil about ½ inch thick andabout 2 inches in diameter. The pat isprepared by molding a portion of the soil inthe wet plastic state into the size and shap edesired and th en allowing the pat to dry com-
pletely. Samples may be tested for drystrength in their natural conditions. Such atest may be used as an ap proximation; how-ever, it should be verified later by testing acarefully prepared sample.
After the prepared sample is thoroughlydry, attempt to break it using the thumb andforefingers of both hand s (see Figure 5-3 ,page5-22). If it can be broken, try to p owd er it byrubbing it with the thumb and fingers of onehand.
Typical reactions obtained in th is test forvarious types of soils are described below.
Very highly plastic soils. (CH); veryhigh dry strength, Samples cannot bebroken or powdered using finger pres-sure.
Soil Classification 5-21
8/8/2019 Soil Classification 5-8
http://slidepdf.com/reader/full/soil-classification-5-8 22/36
FM 5-410
Highly plastic soils, (CH); high drystrength. Samples can be broken withgreat effort but cannot be pow-dered.Medium plastic soils, (CL); mediumdry strength. Samples can be brokenand p owd ered with some effort.Slightly plastic soils, (ML), (MH), or(CL); low dry strength. Samples canbe broken quite easily and powd eredreadily.Nonplastic soils, (ML) or (MH); verylittle or no dry strength. Samplescrumble and p owd er on being pickedup in the hands.
The breaking or dry strength test is one of the best tests for distinguishing betweenplastic clays and nonplastic silts or finesands. However, a word of caution is ap-propriate. Dry pats of highly p lastic claysquite often display shrinkage cracks. Break-ing the sample along one of these cracks givesan ind ication of only a very small part of thetrue dry strength of the clay. It is importantto distinguish between a break along such acrack and a clean, fresh break that indicatesthe true dry strength of the soil.
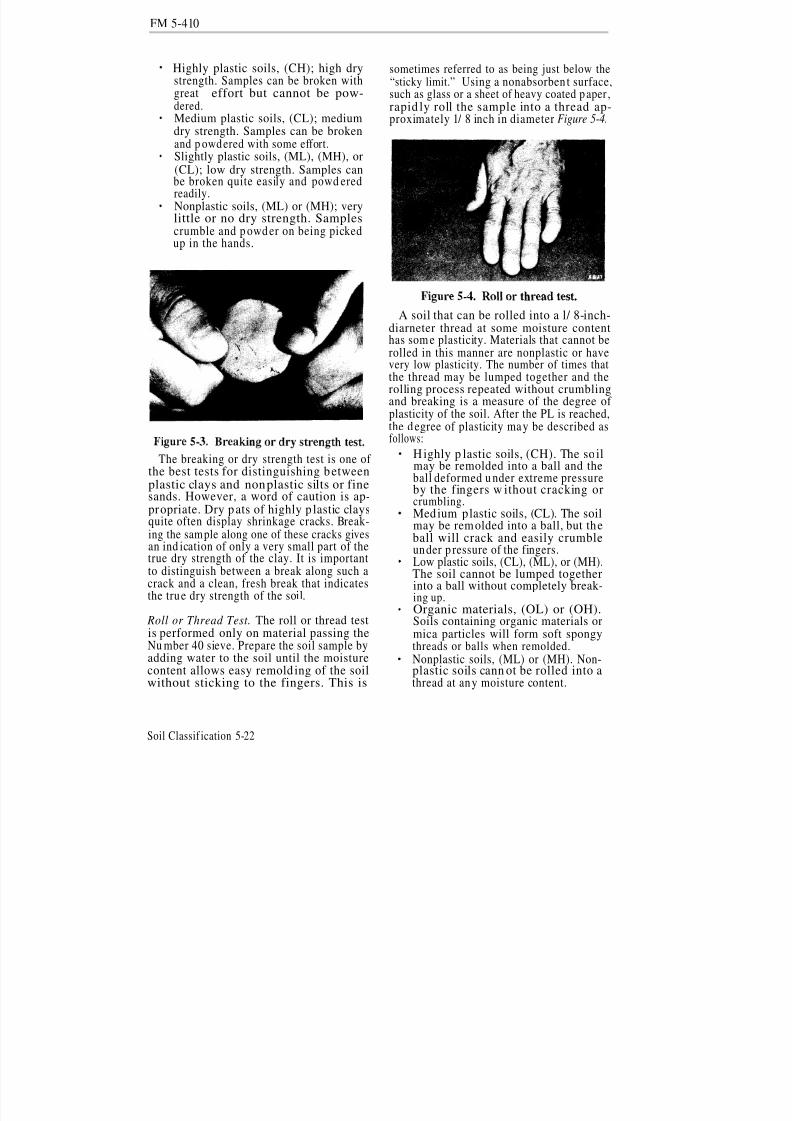
Roll or Thread Test. The roll or thread testis performed only on material passing theNu mber 40 sieve. Prepare the soil sample byadding water to the soil until the moisturecontent allows easy remold ing of the soilwithout sticking to the fingers. This is
Soil Classif ication 5-22
sometimes referred to as being just below the“sticky limit.” Using a nonabsorben t surface,such as glass or a sheet of heavy coated p aper ,rapid ly roll the sample into a thread ap-proximately 1/ 8 inch in diameter Figure 5-4.
A soil that can be rolled into a l/ 8-inch-diarneter thread at some moisture contenthas som e plasticity. Materials that cannot berolled in this manner are nonplastic or havevery low plasticity. The number of times thatthe thread may be lumped together and therolling process repeated without crumblingand breaking is a measure of the degree of plasticity of the soil. After the PL is reached,the d egree of plasticity may be described asfollows:
Highly p lastic soils, (CH). The soilmay be remolded into a ball and theball deformed u nder extreme pressureby the fingers w ithout cracking orcrumbling.Medium plastic soils, (CL). The soilmay be remolded into a ball, but theball will crack and easily crumbleunder p ressure of the fingers.Low plastic soils, (CL), (ML), or (MH).The soil cannot be lumped togetherinto a ball without completely break-ing up.
Organic materials, (OL) or (OH).Soils containing organic materials ormica particles will form soft spongythreads or balls when remolded.Nonplastic soils, (ML) or (MH). Non-plastic soils cann ot be rolled into athread at any moisture content.
8/8/2019 Soil Classification 5-8
http://slidepdf.com/reader/full/soil-classification-5-8 23/36
FM 5-410
From this test, the cohesiveness of thematerial near the PL may also be described asweak, firm , or tough. The higher the p ositionof a soil on the plasticity chart, the stiffer arethe threads as they dry out and the tougherare the lumps if the soil is remolded after roll-
ing.
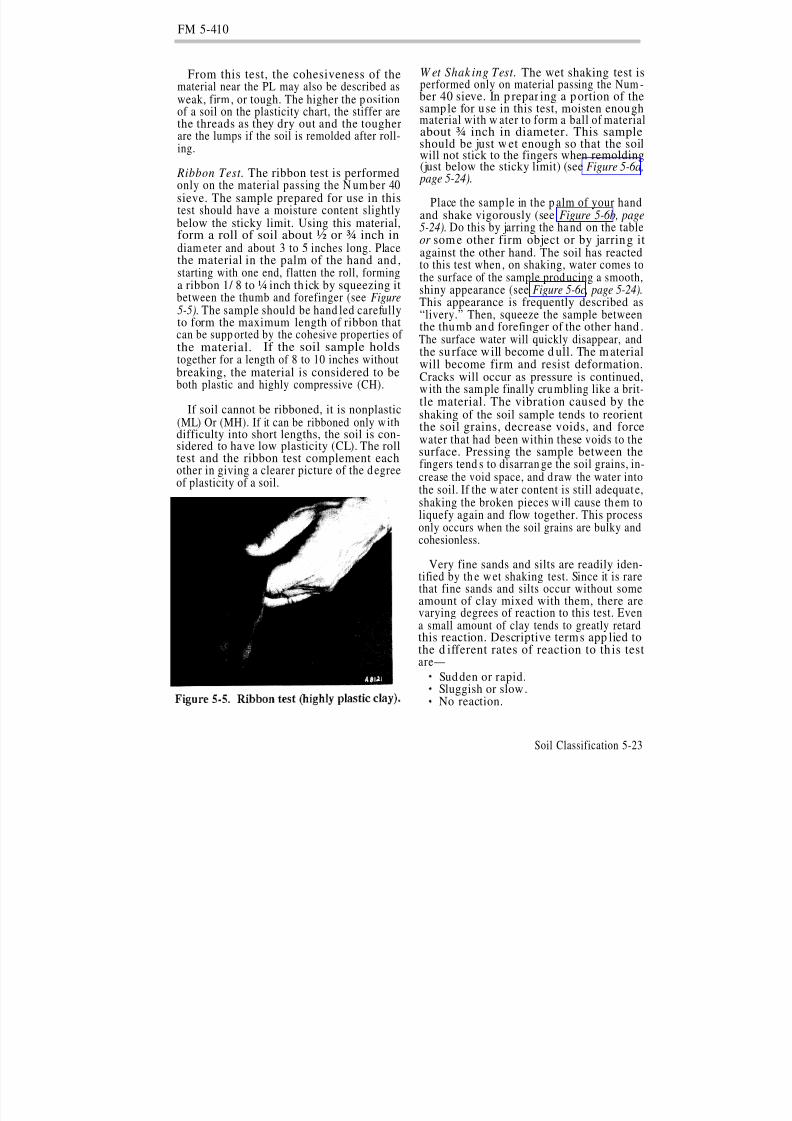
Ribbon Test. The ribbon test is performedonly on the material passing the N um ber 40sieve. The sample prepared for use in thistest should have a moisture content slightlybelow the sticky limit. Using this material,form a roll of soil about ½ or ¾ inch indiam eter and about 3 to 5 inches long. Placethe material in the palm of the hand and ,starting with one end, flatten the roll, forminga ribbon 1/ 8 to ¼ inch th ick by squeezing it
between the thumb and forefinger (see Figure5-5). The sample should be hand led carefullyto form the maximum length of ribbon thatcan be supp orted by the cohesive properties of the material. If the soil sample holdstogether for a length of 8 to 10 inches withoutbreaking, the material is considered to beboth plastic and highly compressive (CH).
If soil cannot be ribboned, it is nonplastic(ML) Or (MH). If it can be ribboned only w ithdifficulty into short lengths, the soil is con-sidered to have low plasticity (CL). The rolltest and the ribbon test complement eachother in giving a clearer picture of the d egreeof plasticity of a soil.
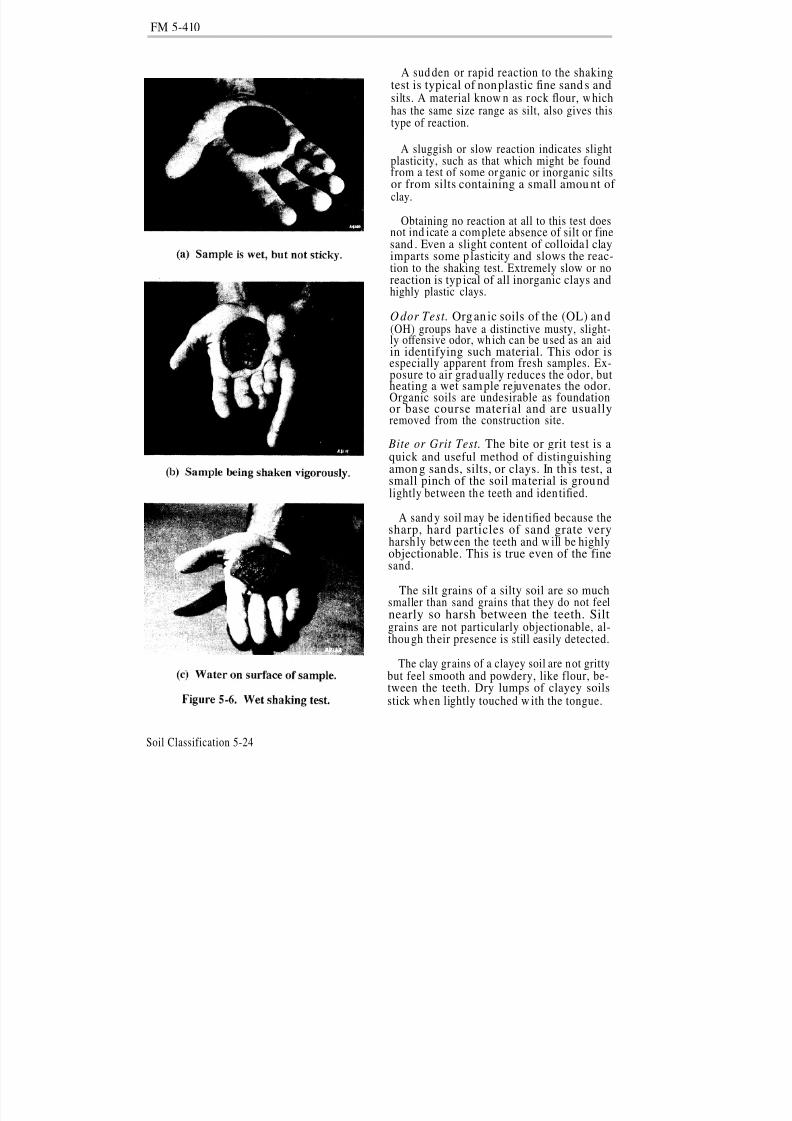
W et Shak ing Test. The wet shaking test isperformed only on material passing the Num -ber 40 sieve. In p repar ing a portion of thesample for use in this test, moisten enoughmaterial with w ater to form a ball of materialabout ¾ inch in diameter. This sampleshould be just w et enough so that the soilwill not stick to the fingers when remolding(just below the sticky limit) (see Figure 5-6a, page 5-24).
Place the samp le in the p alm of your handand shake vigorously (see Figure 5-6b , page5-24). Do this by jarring the hand on the tableor some other firm object or by jarring itagainst the other hand. The soil has reactedto this test when , on shaking, water comes tothe surface of the sample prod ucing a smooth,shiny appearance (see Figure 5-6c, page 5-24).
This appearance is frequently described as“livery.” Then, squeeze the sample betweenthe thumb and forefinger of the other hand .The surface water will quickly disappear, andthe su rface will become d ull. The materialwill become firm and resist deformation.Cracks will occur as pressure is continued,with the sam ple finally crumbling like a brit-tle material. The vibration caused by theshaking of the soil sample tends to reorientthe soil grains, decrease voids, and forcewater that had been within these voids to the
surface. Pressing the sample between thefingers tend s to disarran ge the soil grains, in-crease the void space, and d raw the water intothe soil. If the w ater content is still adequate,shaking the broken pieces will cause them toliquefy again and flow together. This processonly occurs when the soil grains are bulky andcohesionless.
Very fine sands and silts are readily iden-tified by th e wet shaking test. Since it is rarethat fine sands and silts occur without some
amount of clay mixed with them, there arevarying degrees of reaction to this test. Evena small amount of clay tends to greatly retardthis reaction. Descriptive terms app lied tothe d ifferent rates of reaction to th is testare—
Sud den or rapid.Sluggish or slow.No reaction.
Soil Classification 5-23
8/8/2019 Soil Classification 5-8
http://slidepdf.com/reader/full/soil-classification-5-8 24/36
FM 5-410
Soil Classification 5-24
A sud den or rapid reaction to the shakingtest is typical of nonplastic fine sand s andsilts. A material know n as rock flour, whichhas the same size range as silt, also gives thistype of reaction.
A sluggish or slow reaction indicates slightplasticity, such as that which might be foundfrom a test of some organic or inorganic siltsor from silts containing a small amou nt of clay.
Obtaining no reaction at all to this test doesnot ind icate a complete absence of silt or finesand . Even a slight content of colloidal clayimparts some p lasticity and slows the reac-tion to the shaking test. Extremely slow or noreaction is typ ical of all inorganic clays andhighly plastic clays.
Odor Test. Organ ic soils of the (OL) and(OH) groups have a distinctive musty, slight-ly offensive odor, wh ich can be u sed as an aidin identifying such material. This odor isespecially apparent from fresh samples. Ex-posure to air grad ually reduces the odor, butheating a wet sample rejuvenates the odor.Organic soils are undesirable as foundationor base course material and are usuallyremoved from the construction site.
Bite or Grit Test. The bite or grit test is a
quick and useful method of distinguishingamon g sands, silts, or clays. In th is test, asmall pinch of the soil material is groundlightly between the teeth and iden tified.
A sand y soil may be iden tified because thesharp, hard particles of sand grate veryharsh ly between the teeth and w ill be highlyobjectionable. This is true even of the finesand.
The silt grains of a silty soil are so much
smaller than sand grains that they do not feelnearly so harsh between the teeth. Siltgrains are not particularly objectionable, al-thou gh their presence is still easily detected.
The clay grains of a clayey soil are not grittybut feel smooth and powdery, like flour, be-tween the teeth. Dry lumps of clayey soilsstick wh en lightly touched w ith the tongue.
8/8/2019 Soil Classification 5-8
http://slidepdf.com/reader/full/soil-classification-5-8 25/36
FM 5-410
Slaking Test. The slaking test is u seful indeterm ining the qu ality of certain shales andother soft rocklike materials. The test is per-formed by placing the soil in the sun or in anoven to dry and then allowing it to soak inwater for a period of at least 24 hours. Thestrength of the soil is then examined . Certain
types of shale comp letely d isintegra te, losingall strength.
Other materials that appear to be durablerocks may be crumbled and readily broken byhand after su ch soaking. Materials that havea considerable redu ction in strength are u n-desirable for use as base course materials.
Acid Test. The acid test is used to determinethe p resence of calcium carbonate. It is per-formed by placing a few d rops of HC1 on apiece of soil. A fizzing reaction (efferves-
cence) to this test indicates the presence of calcium carbonate.
CAUTION
HC1 may cause burns. Use appropriate measuresto protect the skin and eyes. If it is splashed onthe skin or in the eyes, immediately flush withwater and seek medical attention.
Calcium carbonate is norm ally desirable ina soil because of the cementing action it
provid es to ad d to the soil’s stability. In somevery dry noncalcareous soils, the absorptionof the acid creates the illusion of efferves-cence. This effect can be eliminated in d rysoils by moistening the soil before applyingthe acid.
Since cementation is normally developedonly after a considerable cur ing period , it can-not be counted on for strength in mostmilitary construction. This test perm its bet-ter und erstanding of what app ears to beabnormally high strength values on fine-
grained soils that are tested in-place wherethis prop erty may exert consid erable in-fluence.
Shine Test. The shine testis another meansof measuring the plasticity characteristics of clays. A slightly m oist or d ry p iece of highlyplastic clay will give a definite shine when
ru bbed w ith a fingernail, a pocketknife blade,or any smooth m etal surface. On the otherhan d, a piece of lean clay w ill not disp lay anyshine but will remain dull.
Feel Test . The feel test is a general-purp osetest and one that requires considerable ex-
perience and practice before reliable resultscan be obtained. This test will be used moreas familiarity with soils increases. Moisturecontent and texture can be readily estimatedby u sing the feel test.
The natu ral moistu re content of a soil ind i-cates drainage characteristics, nearness to awater table, or other factors that may affectthis property. A piece of undisturbed soil istested by squ eezing it between the thu mb andforefinger to determ ine its consistency. The
consistency is described by such terms as“hard,” stiff,” “brittle,” “friabie,” “sticky,”“plastic,” or “soft.” Remold the soil by workingit in the hand s and observing any changes.By this test, the natu ral water content is es-timated relative to the LL or PL of the soil.Clays that turn almost liquid on remolding arepr obably near or above the LL. If the clay re-mains stiff and crum bles on being remolded ,the natu ral water content is below th e PL.
The term “texture,” as applied to the fine-grained portion of a soil, refers to the degree of
fineness and uniformity. Texture is describedby such expressions as “floury,” “smooth ,”“gritty,” or “sharp, “ depending on the feelwh en the soil is ru bbed between the fingers.Sensitivity to this sensation may be increasedby rubbing some of the material on a moretender skin area, such as the inside of thewrist. Fine sand will feel gritty. Typical drysilts will du st read ily and feel relatively softand silky to the touch. Clay soils are pow-dered only with difficulty but become smoothand gritless like flour.
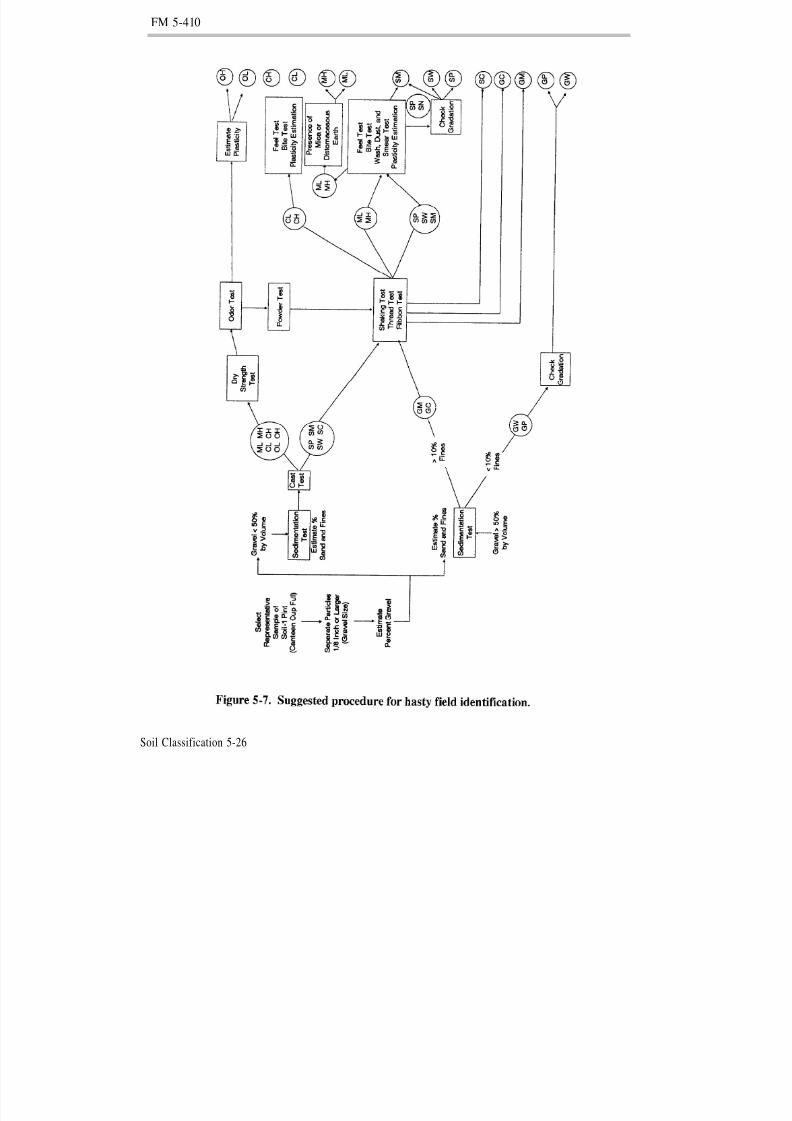
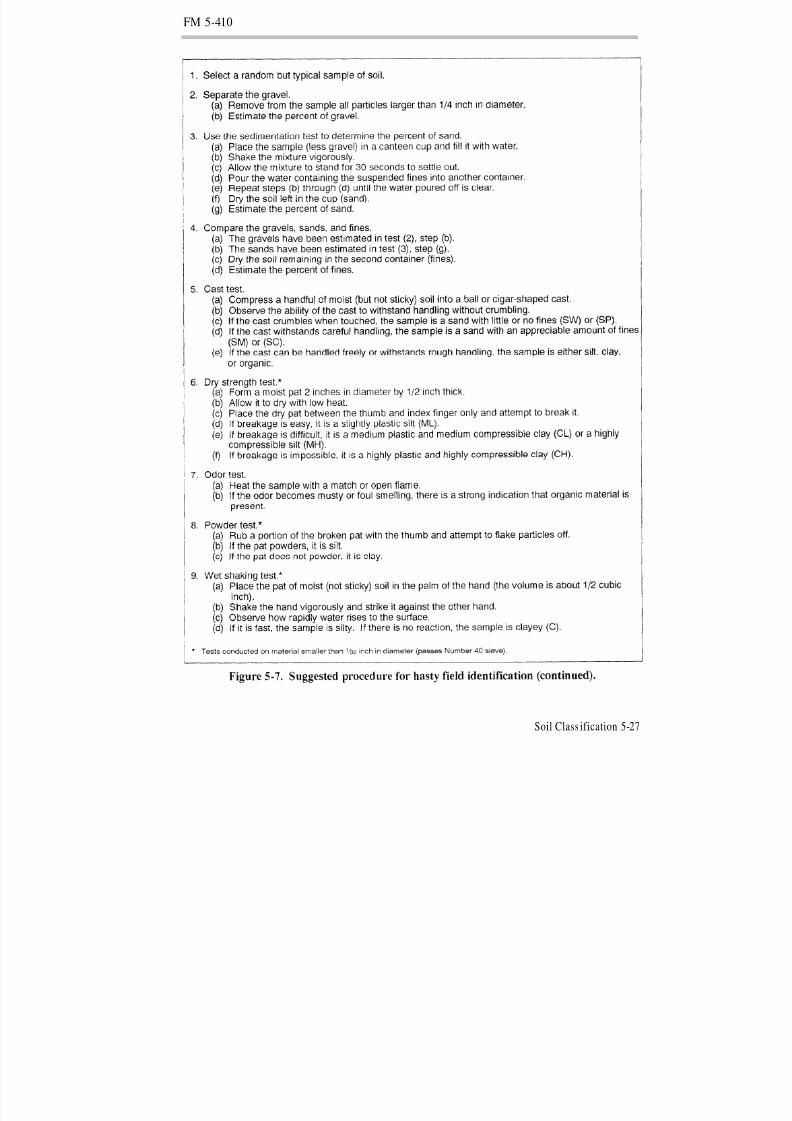
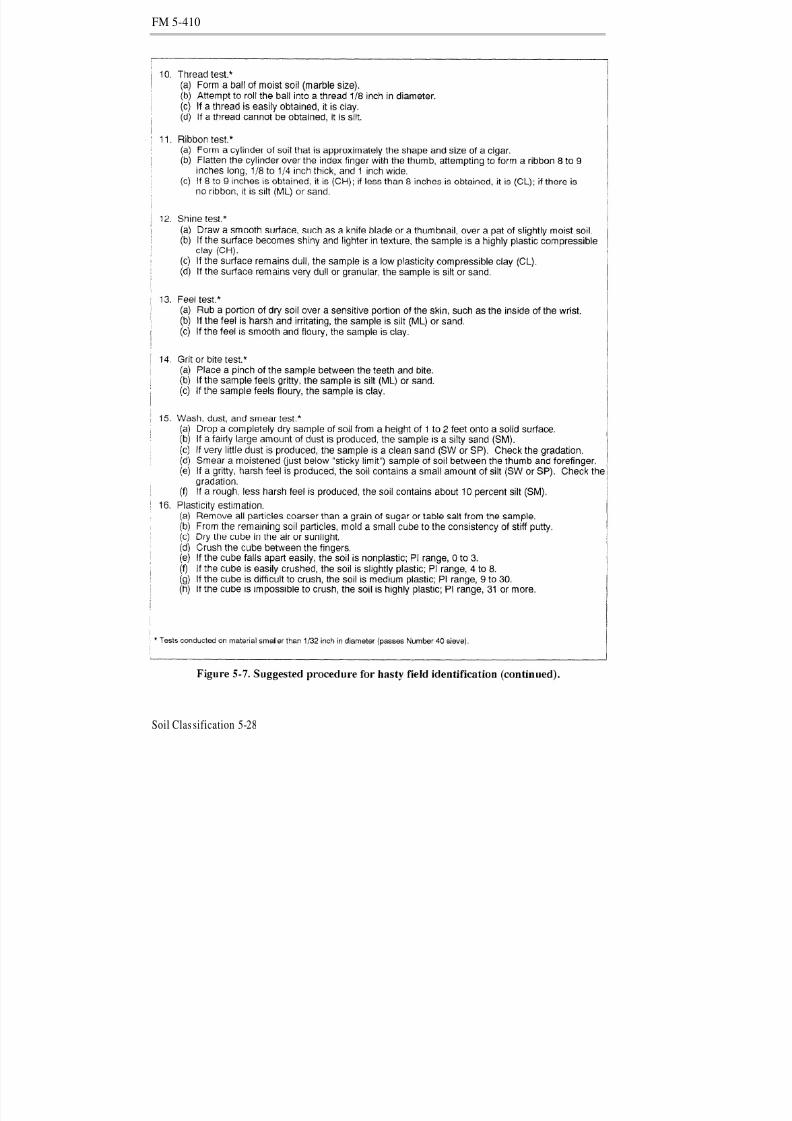
Hasty Field Iden tificationWith the standard methods of field iden-
tification supplemented with a few simplifiedfield tests, an approximate and hasty clas-sification of almost any soil can be obtained.The simple or hasty tests outlined in Fig-ure 5-7, page 5-26,w ill, for the most p art,
Soil Clas sification 5-25
8/8/2019 Soil Classification 5-8
http://slidepdf.com/reader/full/soil-classification-5-8 26/36
FM 5-410
Soil Classification 5-26
8/8/2019 Soil Classification 5-8
http://slidepdf.com/reader/full/soil-classification-5-8 27/36
FM 5-410
Soil Class ification 5-27
8/8/2019 Soil Classification 5-8
http://slidepdf.com/reader/full/soil-classification-5-8 28/36
FM 5-410
Soil Classification 5-28
8/8/2019 Soil Classification 5-8
http://slidepdf.com/reader/full/soil-classification-5-8 29/36
FM 5-410
eliminate the need for specialized equipmentsuch as sieves. The results w ill give at least atentative classification to almost any soil.The schem atic d iagram in Figure 5-7, page5-26, may be used as a guide to the testing se-quence in the process of assigning a symbol toa sample of soil.
OPTIMUM M OISTURE CONTENT (OMC)To determine whether a soil is at or near
OMC, mold a golf-ball-size sample of the soilwith your hands. Then squeeze the ball be-tween your thum b and forefinger. If the ballshatters into several fragm ents of ratheruniform size, the soil is near or at OMC. If theball flattens out w ithout breaking, the soil iswetter than OMC. If, on the other hand , thesoil is d ifficult to roil into a ball or crum blesun der very little pressure, the soil is d rier
than OMC.
Section II. Other SoilClassif ication Systems
COMMONLY USED SYSTEMSInformation about soils is available from
many sources, including publications, maps,
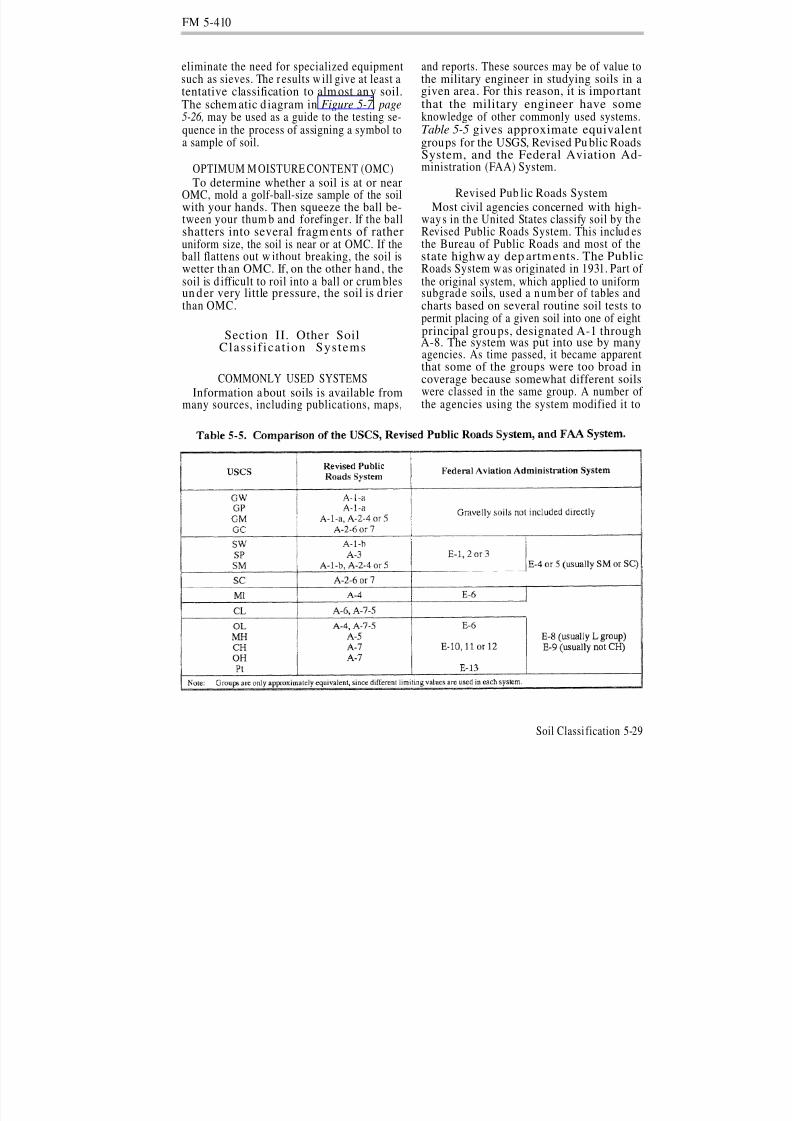
and reports. These sources may be of value tothe military engineer in studying soils in agiven area . For this reason, it is importantthat the military engineer have someknowledge of other commonly used systems.Table 5-5 gives approximate equivalentgroups for the USGS, Revised Pu blic RoadsSystem, and the Federal Aviation Ad-ministration (FAA) System.
Revised Pub lic Roads SystemMost civil agencies concerned with high-
ways in th e United States classify soil by theRevised Public Roads System. This includ esthe Bureau of Public Roads and most of thestate highw ay dep artments. The PublicRoads System w as originated in 1931. Part of the original system, which applied to uniformsubgrad e soils, used a n um ber of tables and
charts based on several routine soil tests topermit placing of a given soil into one of eightprincipal groups, designated A-1 throughA-8. The system was put into use by manyagencies. As time passed, it became apparentthat some of the groups were too broad incoverage because somewhat different soilswere classed in the same group. A number of the agencies using the system modified it to
Soil Classi fication 5-29
8/8/2019 Soil Classification 5-8
http://slidepdf.com/reader/full/soil-classification-5-8 30/36
FM 5-410
suit their purposes. Principal modificationsincluded breaking dow n some of the broadgroups into subgroups of more limited scope.The revisions culminated in a comprehensivecommittee report that appeared in theProceedings of the 25th Annual Meeting of the
Highway Research Board (1945). This same
report contains detailed information relativeto the Airfield Classification System and theFederal Aviation Administration System.The Revised Pu blic Roads System is primar-ily designed for the evaluation of subgradesoils, althou gh it is useful for other p urposesalso.
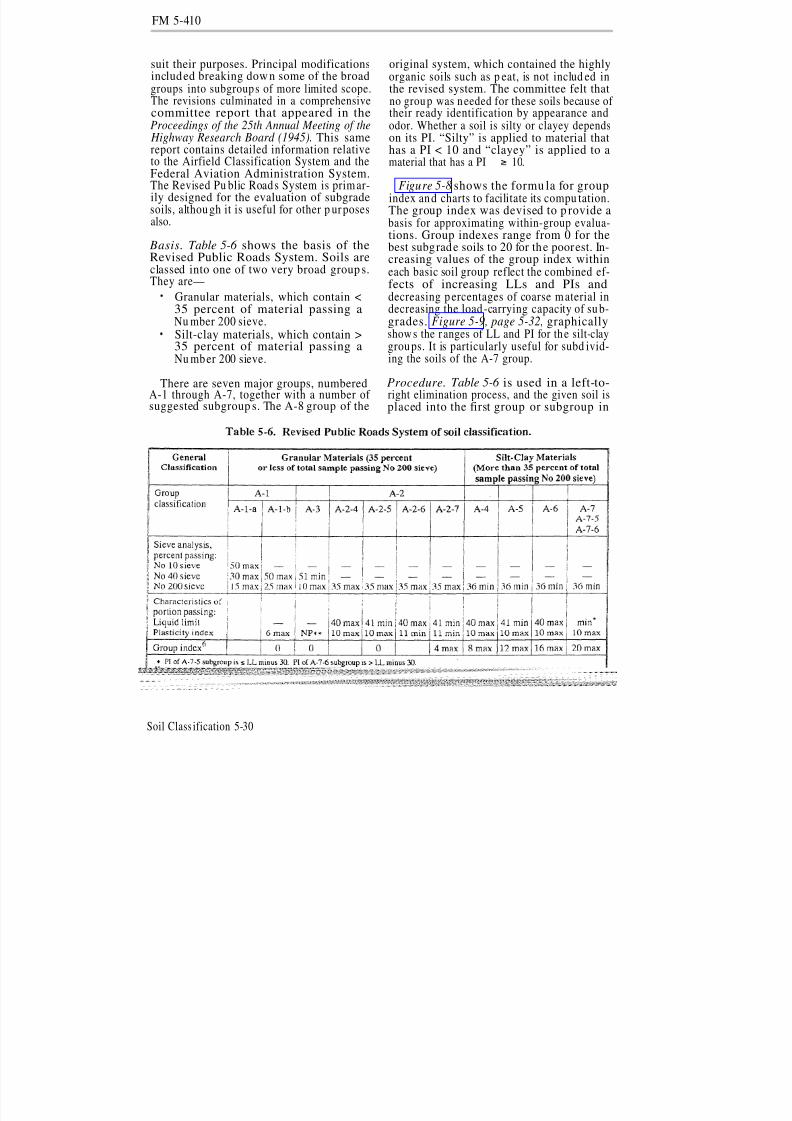
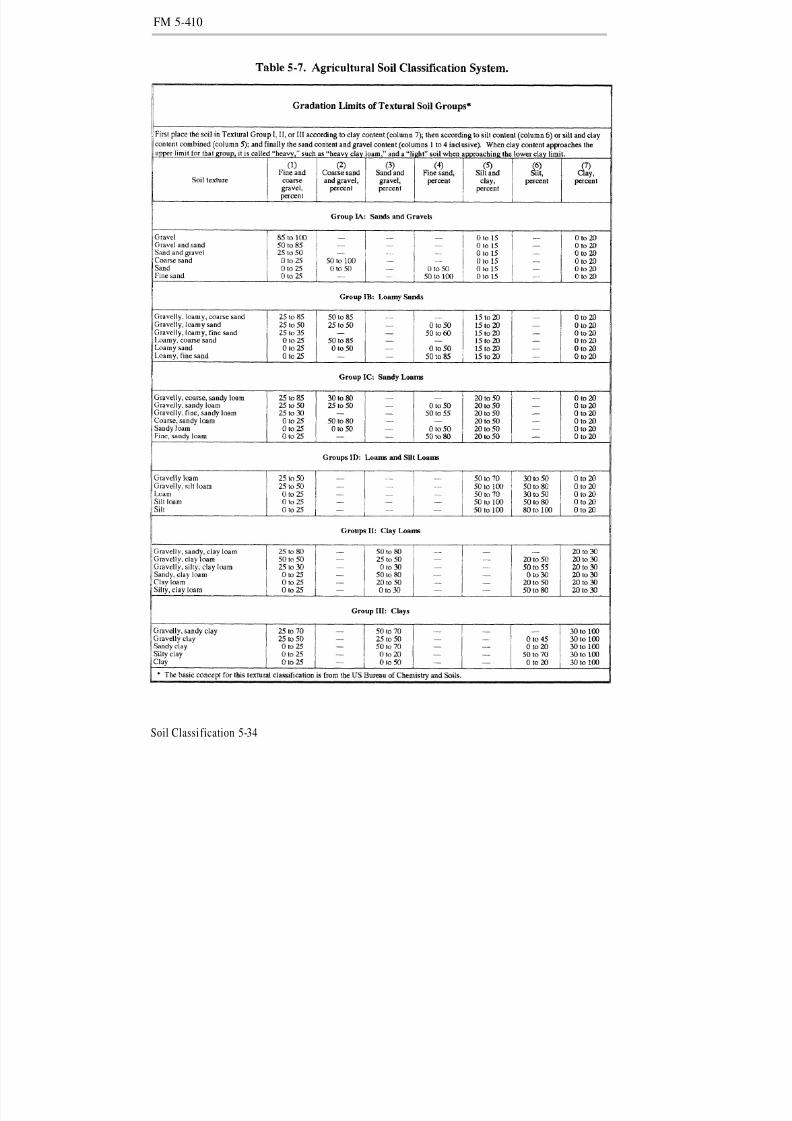
Basis. Table 5-6 shows the basis of theRevised Public Roads System. Soils areclassed into one of two very broad group s.They are—
Granular materials, which contain <35 percent of material passing aNu mber 200 sieve.Silt-clay materials, which contain >35 percent of material passing aNu mber 200 sieve.
There are seven major groups, numberedA-1 through A-7, together with a number of suggested subgroup s. The A-8 group of the
original system, which contained the highlyorganic soils such as p eat, is not includ ed inthe revised system. The committee felt thatno group was needed for these soils because of their ready identification by appearance andodor. Whether a soil is silty or clayey dependson its PI. “Silty” is applied to material that
has a PI < 10 and “clayey” is applied to amaterial that has a PI 10.
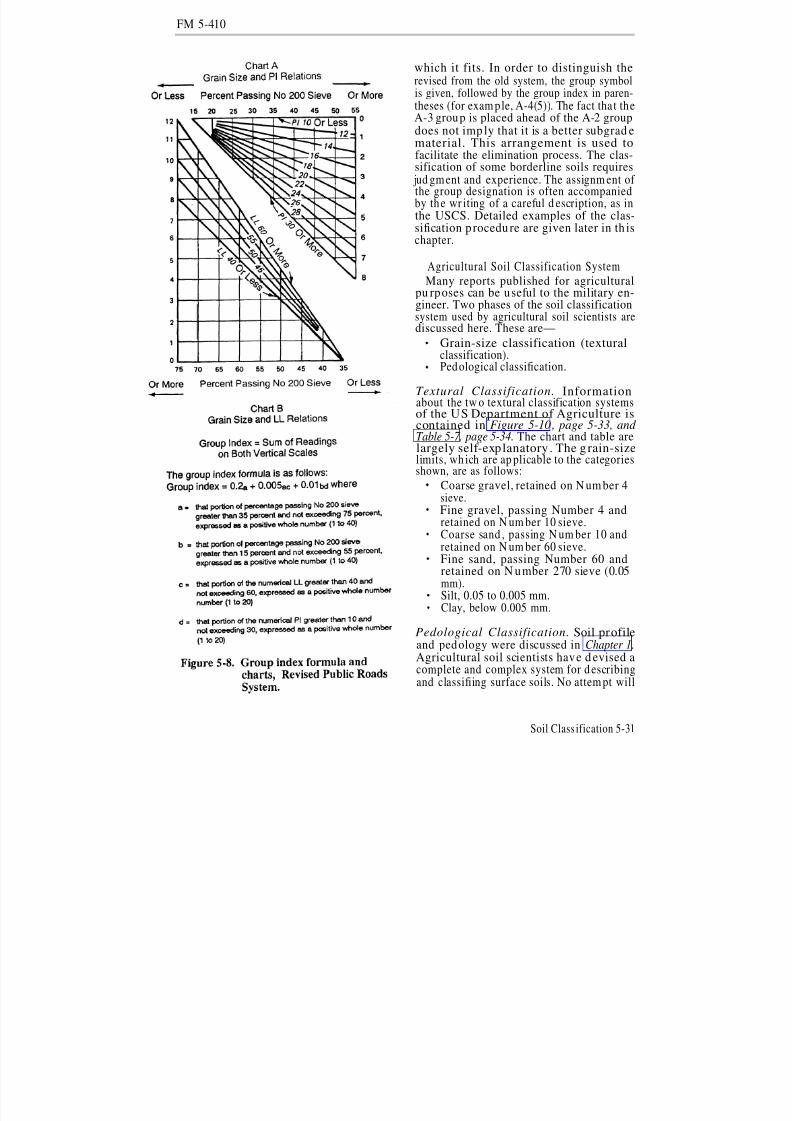
Figure 5-8 shows the formu la for groupindex and charts to facilitate its compu tation.The group index was devised to p rovide abasis for approximating within-group evalua-tions. Group indexes range from 0 for thebest subgrade soils to 20 for the poorest. In-creasing values of the group index withineach basic soil group reflect the combined ef-fects of increasing LLs and PIs and
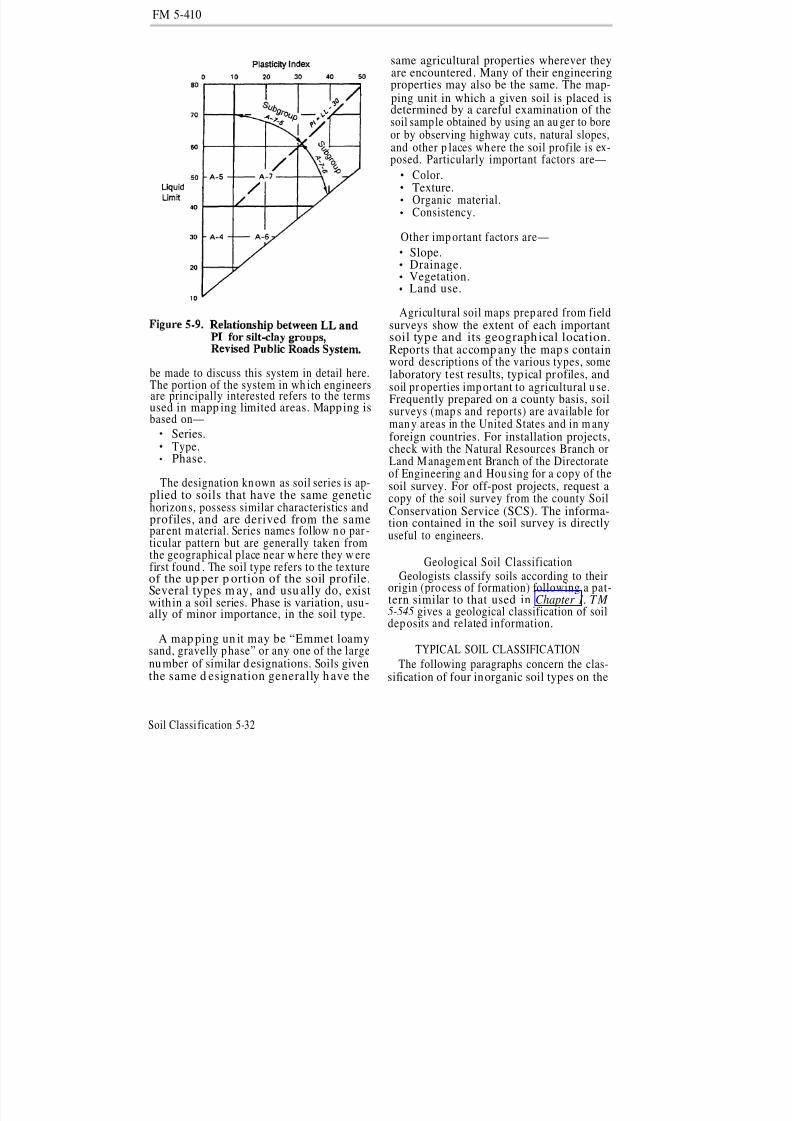
decreasing p ercentages of coarse material indecreasing the load-carrying capacity of su b-grades. Figure 5-9 , page 5-32, graphicallyshows the r anges of LL and PI for the silt-claygroups. It is particularly useful for subd ivid-ing the soils of the A-7 group.
Procedure. Table 5-6 is used in a left-to-right elimination process, and the given soil isplaced into the first group or subgroup in
Soil Class ification 5-30
8/8/2019 Soil Classification 5-8
http://slidepdf.com/reader/full/soil-classification-5-8 31/36
FM 5-410
which it fits. In order to distinguish therevised from the old system, the group symbolis given, followed by the group index in paren-theses (for exam ple, A-4(5)). The fact tha t theA-3 group is placed ahead of the A-2 groupdoes not imp ly that it is a better subgrad ematerial. This arrangement is used tofacilitate the elimination process. The clas-sification of some borderline soils requires
jud gment and experience. The assignm ent of the group designation is often accompaniedby the wr iting of a careful d escription, as inthe USCS. Detailed examples of the clas-sification p rocedure are given later in th ischapter.
Agricultural Soil Classification SystemMany reports published for agricultural
pu rposes can be useful to the military en-
gineer. Two phases of the soil classificationsystem used by agricultural soil scientists arediscussed here. These are—
Grain-size classification (texturalclassification).Pedological classification.
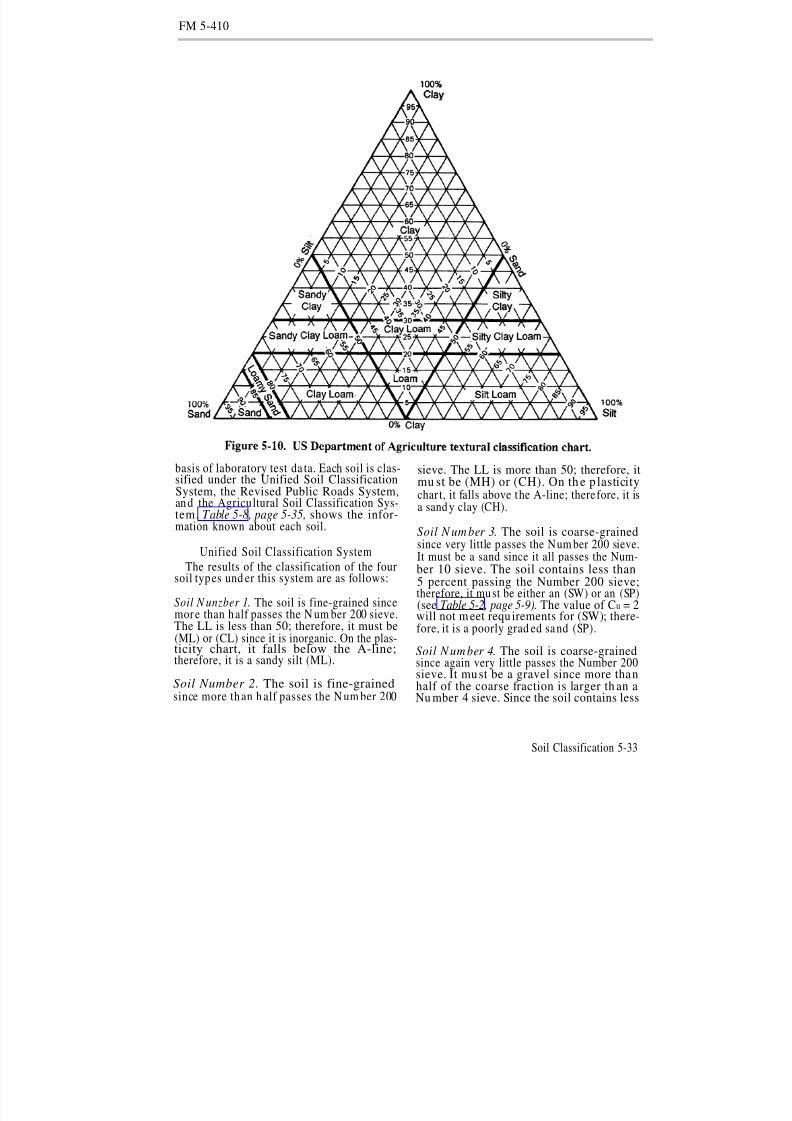
Textural Classification. Informationabout the tw o textural classification systemsof the US Department of Agriculture iscontained in Figure 5-10 , page 5-33, and Table 5-7, page 5-34. The chart and table arelargely self-explanatory. The grain-sizelimits, wh ich are ap plicable to the categoriesshown, are as follows:
Coarse gravel, retained on N um ber 4sieve.Fine gravel, passing Number 4 andretained on N um ber 10 sieve.Coarse sand , passing N um ber 10 andretained on N um ber 60 sieve.Fine sand, passing Number 60 andretained on N umber 270 sieve (0.05mm).Silt, 0.05 to 0.005 mm.
Clay, below 0.005 mm.
Pedological Classification. Soil profileand pedology were discussed in Chapter 1.Agricultural soil scientists have d evised acomplete and complex system for d escribingand classifiing surface soils. No attem pt will
Soil Class ification 5-31
8/8/2019 Soil Classification 5-8
http://slidepdf.com/reader/full/soil-classification-5-8 32/36
FM 5-410
be made to discuss this system in detail here.The portion of the system in wh ich engineersare principally interested refers to the termsused in mapp ing limited areas. Mapping isbased on—
Series.Type.Phase.
The designation kn own as soil series is ap-plied to soils that have the same genetichorizons, possess similar characteristics andprofiles, and are derived from the samepar ent material. Series names follow n o par -ticular pattern but are generally taken fromthe geographical place near w here they w erefirst found . The soil type refers to the textureof the up per p ortion of the soil profile.Several types m ay, and usu ally do, exist
within a soil series. Phase is variation, usu-ally of minor importance, in the soil type.
A map ping un it may be “Emmet loamysand, gravelly p hase” or any one of the largenumber of similar d esignations. Soils giventhe same d esignation generally h ave the
same agricultural properties wherever theyare encountered . Many of their engineeringproperties may also be the same. The map-ping unit in which a given soil is placed isdetermined by a careful examination of thesoil sample obtained by using an au ger to boreor by observing highway cuts, natural slopes,
and other p laces wh ere the soil profile is ex-posed. Particularly important factors are—
Color.Texture.Organic material.Consistency.
Other imp ortant factors are—
Slope.Drainage.Vegetation.Land use.
Agricultural soil maps prep ared from fieldsurveys show the extent of each importantsoil type and its geographical location.Reports that accomp any the map s containword descriptions of the various types, somelaboratory test results, typical profiles, andsoil pr operties imp ortant to agricultural u se.Frequently prepared on a county basis, soilsurveys (map s and reports) are available forman y areas in the United States and in m anyforeign countries. For installation projects,
check with the Natural Resources Branch orLand Managem ent Branch of the Directorateof Engineering an d Hou sing for a copy of thesoil survey. For off-post projects, request acopy of the soil survey from the county SoilConservation Service (SCS). The informa-tion contained in the soil survey is directlyuseful to engineers.
Geological Soil ClassificationGeologists classify soils according to their
origin (process of formation) f ollowing a pat-tern similar to that used in Chapter 1. TM 5-545 gives a geological classification of soildep osits and related information.
TYPICAL SOIL CLASSIFICATION
The following paragraphs concern the clas-sification of four inorganic soil types on the
Soil Classi fication 5-32
8/8/2019 Soil Classification 5-8
http://slidepdf.com/reader/full/soil-classification-5-8 33/36
FM 5-410
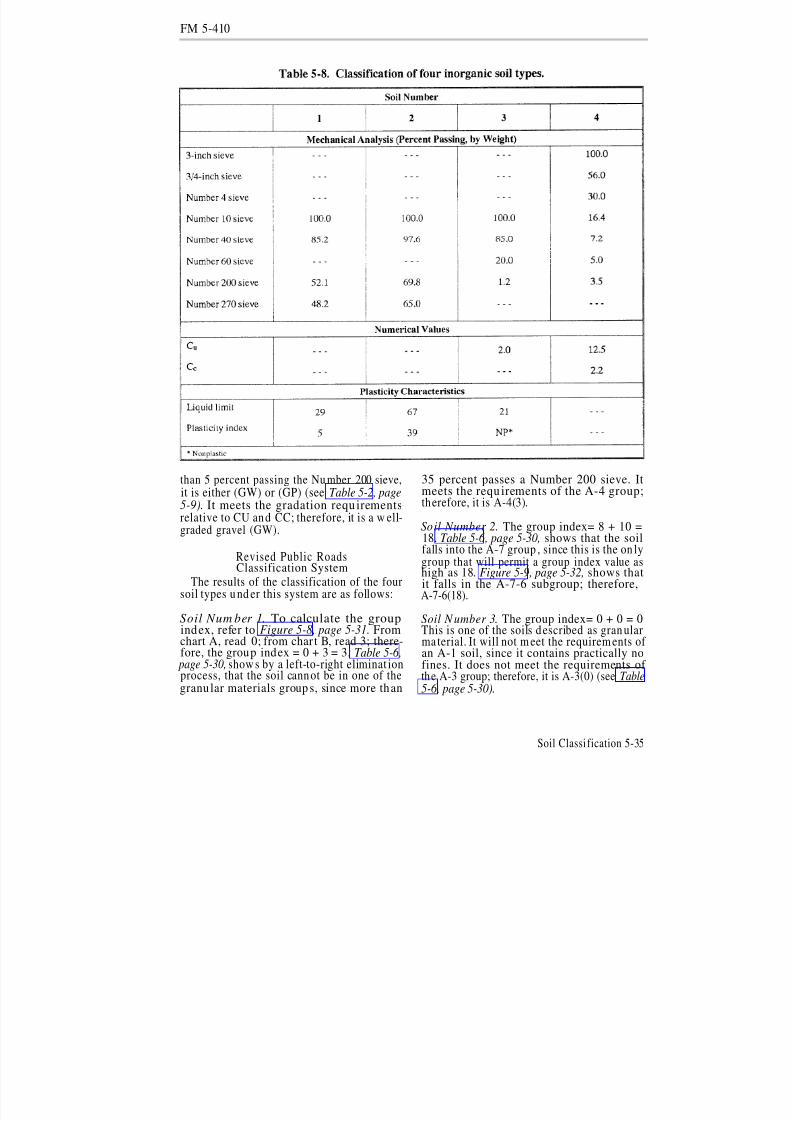
basis of laboratory test da ta. Each soil is clas-sified under the Unified Soil ClassificationSystem, the Revised Public Roads System,an d the Agricultural Soil Classification Sys-tem. Table 5-8 , page 5-35, shows the infor-mation known about each soil.
Unified Soil Classification SystemThe results of the classification of the four
soil types und er this system are as follows:
Soil N unzber 1. The soil is fine-grained sincemore than half passes the N um ber 200 sieve.The LL is less than 50; therefore, it must be(ML) or (CL) since it is inorganic. On the plas-ticity chart, it falls below the A-line;therefore, it is a sandy silt (ML).
Soil Number 2. The soil is fine-grainedsince more th an h alf passes the N um ber 200
sieve. The LL is more than 50; therefore, itmu st be (MH) or (CH). On th e p lasticitychar t, it falls above the A-line; therefore, it isa sand y clay (CH).
Soil N umber 3. The soil is coarse-grainedsince very little passes the Num ber 200 sieve.It must be a sand since it all passes the Num-ber 10 sieve. The soil contains less than5 percent passing the Number 200 sieve;therefore, it must be either an (SW) or an (SP)
(see Table 5-2, page 5-9). The value of Cu = 2will not m eet requirements for (SW); there-fore, it is a poorly grad ed sand (SP).
Soil N umber 4. The soil is coarse-grainedsince again very little passes the Number 200sieve. It must be a gravel since more thanhalf of the coarse fraction is larger th an aNu mber 4 sieve. Since the soil contains less
Soil Classification 5-33
8/8/2019 Soil Classification 5-8
http://slidepdf.com/reader/full/soil-classification-5-8 34/36
FM 5-410
Soil Classi fication 5-34
8/8/2019 Soil Classification 5-8
http://slidepdf.com/reader/full/soil-classification-5-8 35/36
FM 5-410
than 5 percent passing the Nu mber 200 sieve, 35 percent passes a Number 200 sieve. Itit is either (GW) or (GP) (see Table 5-2 , page meets the requ irements of the A-4 group;5-9). It meets the gradation requ irements therefore, it is A-4(3).
relative to CU and CC; therefore, it is a w ell-graded gravel (GW).
Revised Public RoadsClassification System
The results of the classification of the foursoil types u nd er this system are as follows:
Soil Num ber 1. To calculate the groupindex, refer to Figure 5-8, page 5-31. Fromchart A, read 0; from chart B, read 3; there-fore, the group index = 0 + 3 = 3. Table 5-6,
page 5-30, show s by a left-to-right eliminat ionprocess, that the soil cannot be in one of thegranu lar materials group s, since more than
Soil Number 2. The group index= 8 + 10 =18. Table 5-6 , page 5-30, shows that the soilfalls into the A-7 group , since this is the on lygroup that will permit a group index value ashigh as 18. Figure 5-9 , page 5-32, shows thatit falls in the A-7-6 subgroup; therefore,A-7-6(18).
Soil N umber 3. The group index= 0 + 0 = 0This is one of the soils described as gran ularma terial. It will not m eet the requirem ents of an A-1 soil, since it contains practically nofines. It does not meet the requirements of the A-3 group; therefore, it is A-3(0) (see Table5-6, page 5-30).
Soil Classi fication 5-35
8/8/2019 Soil Classification 5-8
http://slidepdf.com/reader/full/soil-classification-5-8 36/36
FM 5-410
Soil N umber 4. The group index= 0 + 0 = 0.This is obviously a granular material andmeets the requirements of the A-l-a (0) (seeTable 5-6, page 5-30).
Agricultural SoilClassification System
Although the values are not given in theprevious tabulation, assume that 12 percentof Soil Nu mber 1 and 35 percent of SoilNu mber 2 are in the range of clay sizesthat is below 0.005 mm .
Soil N umber 1. This soil contains 100 - 48.2= 51.8 percent sand, since the opening of aNu mber 270 sieve is 0.05 mm . The soil is thencomposed of 52 percent sand , 36 percent silt,and 12 percent clay. Figure 5-10 , page 5-33,classifies this soil as a sandy loam.
Soil Number 2. This soil contains ap-proximately 35 percent san d, 30 percent silt,
and 35 percent clay. Figure 5-10, page 5-33,classifies this soil as clay.
Soil N umber 3. This soil is 99 percent sand;therefore, it can only be classified as sand .
Soil Number 4. This soil contains ap-
proximately 70 percent coarse gravel, 14percent fine gravel, 13 percent sand, and 3percent silt and clay combined. It cannot beclassified by using Figure 5-10 , page 5-33, be-cause the chart does not cover gravels andgravelly sands. Table 5-7, page 5-34, clas-sifies the material as gravel and sand.
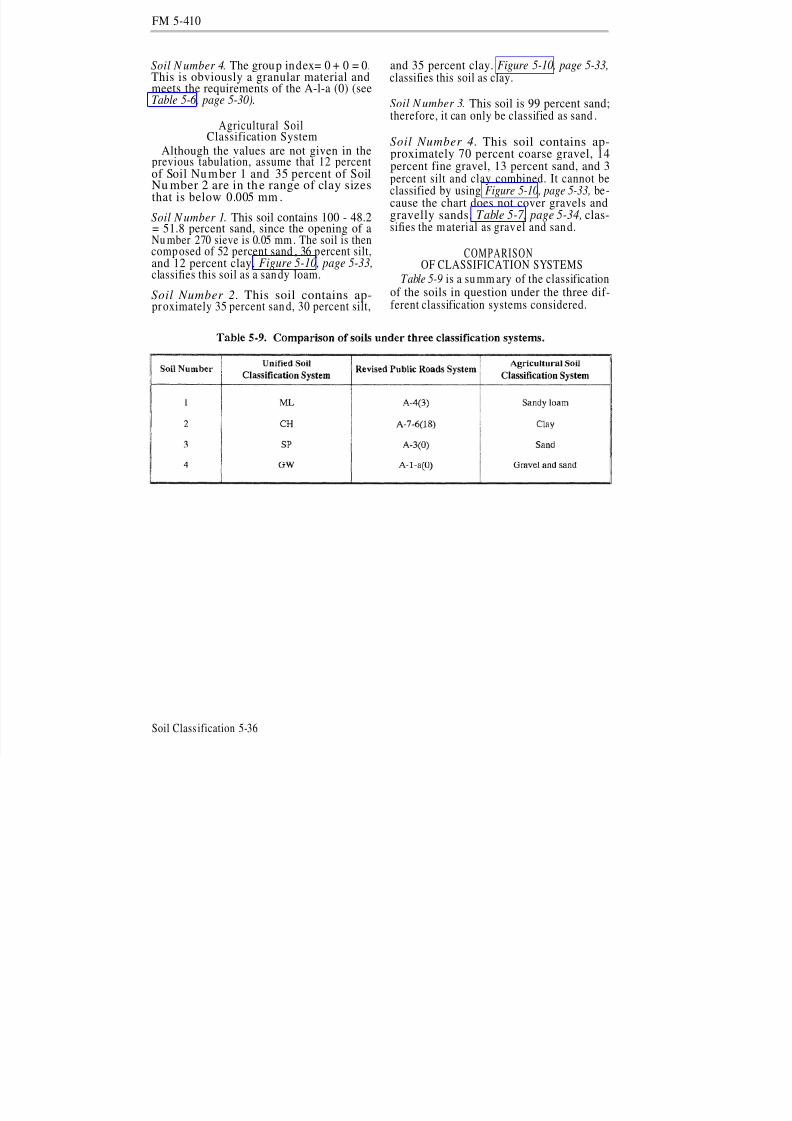
COMPARISONOF CLASSIFICATION SYSTEMS
Table 5-9 is a su mm ary of the classificationof the soils in question under the three dif-
ferent classification systems considered.