Embed Size (px)
Citation preview

Soil carbon stock and land use change for sugarcane cultivation in Brasil.
Carlos Clemente Cerri

INCREASE PRODUCTIVITY
AGRICULTURAL AREA EXPANSION
Increase production in food, fiber and biofuel
Two complementary actions:

Soybean Corn
Sugarcane
Reforestment
5 0.5
7
4.1
Foreseen expansion in area Million ha for the next 10 years
18-20 Mha
How can the agricultural area be expanded in a sustainable way?
Others
0.5
Oilseeds
2.6
BIOFUELS
FOOD
FIBER

without further deforestation…
Expansion of agricultural area
Pasture 192 million ha
Agriculture 60 million ha

without further deforestation…
Expansion of agricultural area
Agriculture 60 million ha
Pasture 192 million ha
+ 20 million ha
- 20 million ha

Soybean Corn
Sugar-cane
Reforestment
5 0.5
7
4.1
Foreseen expansion in area (106 ha) for the next 10 years
18-20 Mha
Others
0.5
Oilseeds
2.6
4 million peopleUS $ 28 billion1.5% Brazil’s GDP

Ethanol demand in BrazilB
illio
n L
ite
rs
EthanolEPE 2012
Increase of ethanol production in Brazil
7 M ha
Under Development
Imediatly
Cerri 2014
2 options

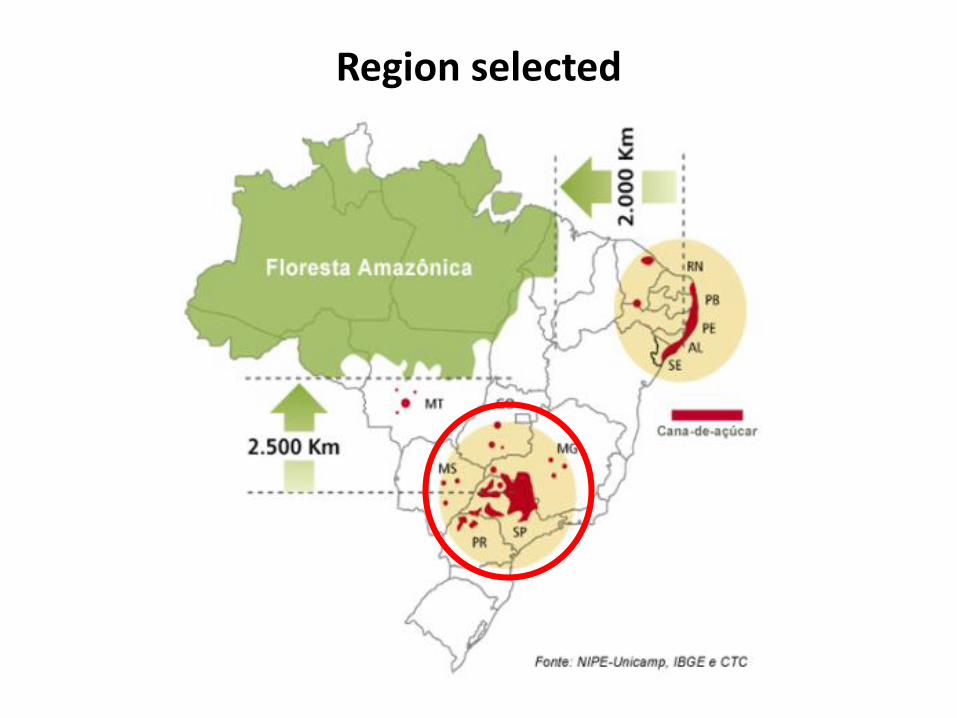
Conversion from Annual Cropland to Sugar Cane

Conversion from Pasture to Sugar Cane

The effects of land-use-changeon soil carbon balance
have to be taken into account in calculating the CO2 savings attributed to bioenergy crops

How much is the Soil Carbon Debt and Payback Time due to these conversions?
How to produce sugar cane ethanol in a sustainable way and increase the fossil fuel offset?
Couple of questions:

How much is the Soil Carbon Debt and Payback Time due to these conversions?
How to produce sugar cane ethanol in a sustainable way and increase the fossil fuel offset?
Couple of questions:

Soil
Car
bo
n
Pasture
Soil Carbon stock balance after Land Use Change
Sugar CaneConversion
Soil Carbon
Years YearsWeeks
Storage
Debt
CO2
Debt
Crop residue decomposition

Soil
Car
bo
n
Pasture
Payback time
Sugar Cane
Conversion
Soil Carbon
Years Weeks
CO2
Debt
Ethanol
Offset fossil fuel

Payback time
0 1 2 3 4 ...
Years
“Time span that the conversion of a specific land intosugarcane would need to compensate emissions resultedfrom LUC considering the offset associated to thereplacement of fossil fuel by sugarcane ethanol. ”

Soil Carbon Debt and Payback Time CALCULATIONS

• Find comparison soil pairs
• Soil sampling
• Determination:
Soil organic carbon LECO - Analyzer
Soil bulk density
• Estimate of CO2 emitted (-) oraccumulated (+) in soils using Tier 2 approach (2006, IPCC).
Methodology
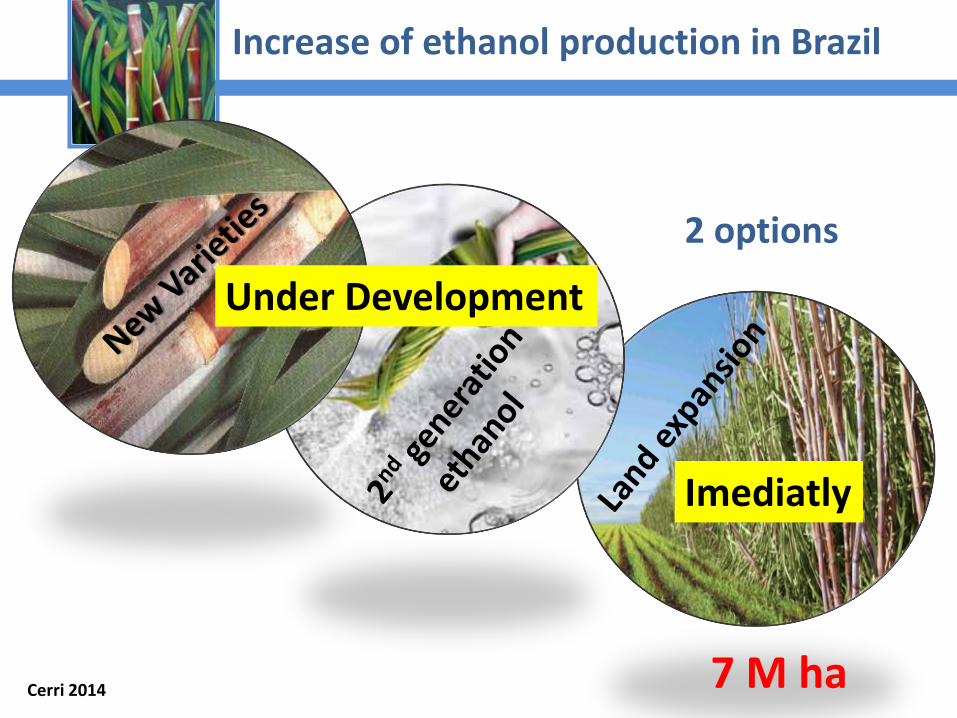
Region selected

Mello et al. (IN PRESS)
Places selected

Soil sampling strategy
Sugar Cane
0-100 cm
0-30 cm
0-30 cm
0-30 cm
0-100 cm
0-30 cm
0-30 cm
0-30 cm
0-100 cm
50 m
50 m
Pasture
0-100 cm
0-30 cm
0-30 cm
0-30 cm
0-100 cm
0-30 cm
0-30 cm
0-30 cm
0-100 cm
50 m
50 m
Soil depths:0-10, 10-20, 20-30 cm
0-10, 10-20, 20-30, 40-50, 70-80, 90-100 cm
Mello et al. (IN PRESS)
Soil pairs (side by side)

Conversion from Pasture to Sugar-Cane 70%
Conversion from Annual Cropland to Sugar-Cane 25%

Conversion from Cerrado to Sugar-Cane < 1%

Soil sampling

Soil sampling

Bulk density

Soil sampling + bulk density

Soil sampling + bulk density

0
10
20
30
40
50
60
70
80
90
100
cm

135 study sites = 75 pairs
Pasture to sugar cane 57
Annual cropland to sugar cane 13
Cerrado to sugar cane 05
Mello et al. (IN PRESS)
≈6,000 Soil samples

Soil C stocks from sugar cane and
references
Soil type, soil texture, climate factors
Time span after LUC
land use change
Adopted managementburnt vs unburnt
Basic information of these 135 sites

Soil Carbon Debt and Payback Time
RESULTS

Mello et al. (IN PRESS)
Soil C storage
Soil C reduction
Payback time
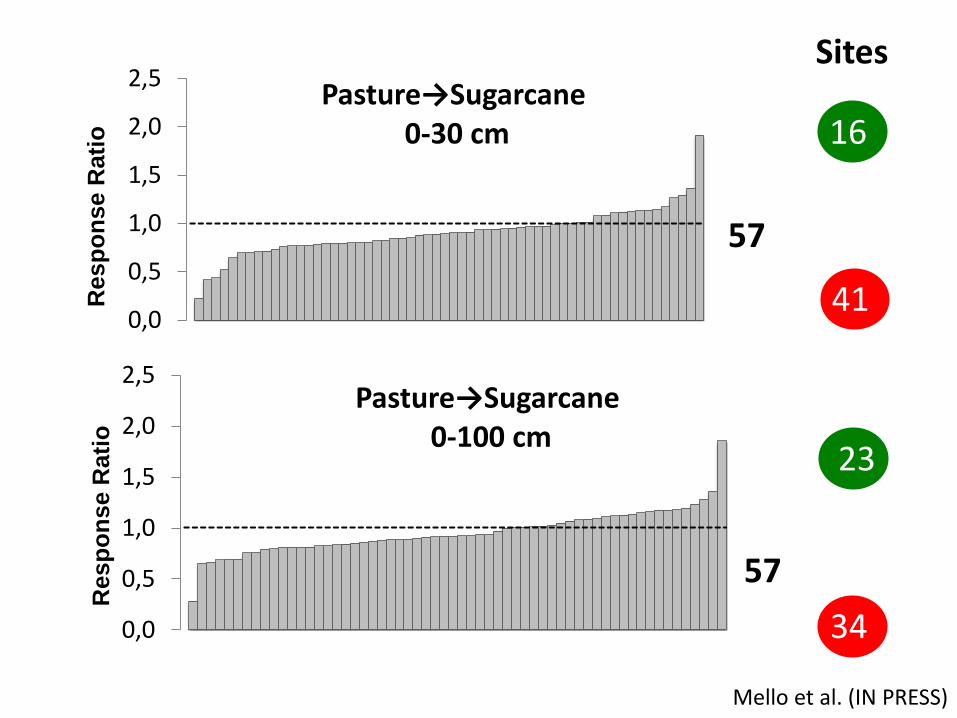
Pasture-> Sugar cane0-30 cm
Response Ratio (Mg C ha-1) =Soil C stock Sugar CaneSoil C stock References
PastureAgricultureCerrado

Mello et al. (IN PRESS)
Soil C stock Sugar CaneSoil C stock References
0,0
0,5
1,0
1,5
2,0
2,5R
esp
on
se R
ati
oPasture→Sugarcane
0-30 cm
57
16
Sites
41
5 20
34
23
57
0,0
0,5
1,0
1,5
2,0
2,5Pasture→Sugarcane
0-100 cm
Resp
on
se R
ati
o
Mello et al. (IN PRESS)

0,0
0,5
1,0
1,5
2,0
2,5
Re
spo
nse
Rat
io
Cropland→Sugarcane 0-100 cm
Sites
6
7
7
6
0,0
0,5
1,0
1,5
2,0
2,5R
esp
on
se R
atio
Cropland→Sugarcane0-30 cm
Mello et al. (IN PRESS)
13
13

0
Sites
5
1
4
5
Re
spo
nse
Rat
io
0,0
0,5
1,0
1,5
2,0
2,5Native Vegetation →Sugarcane
0-30 cm
0,0
0,5
1,0
1,5
2,0
2,5Native Vegetation →Sugarcane
0-100 cm
5
Re
spo
nse
Rat
io
Mello et al. (IN PRESS)

Mello et al. (IN PRESS)

Mello et al. (IN PRESS)
Soil C stocks from sugar cane and
references
Soil type, soil texture, climate factors
Time span after LUC
land use change
Adopted managementburnt vs unburnt
Linear mixed effect modeling approach
Land use change factor
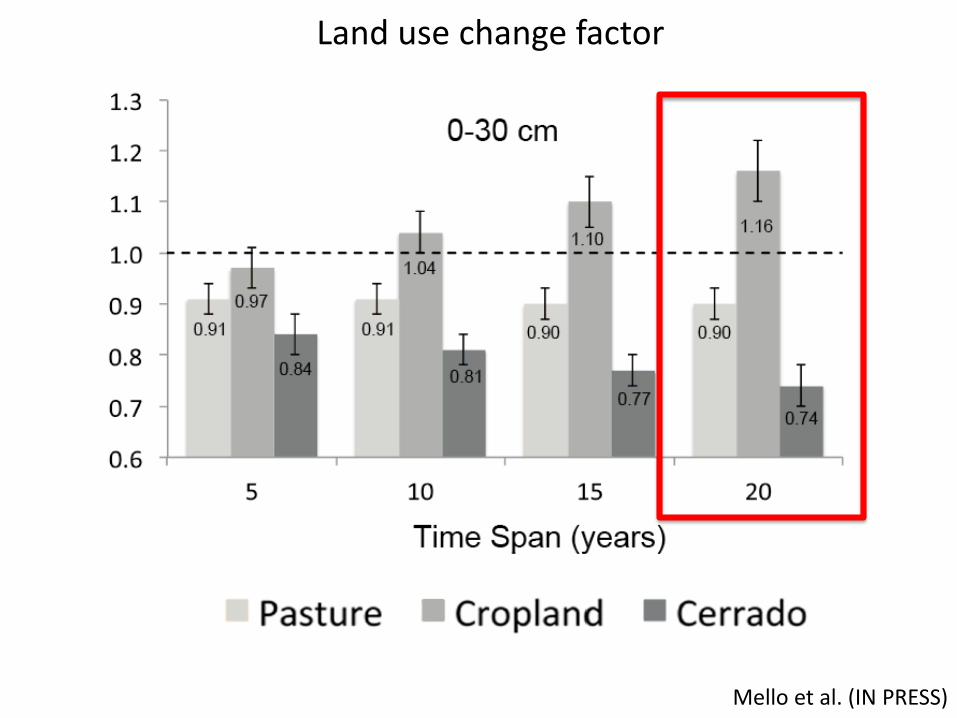
Land use change factor
Mello et al. (IN PRESS)

Mello et al. (IN PRESS)
Land use change factor

Conversion from Cerrado to Sugar Cane (< 1%)
Mello et al. (IN PRESS)
Carbon Debt (20 years)-77.8 Mg CO2 ha-1
0-30 cm

Payback time CALCULATION

Sugar Cane Ethanol Offset
9.8 Mg CO2 ha-1 yr-1
Fargione et al. (2008)

Conversion from Cerrado to Sugar Cane (< 1%)
Mello et al. (IN PRESS)
Payback time = 8 years

Conversion from Pasture to Sugar Cane
Carbon Debt (20 years)-20 Mg CO2 ha-1 0-30 cm-32 Mg CO2 ha-1 0-100 cm

Conversion from Pasture to Sugar Cane
Payback time = 2 to 3 years

Conversion from Annual Cropland to Sugar Cane
Carbon storage (20 years)+36 Mg CO2 ha-1 0-30 cm+79 Mg CO2 ha-1 0-100 cm

Conversion from Annual Cropland to Sugar Cane
Payback time = ZERO

Soil
Car
bo
n
Years
Cerrado
Pasture
Agric landBio
mas
s C
arb
on
46 GgCO2
Conversion
3 M ha2000 - 2010

Soil
Car
bo
n
Sugar CaneConversion
Years YearsWeeks
3 GgCO2
Debt
Cerrado
Pasture
Agric landBio
mas
s C
arb
on
3 M ha2000 - 2010
46 GgCO2
Land useemissionfactor
Yields Net Ecosystem Emissions0.7 – 1.0 Mg CO2 ha-1 yr-1
Offset9.8 Mg CO2 ha-1 yr-1
ethanol

Is minimized by improved management and productivity on residual agriculture lands
Significant role in delivering
Provided that iLUC

Mello et al. (IN PRESS/ June 2014)Grant 2011/07105-7

How much is the Soil Carbon Debt and Payback Time due to these conversions?
How to produce sugar cane ethanol in a sustainable way and increase the fossil fuel offset?
Couple of questions:

CO2eq liter -1
Fossil Fuel
TransportExtraction
ProcessingCombustion
CO2
N2O CH
4
Biofuel
Emissions from field
TransportIndustry
Combustion
CO2
N2O CH
4
fossil
Offset

CO2eq liter -1
Fossil Fuel
TransportExtraction
ProcessingCombustion
CO2
N2O CH
4
Biofuel
Emissions from field
TransportIndustry
Combustion
CO2
N2O CH
4
fossil
Offset

TRANSPORT
C-CO2Photossynthesis
18 monthsPlant cane
CULTURAL MANAGEMENTS- pesticides- herbicides- vinasse
1st RATOON
12 months
12 months
2nd RATOON
12 months
3rd RATOON
HARVEST
12 months
4th RATOONREFORMATION
PLANTING
FertilizerLimeFilter cake
CO2
CH4
N2O
Filter cakeVinasse - distribution channel
BY-PRODUCTS
Bagasse
- boiler- co-generation
of electricpower
PRODUCTS CONSUME
CO2
CO2CO2 N2O
CO2
CH4N2OCO2
CH4
CO2CO2 N2O
CO2 eq

Soybean Corn
Sugarcane
Reforestment
5 0.5
7
4.1
Foreseen expansion in area (106 ha) for the next 10 years
18-20 Mha
What about livestock ??
Others
0.5
Oilseeds
2.6

Cerri 2014

212 M animals
196 Mha pasture
CC: 1.08 heads ha-1
225 M animals
192 Mha pasture
CC: 1.17 heads ha-1
244 M animals
185 Mha pasture
CC: 1.32 heads ha-1
+ 4 Mha + 11 Mha
2016 20212011Cerri 2014

244 M animals
178 Mha pasture
CC: 1.35 heads ha-1
+ 18 Mha
2021
244 M animals
185 Mha pasture
CC: 1.32 heads ha-1
+ 11 Mha
2021
+ 7 Mha
Sugar Cane expansion
Cerri 2014
2021+ 25 %
LivestockImproving efficiency

244 M animals
178 Mha pasture
CC: 1.35 heads ha-1
+ 18 Mha
2021
244 M animals
185 Mha pasture
CC: 1.32 heads ha-1
+ 11 Mha
2021
+ 7 Mha
Sugar Cane expansion
Cerri 2014
2021
+ 25 %
LivestockImproving efficiency
+ 15 % heads
- 10 % land area

“We must improve productivity in asustainable way”
Cerri 2014

Strategies to increase beef production
d
Feedlots
d
Genetic
improvement
d
Integration of
husbandry and
agriculture
mean stocking rate = 1.08 to 1.3heads per ha
Recuperation
and rehabilitation
of pastures

without further deforestation…
Expansion of sugarcane area
Pasture 192 million ha 7 million ha
Soil carbon debt = 20 Mg CO2 ha-1
Payback time = 2 to 3 years
Herd of 214 to 235 Million heads
Stock rate of 1.08 to 1.35 heads ha-1
Pasture rehabilitation
Genetic improvement of animalsIntegration husbandry-agricultureFeedlots

Soil carbon stock and land use change for sugarcane cultivation in Brasil.
Carlos Clemente Cerri