Embed Size (px)
Citation preview

Soil Carbon Inventory and Working Lands Baseline
Joshua Silva, Dr. Susan Crow, Dr. Johanie Rivera-Zayas, Elaine Vizka, Christine Tallamy GlazerUniversity of Hawaii College of Tropical Agriculture and Human Resources

Purpose
1. Compilation of available geospatially explicit datasets for soil carbon inventory and other attributes across natural and working lands (e.g., pasture, agriculture, agroforests)
2. Collect soil health, yield, and GHG sequestration data from a network of productive lands, farms, and ongoing trials as required for initialization of soil carbon-related planning tools
Scope of Work
Development of data resources required to generate a baseline and short/long term benchmarks for increasing GHG sequestration, soil health, and yields in natural and working lands (e.g., pasture, agriculture, agroforests) in Hawaii’s AFOLU sector

A. Thorough literature review
• GHG emissions, soil C storage
• Land use
• Soil C data
B. Compile geospatial datasets
• NCSS, NRCS, published/unpublished datasets
• SoilGrids (system for global digital soil mapping; machine learning)
• Land use datasets
Project Approach#1: Datasets

1A: Known References for GHG data in Hawaii’s NWLNatural, Working Land Sector
Management systems Management or Land cover References
Cropland Crops Intensive sugarcane cultivation
Conventional tillage and fertilizer management
Matson et al., 1996; Tran and Yanagida, 2019; Zachariassen et al., 1996; Pawlowski et al., 2017 and 2018
Tropical perennial grasses
Zero tillage, sugarcane and related bioenergy feedstocks, e.g., energycane, napier grass (Cenchrus purpureum),Guinea grass (Megathyrsus maximus) and others.
Pawlowski et al., 2017 and 2018; Meulemans, 2016; Crow et al., unpublished; Sumiyoshi et al., 2016
Biochar Biochar Meulemans, 2016; Biegert, 2015Organic Organic amendments Meulemans, 2016; Biegert, 2015Residue management Burning crop residues (what crop?) Miller et al., 1997
Aquaponics Vegetable production Wongkiew et al., 2018Fish production Hue et al., 2013
Forests Tropical rainforest Hall and Asner, 2007Montane forest Hedin et al., 2003 Fertility practices Hall and Matson, 1999 Invasive species Litton et al., 2006; Litton et al., 2008; Litton et al.,
2011; Hall and Asner, 2007Litter mineralization, and abiotic factors Riley and Vitousek, 2000; Holtgrieve et al., 2006
Forest fires Howbaker et al., 2017Peatlands/wetlands
Chimner, 2004; Beilman et al. unpublished
N=24

1A: Known References for GHG data in Hawaii’s NWL
Key Findings
• Croplands: Potential for napiergrass (reduced GHG emissions, water use); Biochar effect is soil dependent (Mollisol=reduced GHG emissions; Oxisol=increased GHG emissions)
• Aquaponics: High potential for N recovery from effluent via vegetables; Higher feeding rates correlated with increased N emissions
• Forests: N fluxes from nitrification in mesic tropical forests but denitrification in wetter sites; Soil organic C turnover about 0.39 Mg C/ha/year
• Pastures: GHG flux not directly quantified in Hawaii yet

1A: References for Soil C data in Hawaii’s NWLLand sector Management systems Land cover ReferencesForests Silvopasture Blackmore and Vitousek, 2000; Krueger and Ryals (unpublished)
Forest (non- specified, or diverse species)
Ares and Fownes, 2001; Burke et al., 2003; Scowcroft et al., 2004; McGrath 2019; Melone et al., 2021
Humid tropical forest Giardina et al., 2004Tropical Dry forest Elmore and Asner, 2006; Litton et al., 2006; Litton et al., 2008; Litton et al., 2011;
Chadwick et al., 2007Tropical rainforest Hall and Matson 2003; Hall and Asner, 2007; Rillig et al., 2001Montane forest Bothwell et al., 2014; Funk, 2005; Gower and Vitousek, 1989; Herbert and Fownes, 1999;
Hobbie, 2000; Idol et al., 2007; Kitayama et al., 1997; Riley and Vitousek, 1995; Rillig et al., 2001; Schuur et al, 2001; Selmants et al., 2014; Selmants et al., 2016; Chadwick et al., 2007; Hedin et al., 2003; Giardina et al., 2014
Native forest/ Forest reserves Austin, 2002; Austin and Vitousek, 1998; Chadwick et al., 2007; Chorover et al., 2004; Crews et al., 1995; Cusack et al., 2012; Hughes and Denslow, 2005; Hughes and Uowolo, 2006; Kao-Kniffin and Balser, 2008; Kramer et al., 2012; Mascaro et al., 2012; Neff et al., 2000; Osher et al., 2003; Sanderman and Kramer, 2013; Stewart et al., 2011; Giardina et al. 2014
Eucalyptus and Albizia Binkley et al., 1992; Kaye et al., 2000; Resh et al., 2002Eucalyptus plantation Giardina and Ryan, 2002; Binkley et al., 1992; Kaye et al., 2000; Resh et al., 2002; Ryan
et al., 2008; Crow et al., 2016; Zou and Bashkin, 1998Koa forest Idol et al., 2007; Litton et al., 2011; Scowcroft et al., 2004; Ares and Fownes, 2001;
Oʻhia forest (Metrosideros polymorpha)
Grant et al., 2019; Hobbie and Vitousek, 2000; Hughes and Uowolo, 2006; Kao-Kniffin and Balser, 2008; Kramer et al., 2012; Mascaro et al., 2012; Neff et al., 2000; Nusslein and Tiedje, 1999; Rilling et al., 2001; Sandermand and Kramer, 2013; Torn et al., 1997; Torn et al., 2005; Townsend et al., 1995; Townsend et al., 1997; Giardina et al., 2014
Fern (Dicranopteris linearis) Stewart et al., 2011Ōlapa (Cheirodendron trigynum) Stewart et al., 2011
Forest with Invasive species Litton et al., 2006; Litton et al., 2008; Litton et al., 2011; Melone et al. 2021Soil fertility/ Nutrient management practices
Giardina et al., 2003; Giardina et al., 2004; Gower and Vitousek, 1989; Hobbie , 2000; Hobbie and Vitousek, 2000; Neff et al., 2000; Ryan et al., 2008; Idol et al., 2007
Converted lands Abandoned to forest Pasture-abandoned/grassland-koa forest
Scowcroft et al., 2004; Idol et al., 2007
Plantation to Pasture, Secondary forest or forest
Bashkin and Binkley, 1998; Binkley and Resh, 1999; Binkley et al., 2004; Guo and Gifford, 2002; Kaye et al., 2000; Zou and Bashkin, 1998
Forest to Pasture, crop or managed forest
Guo and Gifford, 2002; Nüsslein and Tiedje, 1999
Pasture to Forest, secondary Forest, plantation or crop
Crow et al., 2016; Guo and Gifford, 2002
Intensive cultivation to perennial grass with zero tillage
Crow et al. 2020

1A: References for Soil C data in Hawaii’s NWLLand sector Management systems Land cover ReferencesAgricultural land Crop production Cusack et al., 2013
Sugarcane (Saccharum officinarum)
Burke et al., 2003; Pawlowski et al., 2018; Tirado-Corbalá et al., 2015
Napiergrass (Pennisetum purpureum)
Pawlowski et al., 2017 and 2018; Sumiyoshi et al., 2017
Guinea grass (Megathyrsus maximus)
Sumiyoshi et al., 2017
Energycane (Saccharum. officinarum x S. robustum cv. MOL-6081)
Crow et al. 2020
Orchards Coffee Youkhana and Idol, 2009; Youkhana and Idol, 2016Ash soils- no vegetation
Perez, 2001
Pasture Mixed Burke et al., 2003; Cusack et al., 2013; Chadwick et al., 2007Kikuyu pasture (Pennisetum clandestinum)
Cusack et al., 2012; Nusslein and Tiedje, 1999; Torn et al., 1997; Townsend et al., 1995; Townsend et al., 1997; Blackmore and Vitousek, 2000; Crow et al. 2016
Bufflegrass (Cenchrus ciliaris)
Torn et al., 1997
Grasslands Kramer and Chadwick, 2016; Scowcroft et al., 2004; Chadwick et al., 2007
Shrublands Kramer and Chadwick, 2016; Chadwick et al., 2007Shrubland Chadwick et al., 2007Peatlands/Wetlands
Beilman et al.
Hawaiʻi inventories and reports
Drawdown report 2020

1A: References for Soil C data in Hawaii’s NWL
Key Findings
• Croplands: Sugarcane plantations were a significant C source so potential for energy/fuel crops; Mulching and litter practices can increase soil C by 2.9 C Mg/ha
• Pasture: Importance of organic residues and minimized disturbance; Soil C stocks nearly similar between pasture and forest (9.5 kg C/m2 vs 12.7 kg C/m2), both more than sugarcane plantation
• No vegetation: dead tissue increased soil organic C vs living plants (Perez 2001)
• Converted Lands: Four years of perennial grass with zero tillage increased soil C stock from 18.0 kg C/ha to 22.6 kg C/ha in top 1m; Conversion of dry forest to non-native grass invasion reduced soil C storage at landscape scale

Hawaii Soil C data possibilities…
Courtesy E. Vizka

• Compared Soil Survey vs Additional Data
• 250m resolution
• 0-30cm depth vs 0-15cm depth
• Quantile Random Forest Model (5% and 95% quantiles)
• SoilGrids v1 (interpolate calculate)SoilGrids v2 (calculate interpolate)
*Limitations
o SoilGrids: under-estimate C for high organic soils
1B: Soil C Mapping

Summary: More data = More detail1B: Soil C Mapping Example

1B: Compiled Land Use DatasetsLand cover data layer Description CitationImportant Agricultural Lands (IAL) Classification based on importance of agricultural lands; integrates ALISH; criteria:
https://www.capitol.hawaii.gov/hrscurrent/Vol04_Ch0201-0257/HRS0205/HRS_0205-0044.htm
State Land Use Commission 2019
Carbon Assessment of Hawaiʻi Land Cover (CAH)
Land cover by biomes & invasion status; integration of HI-GAP, C-CAP, LF, and updates using very high resolution imagery
U.S. Geological Survey 2017
Agricultural Land Use Baseline (ALUB) Agricultural land use based on WorldView-2 satellite imagery (2011-2013), data provided by landowners and stakeholders, County Real Property Tax and Agricultural Water Use data; verified by site visits and stakeholder meetings.
Spatial Data Analysis and Visualization Lab 2015
Pre-contact Native Hawaiian Footprint Map of pre-contact Native Hawaiian land use based on archaeological evidence, information on native habitats, and natural condition information.
The Nature Conservatory & Office Hawaiian Affairs 2014
Coast Change Analysis Program Land Cover (C-CAP)
Land cover classification using multispectral analyses based on Landsat and high-resolution imagery; specifically for coastal lands
NOAA 1992-2012
LANDFIRE Vegetation (LF) Vegetation cover created by regression tree landscape models based on field data, satellite imagery, biophysical gradients
U.S. Geological Survey 2009
Gap Analysis Program Land Cover (HI-GAP)
Land cover using classification and regression trees based on Landsat TM satellite imagery 1999-2001, supplemented with Multi-Resolution Land Characteristic imagery and environmental data
Gon et al. 2006
Agricultural Land Use Maps (ALUM) Hand drafted maps from State Planning and Development Section & US Soil Conservation Service information; digitized
State Department of Agriculture 1978-1980
Agricultural Lands Importance (ALISH) Classified important agricultural lands into prime, unique, and other important lands; hand drafted; digitized
State Department of Agriculture 1977
Land Use Cover (LULC) Manual interpretation based on 1970's aerial photography U.S. Geological Survey 1976
Land Study Bureau (LSB) Land classification and productivity rating based on aerial photography and topographic maps; hand drafted onto paper; digitized
Land Study Bureau 1972

1B: Compiled Land Use DatasetsALUB vs CAH
• ALUB: 2011-2015, stakeholder input, only agricultural lands
• CAH: includes other table layers, 2014, NWL
ArcGIS 10.4.1
• “Joined” CAH & ALUB layers
• NAD 83 Zone 4N
Hawai`i Soil Health Data
• Ground-truth data points
• Collected 2017-2020 (up-to-date)
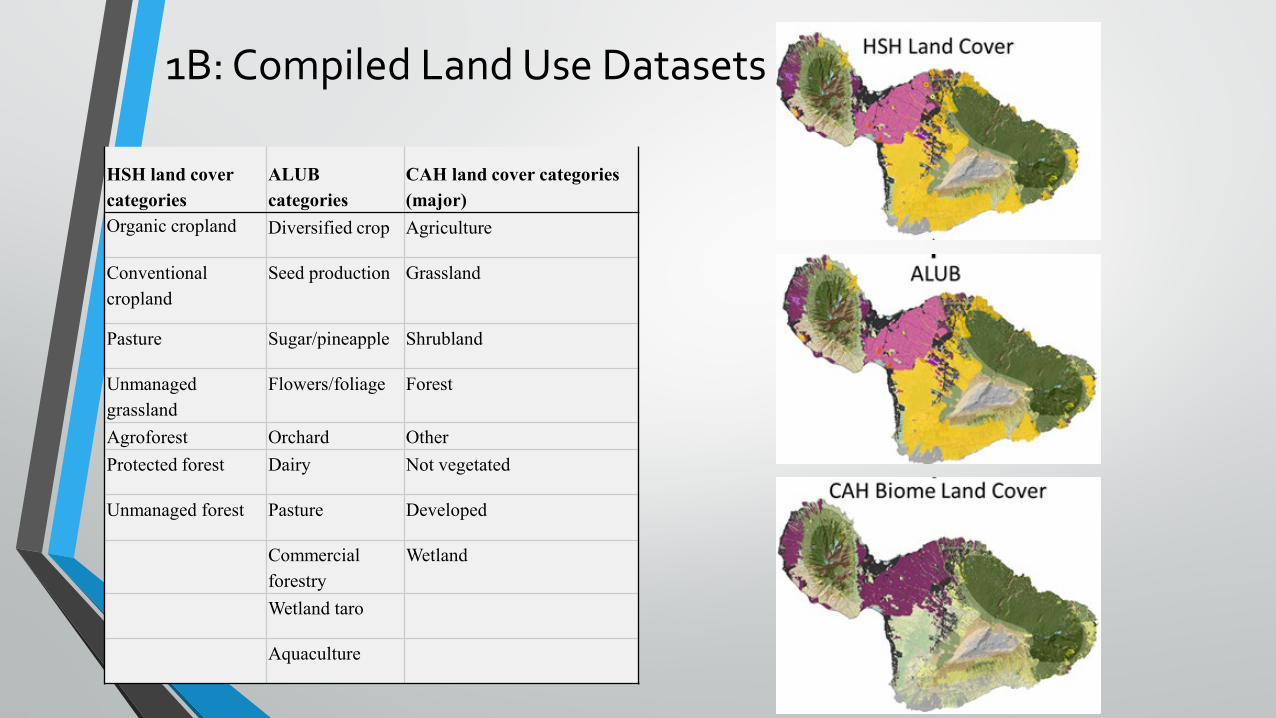
HSH land cover categories
ALUB categories
CAH land cover categories (major)
Organic cropland Diversified crop Agriculture
Conventional cropland
Seed production Grassland
Pasture Sugar/pineapple Shrubland
Unmanaged grassland
Flowers/foliage Forest
Agroforest Orchard OtherProtected forest Dairy Not vegetated
Unmanaged forest Pasture Developed
Commercial forestry
Wetland
Wetland taro
Aquaculture
1B: Compiled Land Use Datasets

CAH: Larger general ag lands, but most pasture lands not classified ag
ALUB: Larger range of pasture lands, but did not distinguish developed areas (e.g.roads, structures)
HSH: Showed some ALUB lands were abandoned, unmanaged (up-to-date)
1B: Compiled Land Use Datasets

A. Collect soil from diverse natural and working land types
• Partnered projects, baseline data network
• Land use history and change; soil-carbon-building practices
Project Approach#2: Soil Health Data
B. Quantify soil health parameters
• Physical, chemical, biological (11 key parameters)

Samples Collected in Network
• # of sites= 14# samples= 47
• Land-use change (new) v. Benchmarks (long-term e.g.forested)
• Soil Types= Vertisols, Mollisols, Oxisols, Inceptisols

Compost, Organic Soil Amendments
Implemented Soil C Promoting Practices
Cover Cropping
Photo: Kako`o `Oiwi
AgroecologyRestoration

AnalysesRecommended Indicator Soil Function(s) Relation
Biological 24 hr CO2 burst Soil life, nutrient cycling, carbon storage and cyclingBeta-glucosiminidase
Beta-glucosidase
Mineralizable nitrogen
Chemical Total organic C % Carbon storage, soil life, nutrient cyclingDOC: DON
Hot water extractable organic C
pH
Physical Water holding capacity % Plant growth, soil life, water infiltration and supply, carbon cycling and storage
Water stable meta-aggregates %
Bulk density

Summarized Soil Health Results (Averages)Site PIAL. Current LU Min %OC CO2
burstPMN pH DOC:DO
NHWEC
WHC mega-WSA
BD
1 PIAL Unmanaged LAC 2.67 73.60 24.78 5.29 116.70 91.0 77.08 7.89 1.102 none Protect Forest LAC 6.68 371.26 175.92 7.22 13.27 1,223. 130.24 13.41 1.053 none Organic HAC 1.20 63.40 8.45 7.77 7.80 279.2 100.21 1.71 0.854 PIAL Convent. HAC 1.54 45.73 6.08 7.01 19.66 321.3 89.56 1.50 1.005 PIAL Convent. HAC 2.23 34.33 4.73 6.48 11.98 241.1 79.94 1.44 0.906 PIAL Convent. HAC 1.42 15.75 0.77 8.14 17.69 117.0 77.19 2.50 1.107 none Organic HAC 1.22 18.98 2.48 7.42 11.26 146.3 75.66 6.14 0.808 none Protect Forest LAC 15.16 133.16 78.79 5.15 88.84 1,172 129.50 39.66 1.109 PIAL Unmanaged LAC 10.04 405.27 124.28 7.64 159.19 1,286 104.94 10.16 1.10
10 PIAL Unmanaged LAC 7.86 371.20 111.55 6.91 113.06 454.2 107.40 7.95 1.1011 PIAL Unmanaged HAC 6.09 307.59 104.17 7.88 158.94 600.2 84.69 14.21 1.2512 PIAL Unmanaged HAC 10.39 69.95 29.12 5.89 47.34 155.3 133.61 11.38 1.2513 none Flood plain HAC 6.62 309.69 95.37 6.97 101.41 350.1 117.54 21.01 1.1314 N Beach Sand 25.88 49.04 21.87 7.91 135.43 147.5 42.00 0.59 1.48Ex PIAL --- --- 2.1 37.2 11.6 6.42 203.0 197.3 69.7 29.5 0.94Ex N --- --- 11.0 195.2 83.7 6.43 94.1 2,378.1 108.5 67.4 0.69
Source: Hubanks 2019

Summary• Gaps:
o GHG fluxes from pasturelands
o Soil C sequestration rates from ag lands and converted lands
o Inconsistencies in GIS data layers
• Future work (outside of this project)
o Updating NWL data layers to create tool
o Publications to assist land managers, soil C building practices

Mahalo!
Joshua Silva
UH Cooperative Extension
Dr. Susan Crow
UH CTAHR