Embed Size (px)
Citation preview
SOIL ACIDIFICATION:
MANAGEMENT AND IMPACT
ON CEREAL DISEASES
DR. KURTIS L. SCHROEDER
CROPPING SYSTEMS AGRONOMY AND
PLANT PATHOLOGY
DOUG FINKELNBURG
AREA EXTENSION EDUCATOR
DECEMBER 11, 2018
OUTLINE
• Introduction to soil acidity
• Survey of north Idaho
• Management of soil acidity
• Hands-on demonstrations
• Interaction between soil pH and plant
pathogens
SOIL PH
•Degree of acidity or alkalinity (0 to 14 scale)
•Soil solution pH = -log [H+]
•Each unit of pH change = 10X change in H+
pH of 5 is 10 times more acid than 6
• Impacts soil chemistry and biological properties
Root uptake of nutrients and toxins
Activity of soil microorganisms
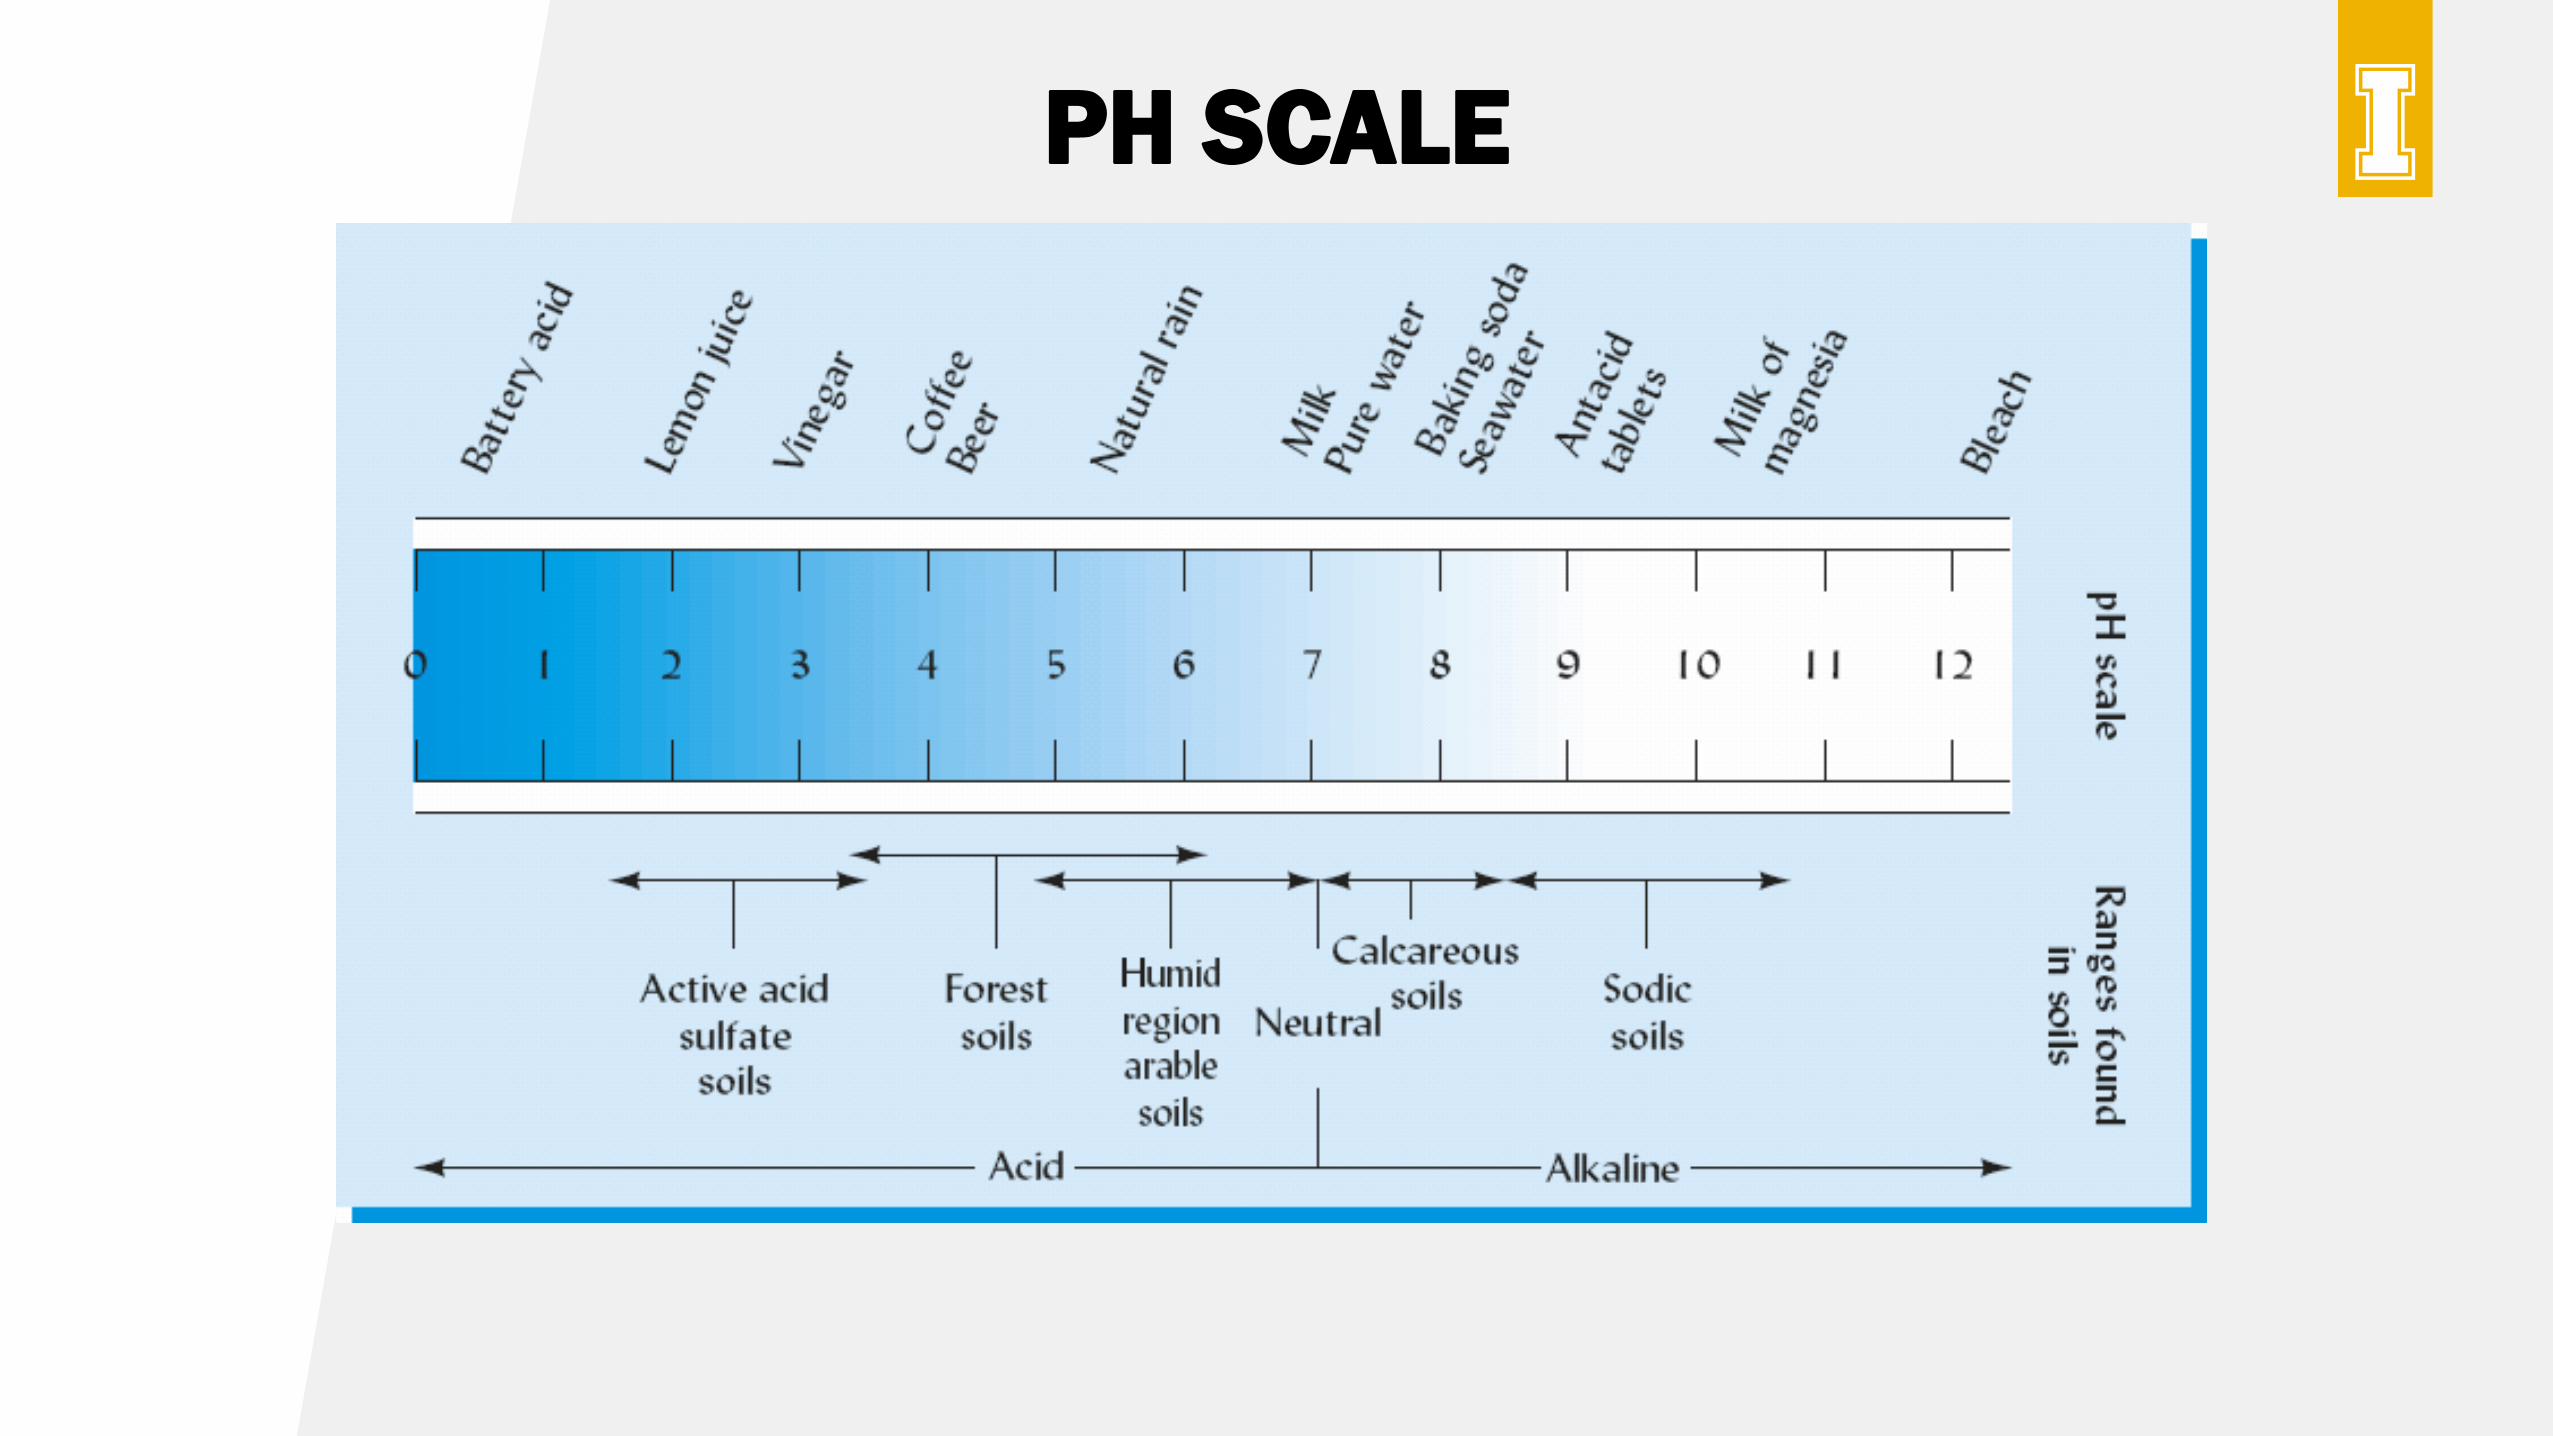
PH SCALE
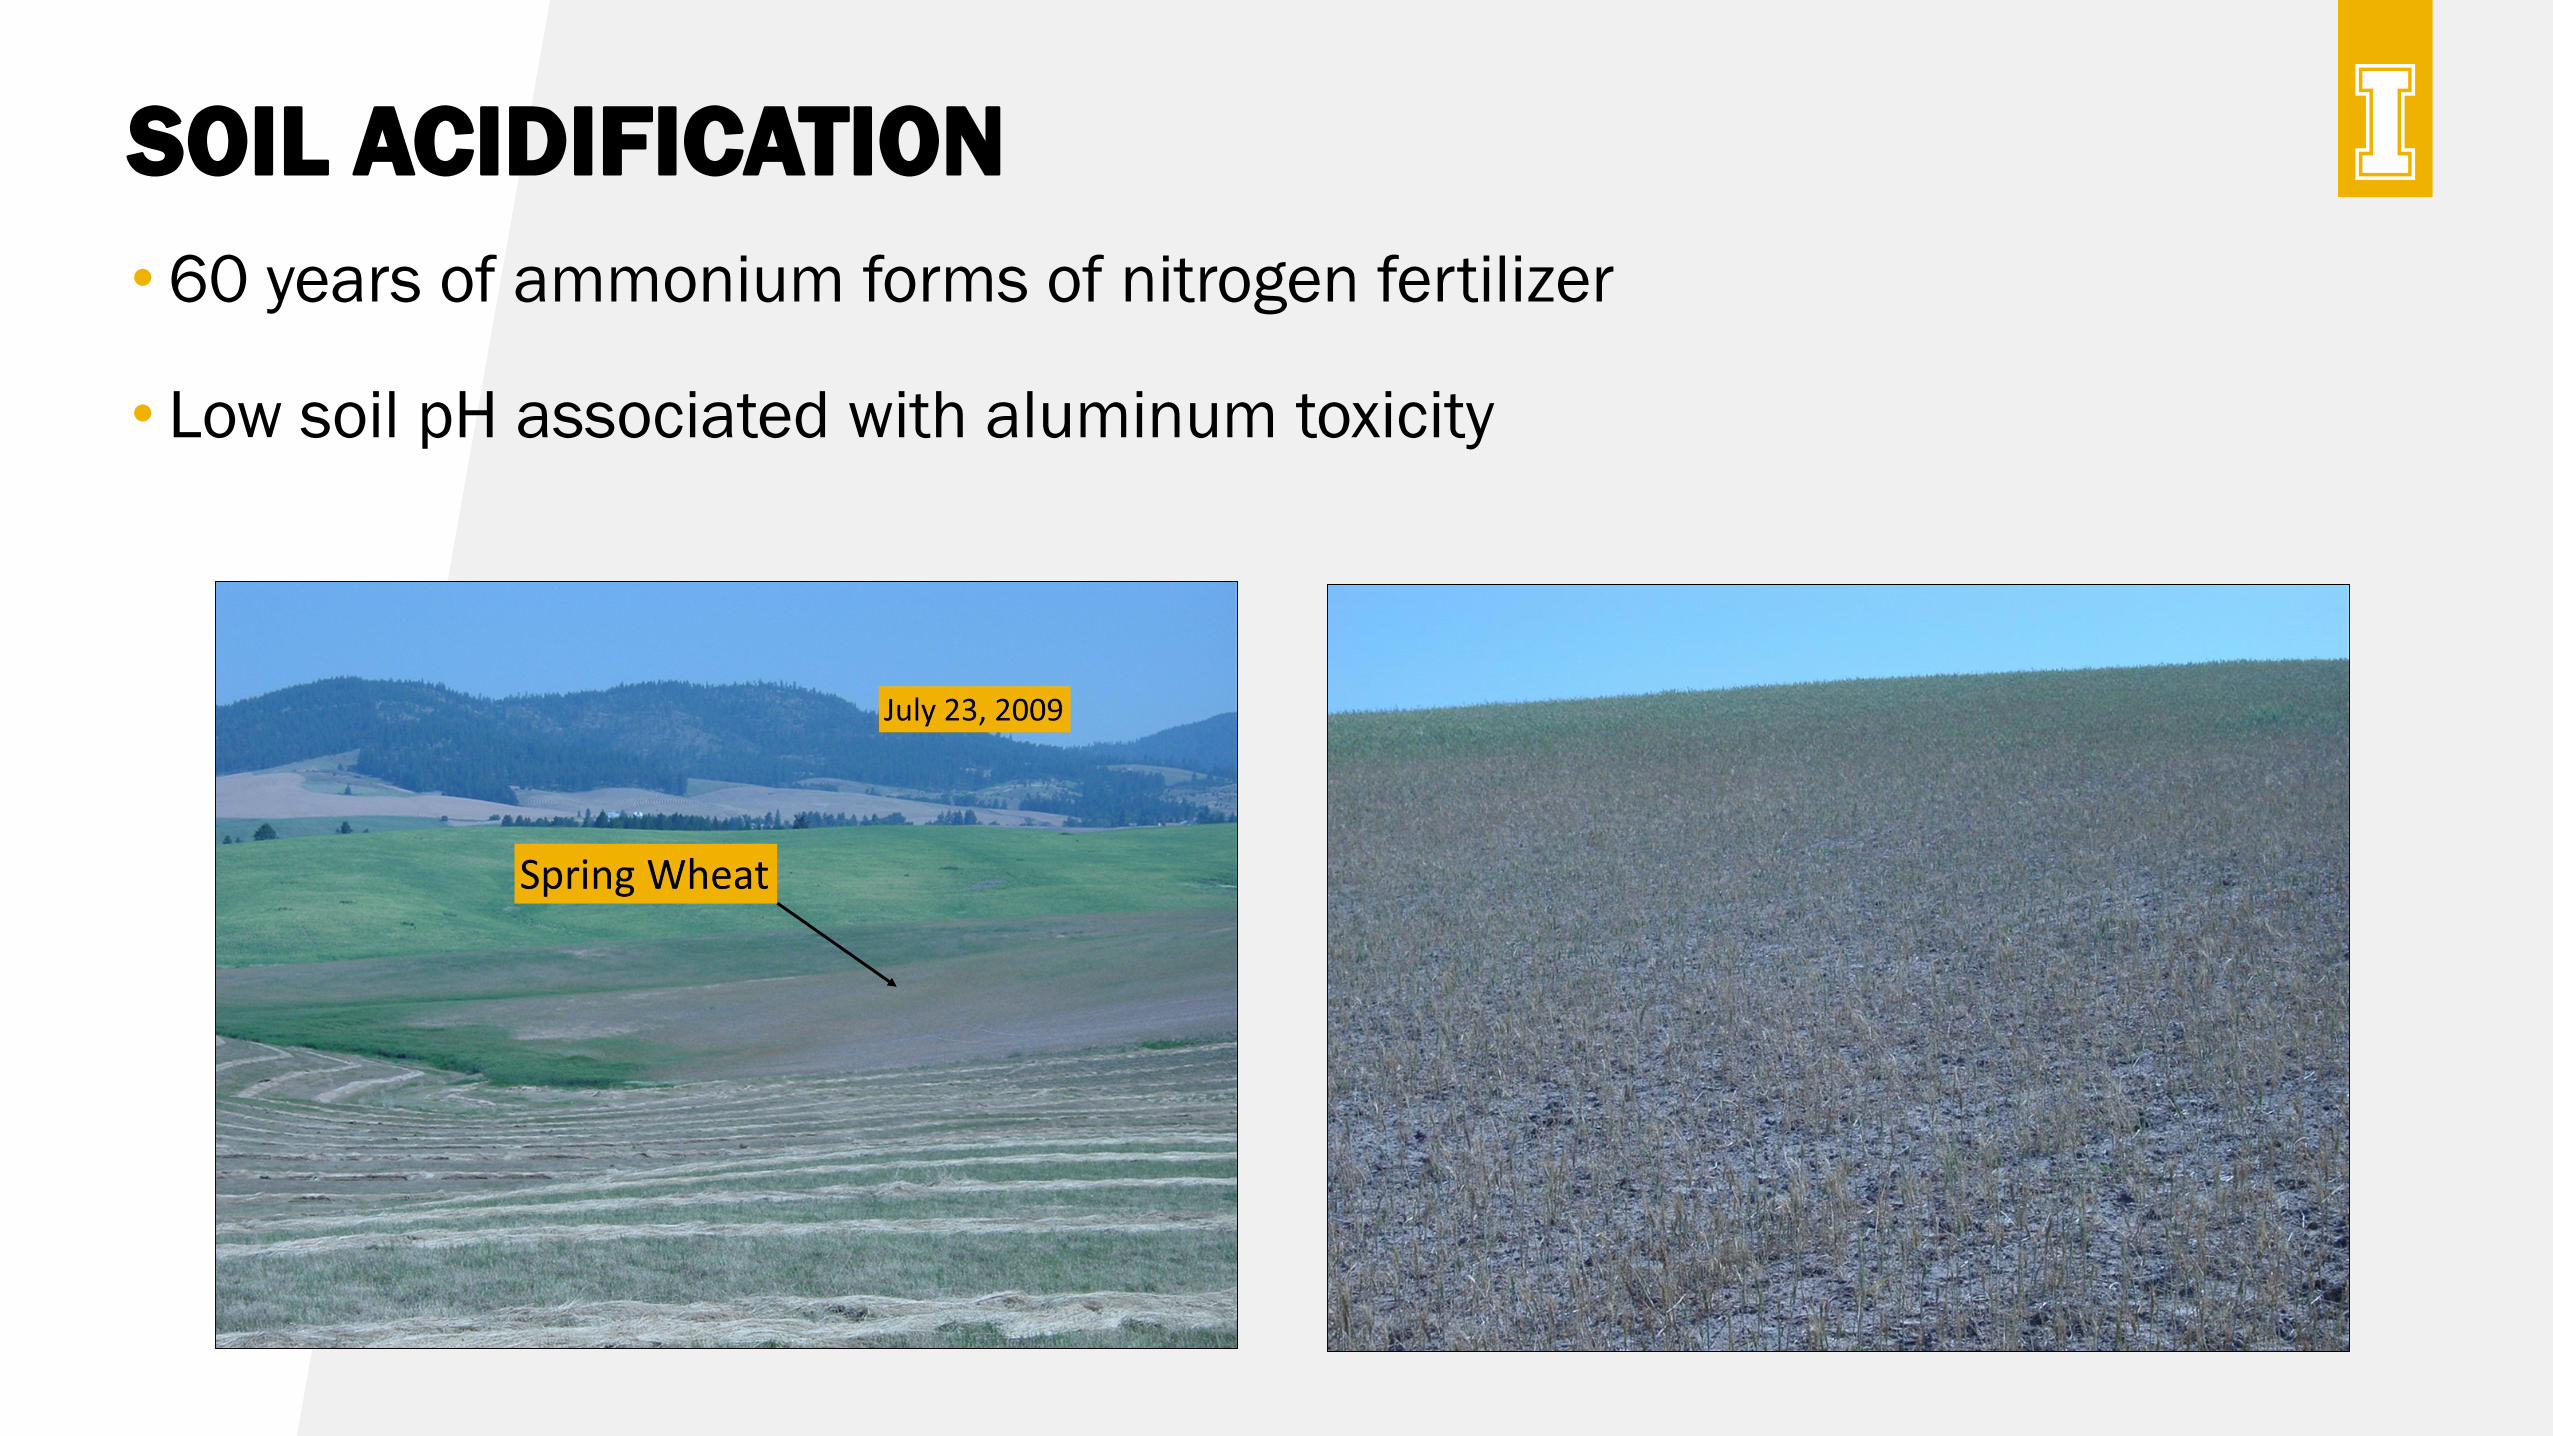
SOIL ACIDIFICATION
• 60 years of ammonium forms of nitrogen fertilizer
• Low soil pH associated with aluminum toxicity
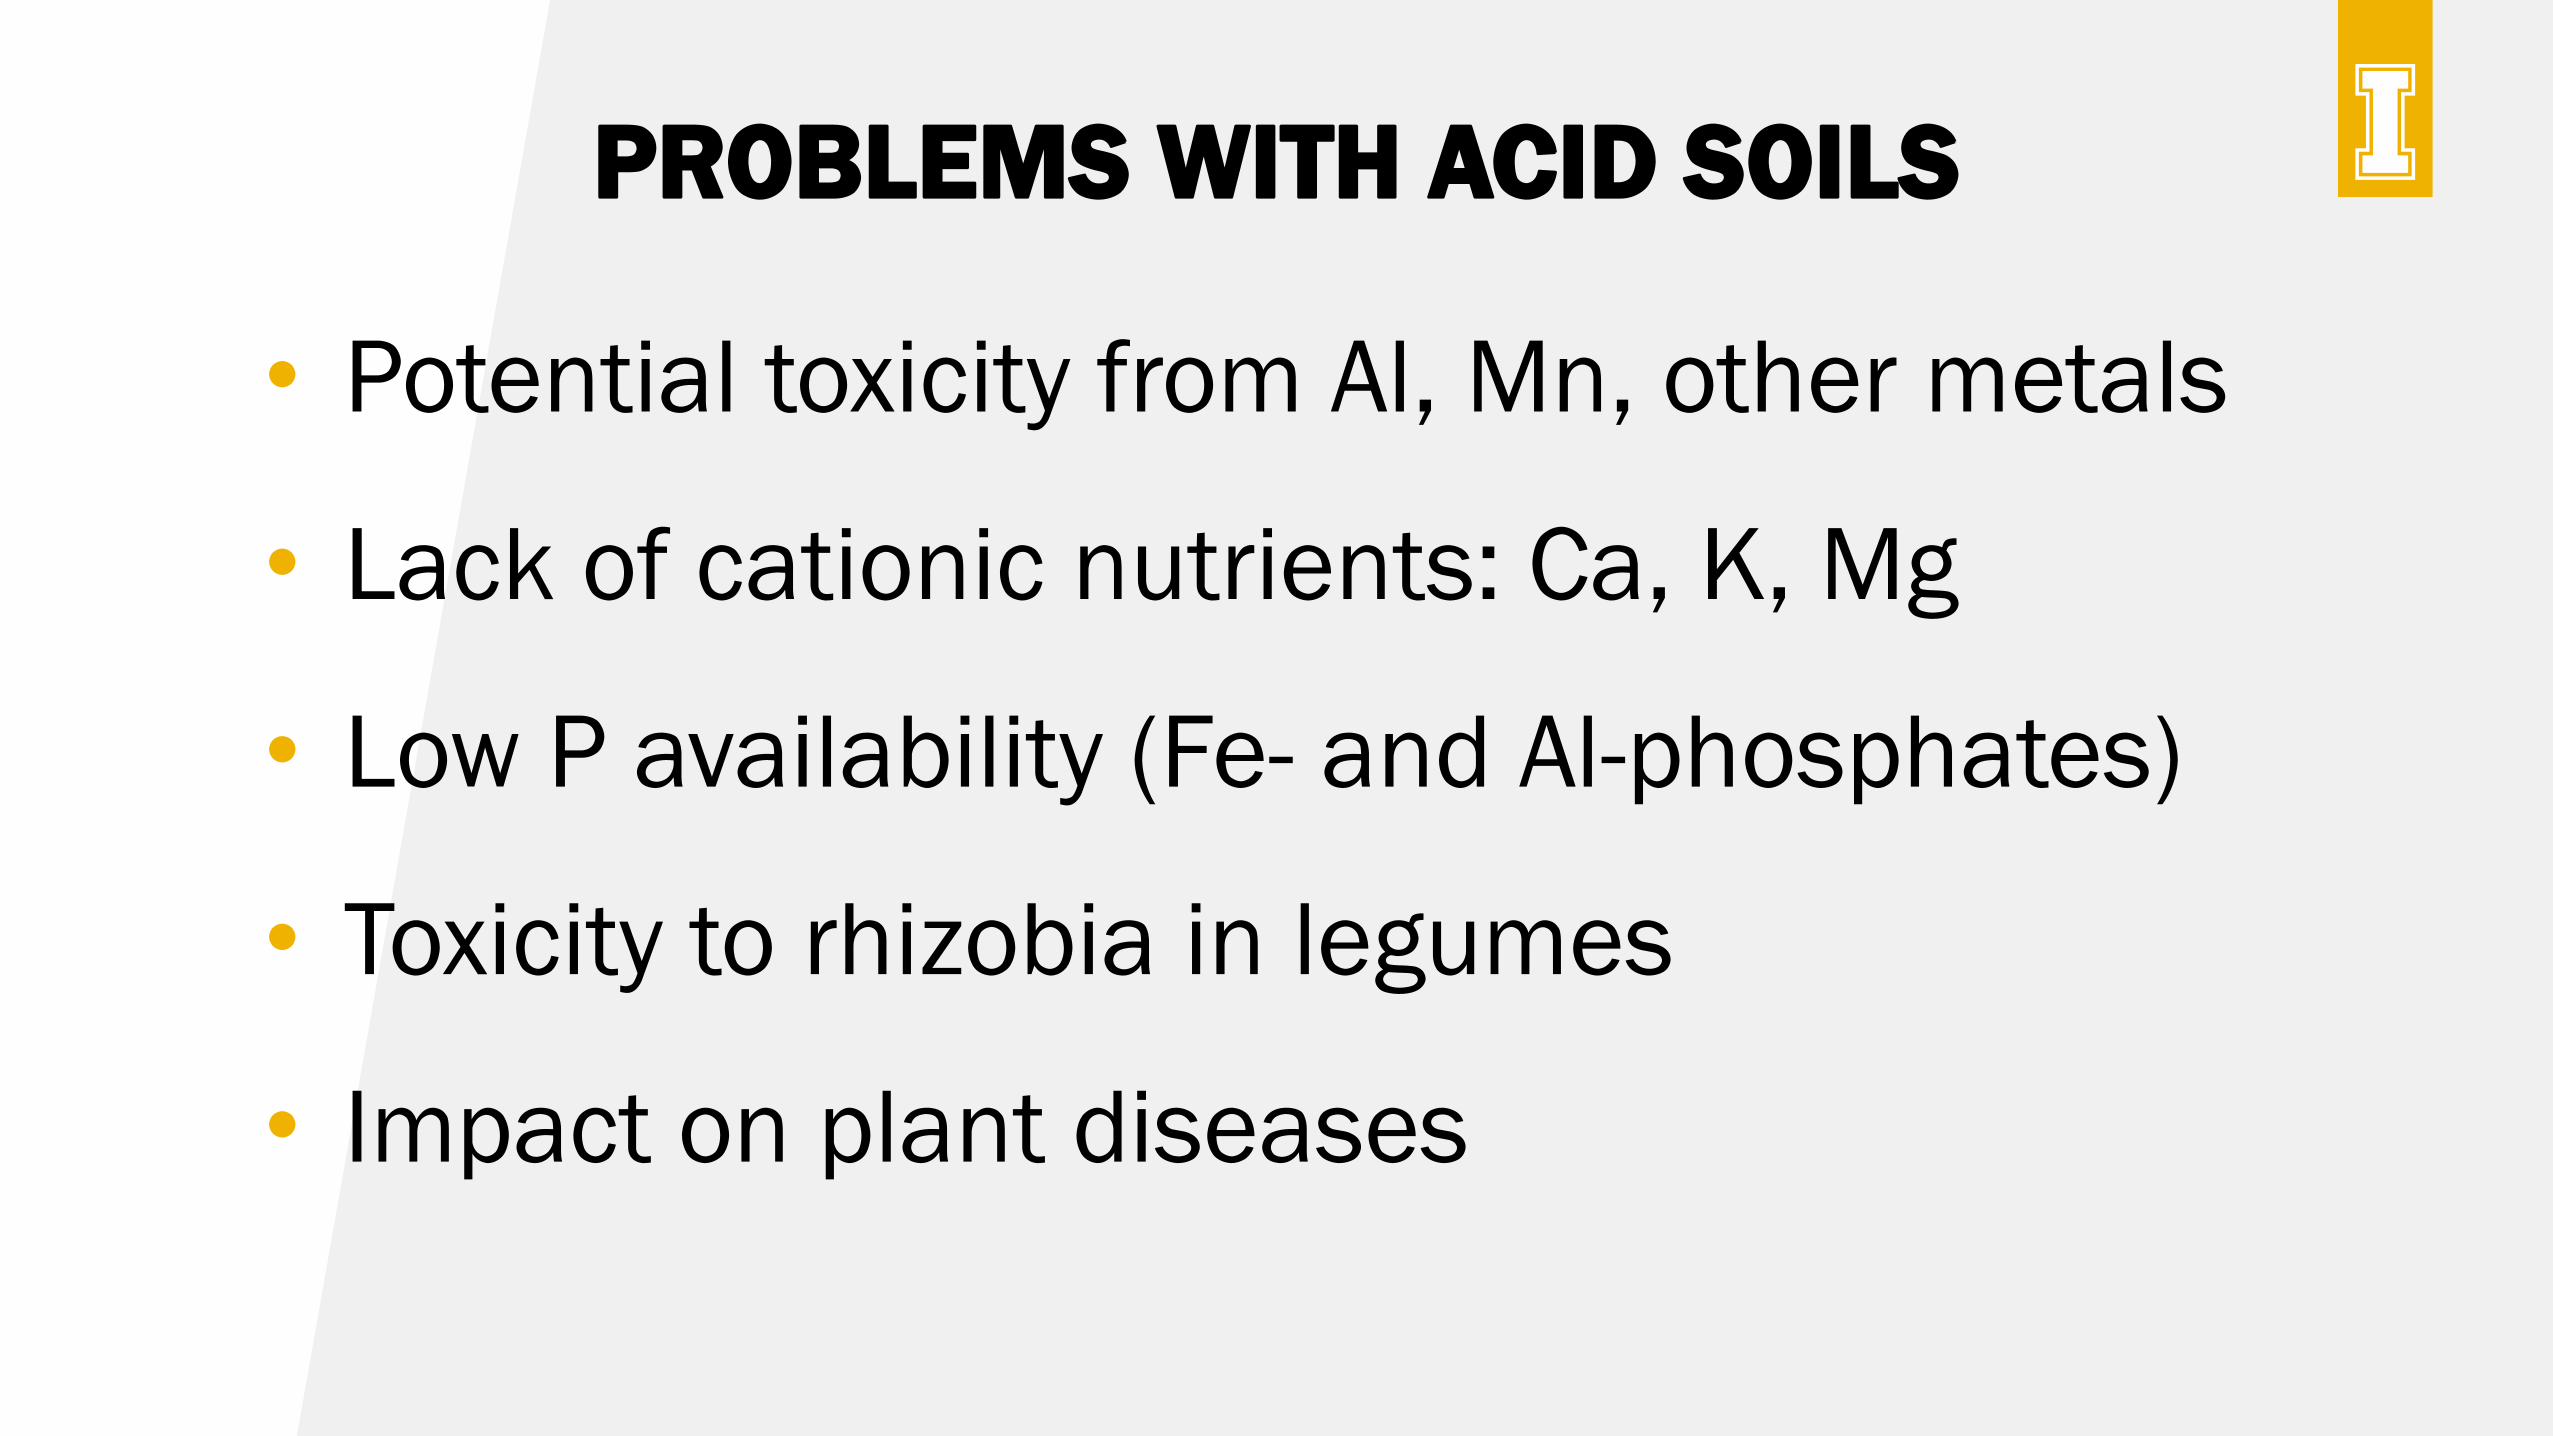
PROBLEMS WITH ACID SOILS
• Potential toxicity from Al, Mn, other metals
• Lack of cationic nutrients: Ca, K, Mg
• Low P availability (Fe- and Al-phosphates)
• Toxicity to rhizobia in legumes
• Impact on plant diseases
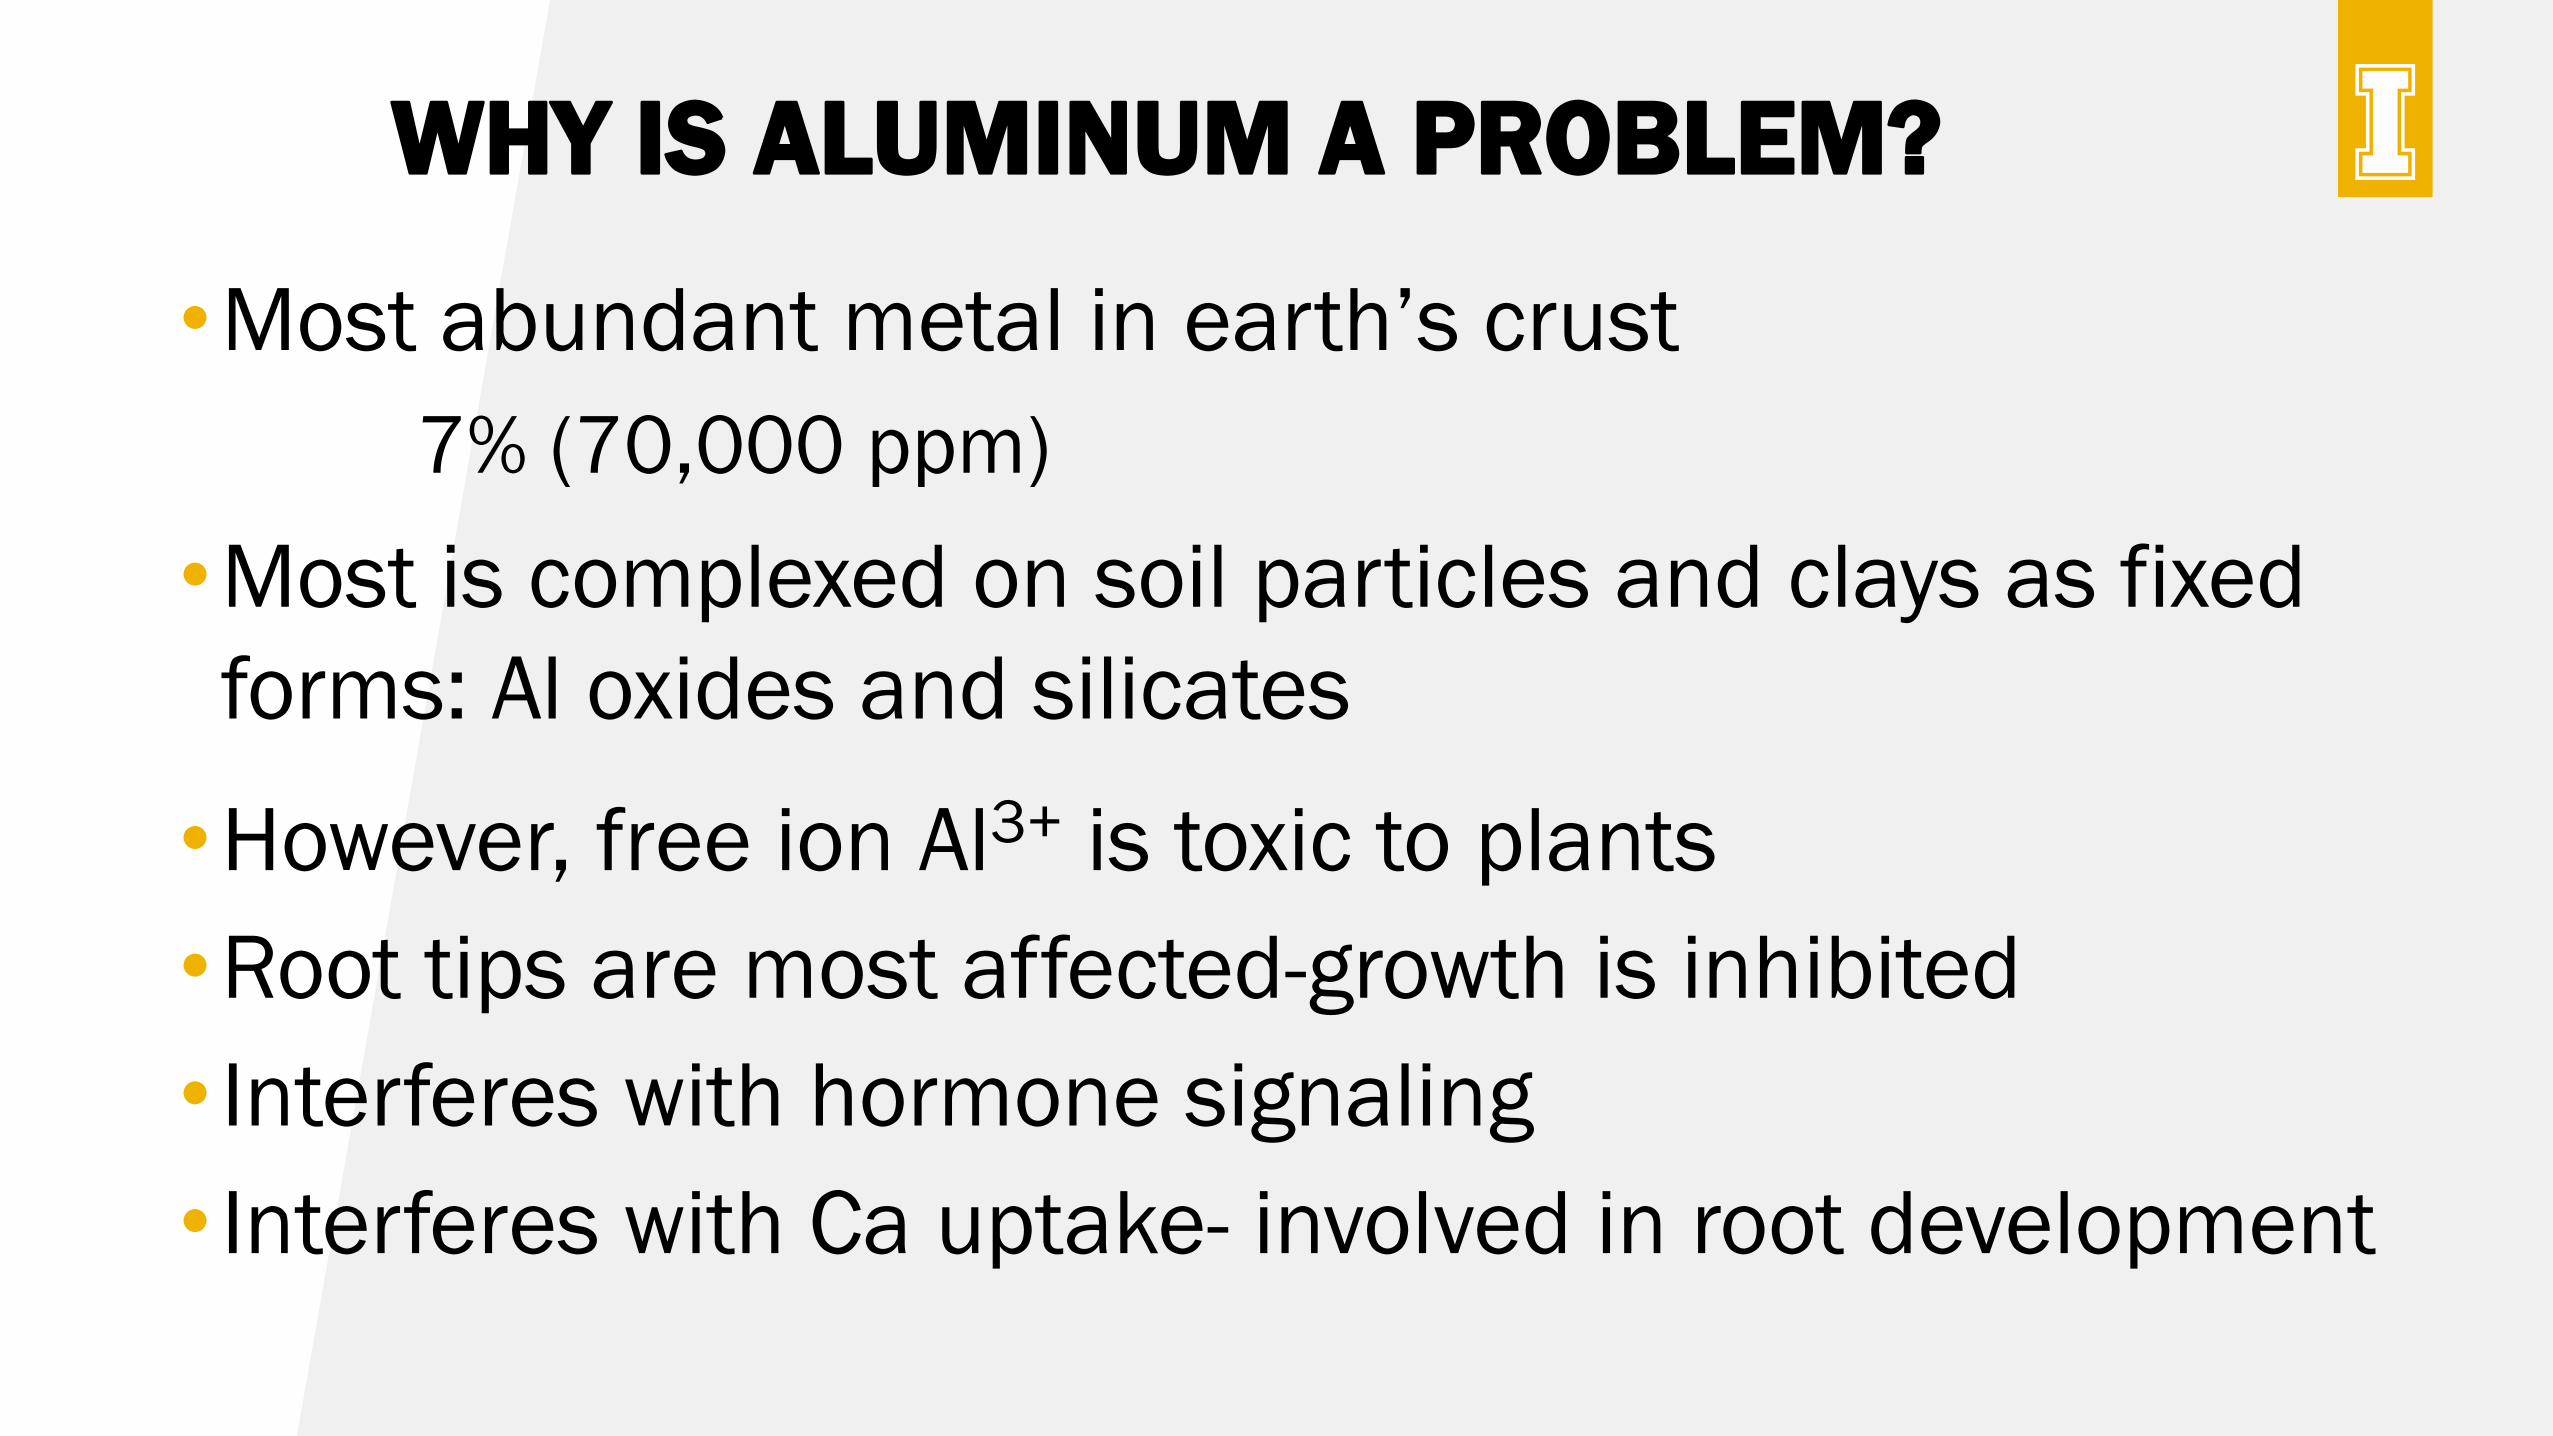
WHY IS ALUMINUM A PROBLEM?
•Most abundant metal in earth’s crust
7% (70,000 ppm)
•Most is complexed on soil particles and clays as fixed
forms: Al oxides and silicates
•However, free ion Al3+ is toxic to plants
•Root tips are most affected-growth is inhibited
• Interferes with hormone signaling
• Interferes with Ca uptake- involved in root development

ALUMINUM TOXICITY DAMAGE ON WHEAT ROOTS
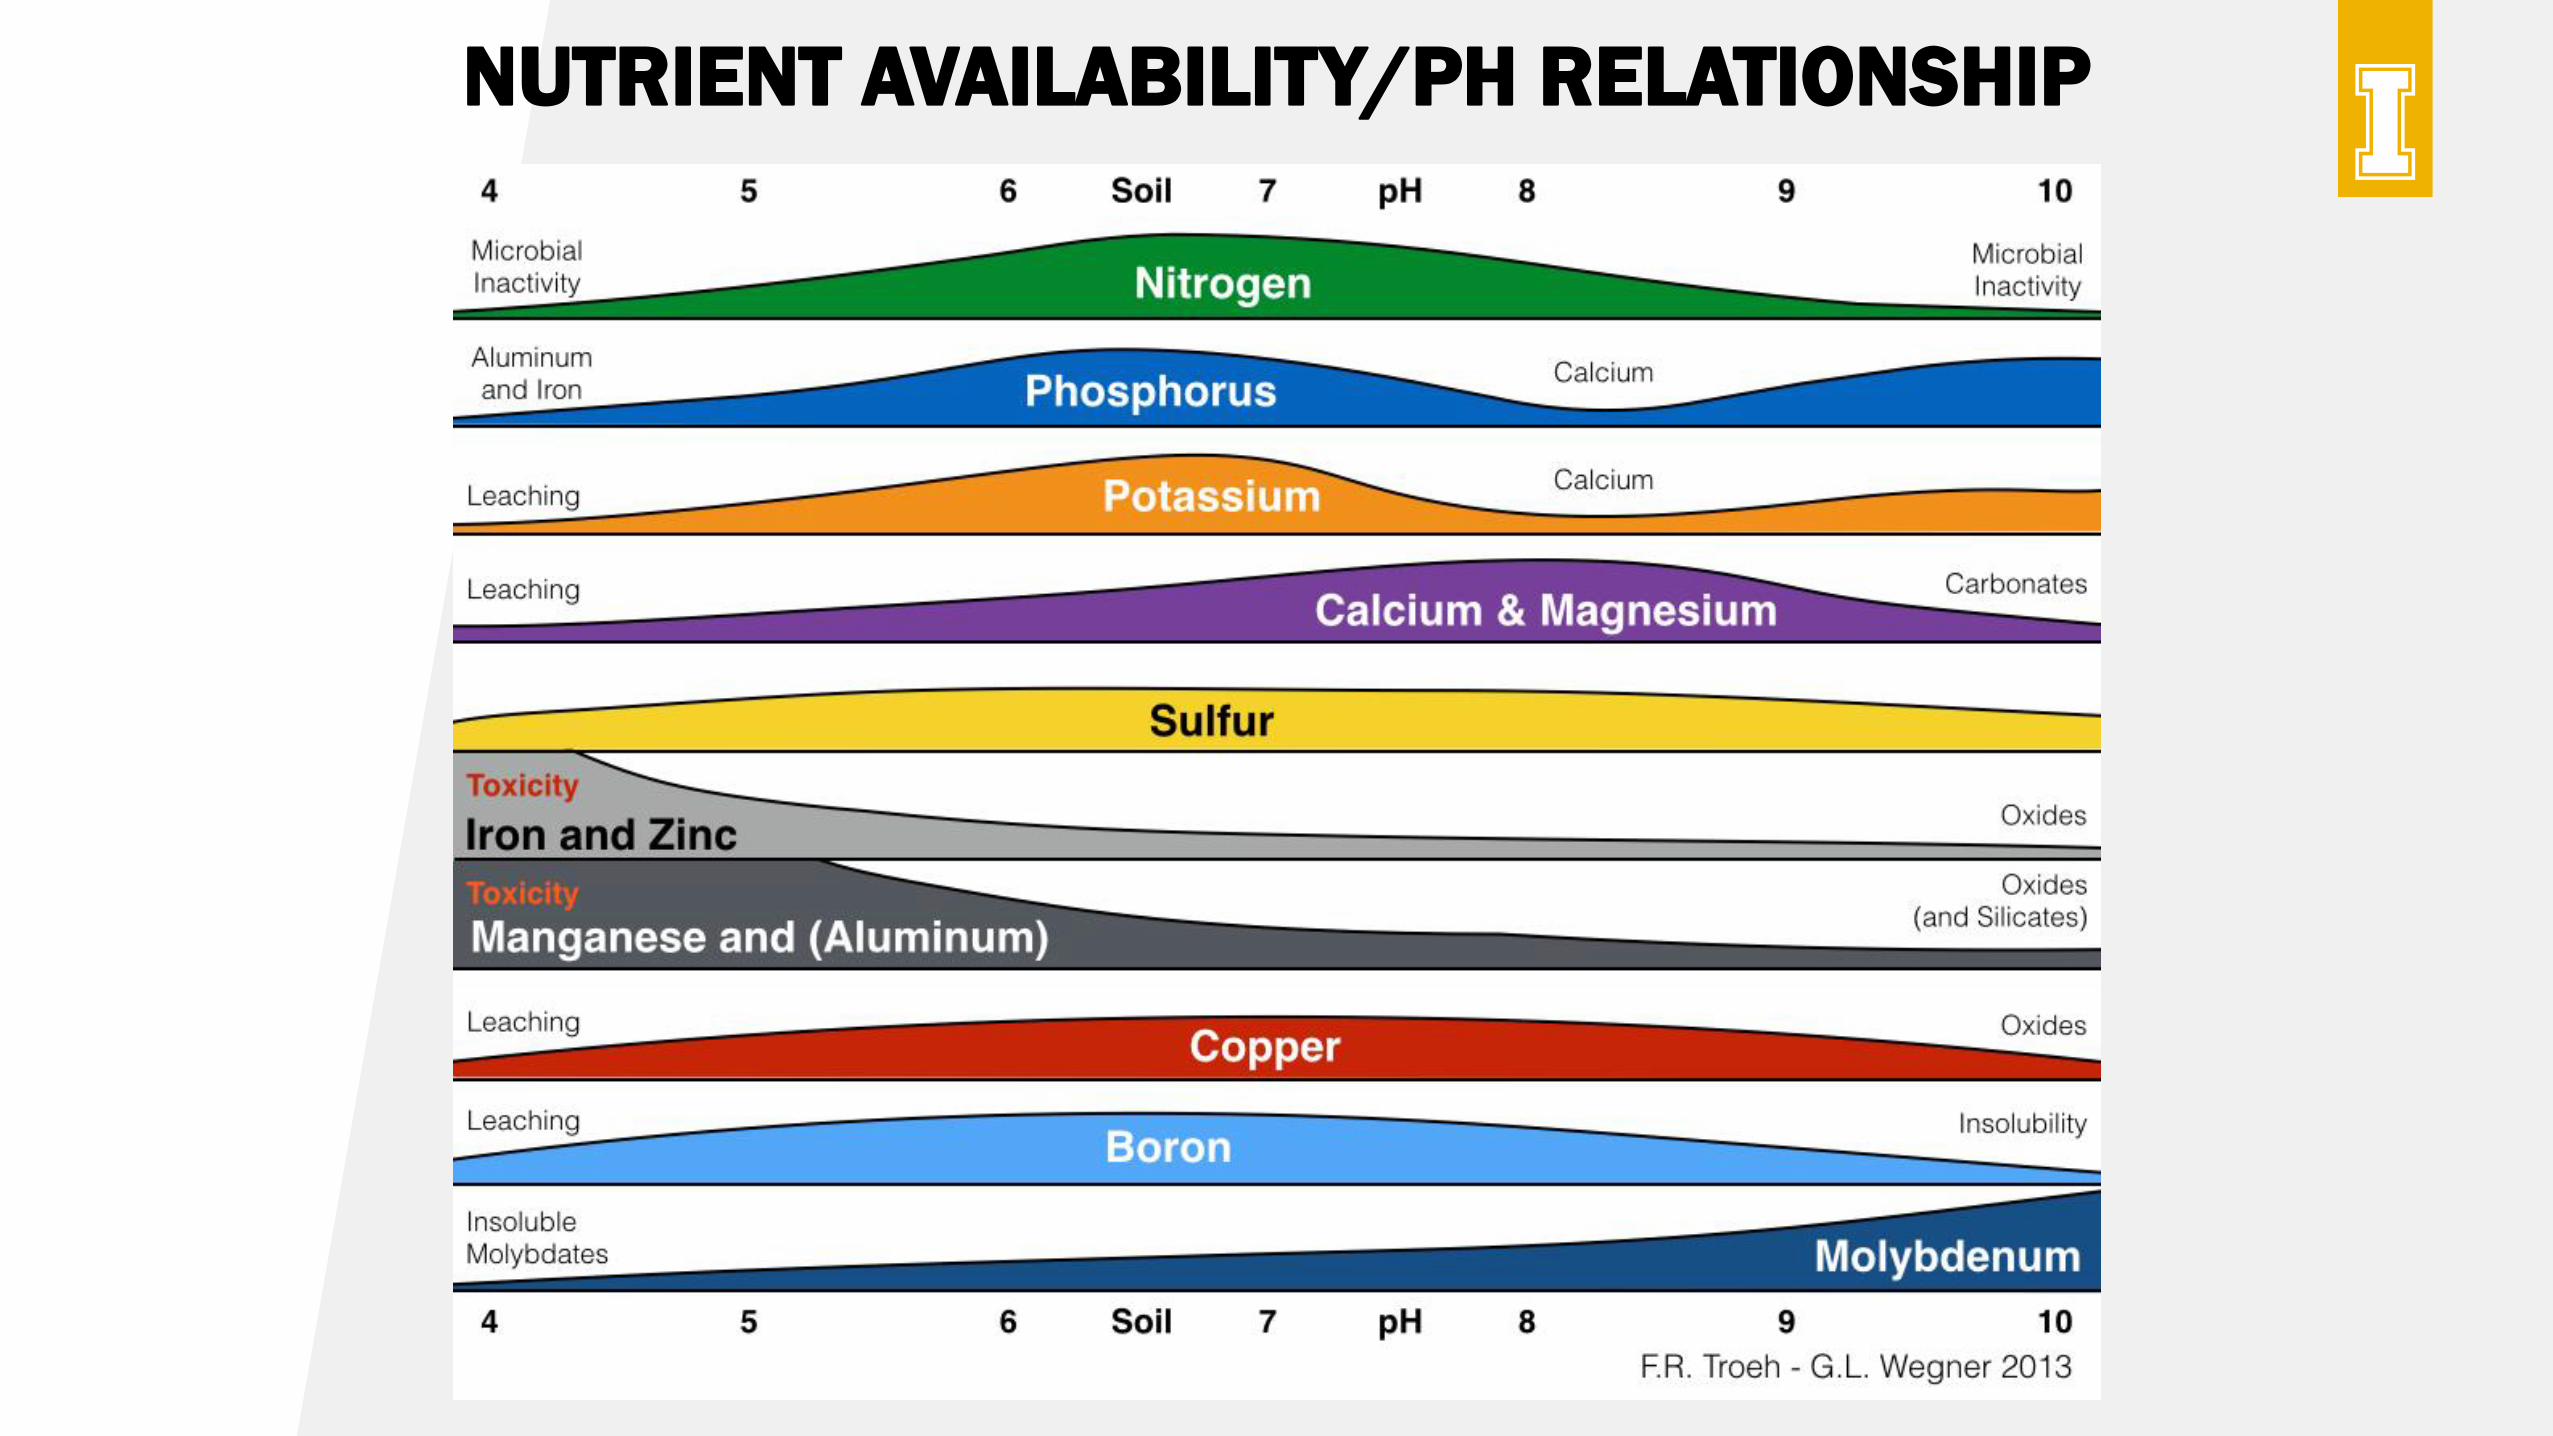
NUTRIENT AVAILABILITY/PH RELATIONSHIP
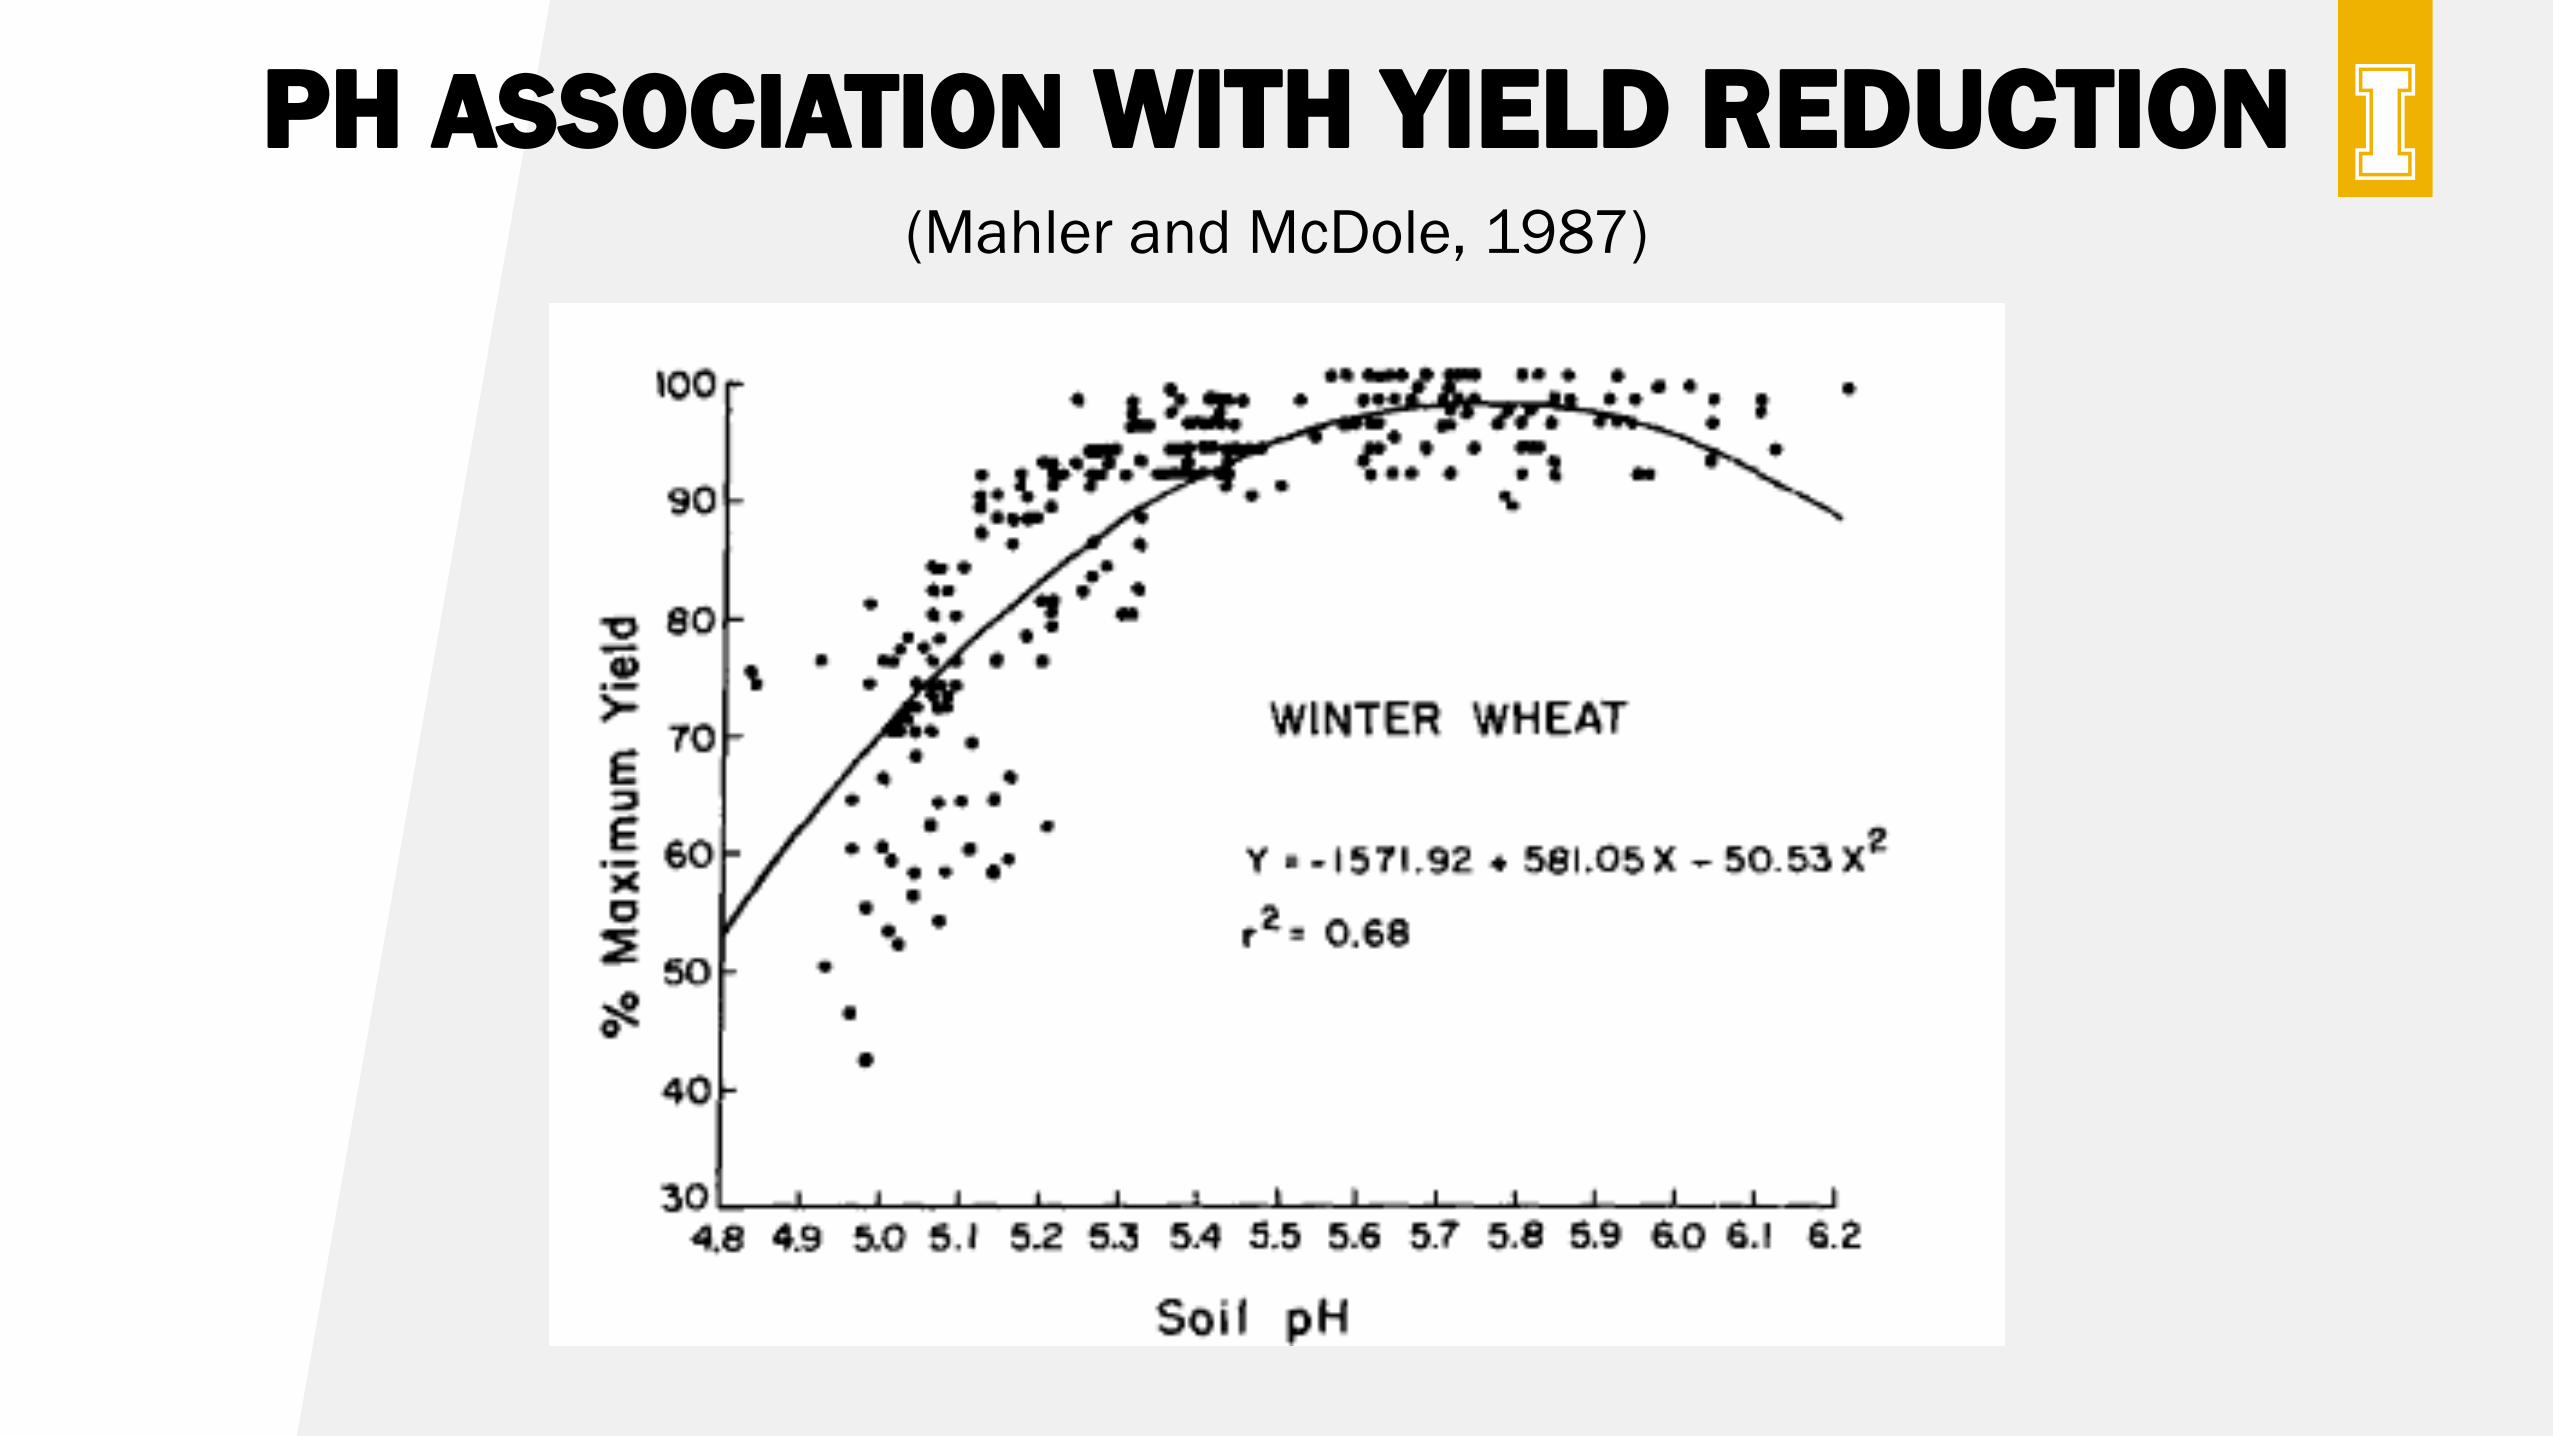
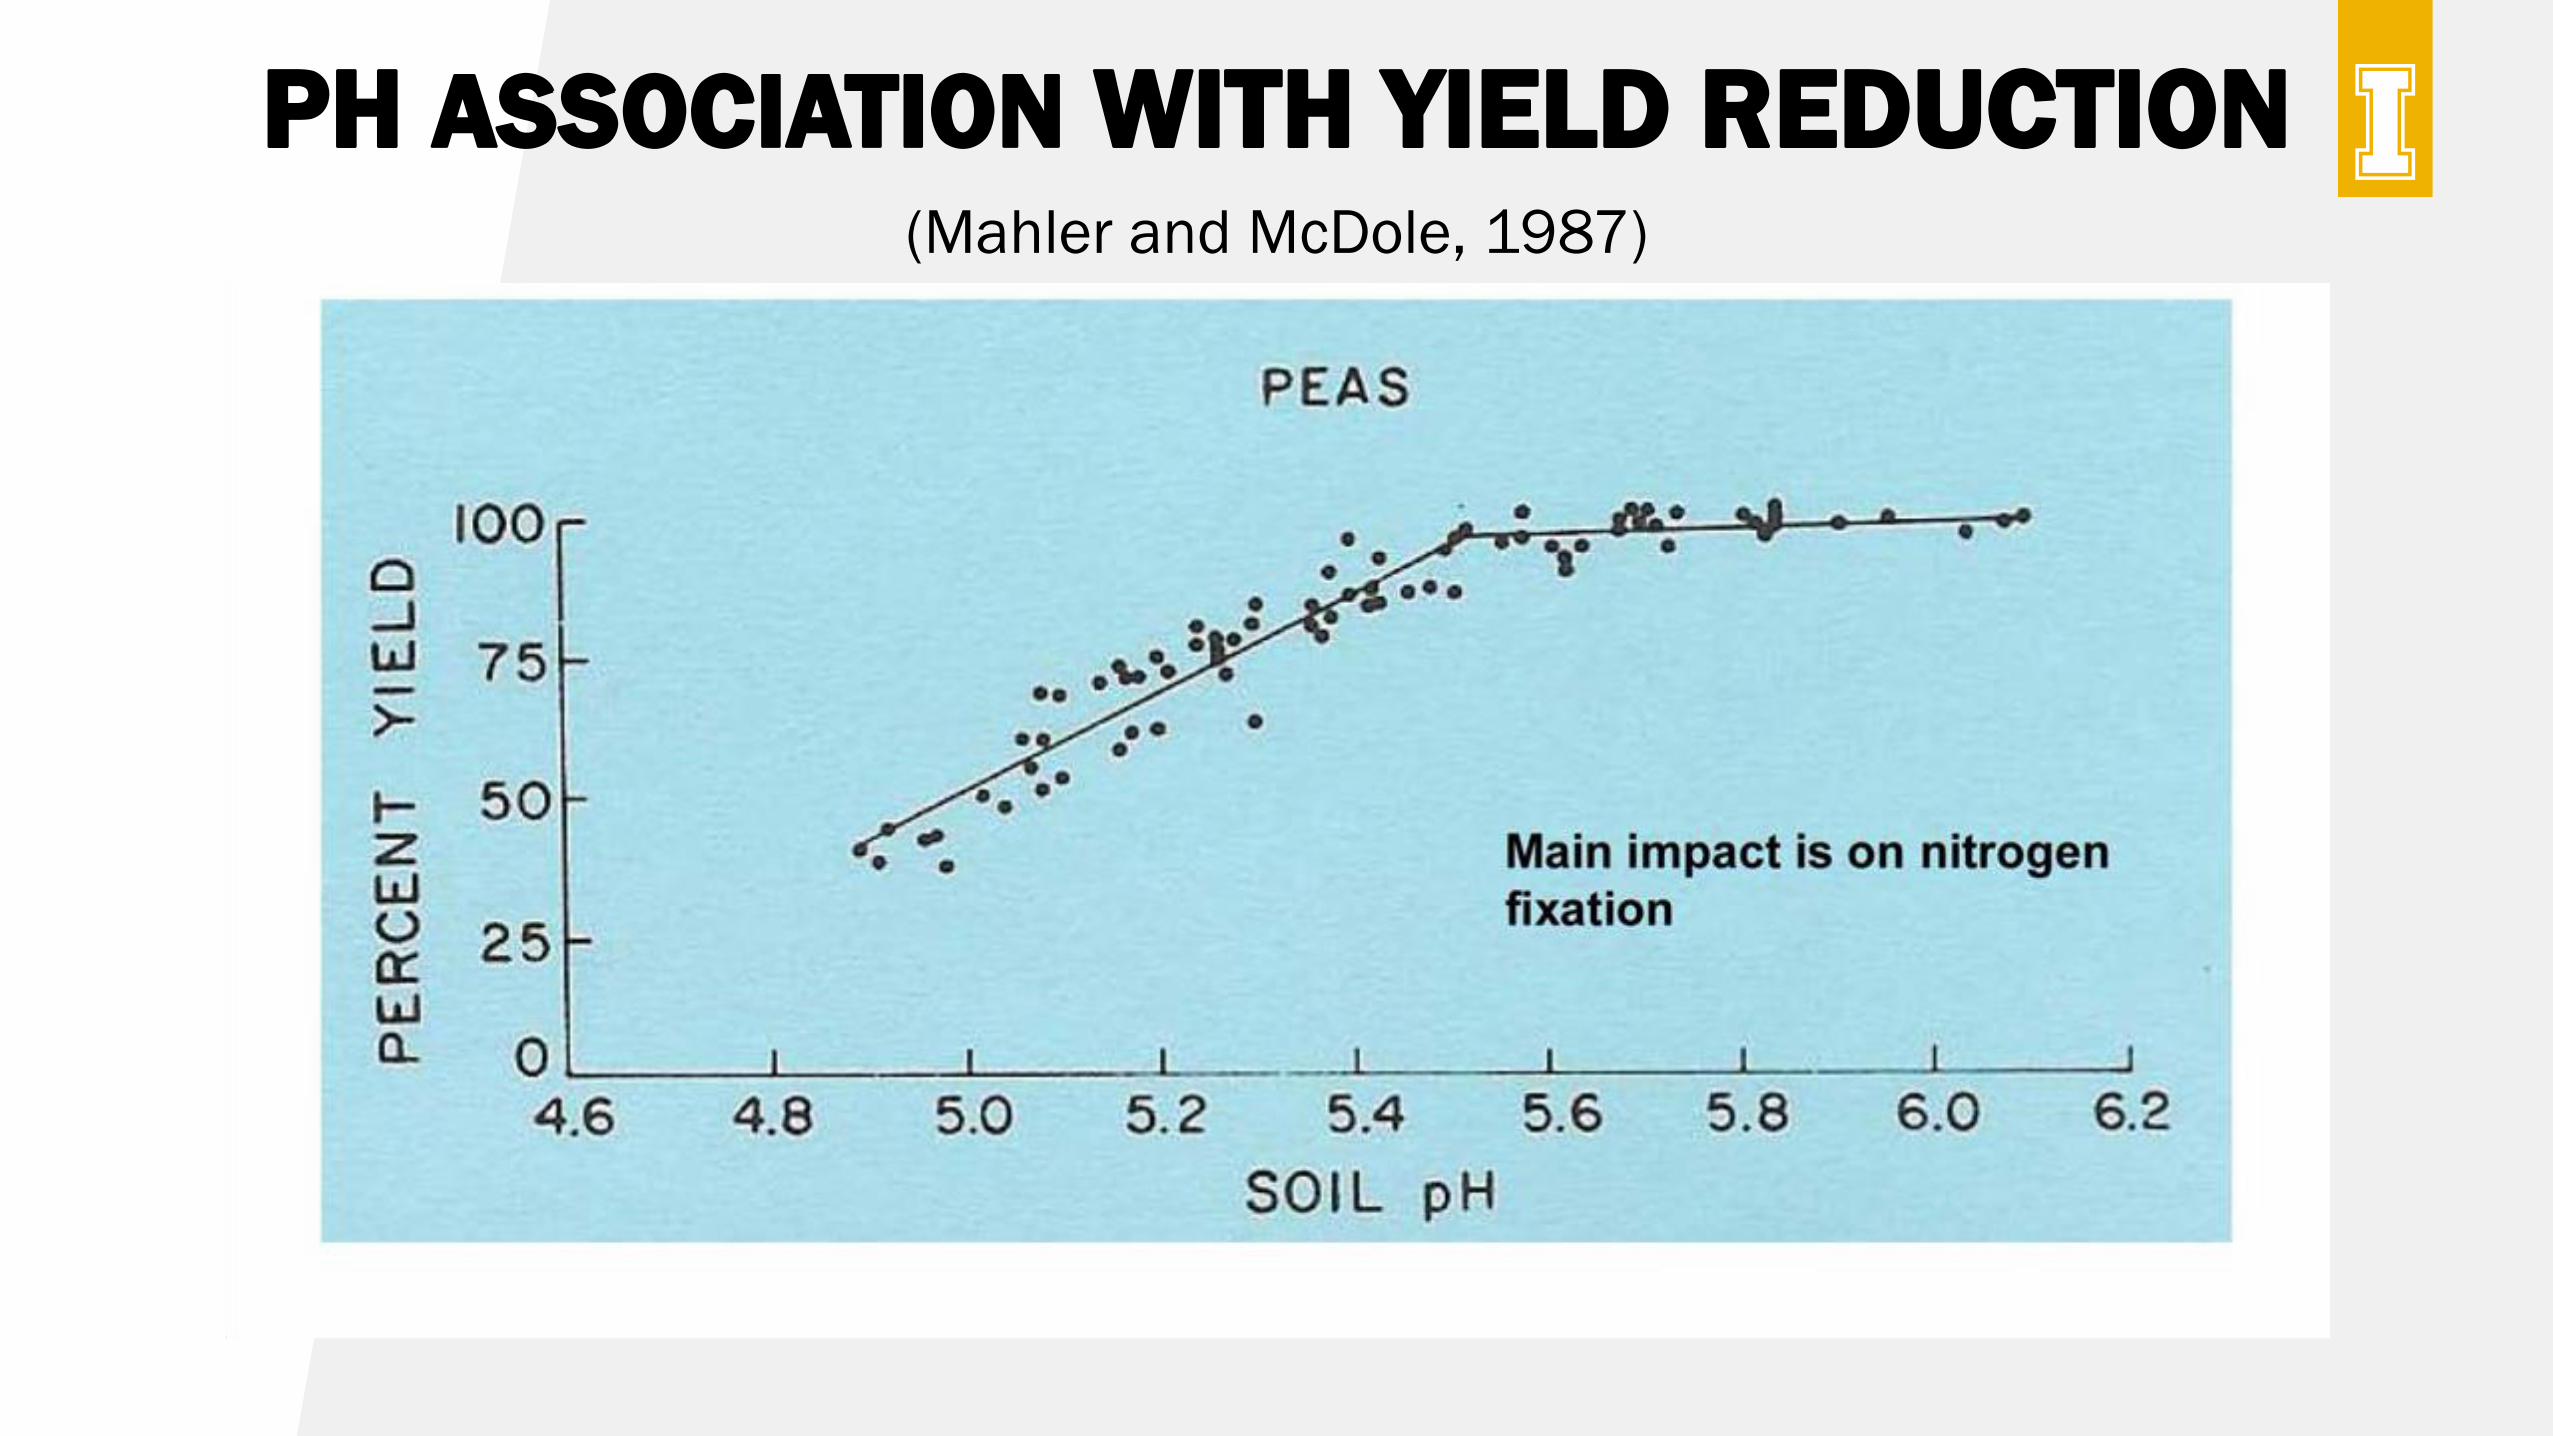
PH ASSOCIATION WITH YIELD REDUCTION(Mahler and McDole, 1987)
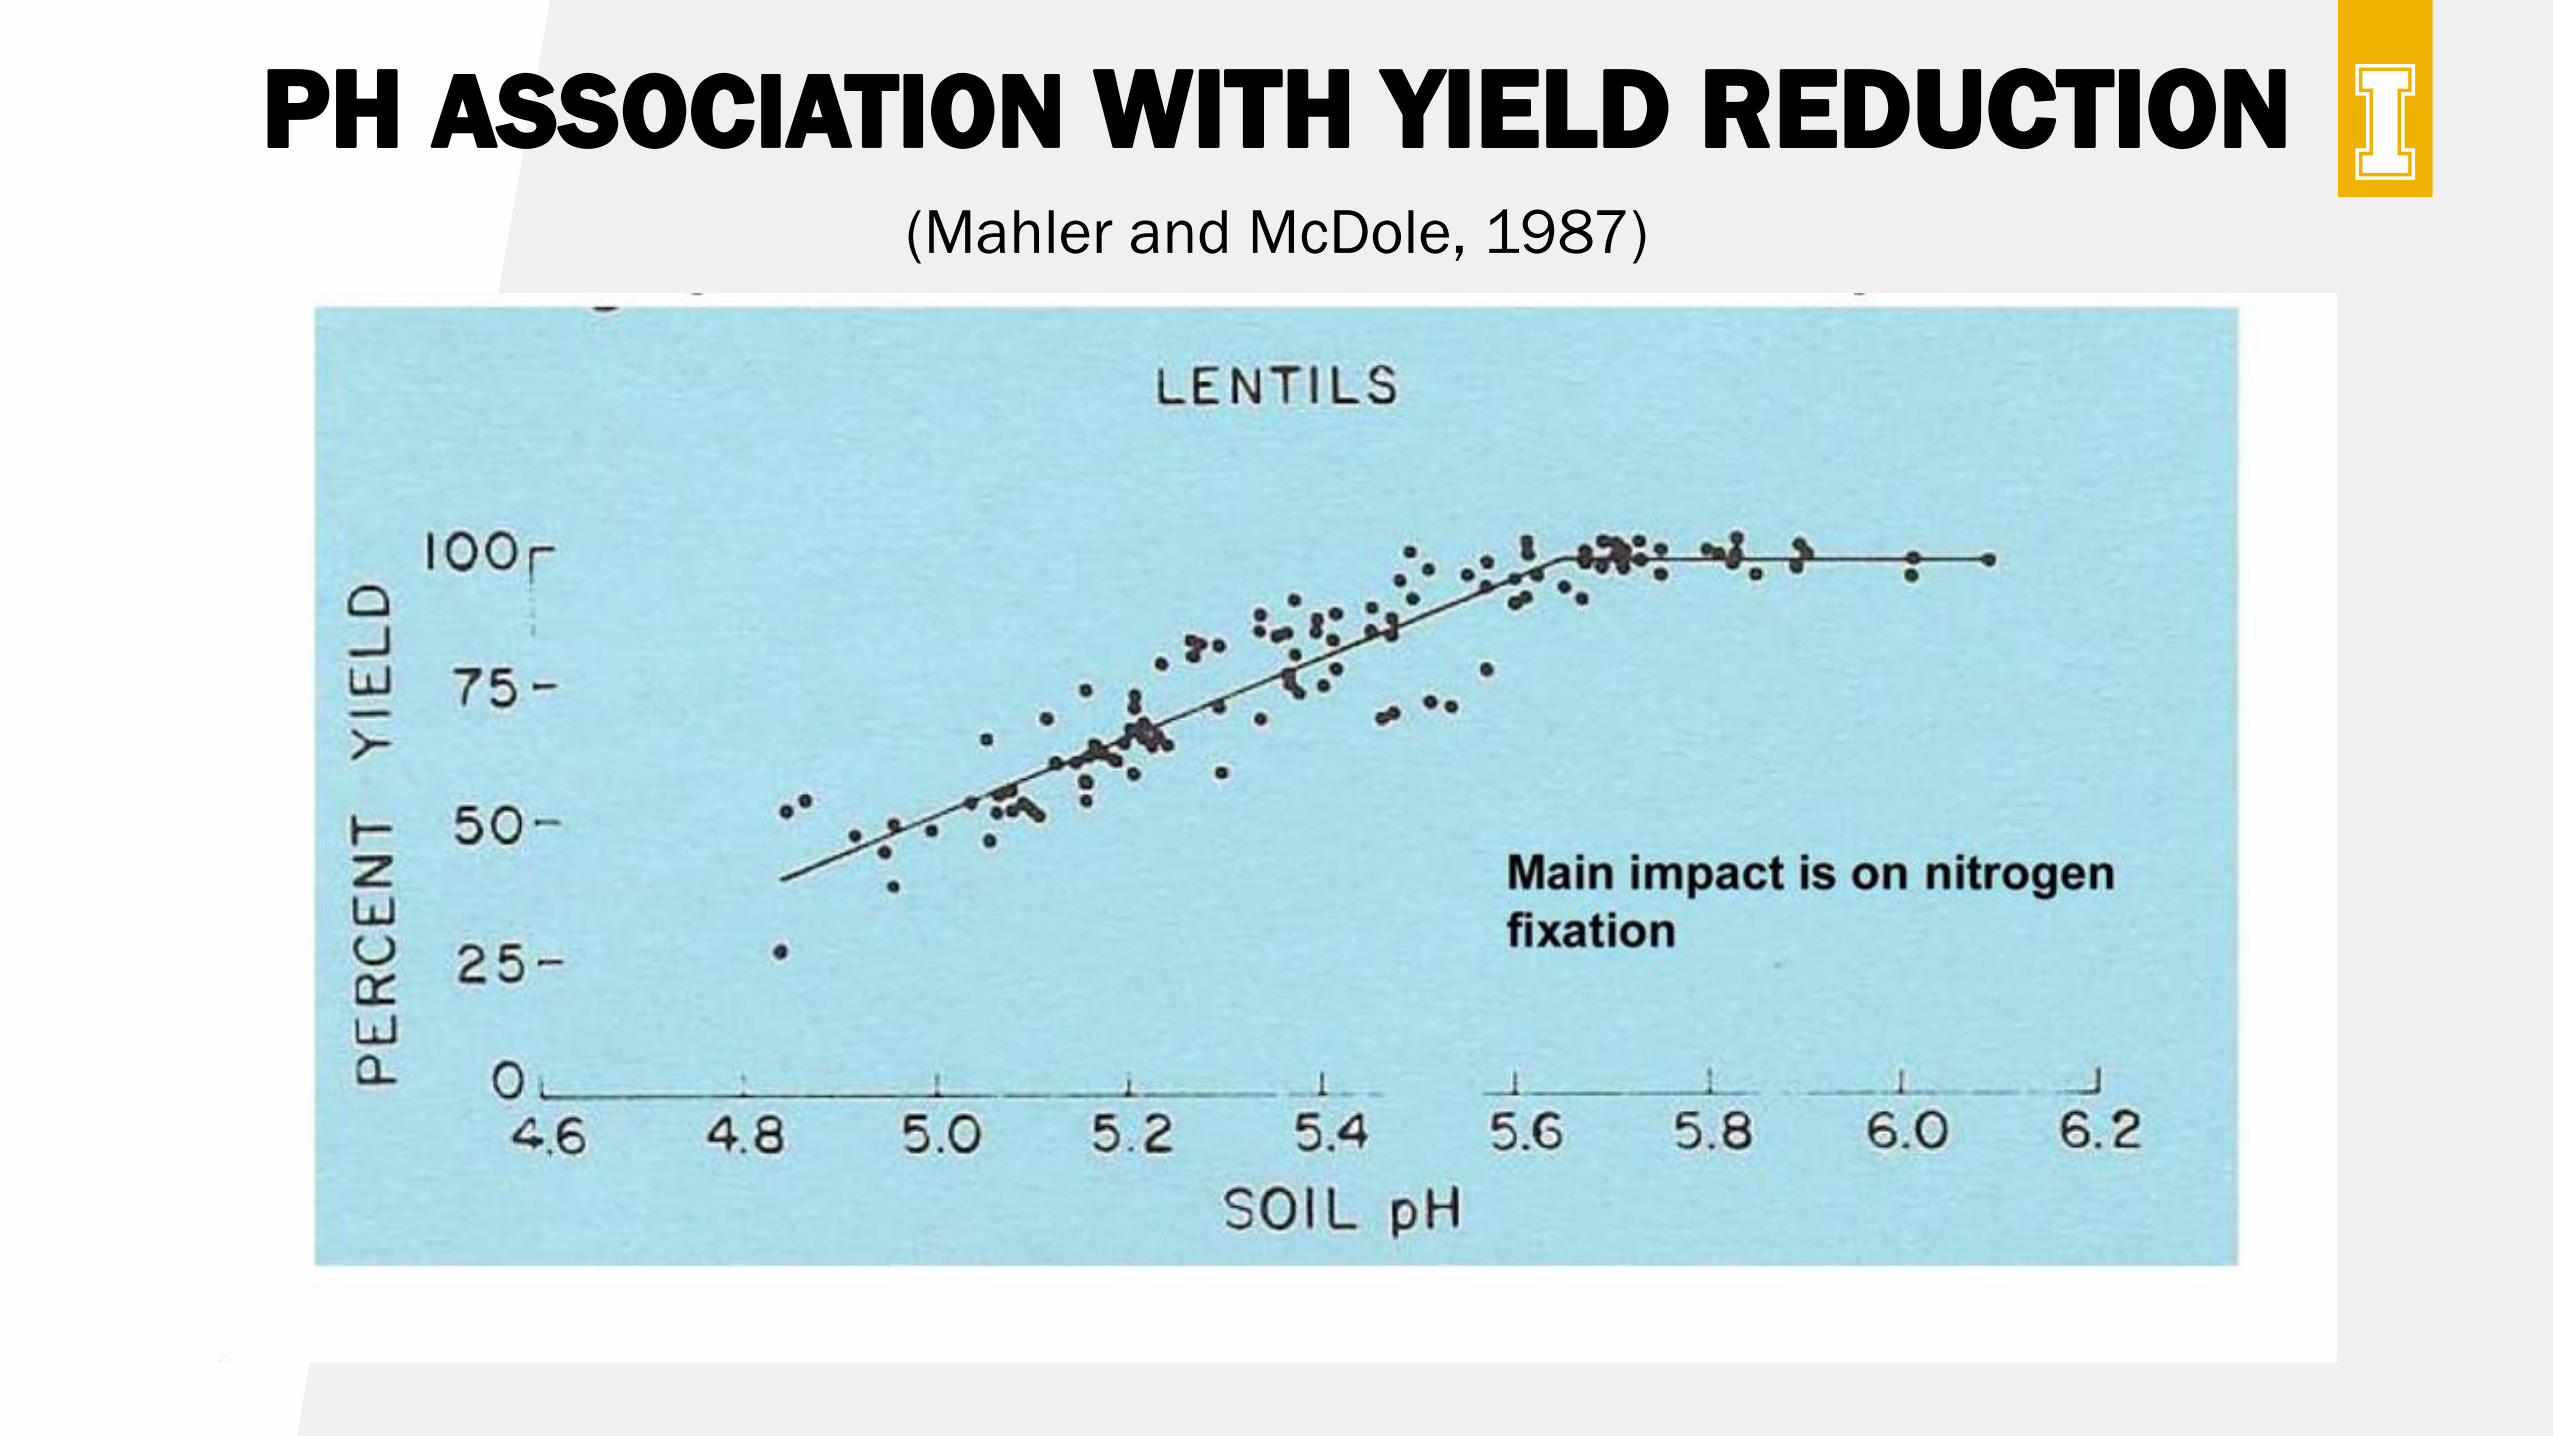
PH ASSOCIATION WITH YIELD REDUCTION(Mahler and McDole, 1987)
PH ASSOCIATION WITH YIELD REDUCTION(Mahler and McDole, 1987)
CHANGE IN SOIL PH – NORTH IDAHO SOIL SURVEY
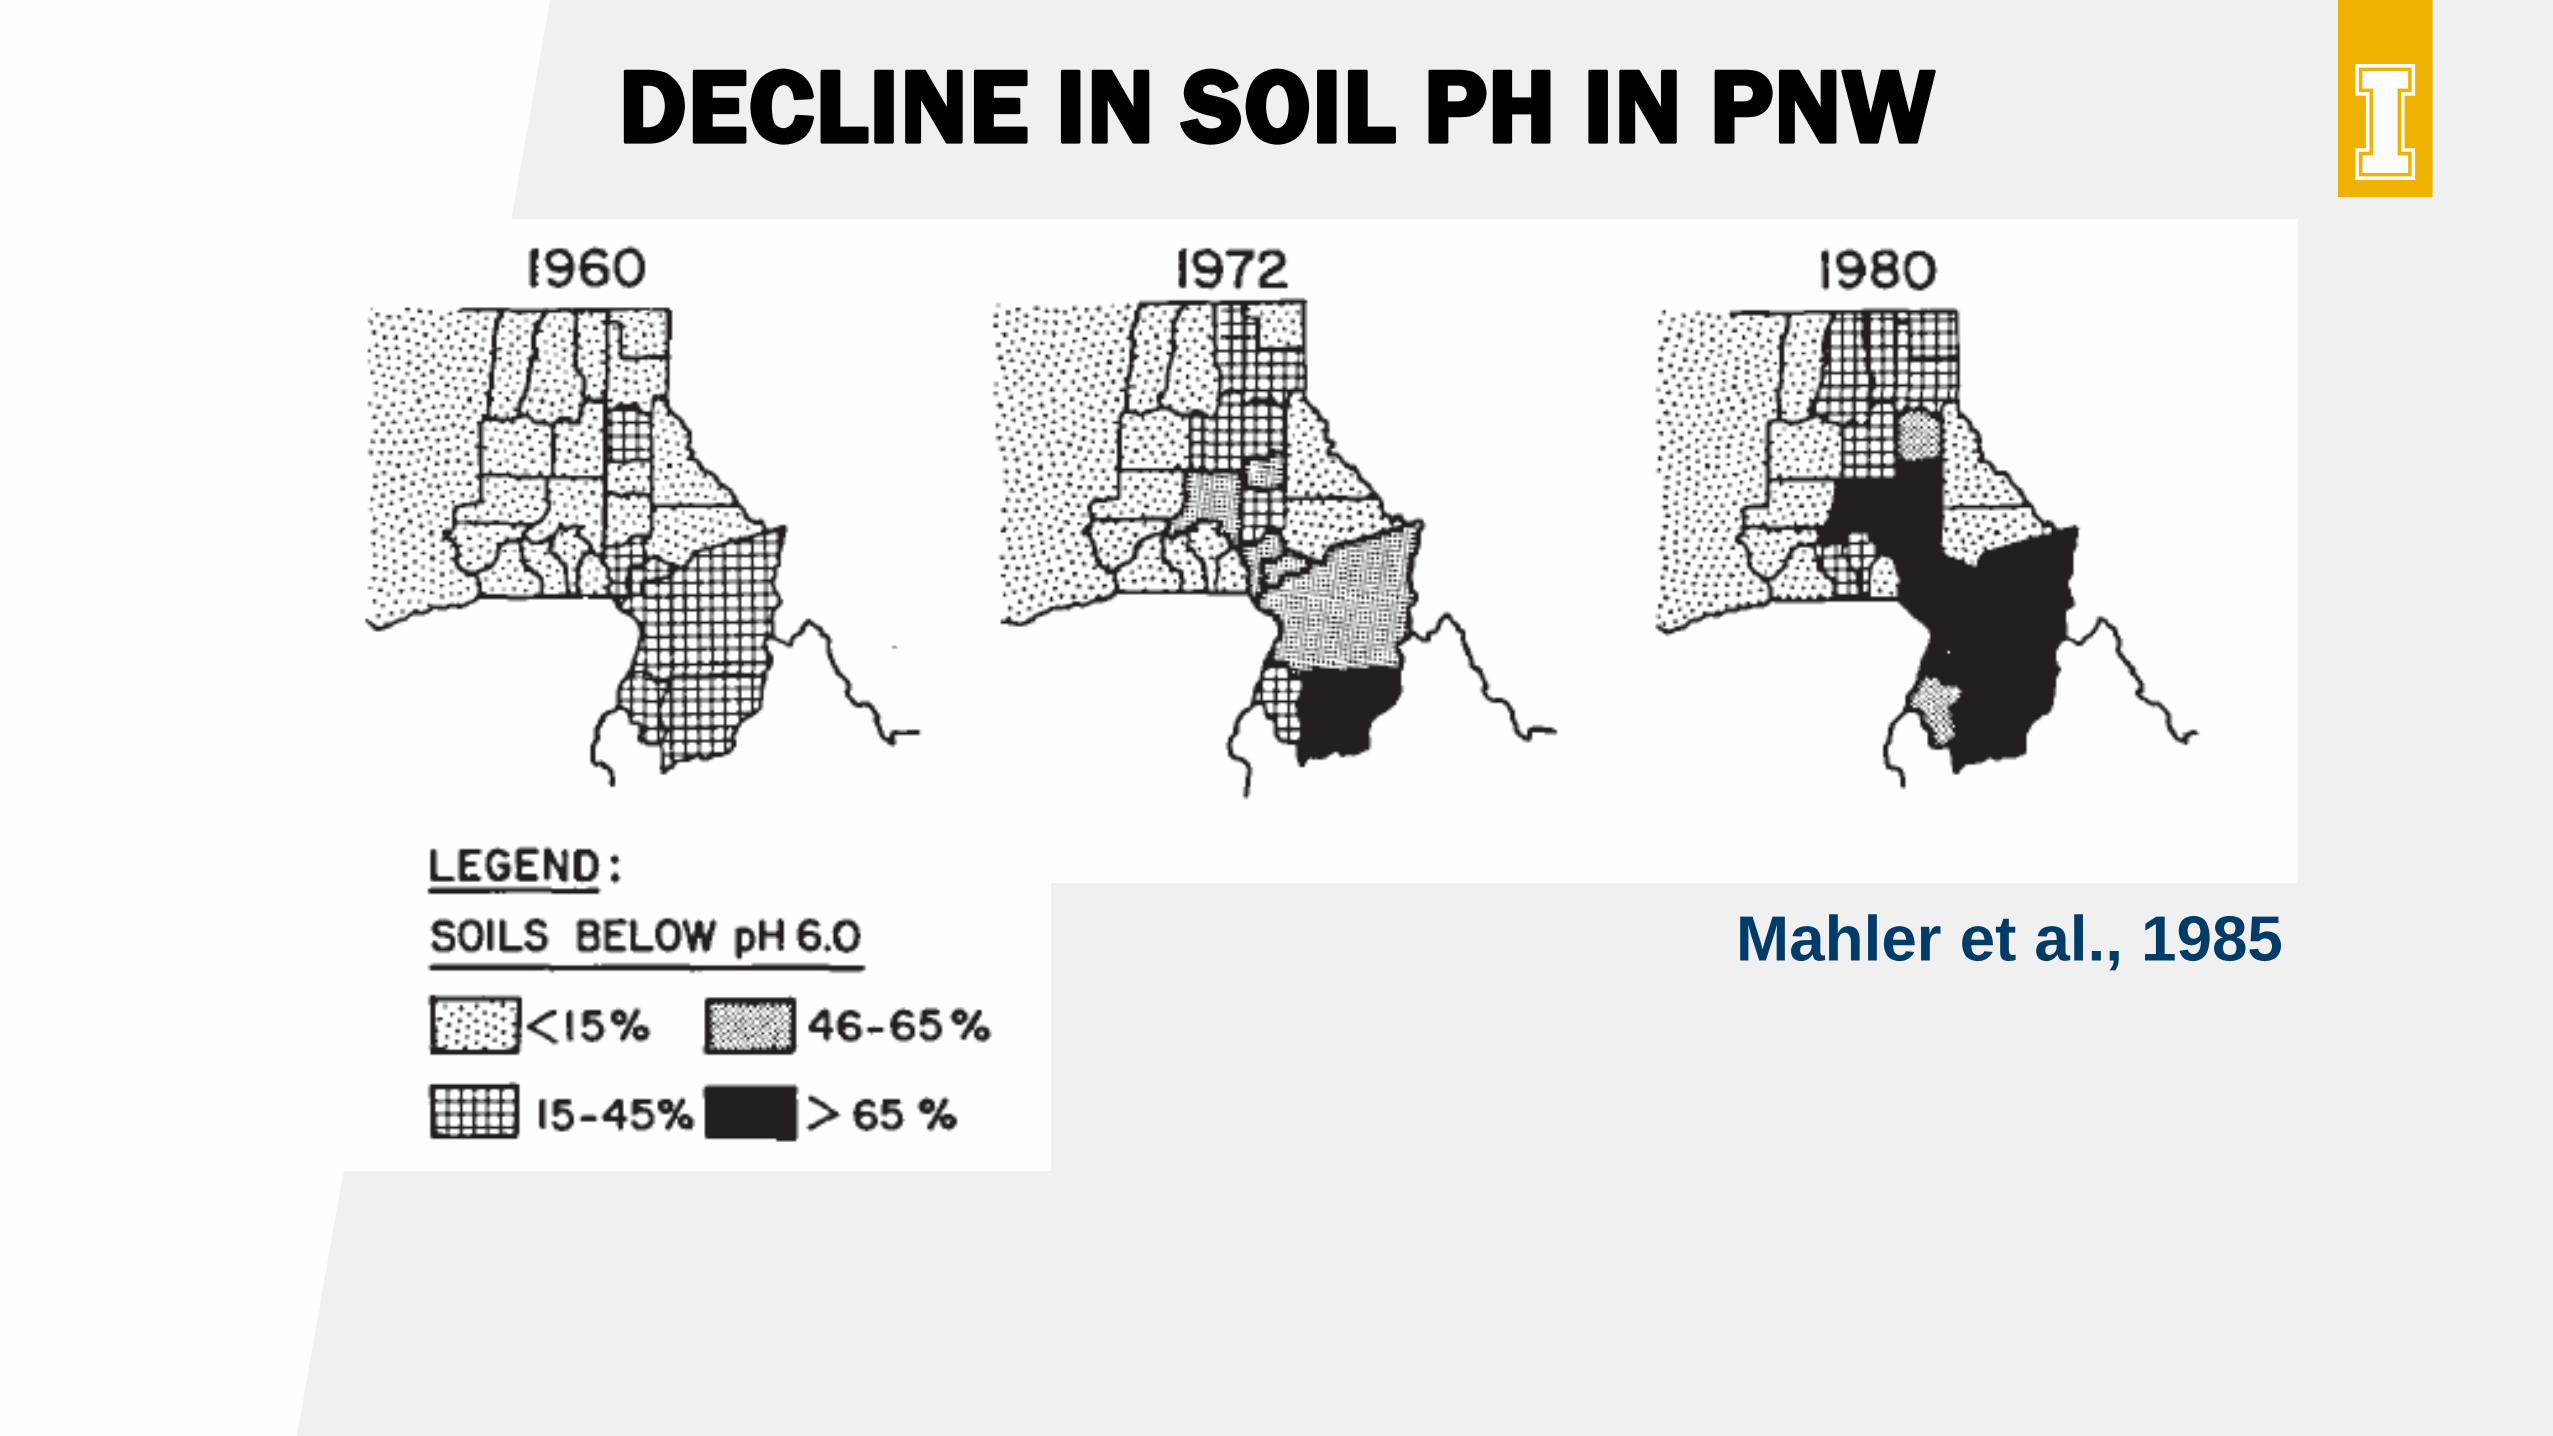
Mahler et al., 1985
DECLINE IN SOIL PH IN PNW
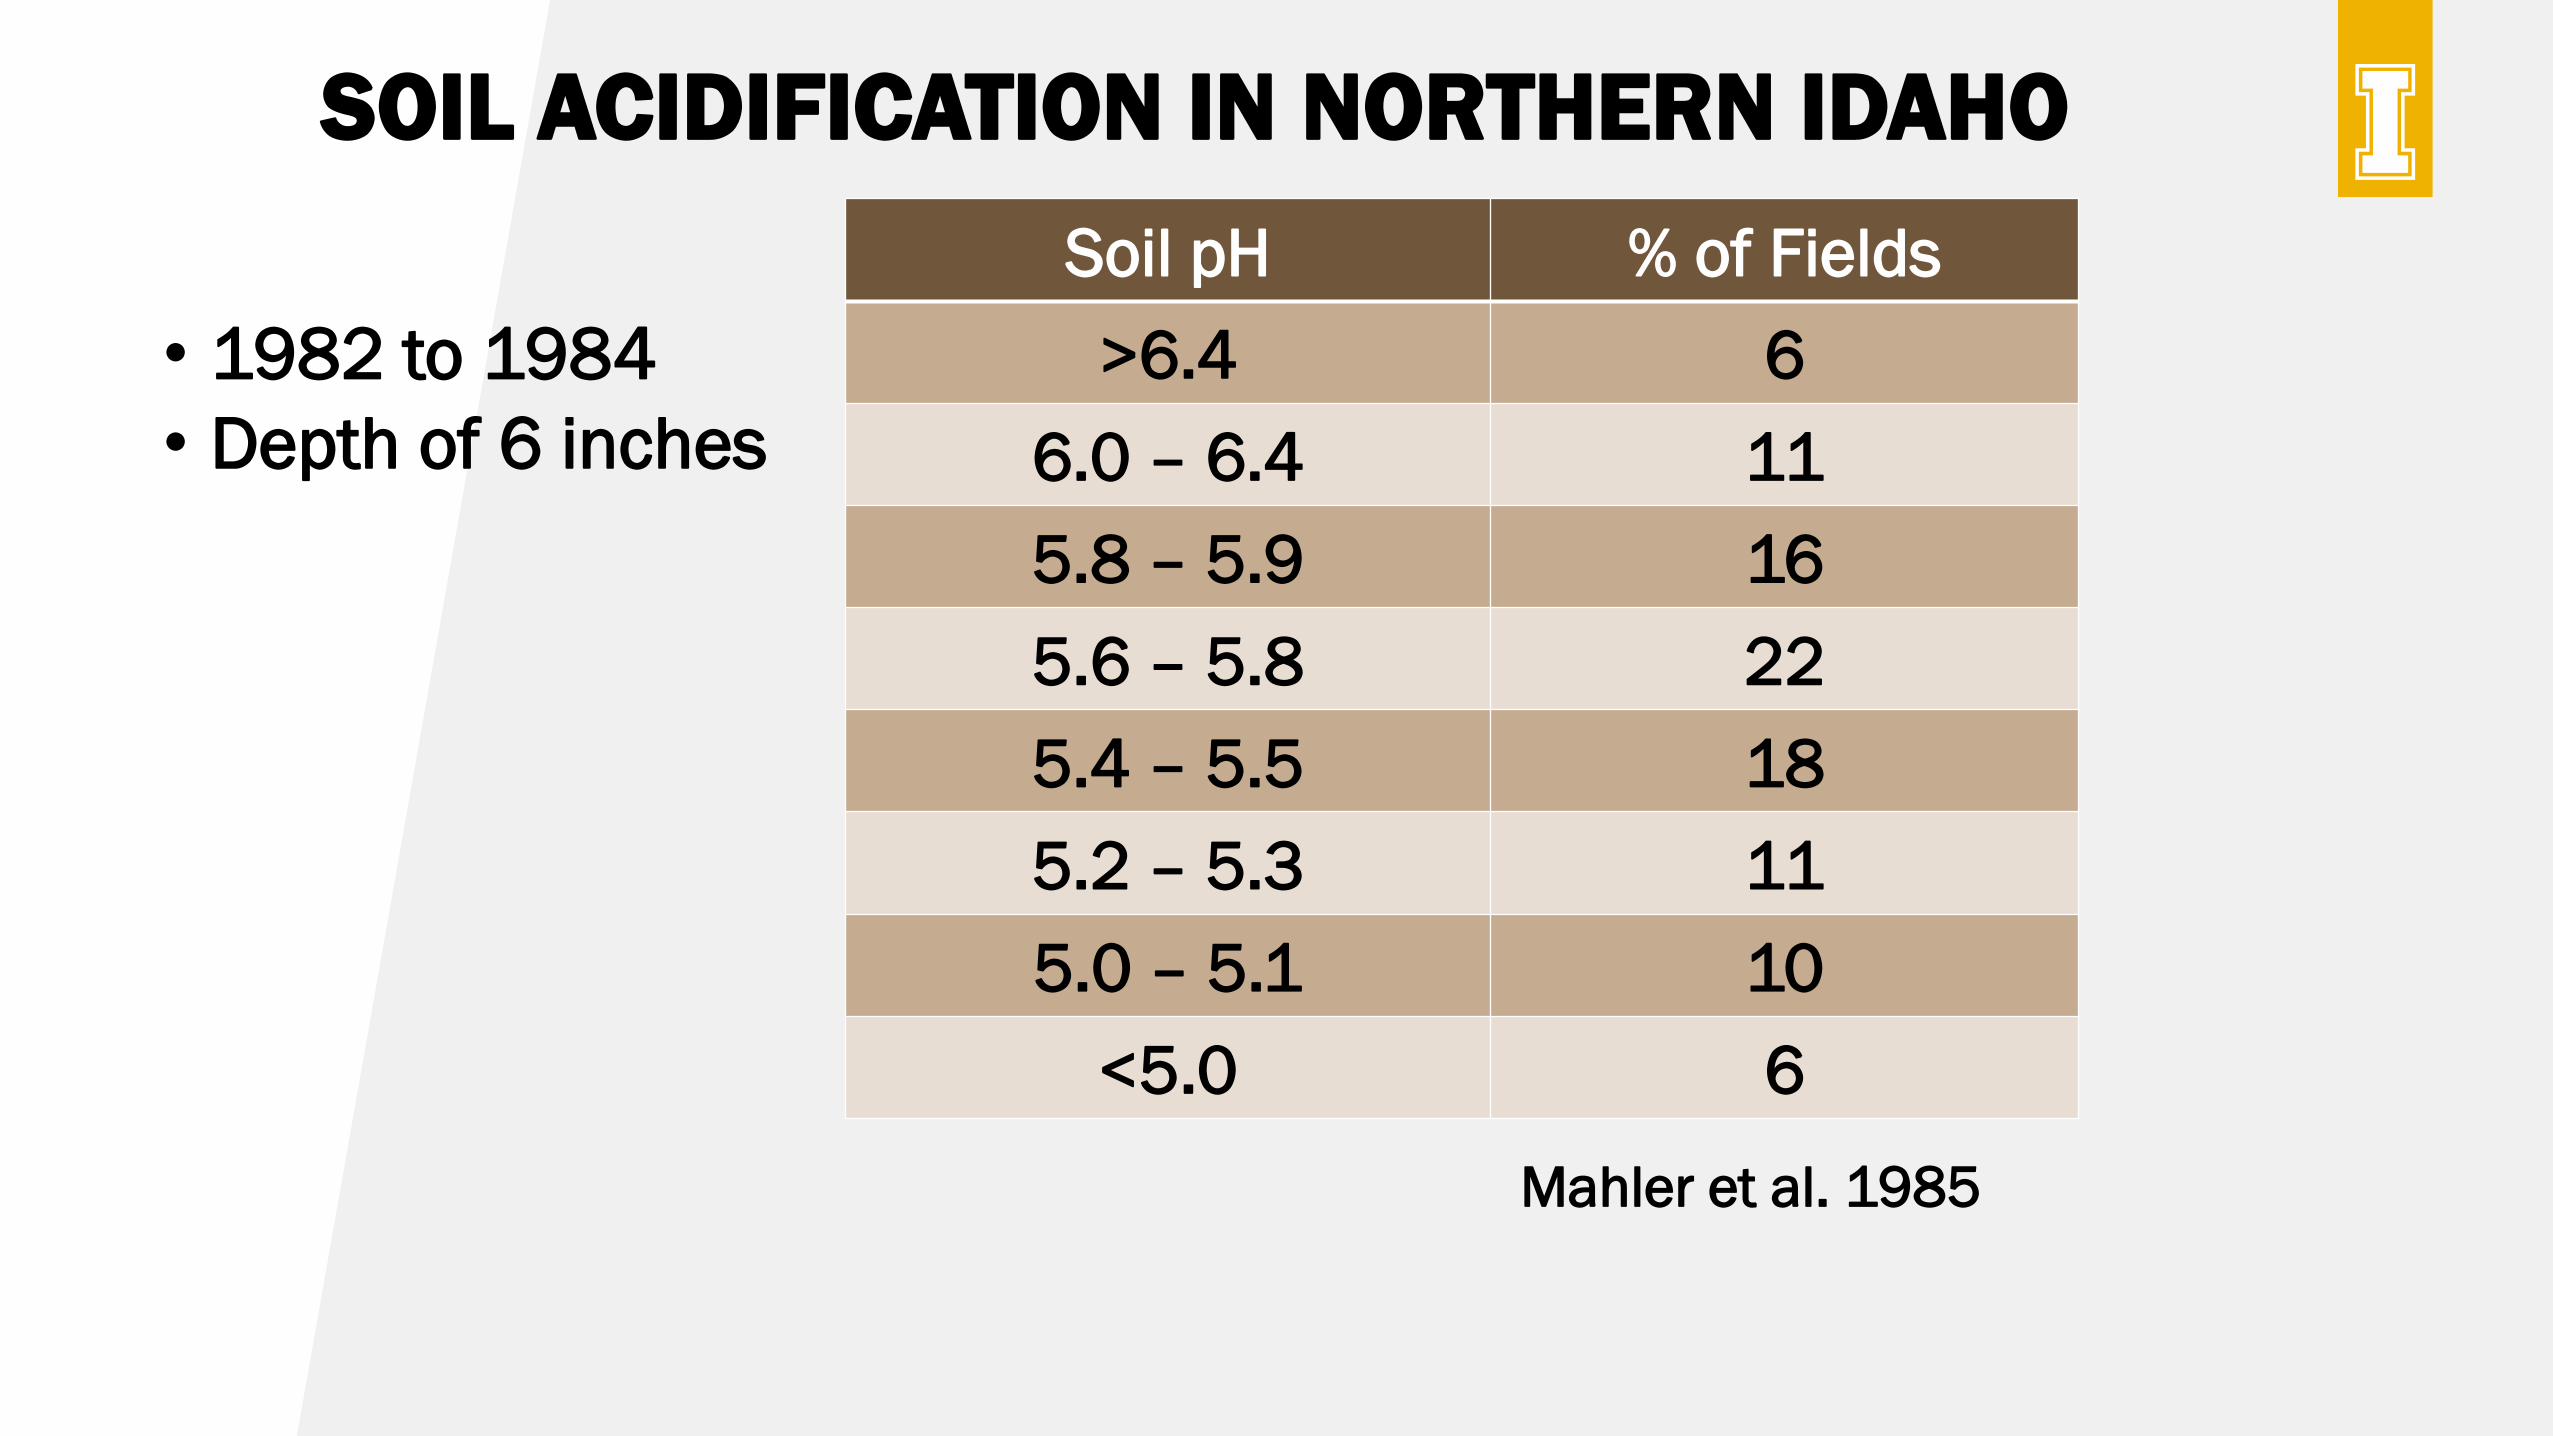
SOIL ACIDIFICATION IN NORTHERN IDAHO
Mahler et al. 1985
• 1982 to 1984
• Depth of 6 inches
Soil pH % of Fields
>6.4 6
6.0 – 6.4 11
5.8 – 5.9 16
5.6 – 5.8 22
5.4 – 5.5 18
5.2 – 5.3 11
5.0 – 5.1 10
<5.0 6
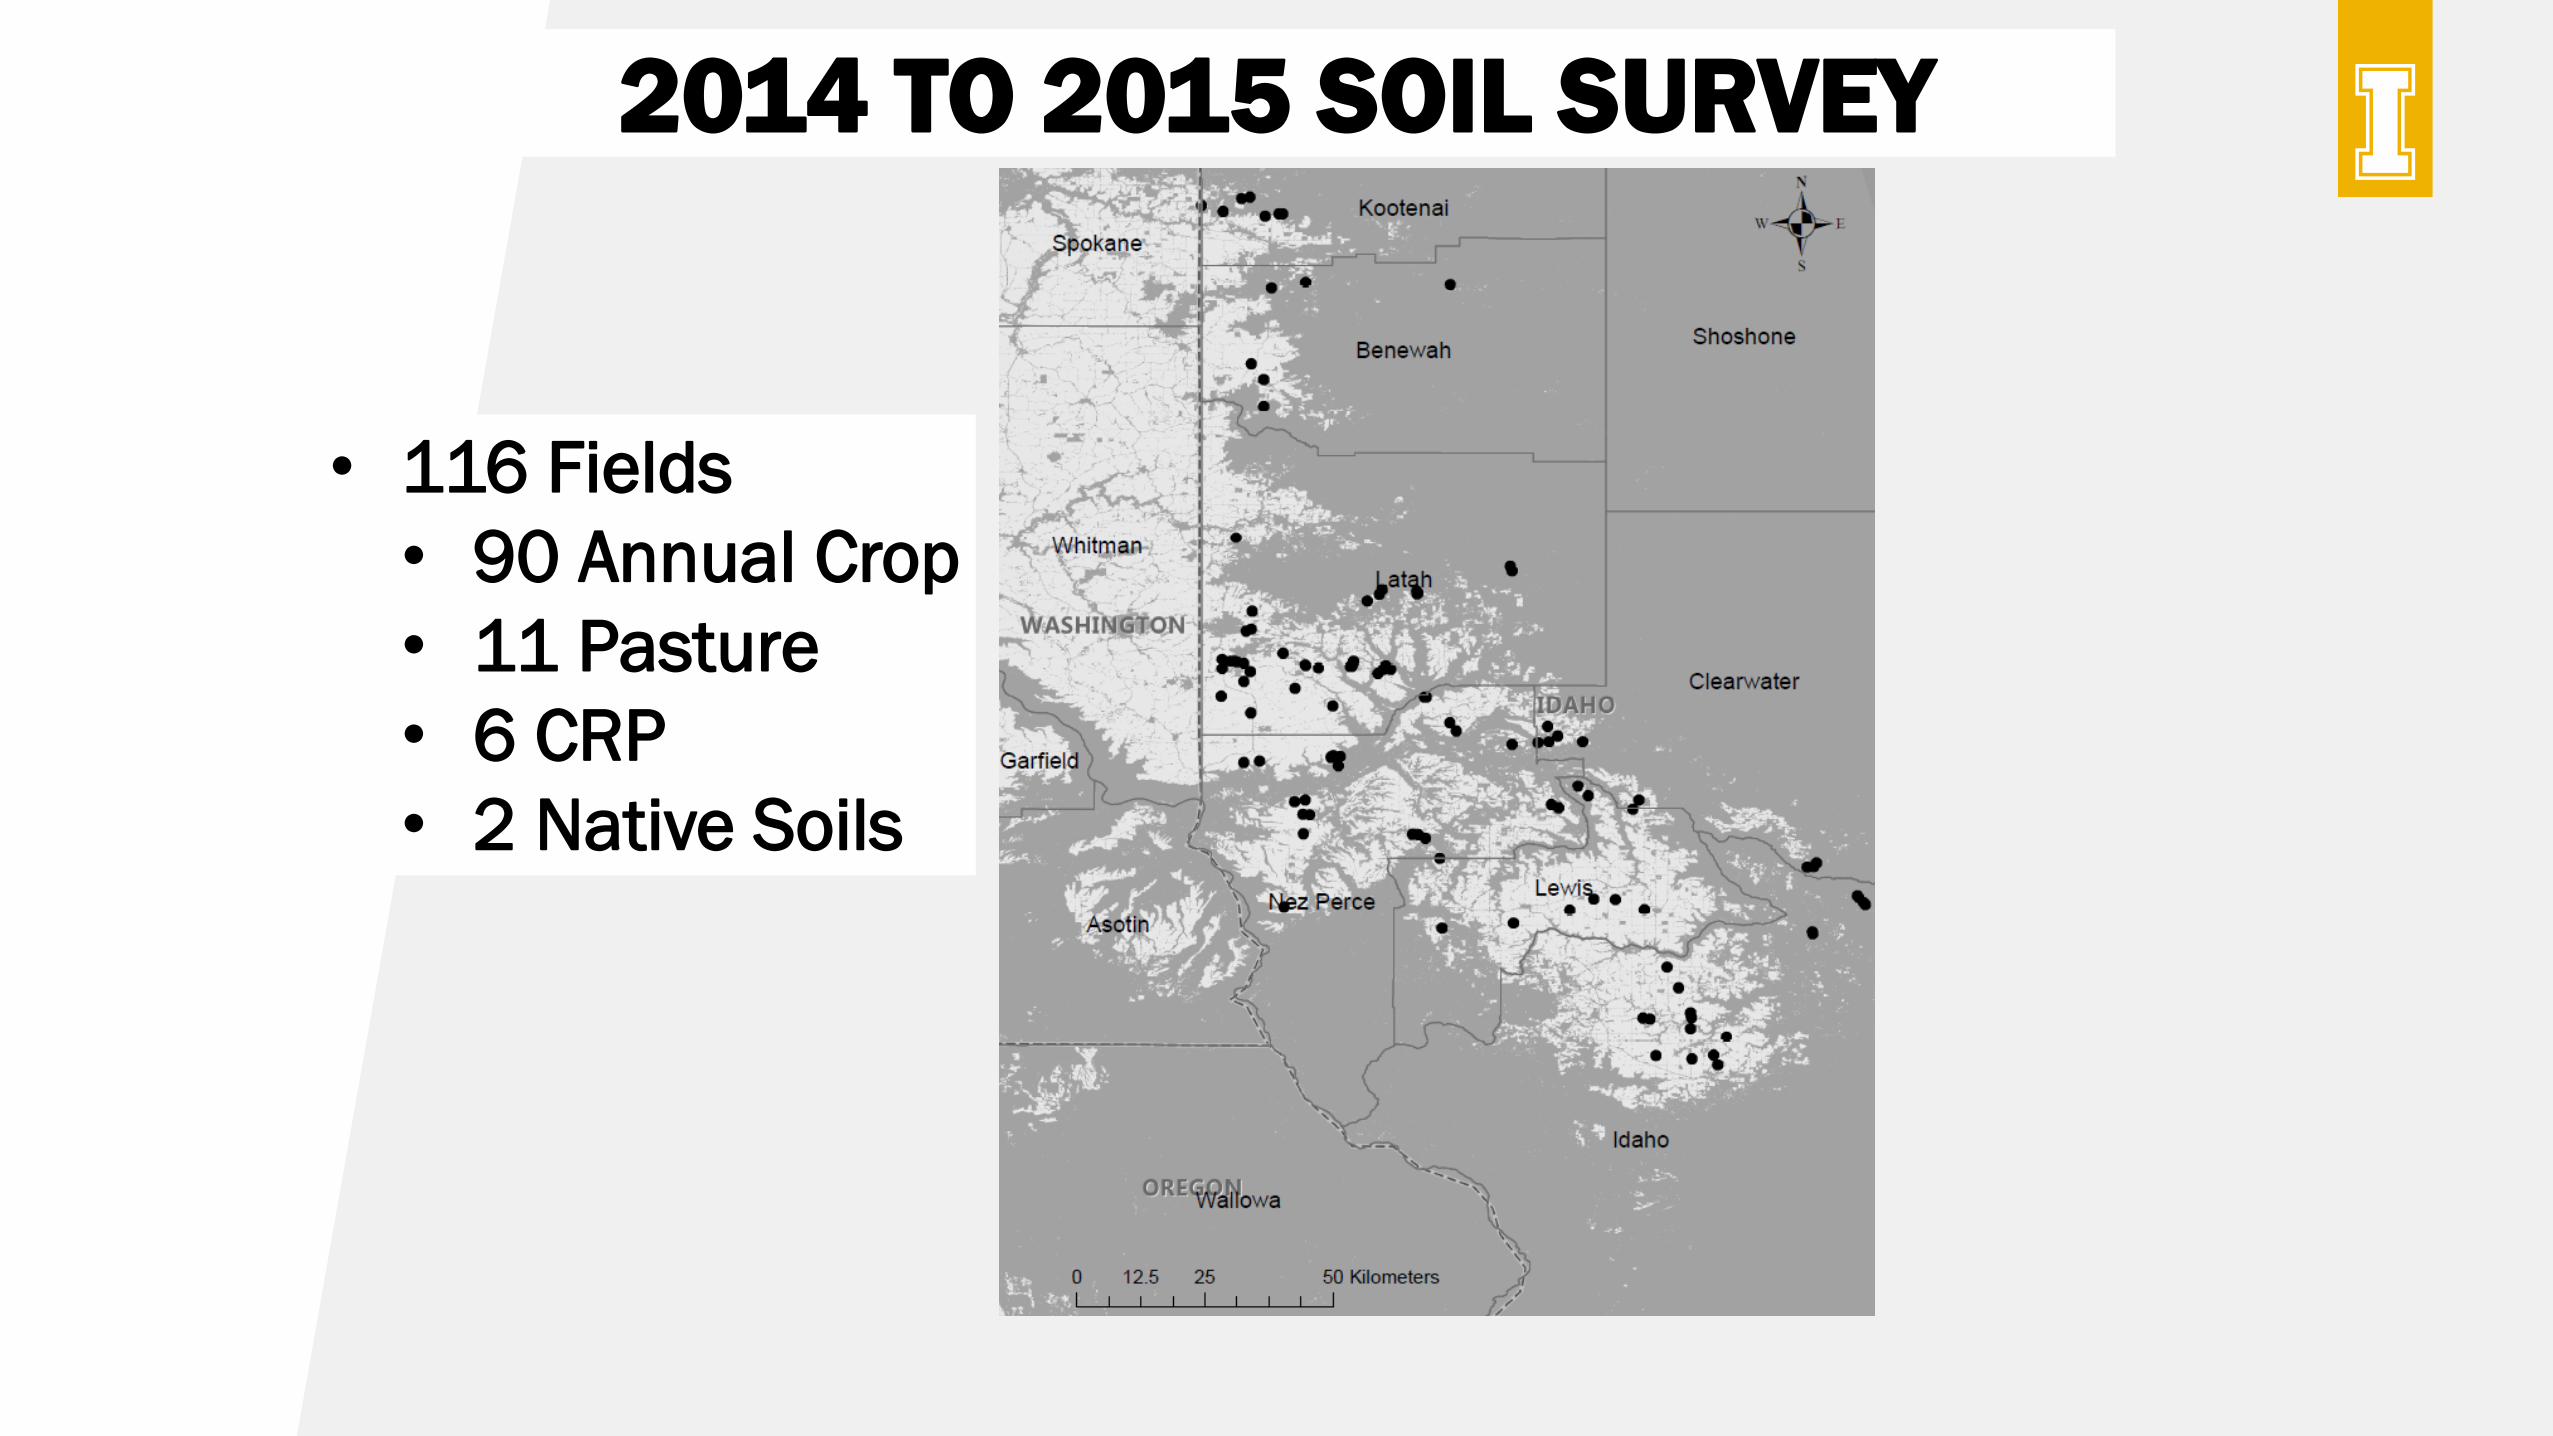
2014 TO 2015 SOIL SURVEY
• 116 Fields
• 90 Annual Crop
• 11 Pasture
• 6 CRP
• 2 Native Soils
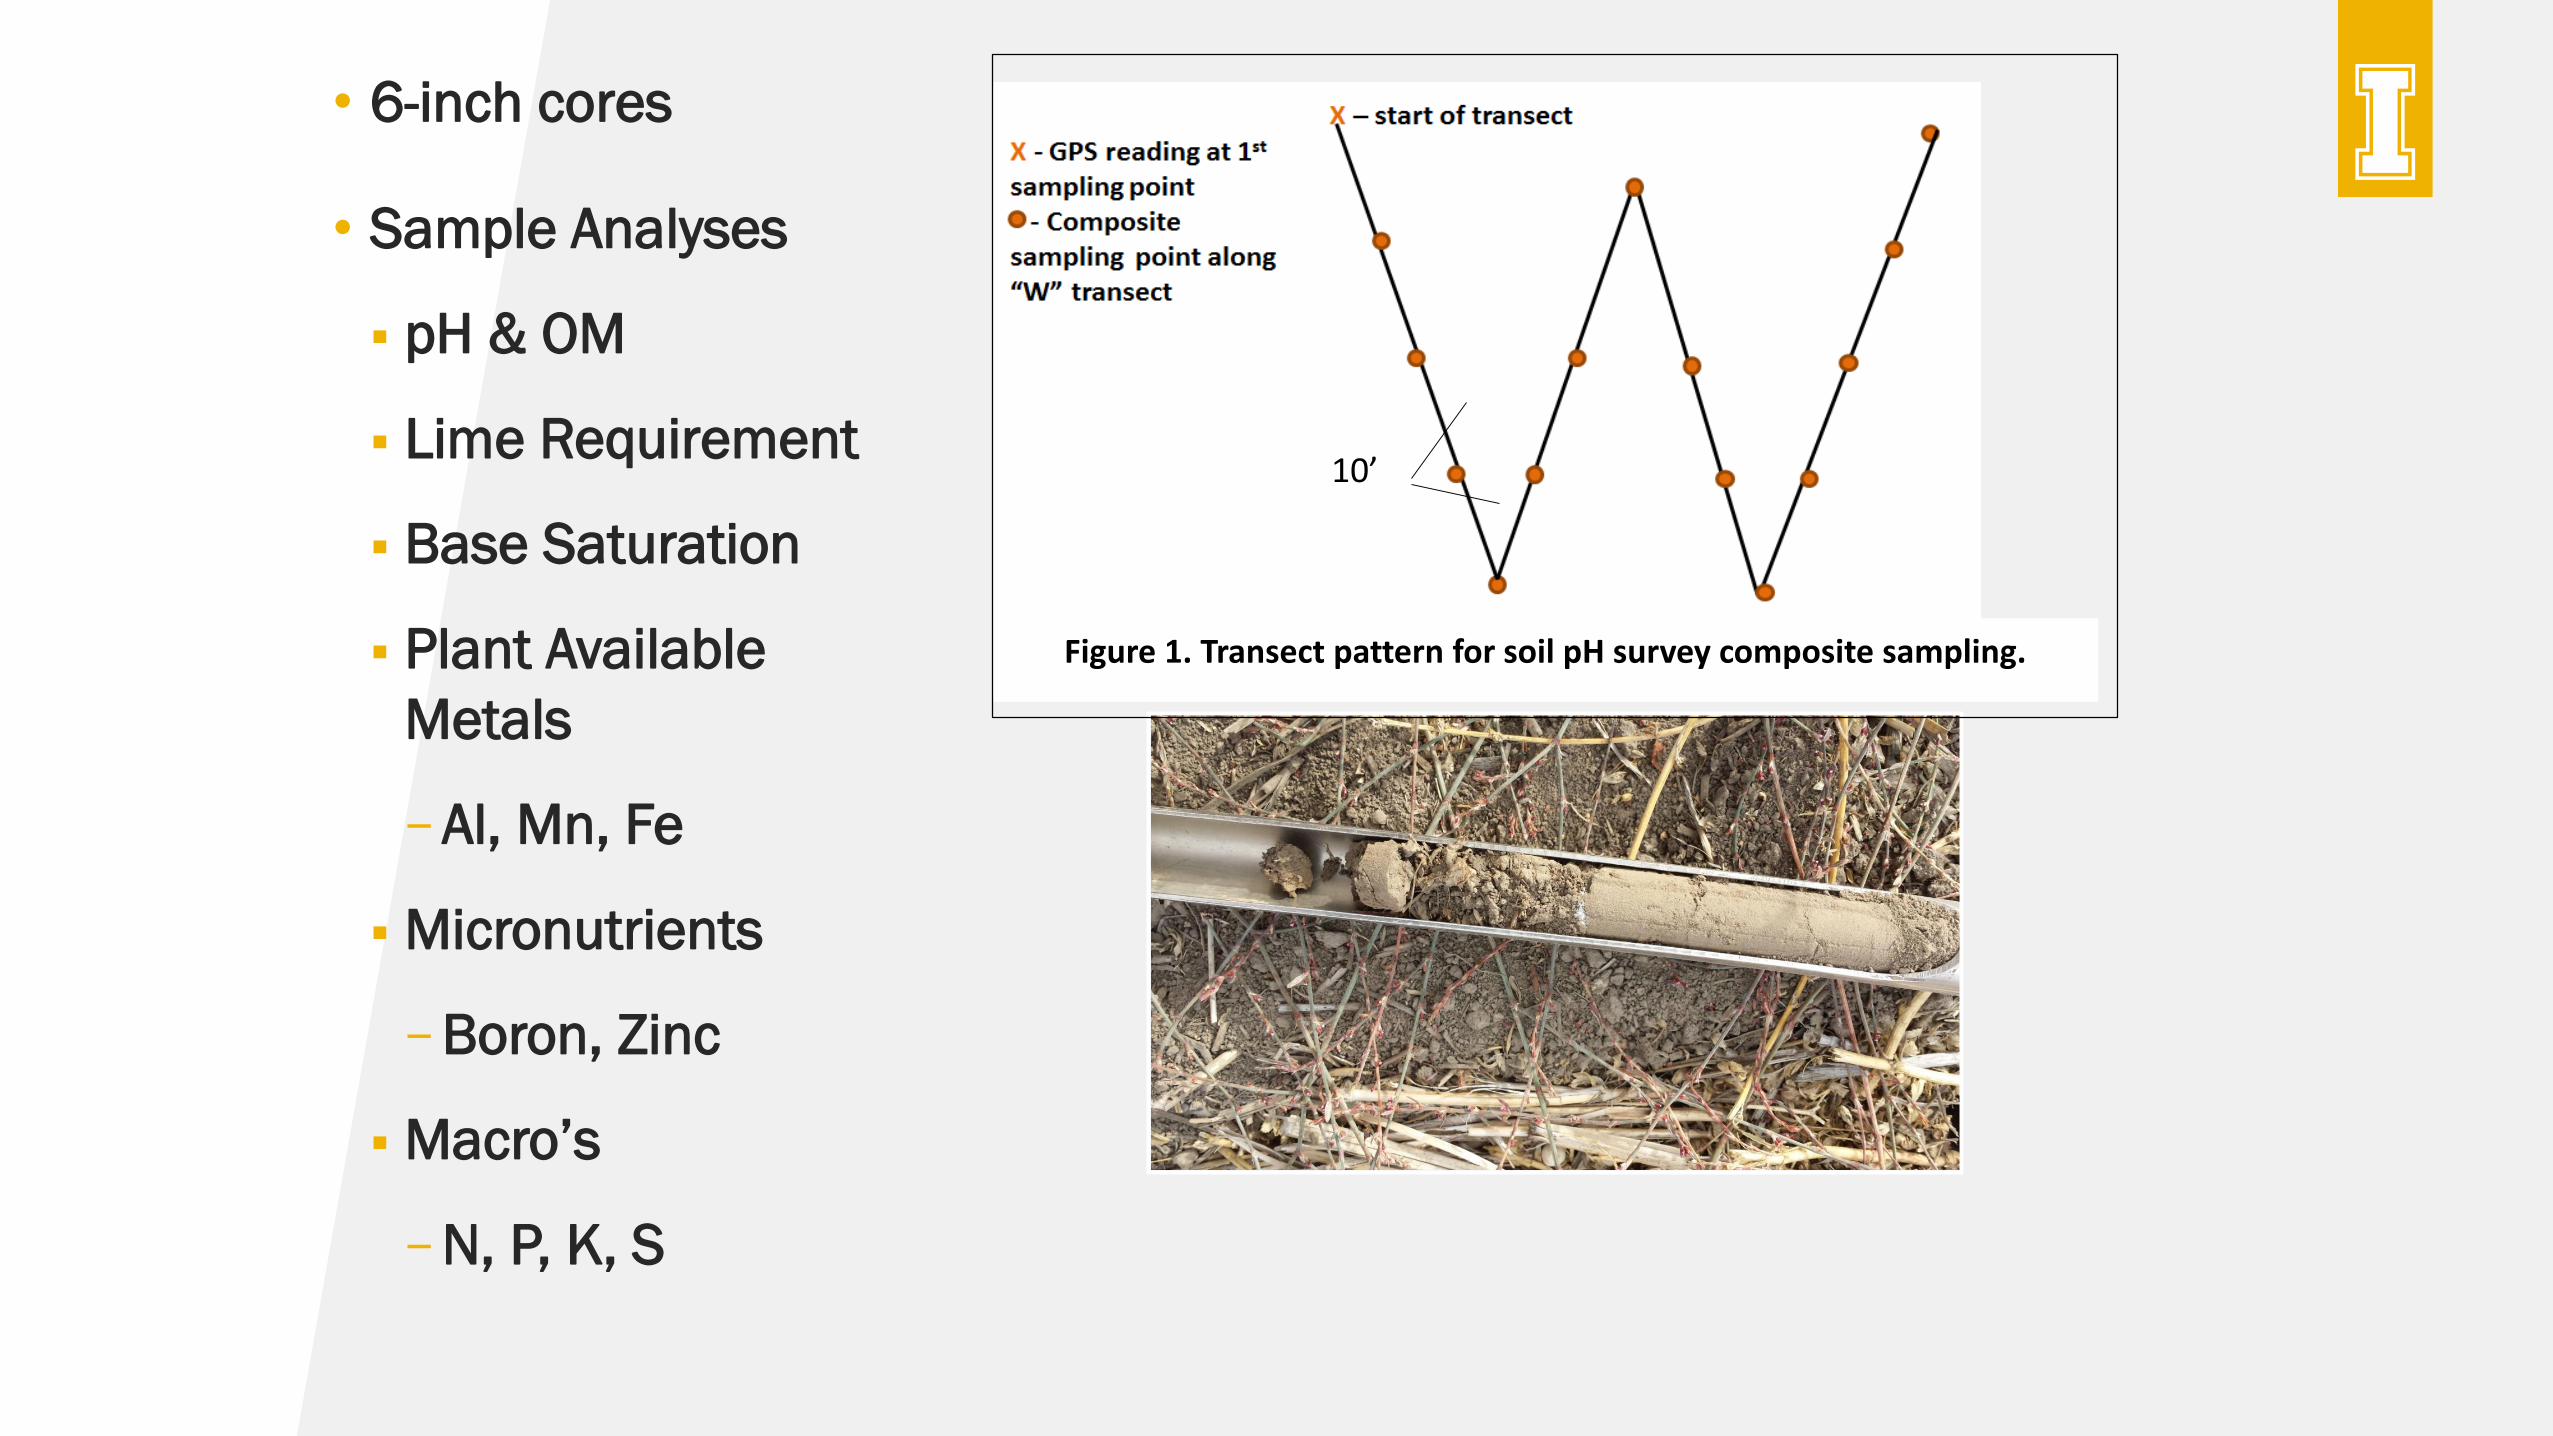
• 6-inch cores
• Sample Analyses
pH & OM
Lime Requirement
Base Saturation
Plant Available
Metals
–Al, Mn, Fe
Micronutrients
–Boron, Zinc
Macro’s
–N, P, K, S
Figure 1. Transect pattern for soil pH survey composite sampling.
10’
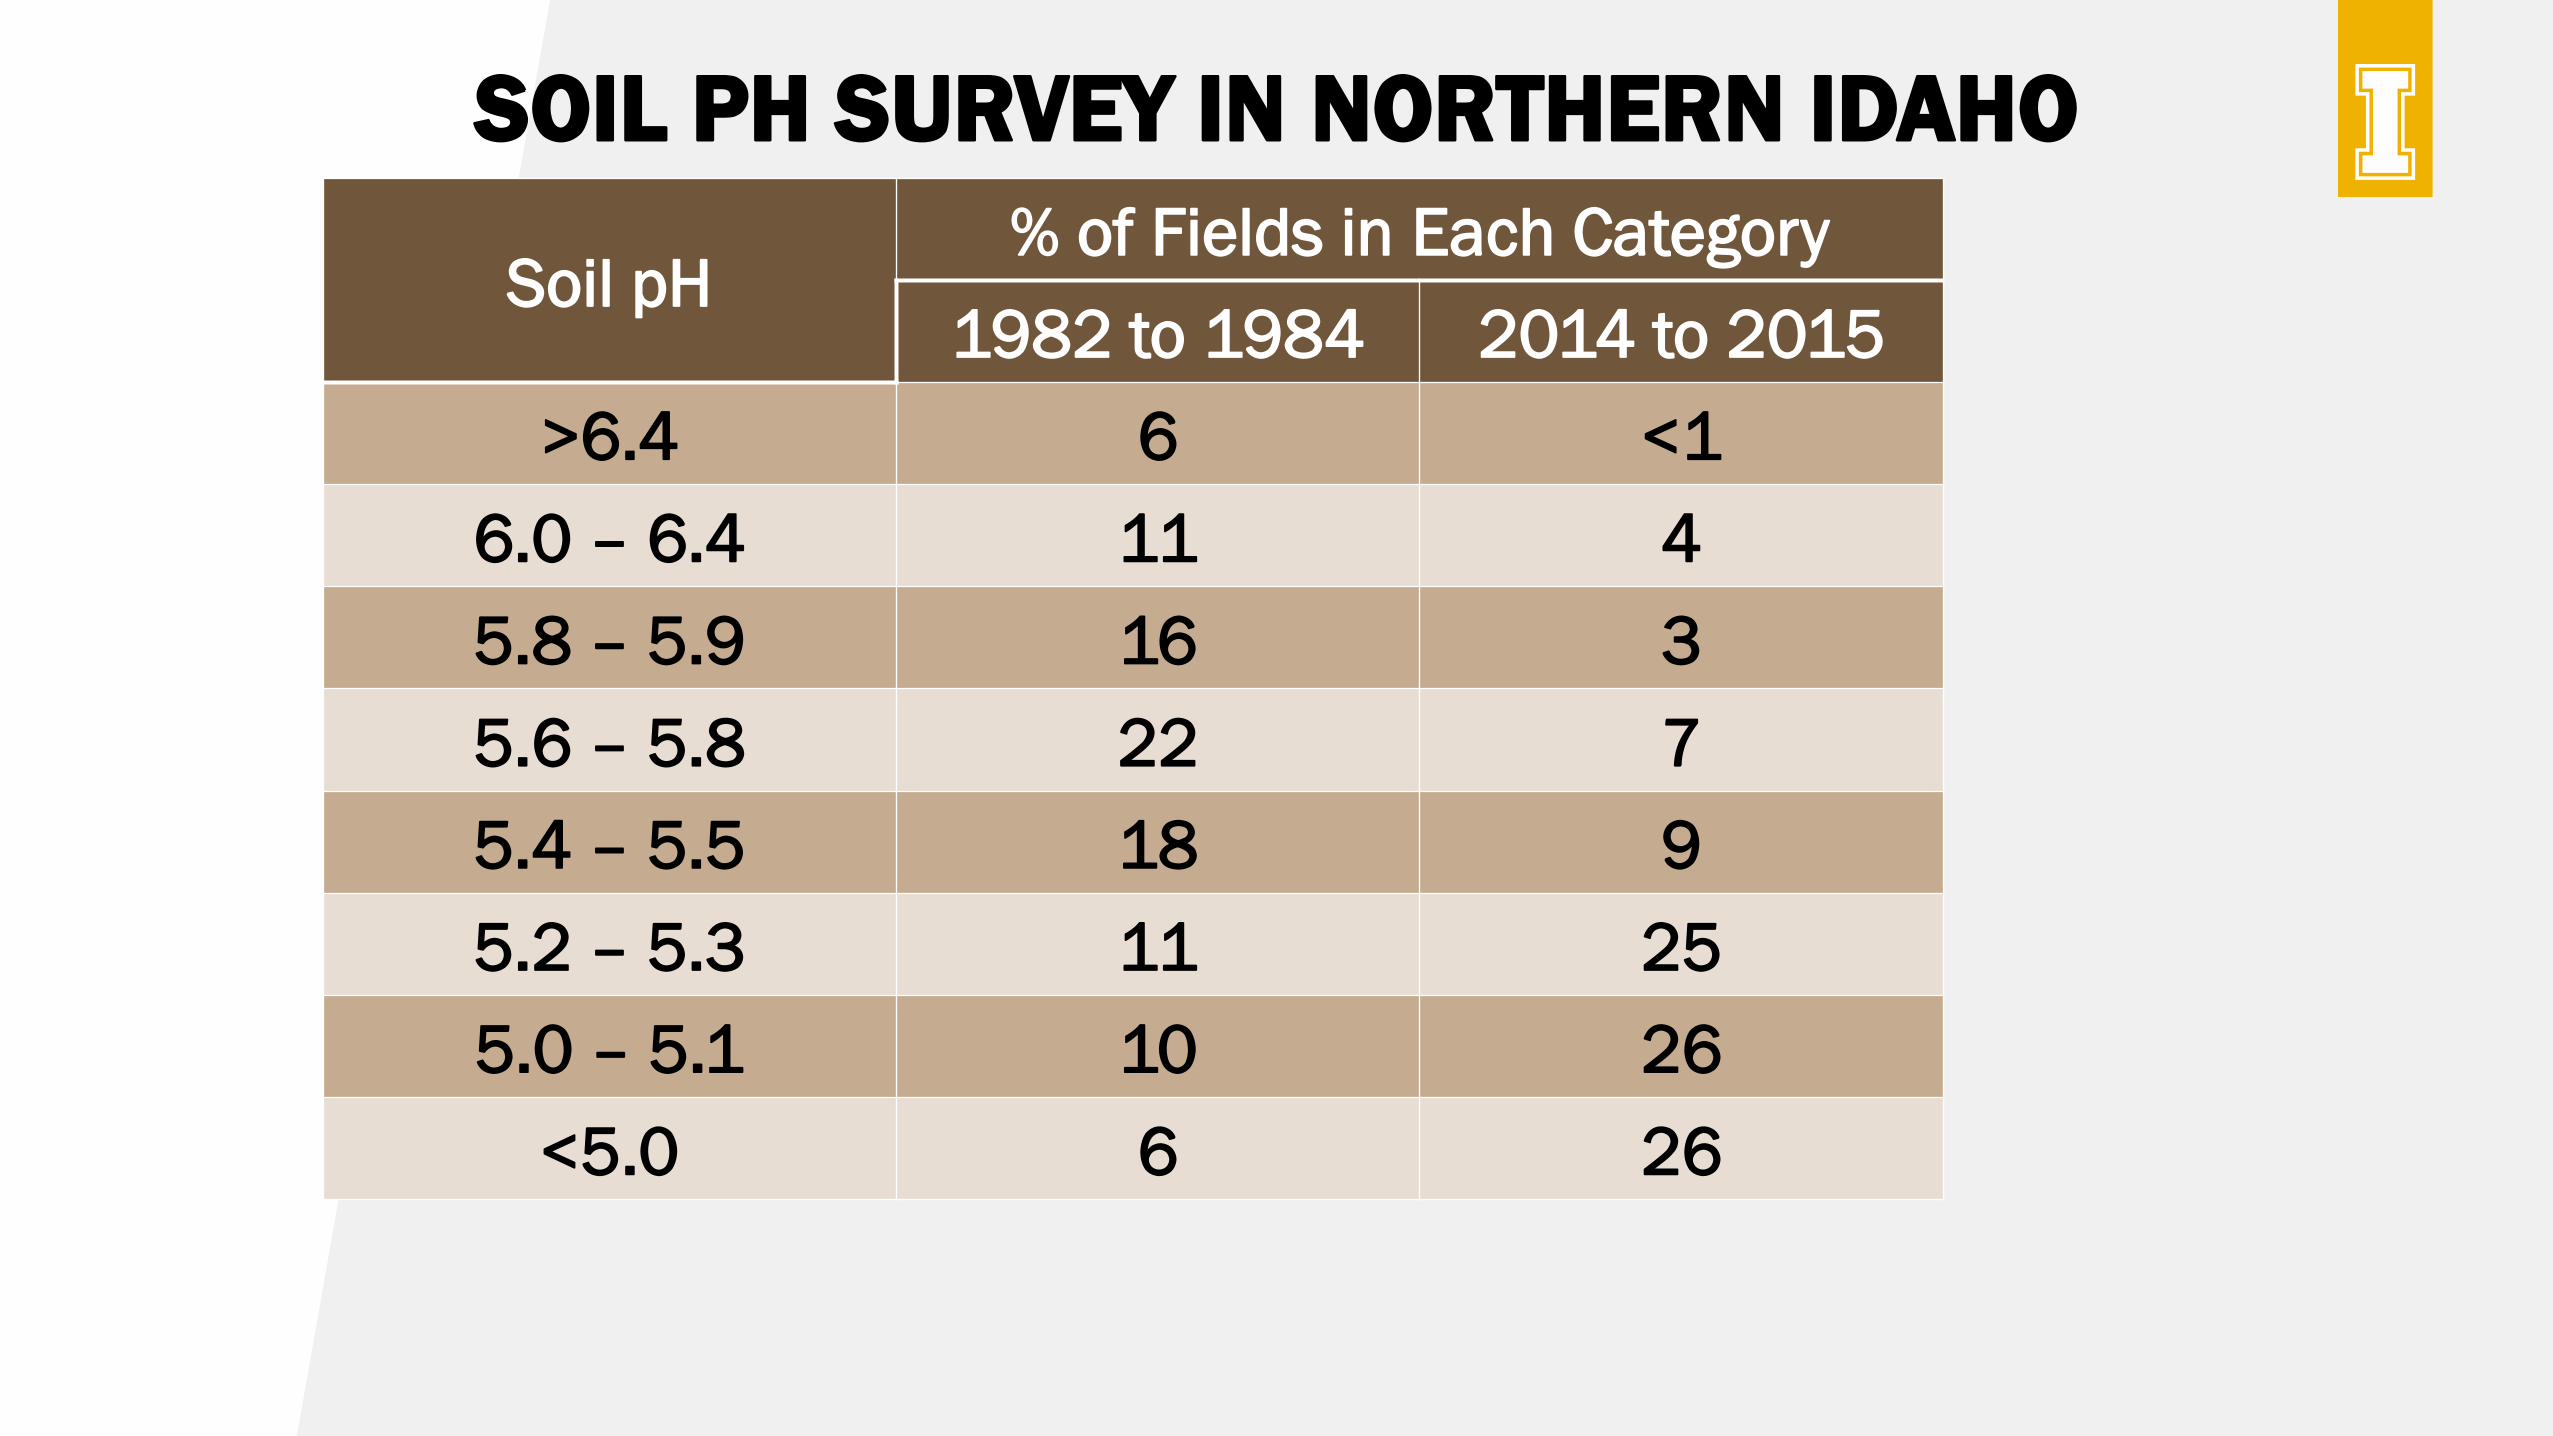
SOIL PH SURVEY IN NORTHERN IDAHO
Soil pH% of Fields in Each Category
1982 to 1984 2014 to 2015
>6.4 6 <1
6.0 – 6.4 11 4
5.8 – 5.9 16 3
5.6 – 5.8 22 7
5.4 – 5.5 18 9
5.2 – 5.3 11 25
5.0 – 5.1 10 26
<5.0 6 26
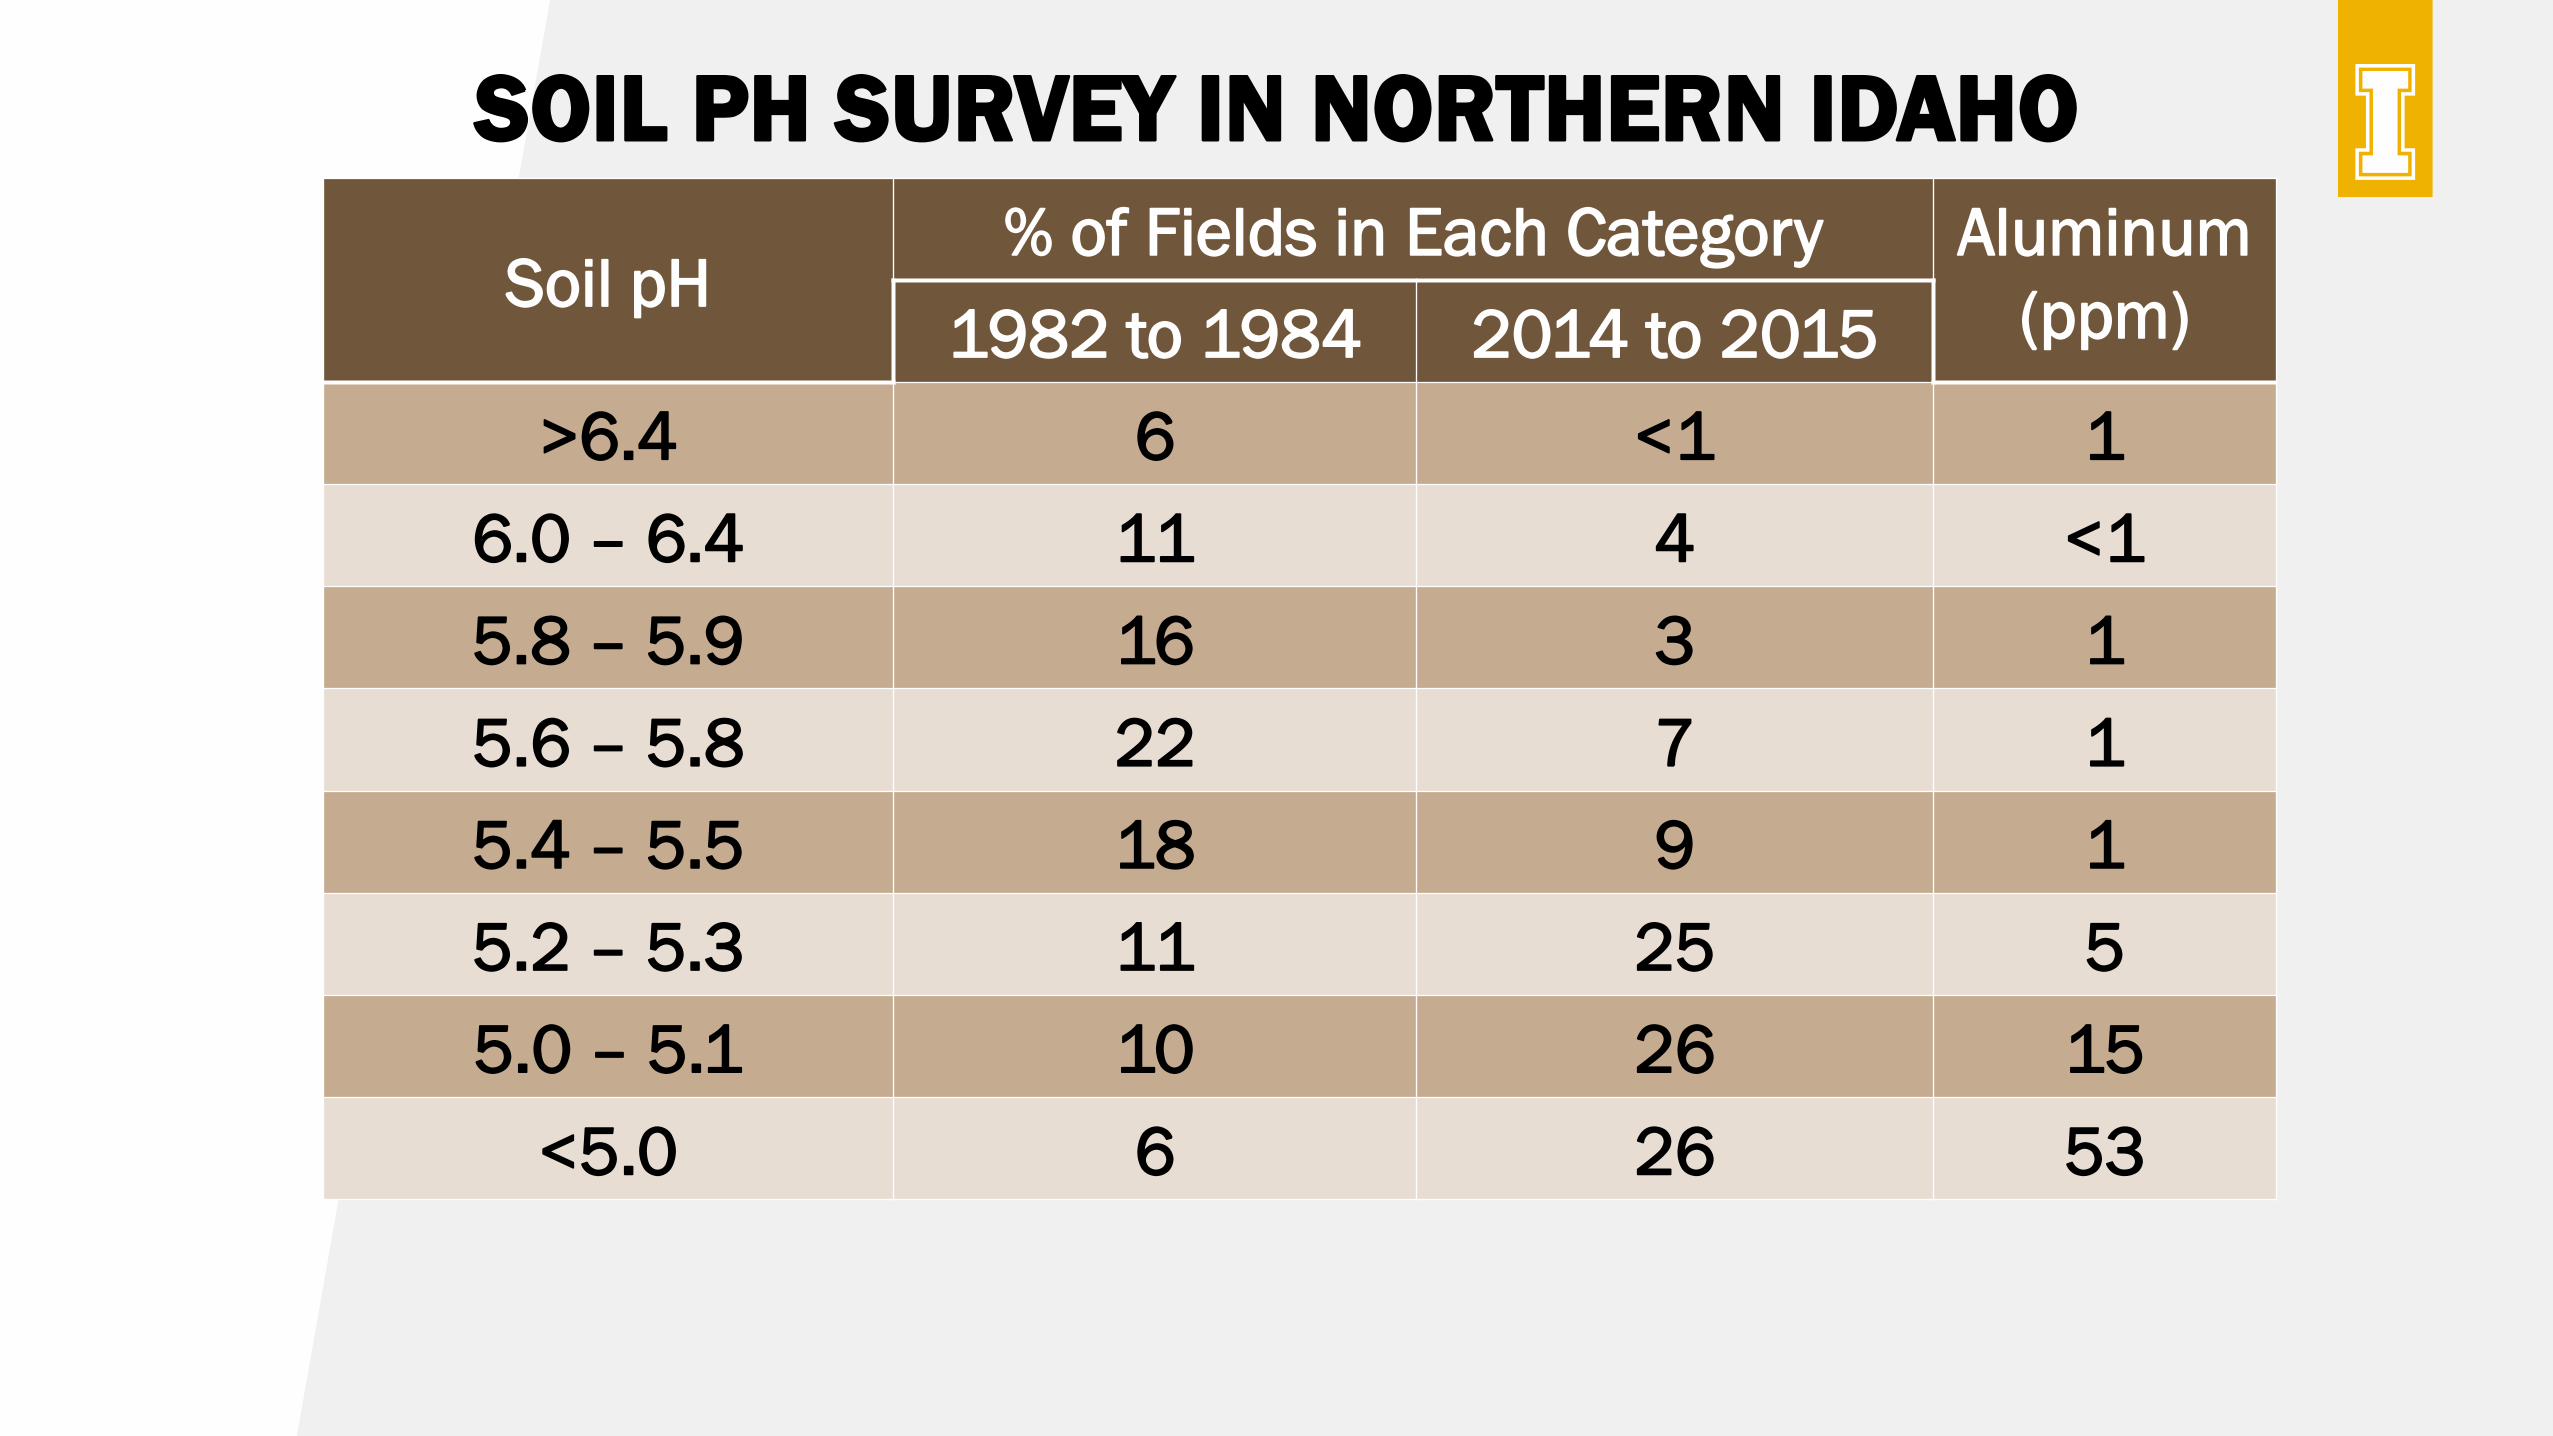
SOIL PH SURVEY IN NORTHERN IDAHO
Soil pH% of Fields in Each Category Aluminum
(ppm)1982 to 1984 2014 to 2015
>6.4 6 <1 1
6.0 – 6.4 11 4 <1
5.8 – 5.9 16 3 1
5.6 – 5.8 22 7 1
5.4 – 5.5 18 9 1
5.2 – 5.3 11 25 5
5.0 – 5.1 10 26 15
<5.0 6 26 53

Soil pH
4 5 6 7 8
Alu
min
um
(p
pm
)
0
50
100
150
200
250
Soil pH
4 5 6 7 8M
an
gan
es
e (
pp
m)
0
20
40
60
80
100
Soil pH
4 5 6 7 8
Iro
n (
pp
m)
0
50
100
150
200
250
300
350
RELATIONSHIP BETWEEN PH AND TOXIC METALS
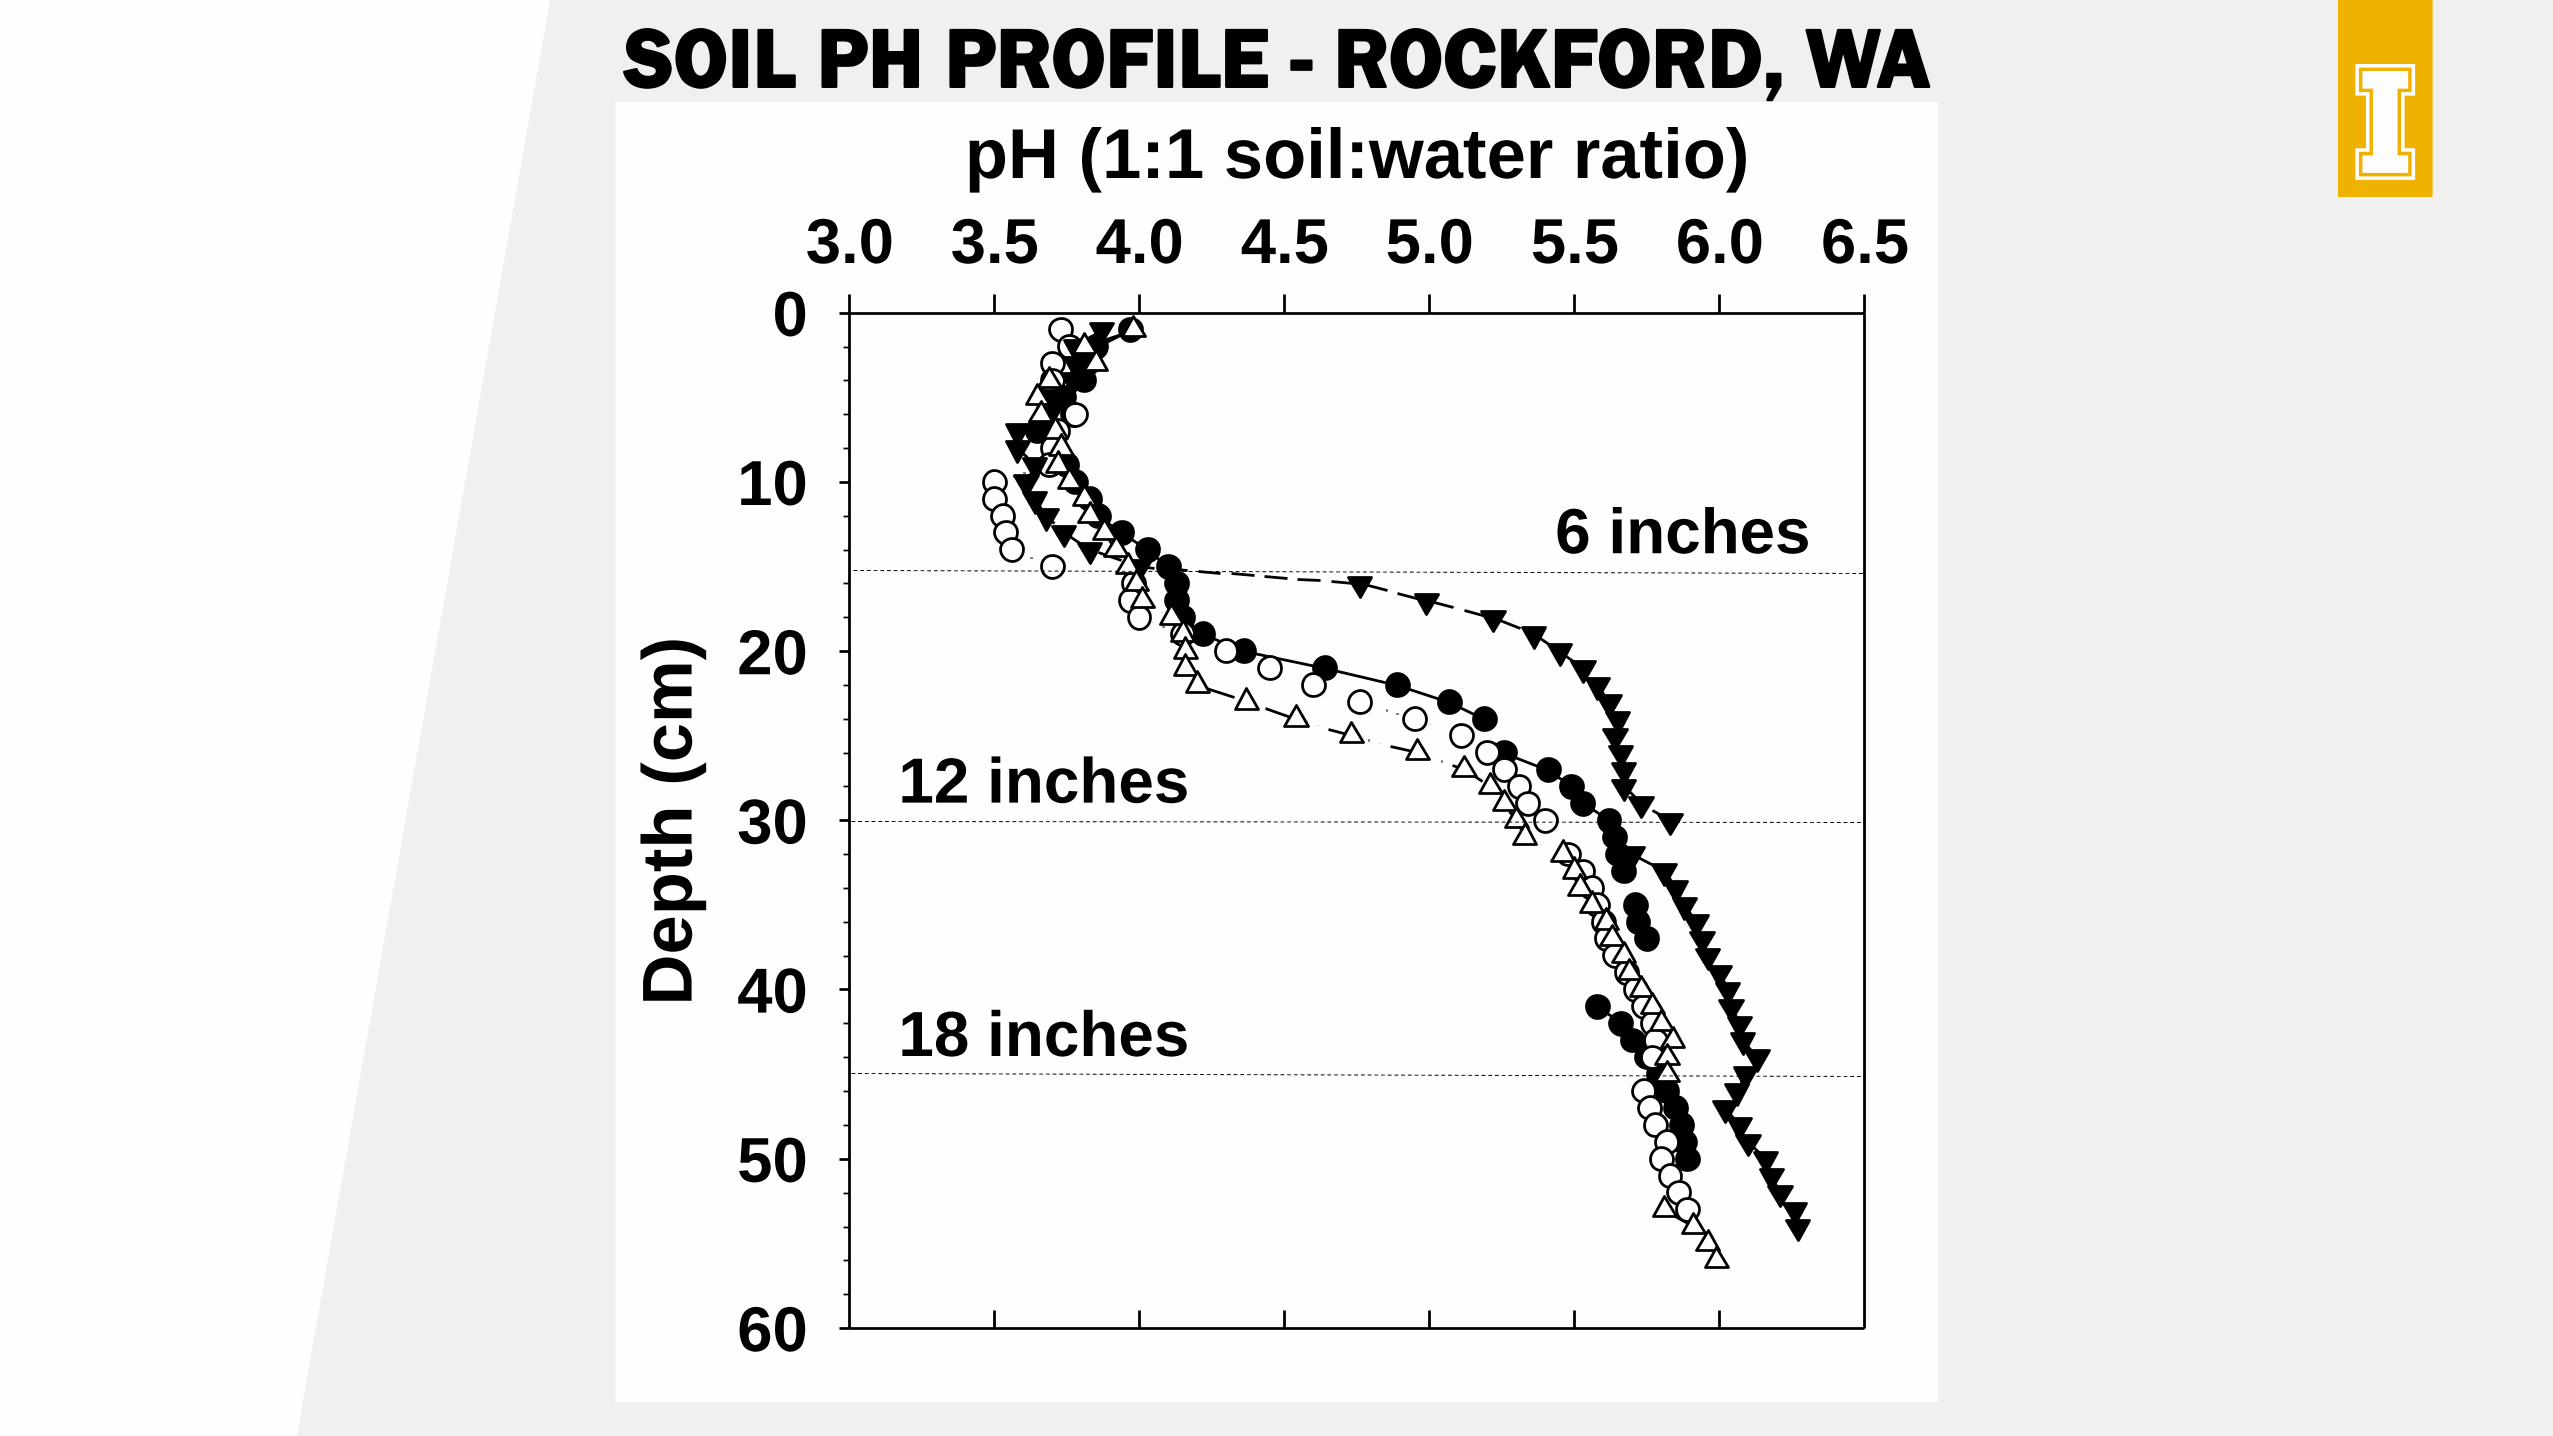
SOIL PH PROFILE - ROCKFORD, WApH (1:1 soil:water ratio)
3.0 3.5 4.0 4.5 5.0 5.5 6.0 6.5
De
pth
(cm
)
0
10
20
30
40
50
60
6 inches
12 inches
18 inches
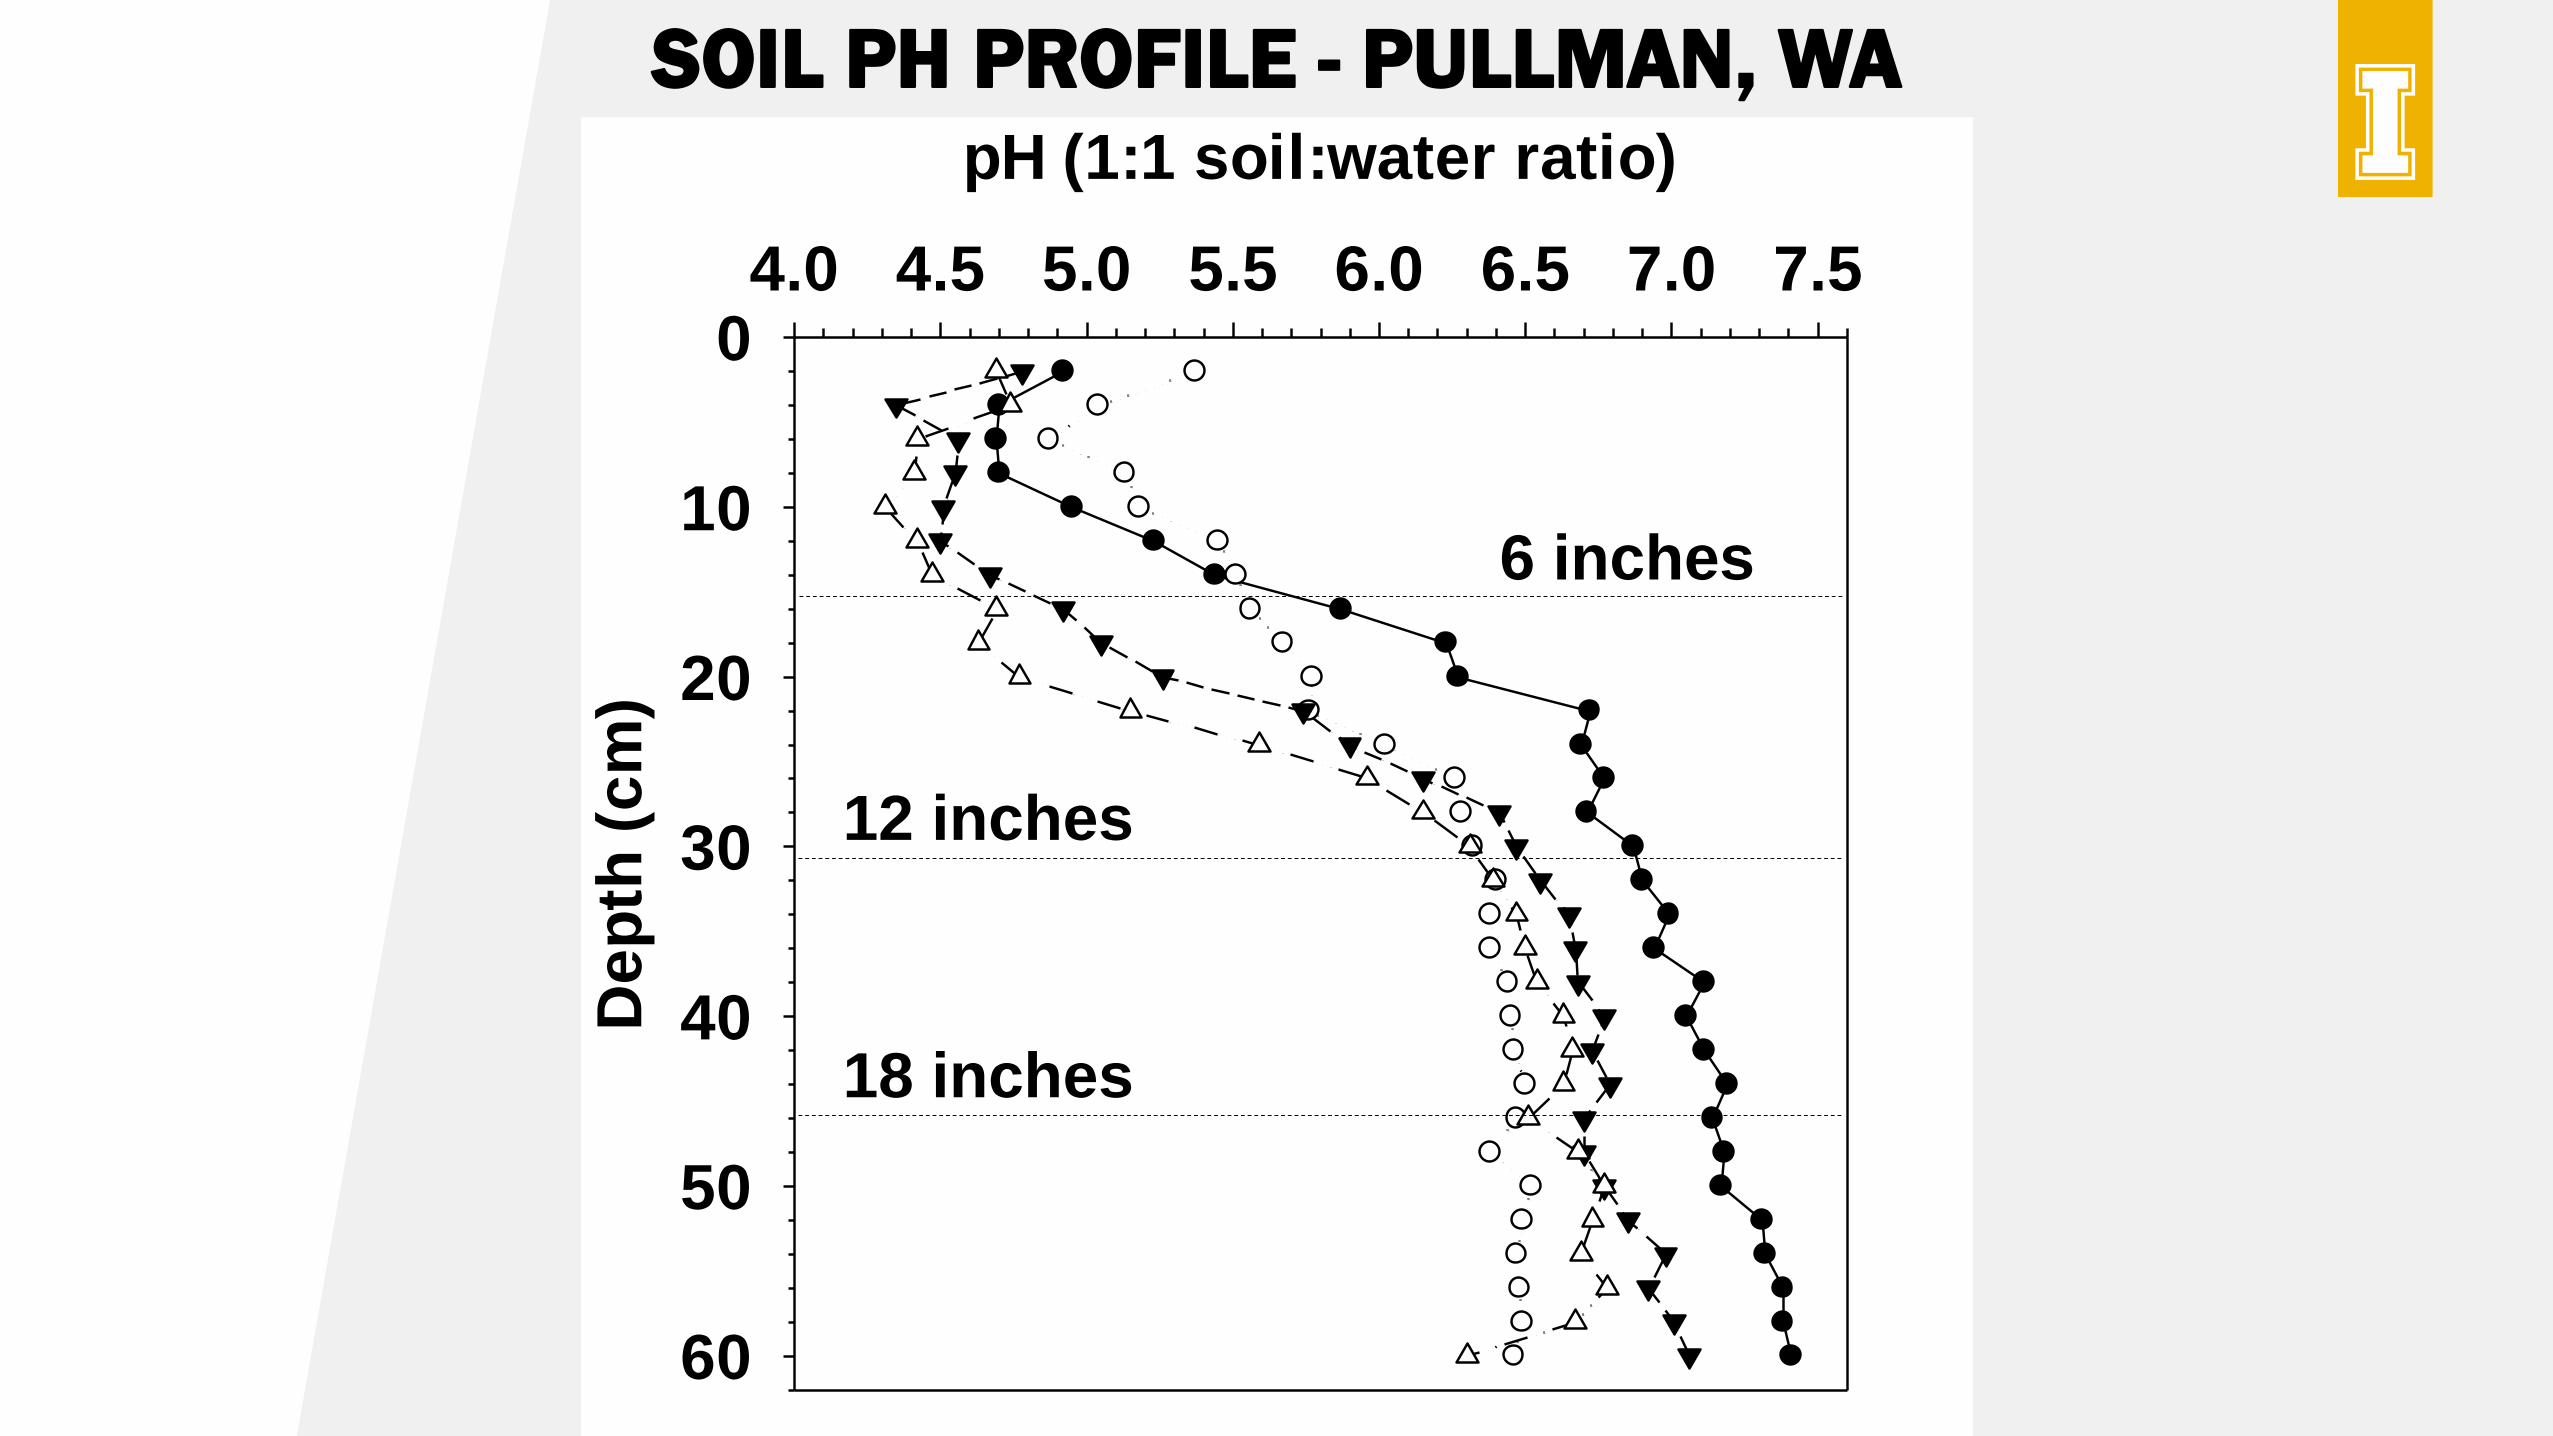
pH (1:1 soil:water ratio)
4.0 4.5 5.0 5.5 6.0 6.5 7.0 7.5
De
pth
(c
m)
0
10
20
30
40
50
60
6 inches
12 inches
18 inches
SOIL PH PROFILE - PULLMAN, WA
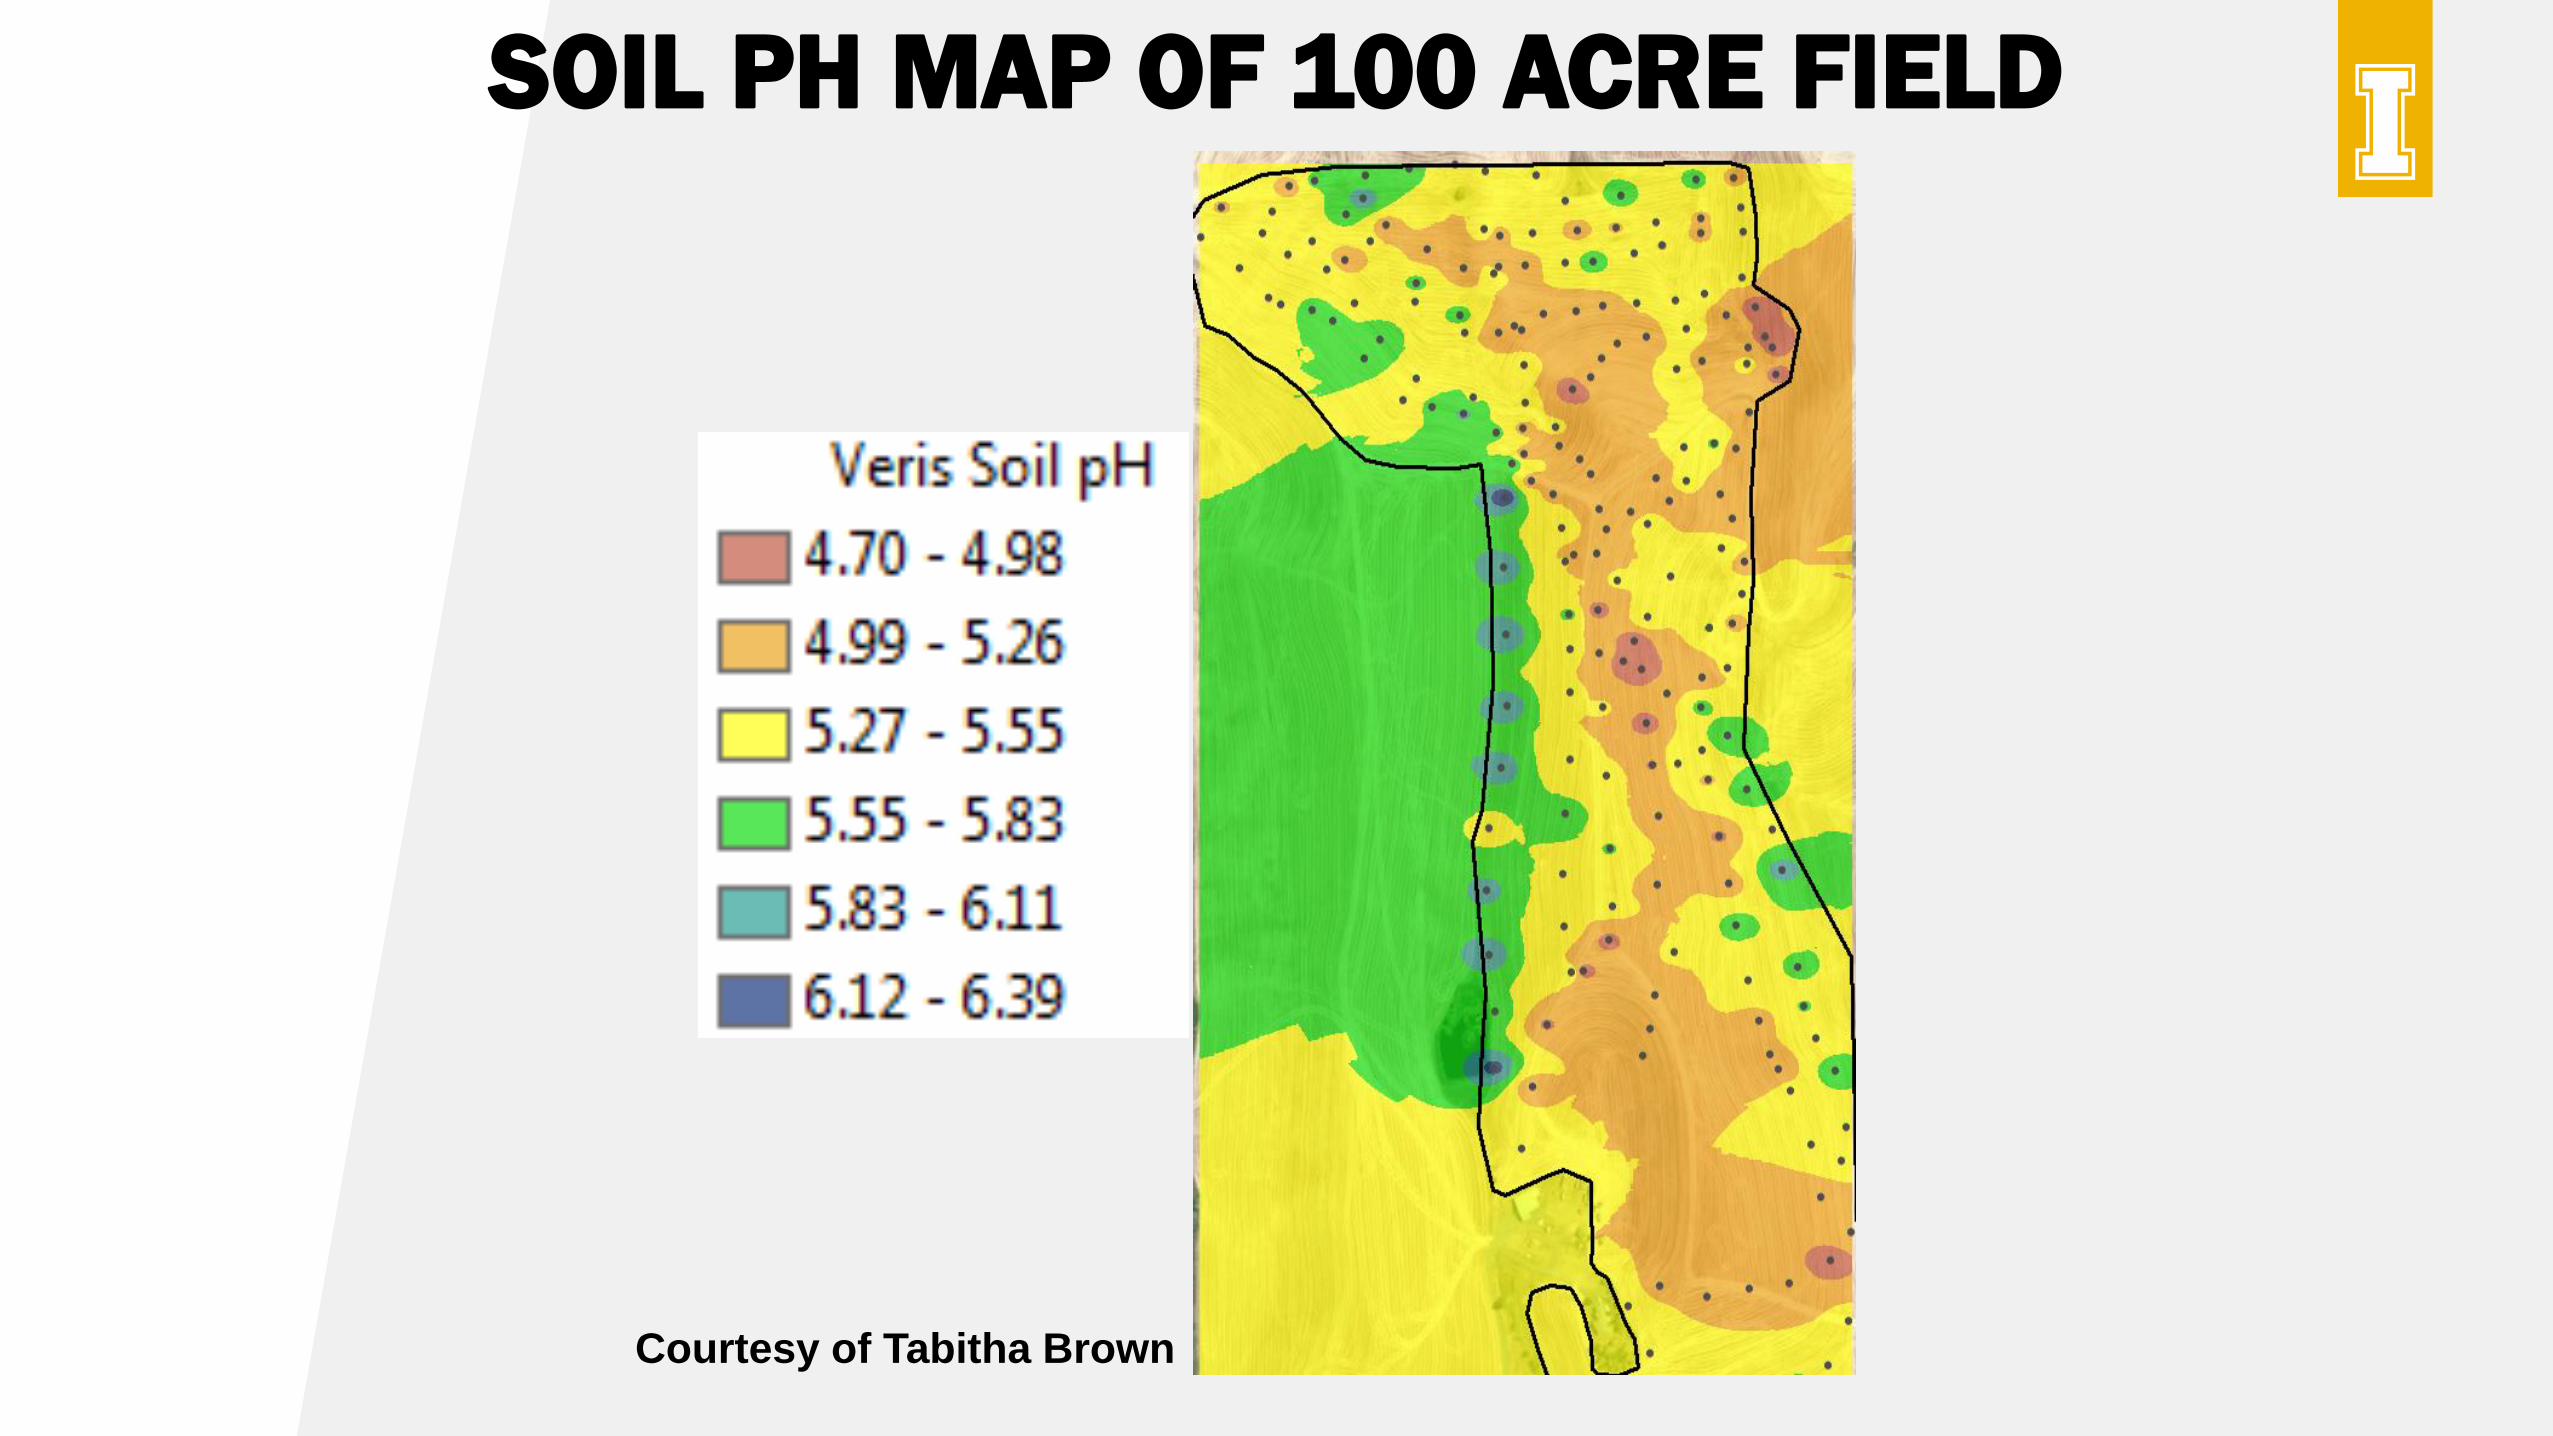
SOIL PH MAP OF 100 ACRE FIELD
Courtesy of Tabitha Brown
MANAGEMENT OF SOIL ACIDITY – VARIETY SELECTION
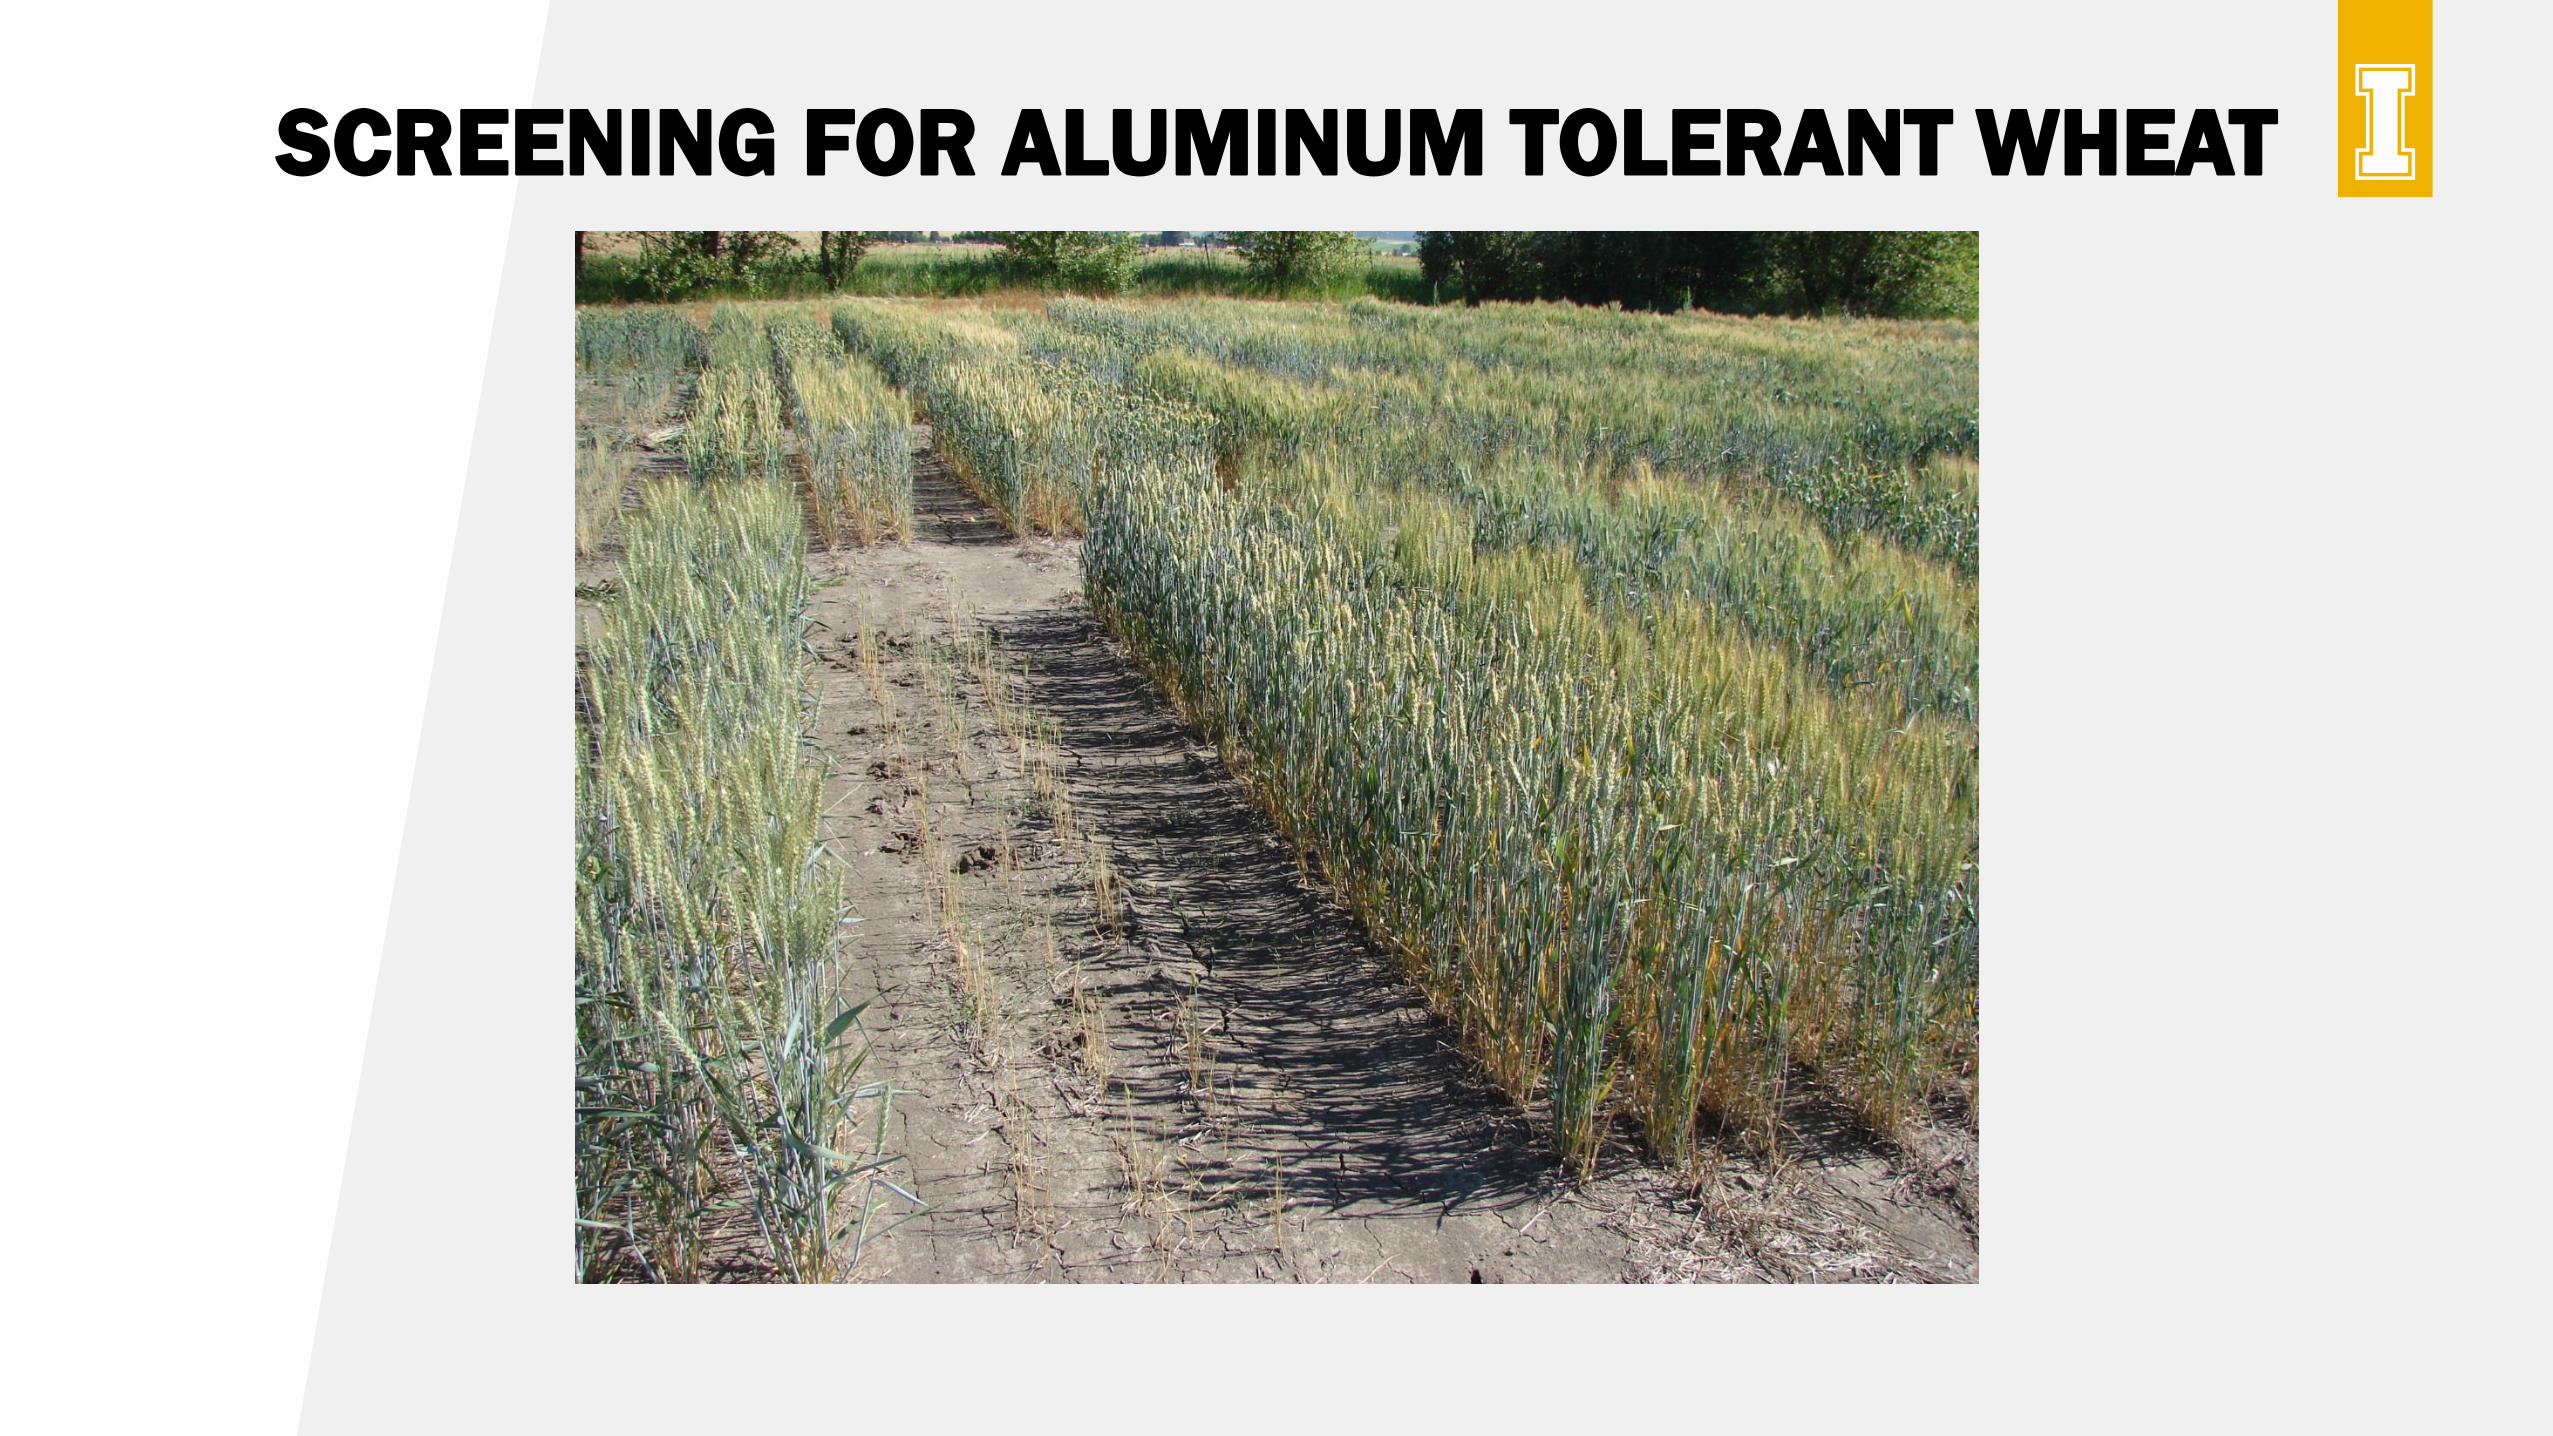
SCREENING FOR ALUMINUM TOLERANT WHEAT
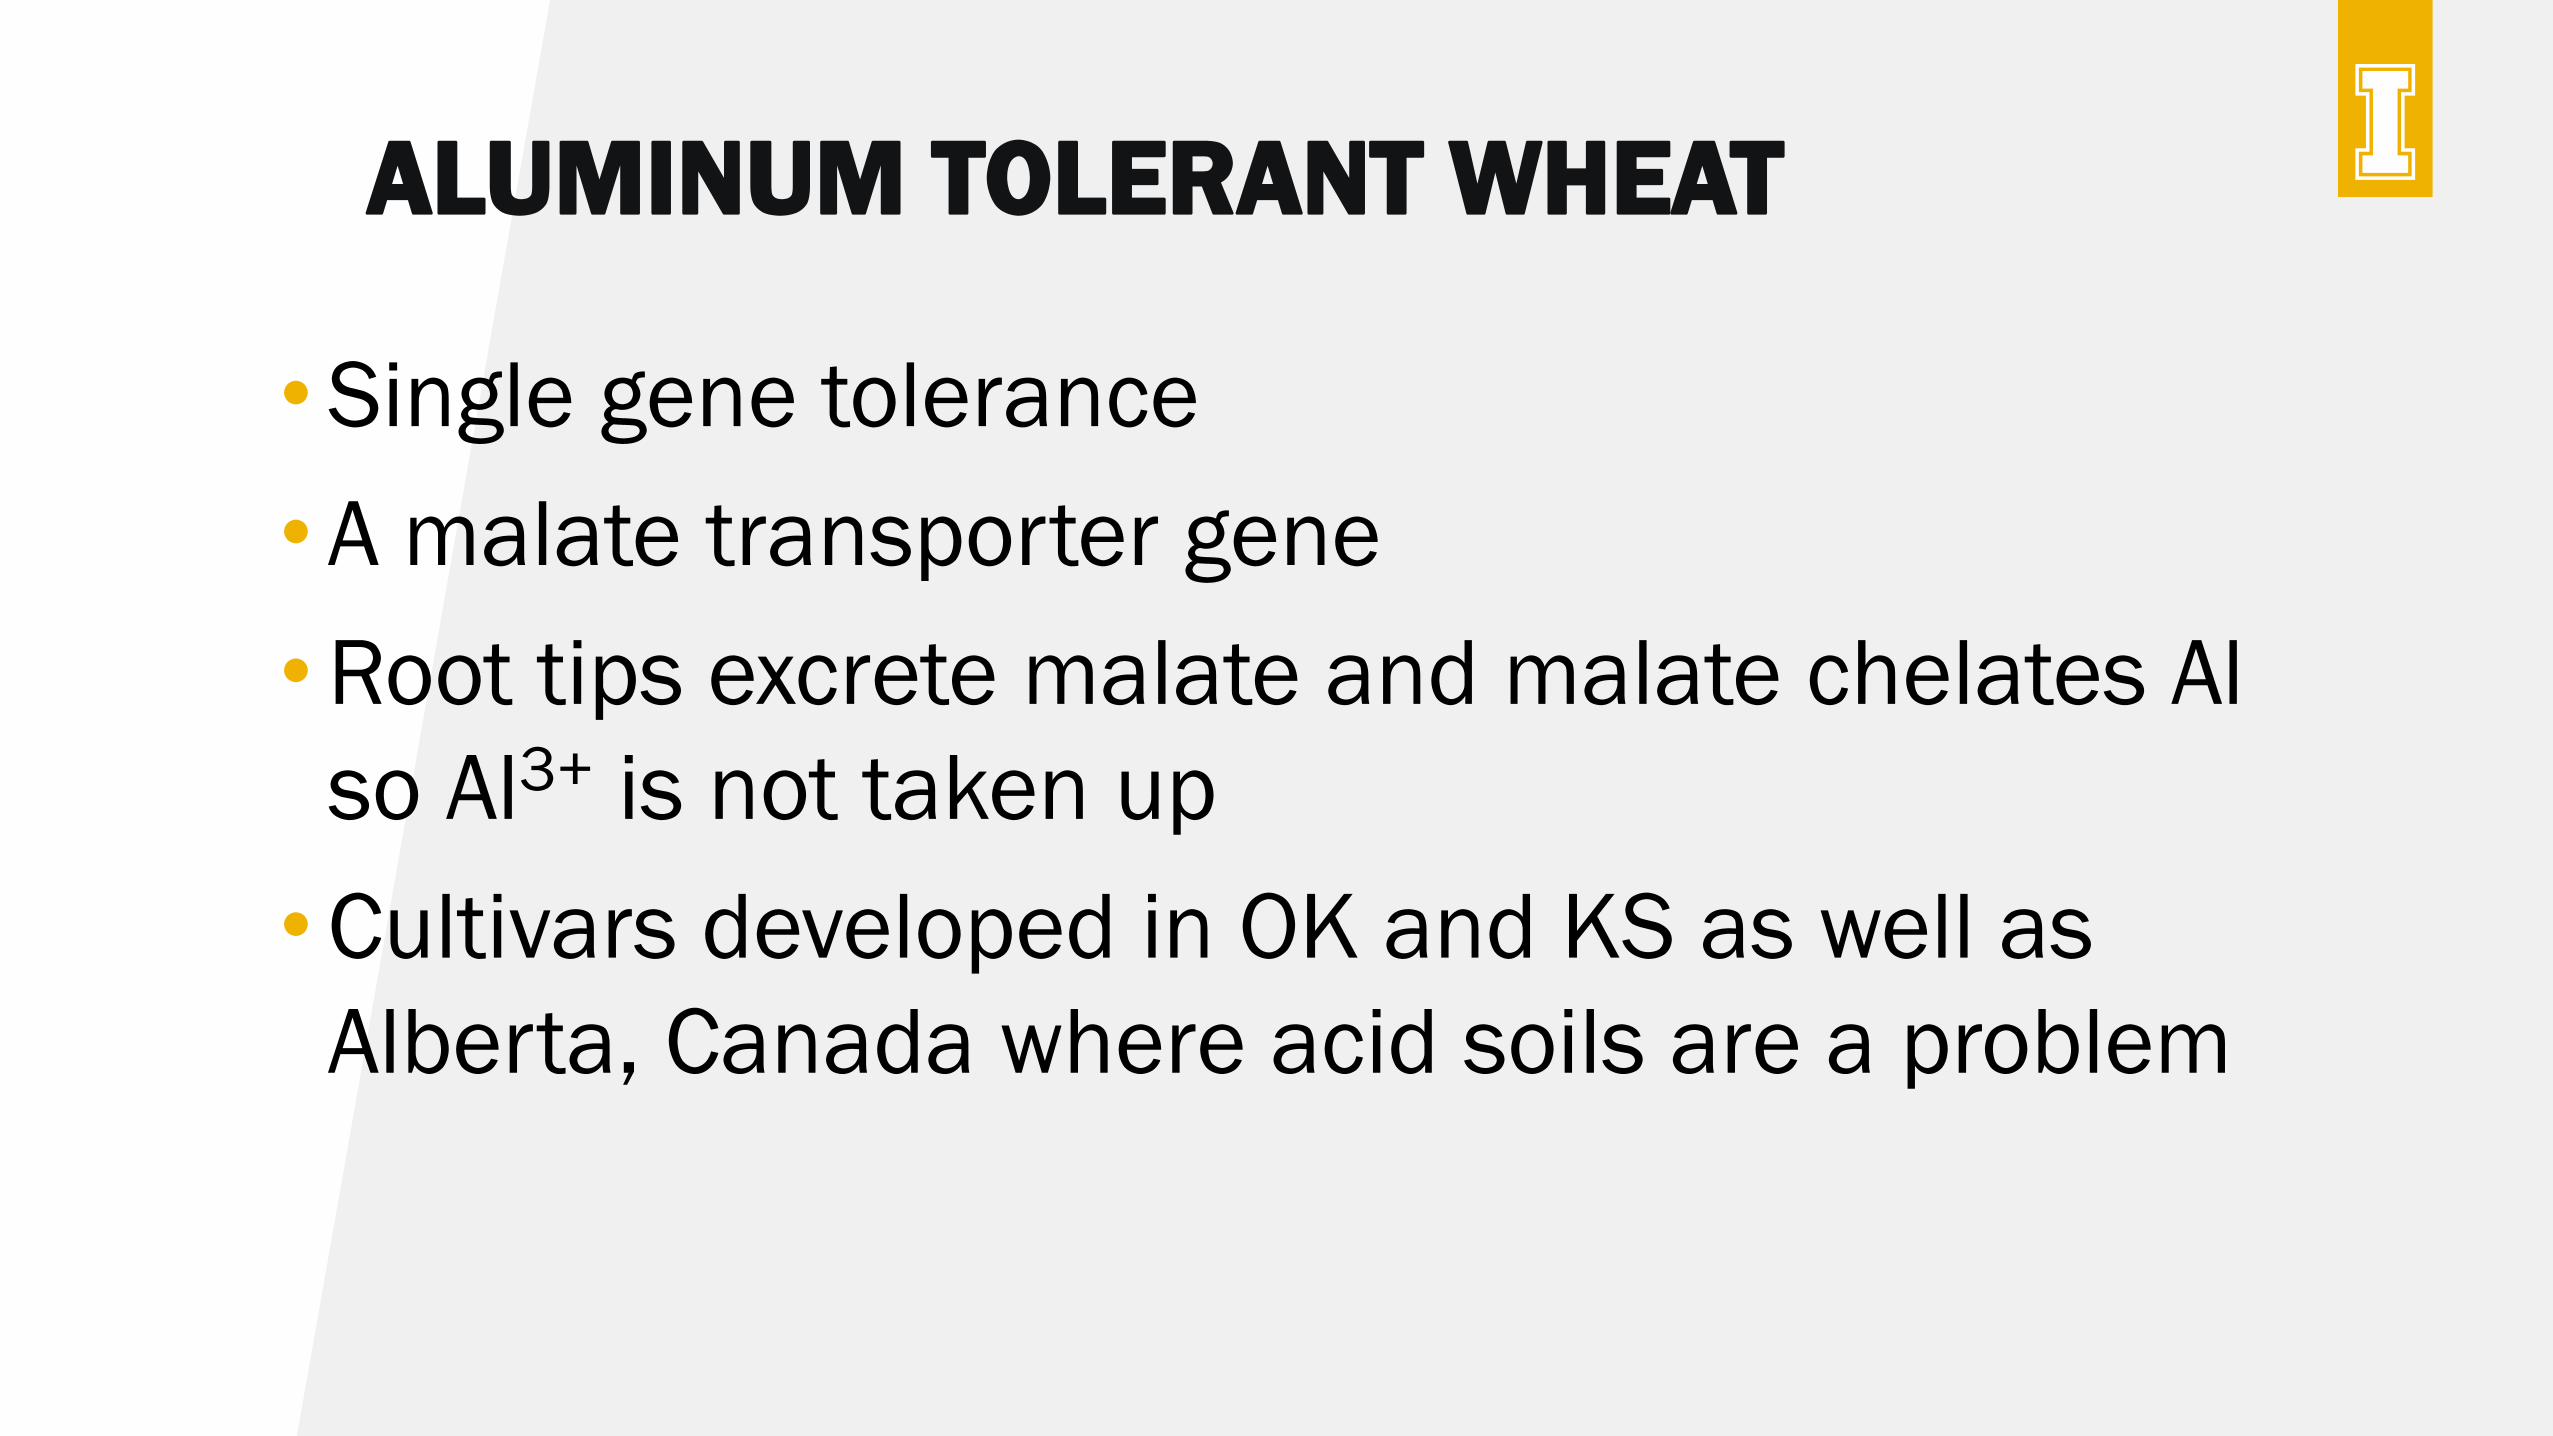
ALUMINUM TOLERANT WHEAT
•Single gene tolerance
•A malate transporter gene
•Root tips excrete malate and malate chelates Al
so Al3+ is not taken up
•Cultivars developed in OK and KS as well as
Alberta, Canada where acid soils are a problem
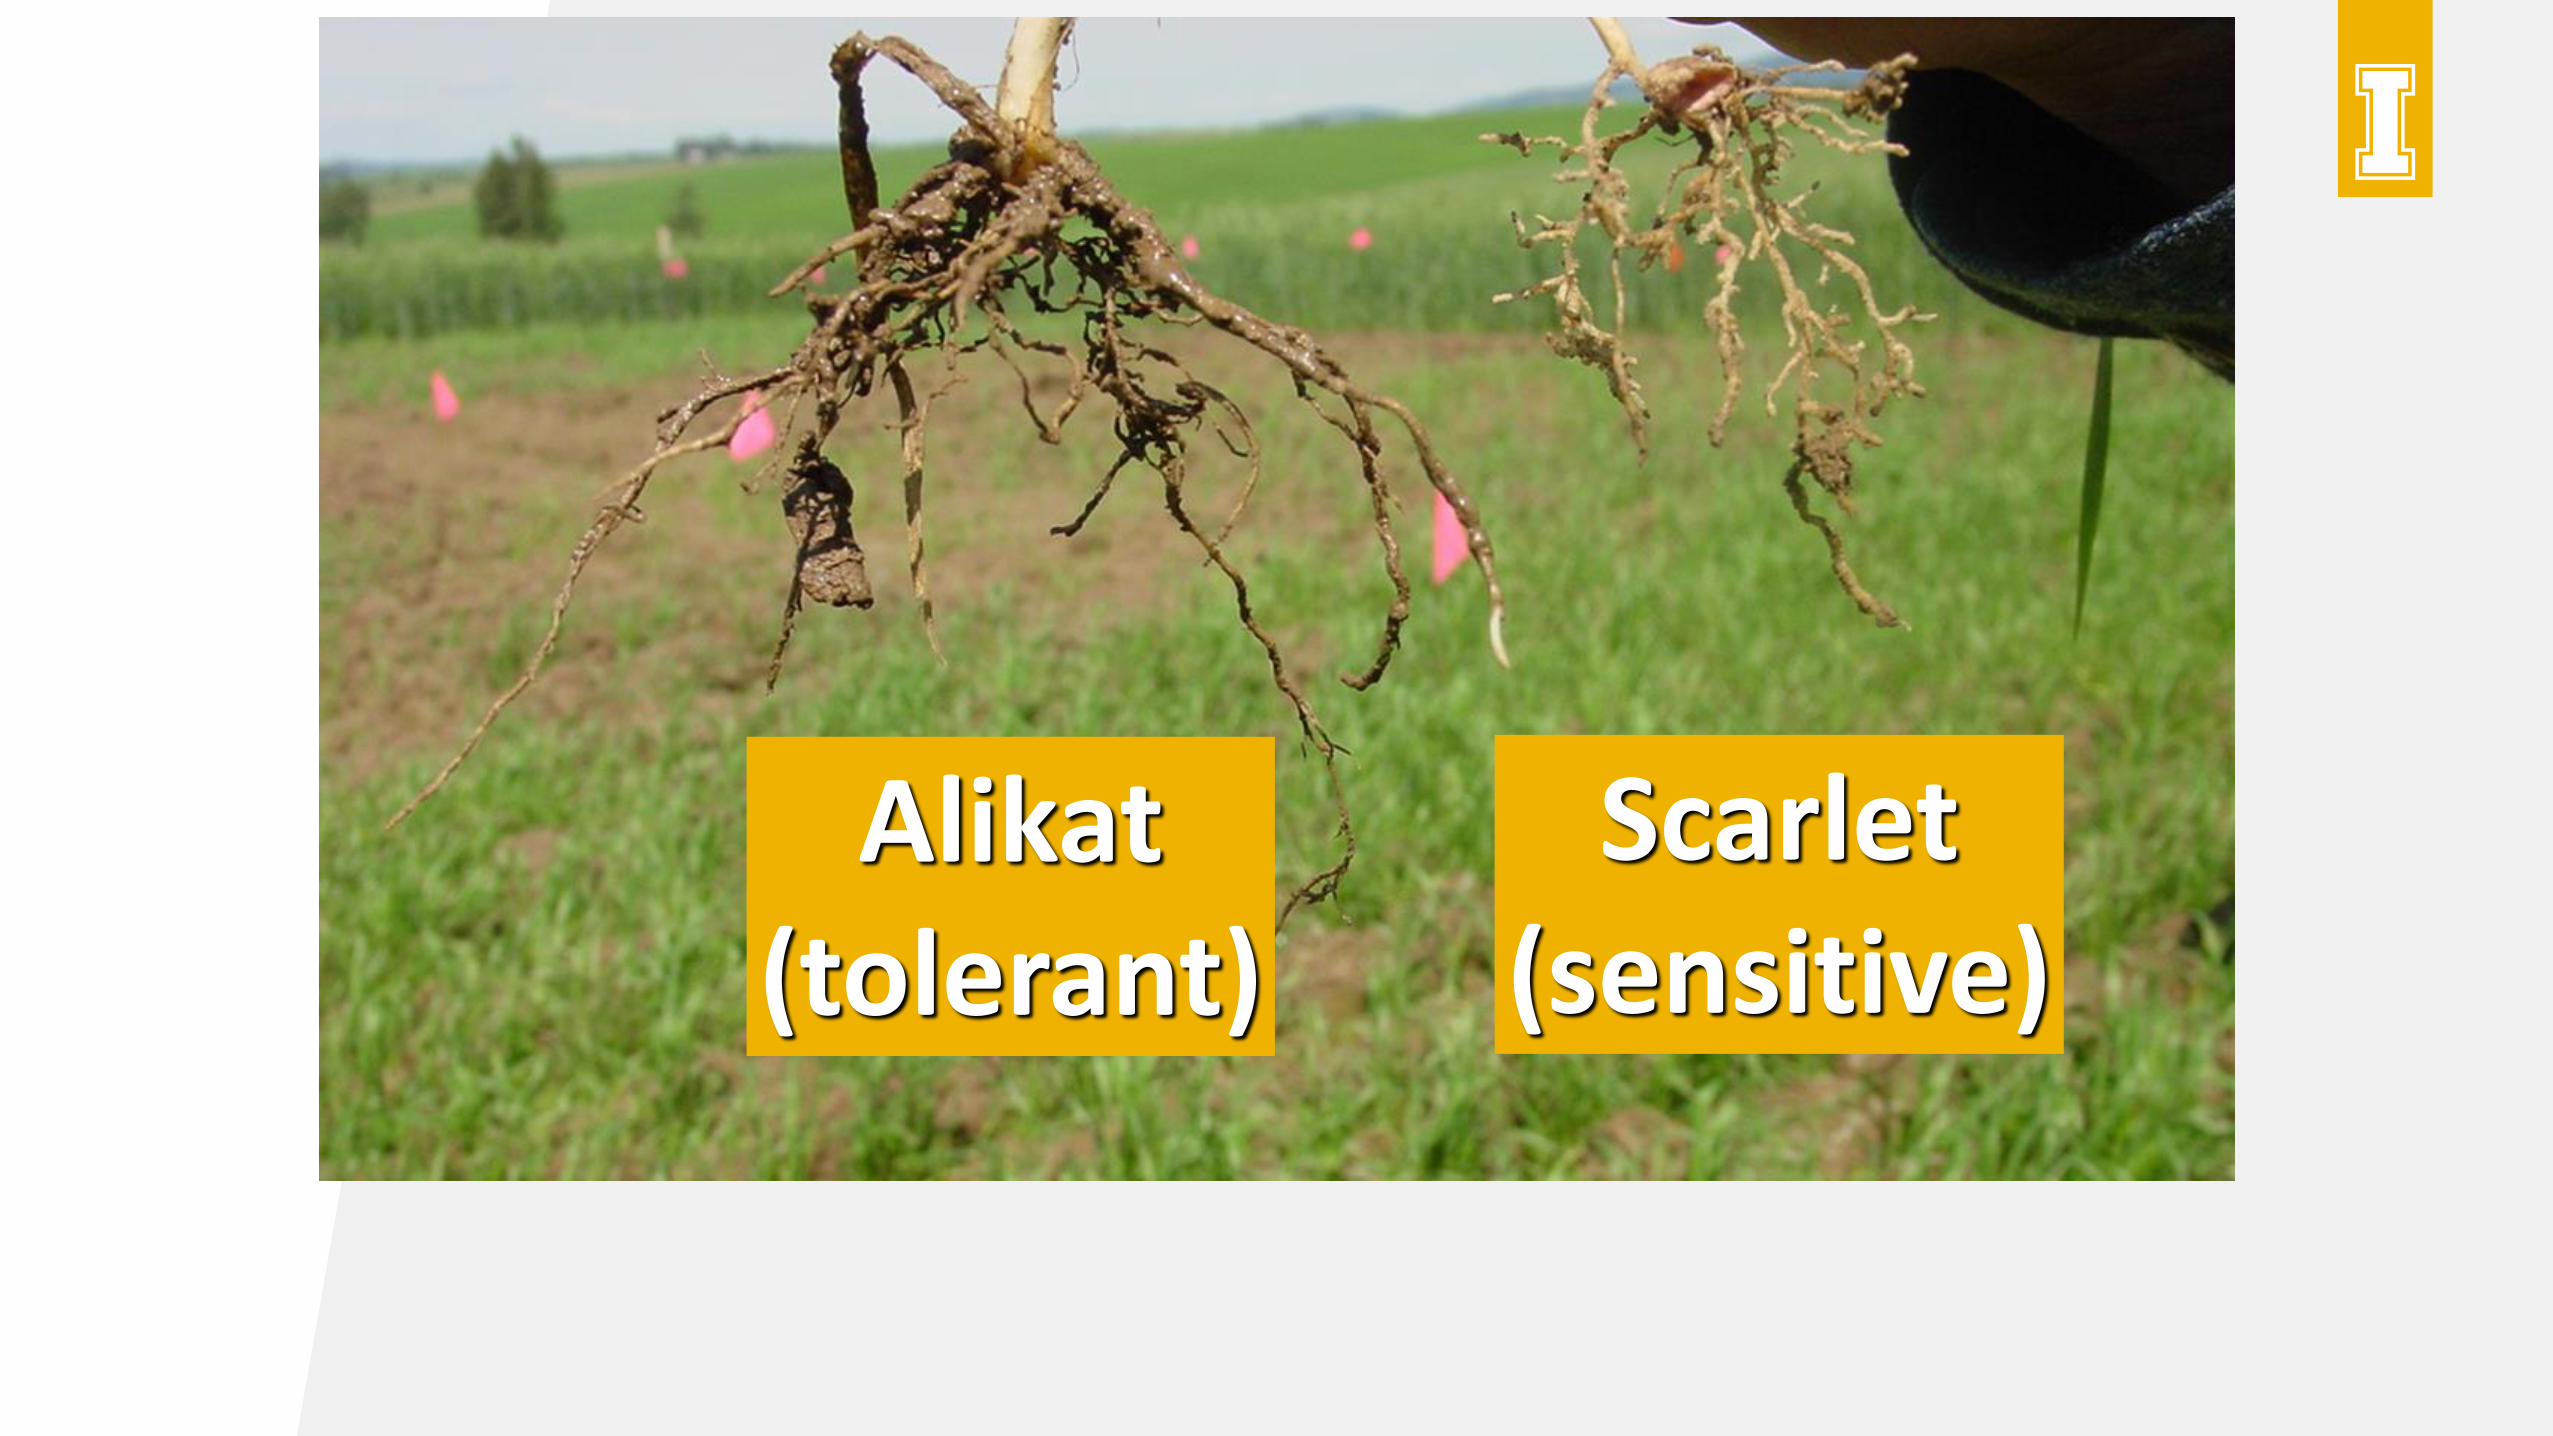
Scarlet(sensitive)
Alikat(tolerant)
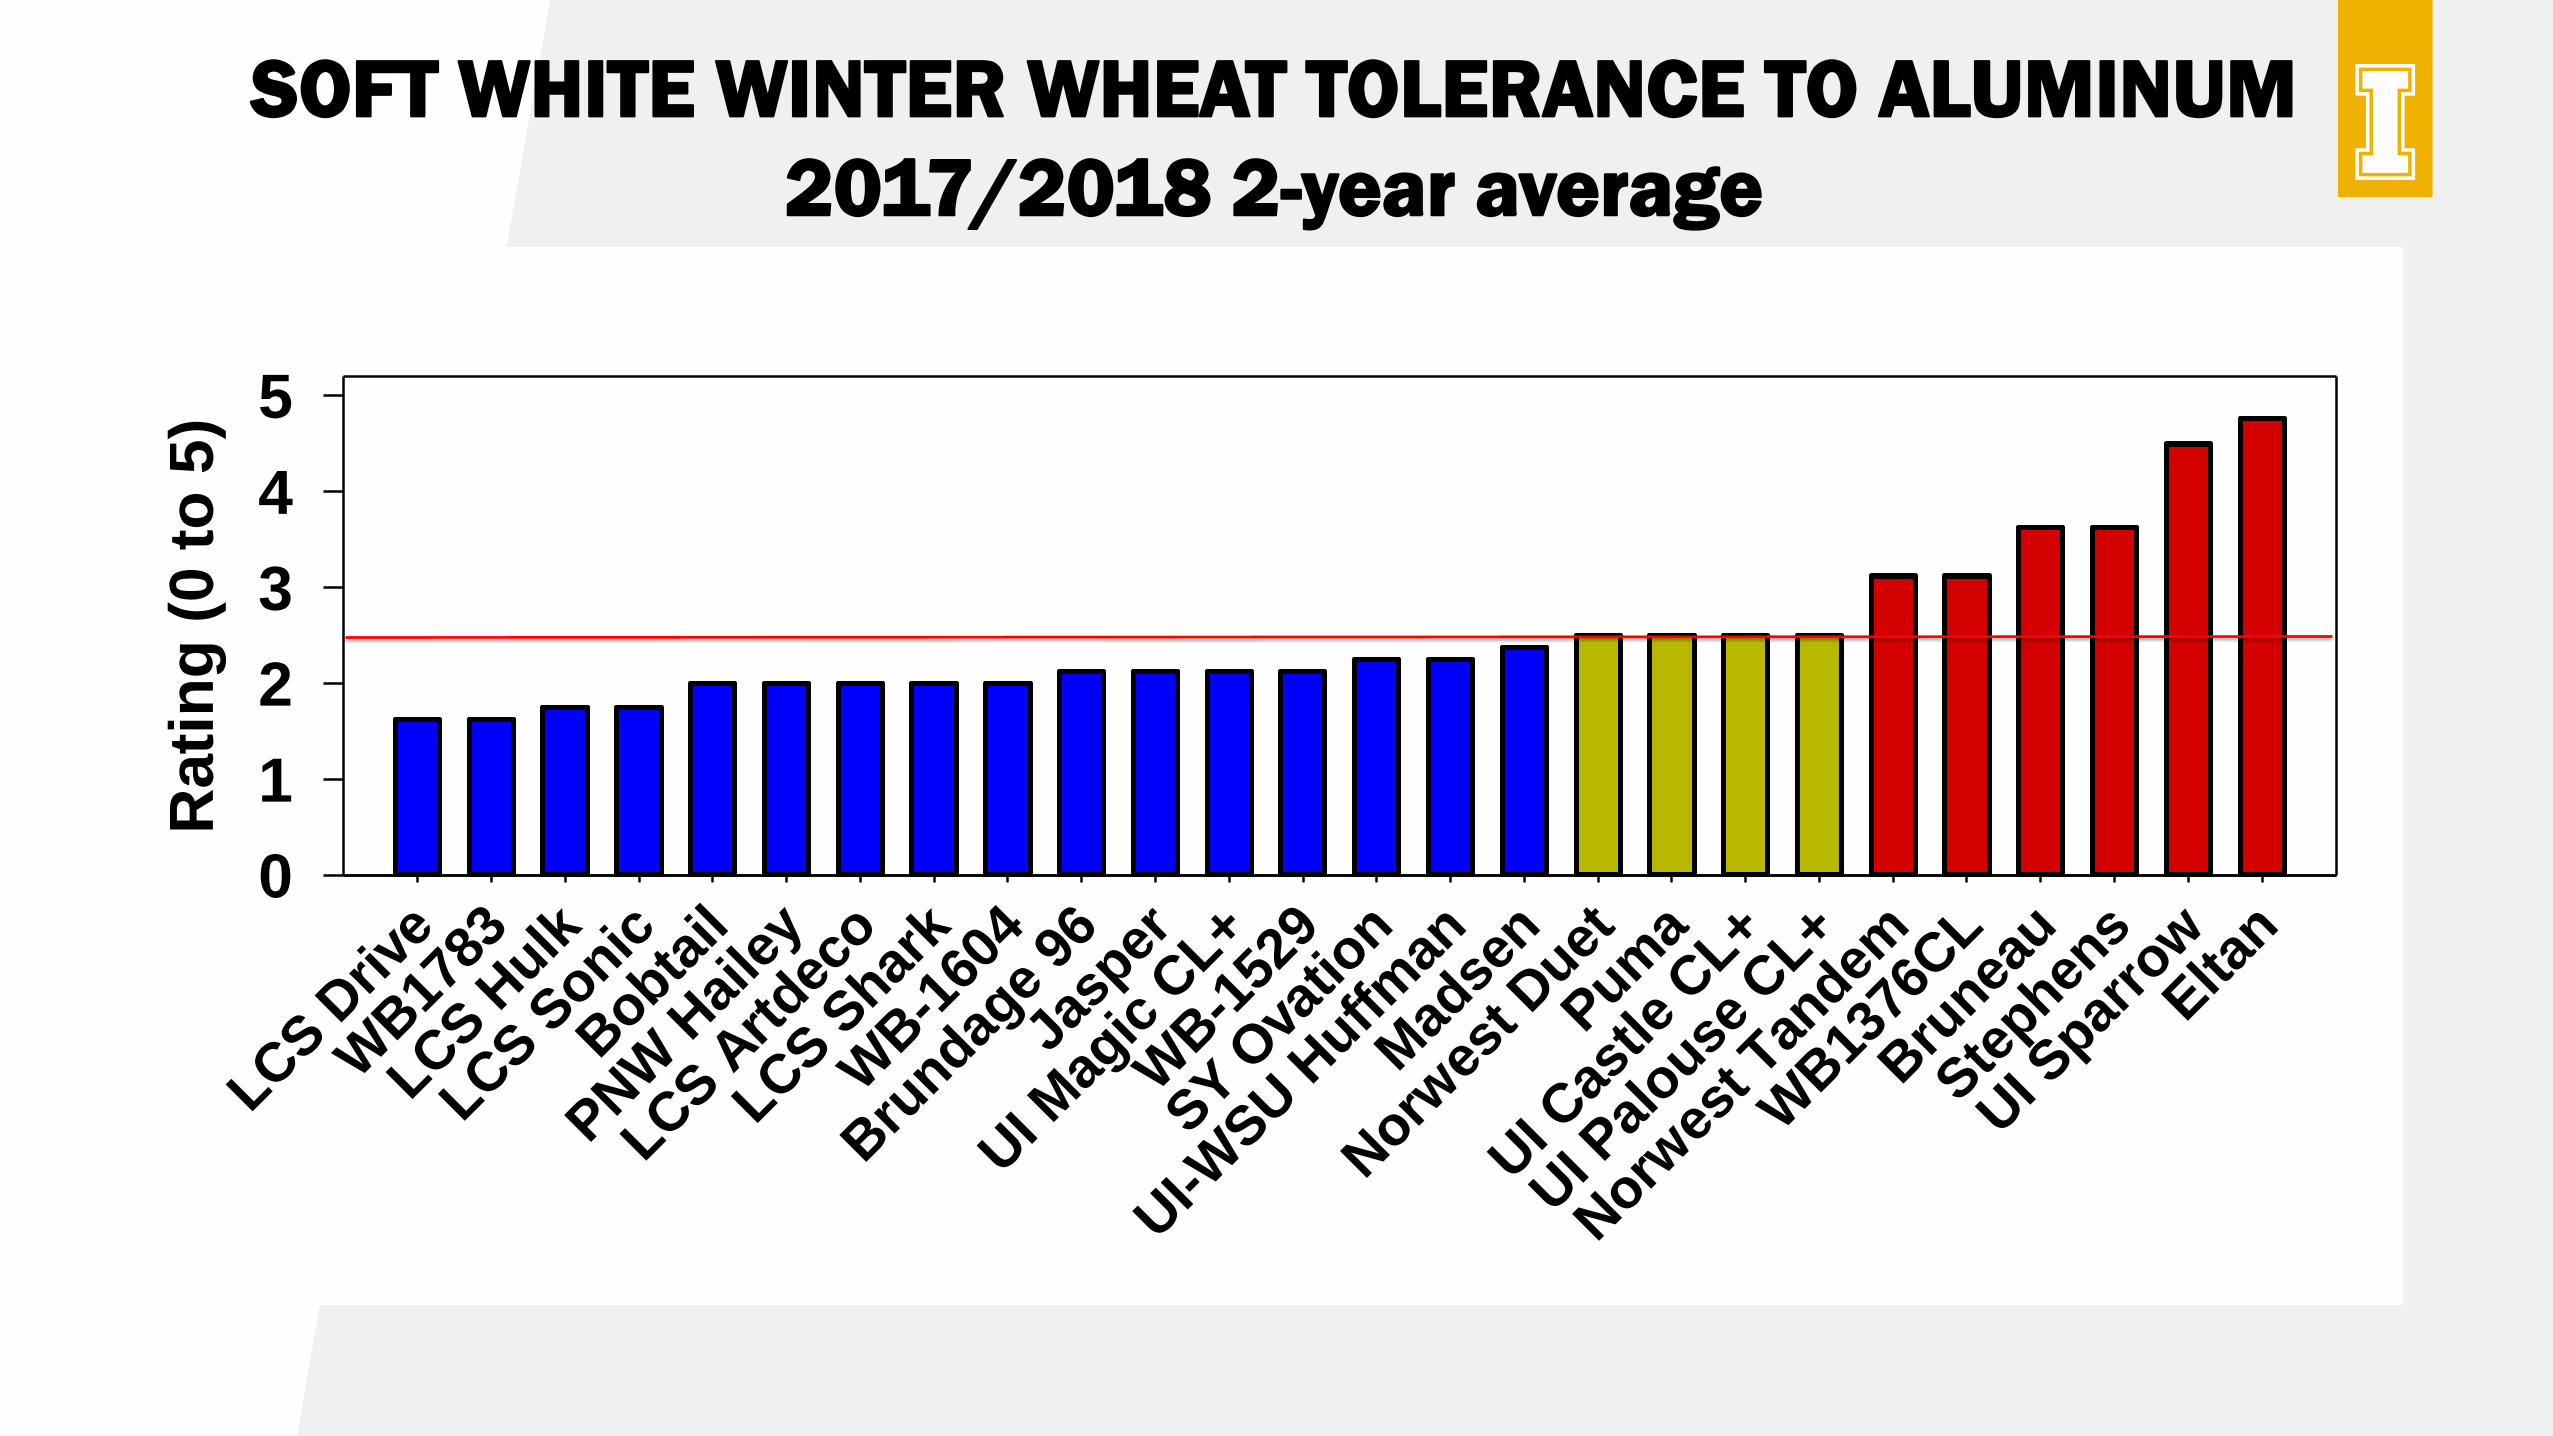
SOFT WHITE WINTER WHEAT TOLERANCE TO ALUMINUM
2017/2018 2-year average
LCS D
rive
WB17
83
LCS H
ulk
LCS S
onic
Bobta
il
PNW
Hai
ley
LCS A
rtdec
o
LCS S
hark
WB-1
604
Bru
ndage
96
Jasp
er
UI M
agic
CL+
WB-1
529
SY O
vatio
n
UI-W
SU H
uffman
Mad
sen
Norw
est D
uet
Pum
a
UI C
astle
CL+
UI P
alouse
CL+
Norw
est T
andem
WB13
76CL
Bru
neau
Ste
phens
UI S
parro
wElta
n
Rati
ng
(0 t
o 5
)
0
1
2
3
4
5
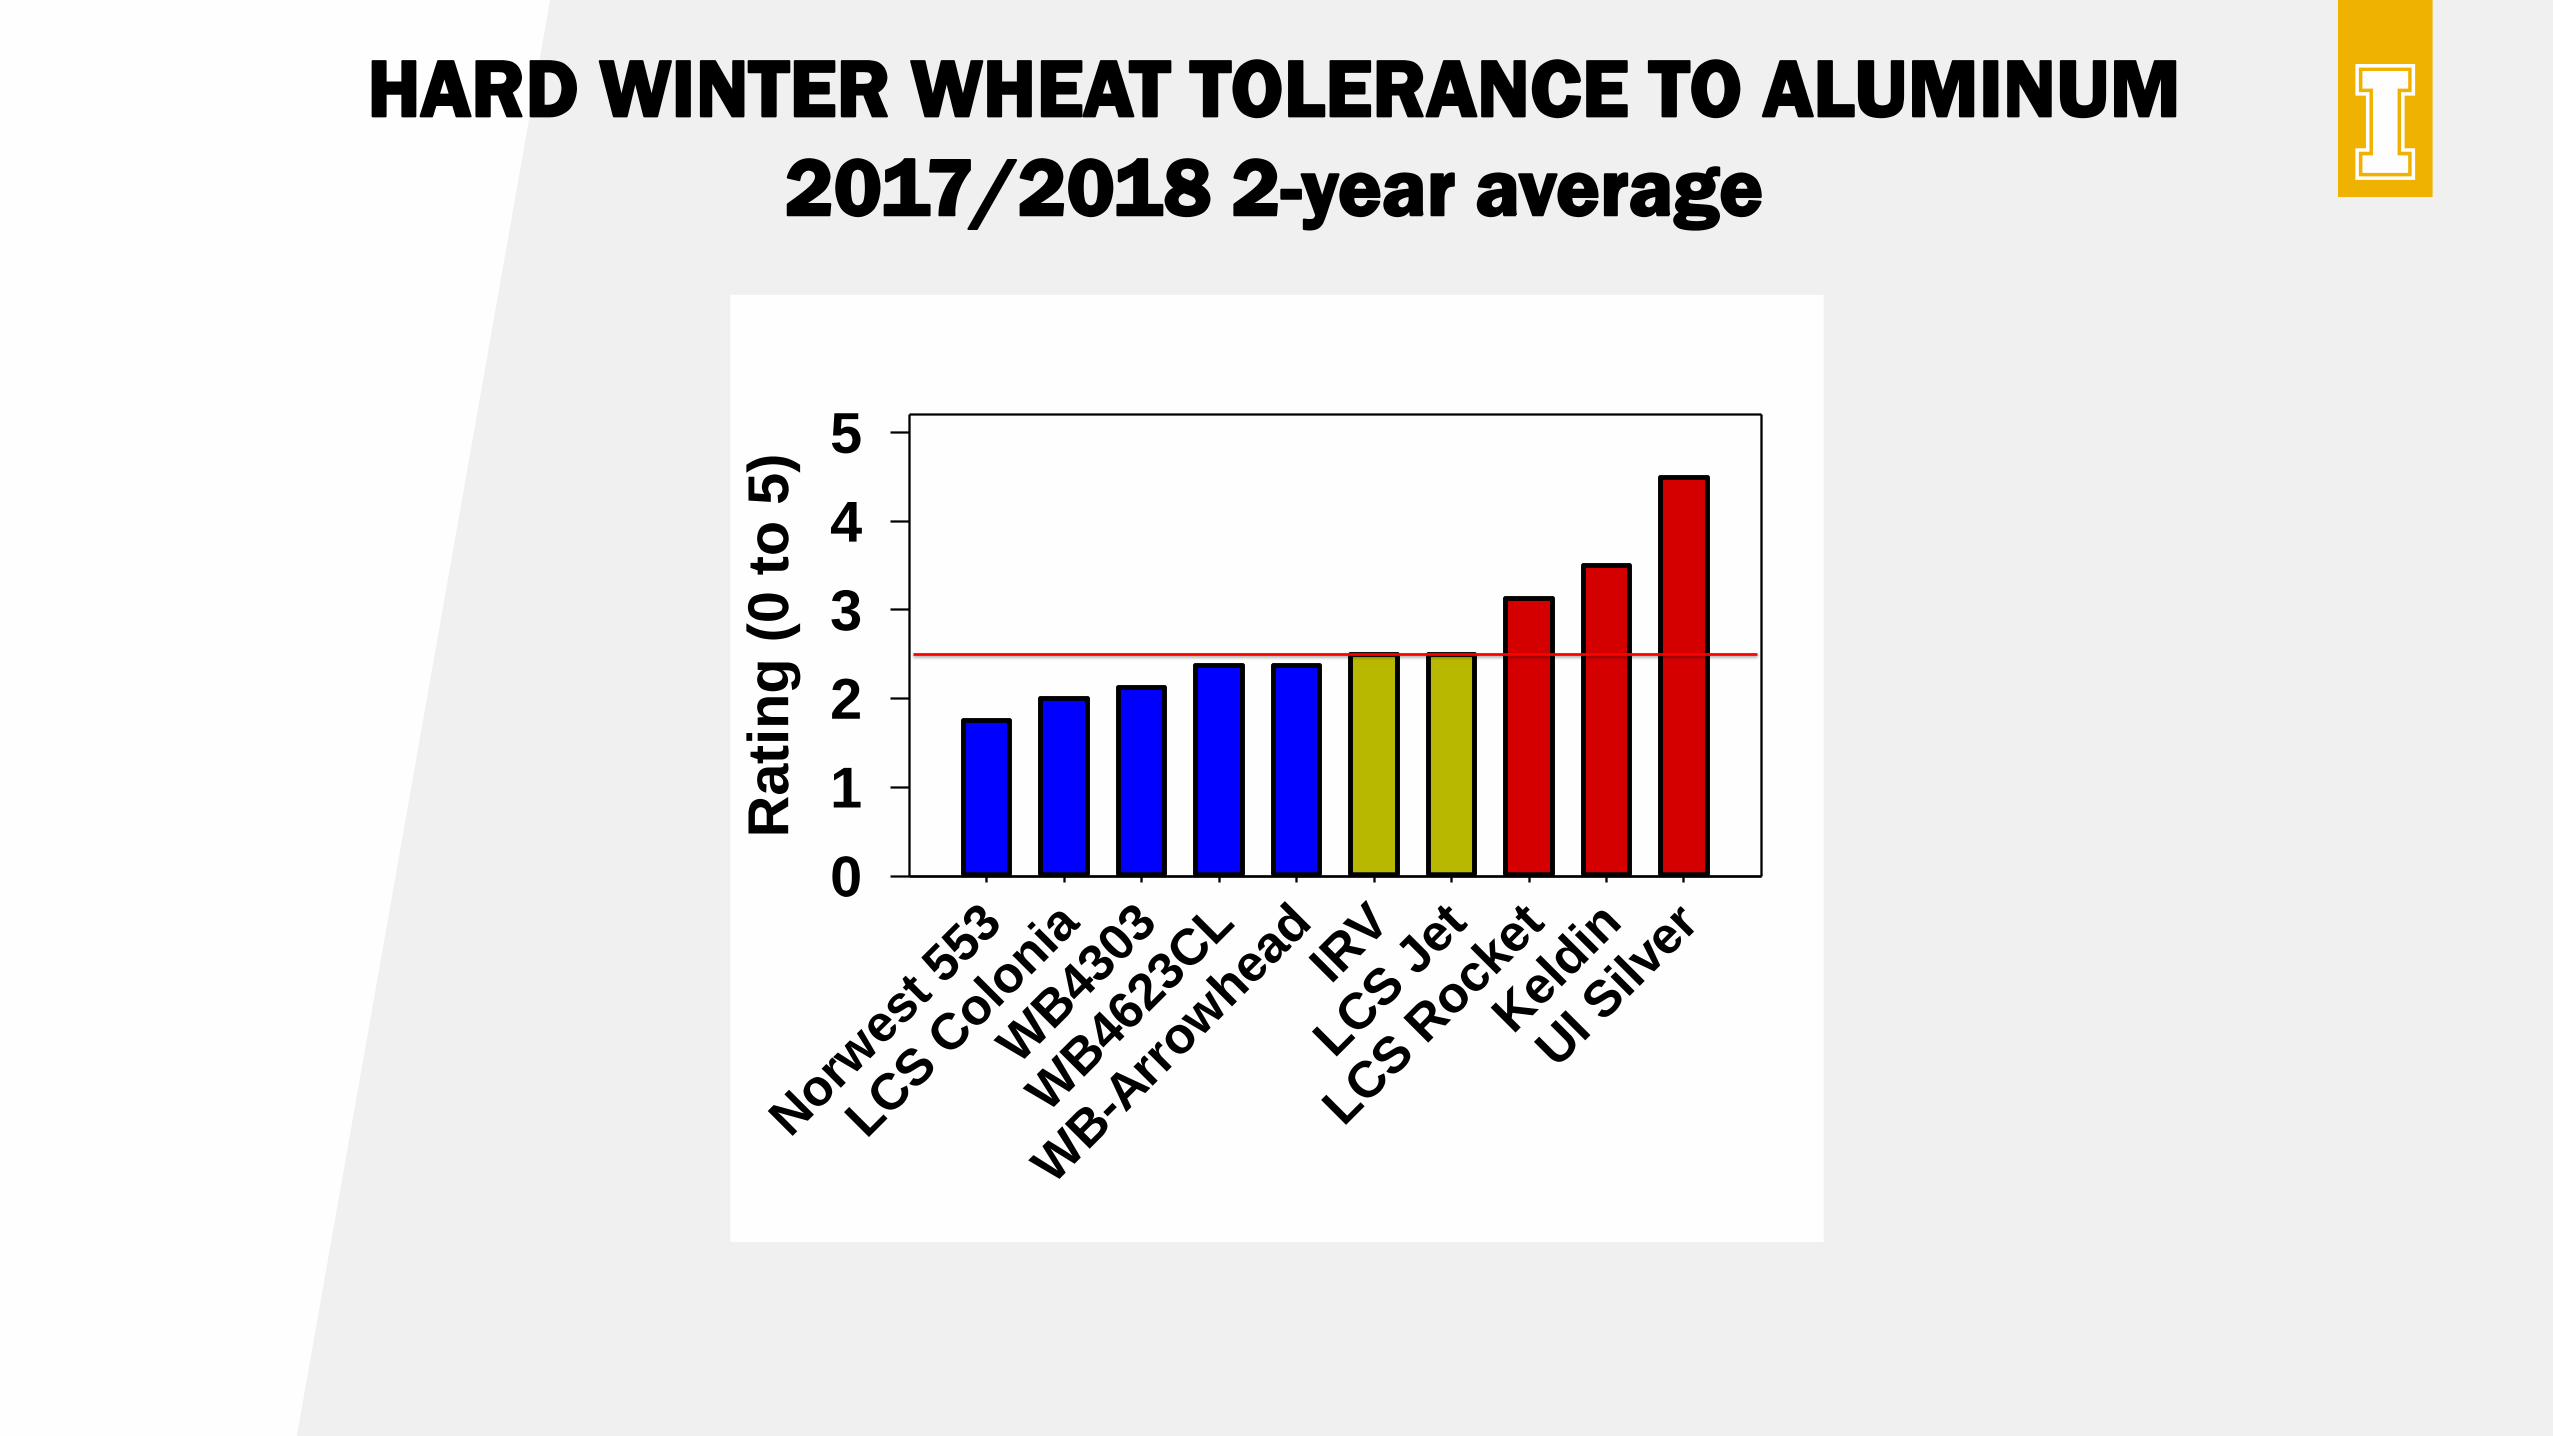
HARD WINTER WHEAT TOLERANCE TO ALUMINUM
2017/2018 2-year average
Norw
est 5
53
LCS C
olonia
WB43
03
WB46
23CL
WB-A
rrow
head
IRV
LCS J
et
LCS R
ocket
Kel
din
UI S
ilver
Rati
ng
(0 t
o 5
)
0
1
2
3
4
5
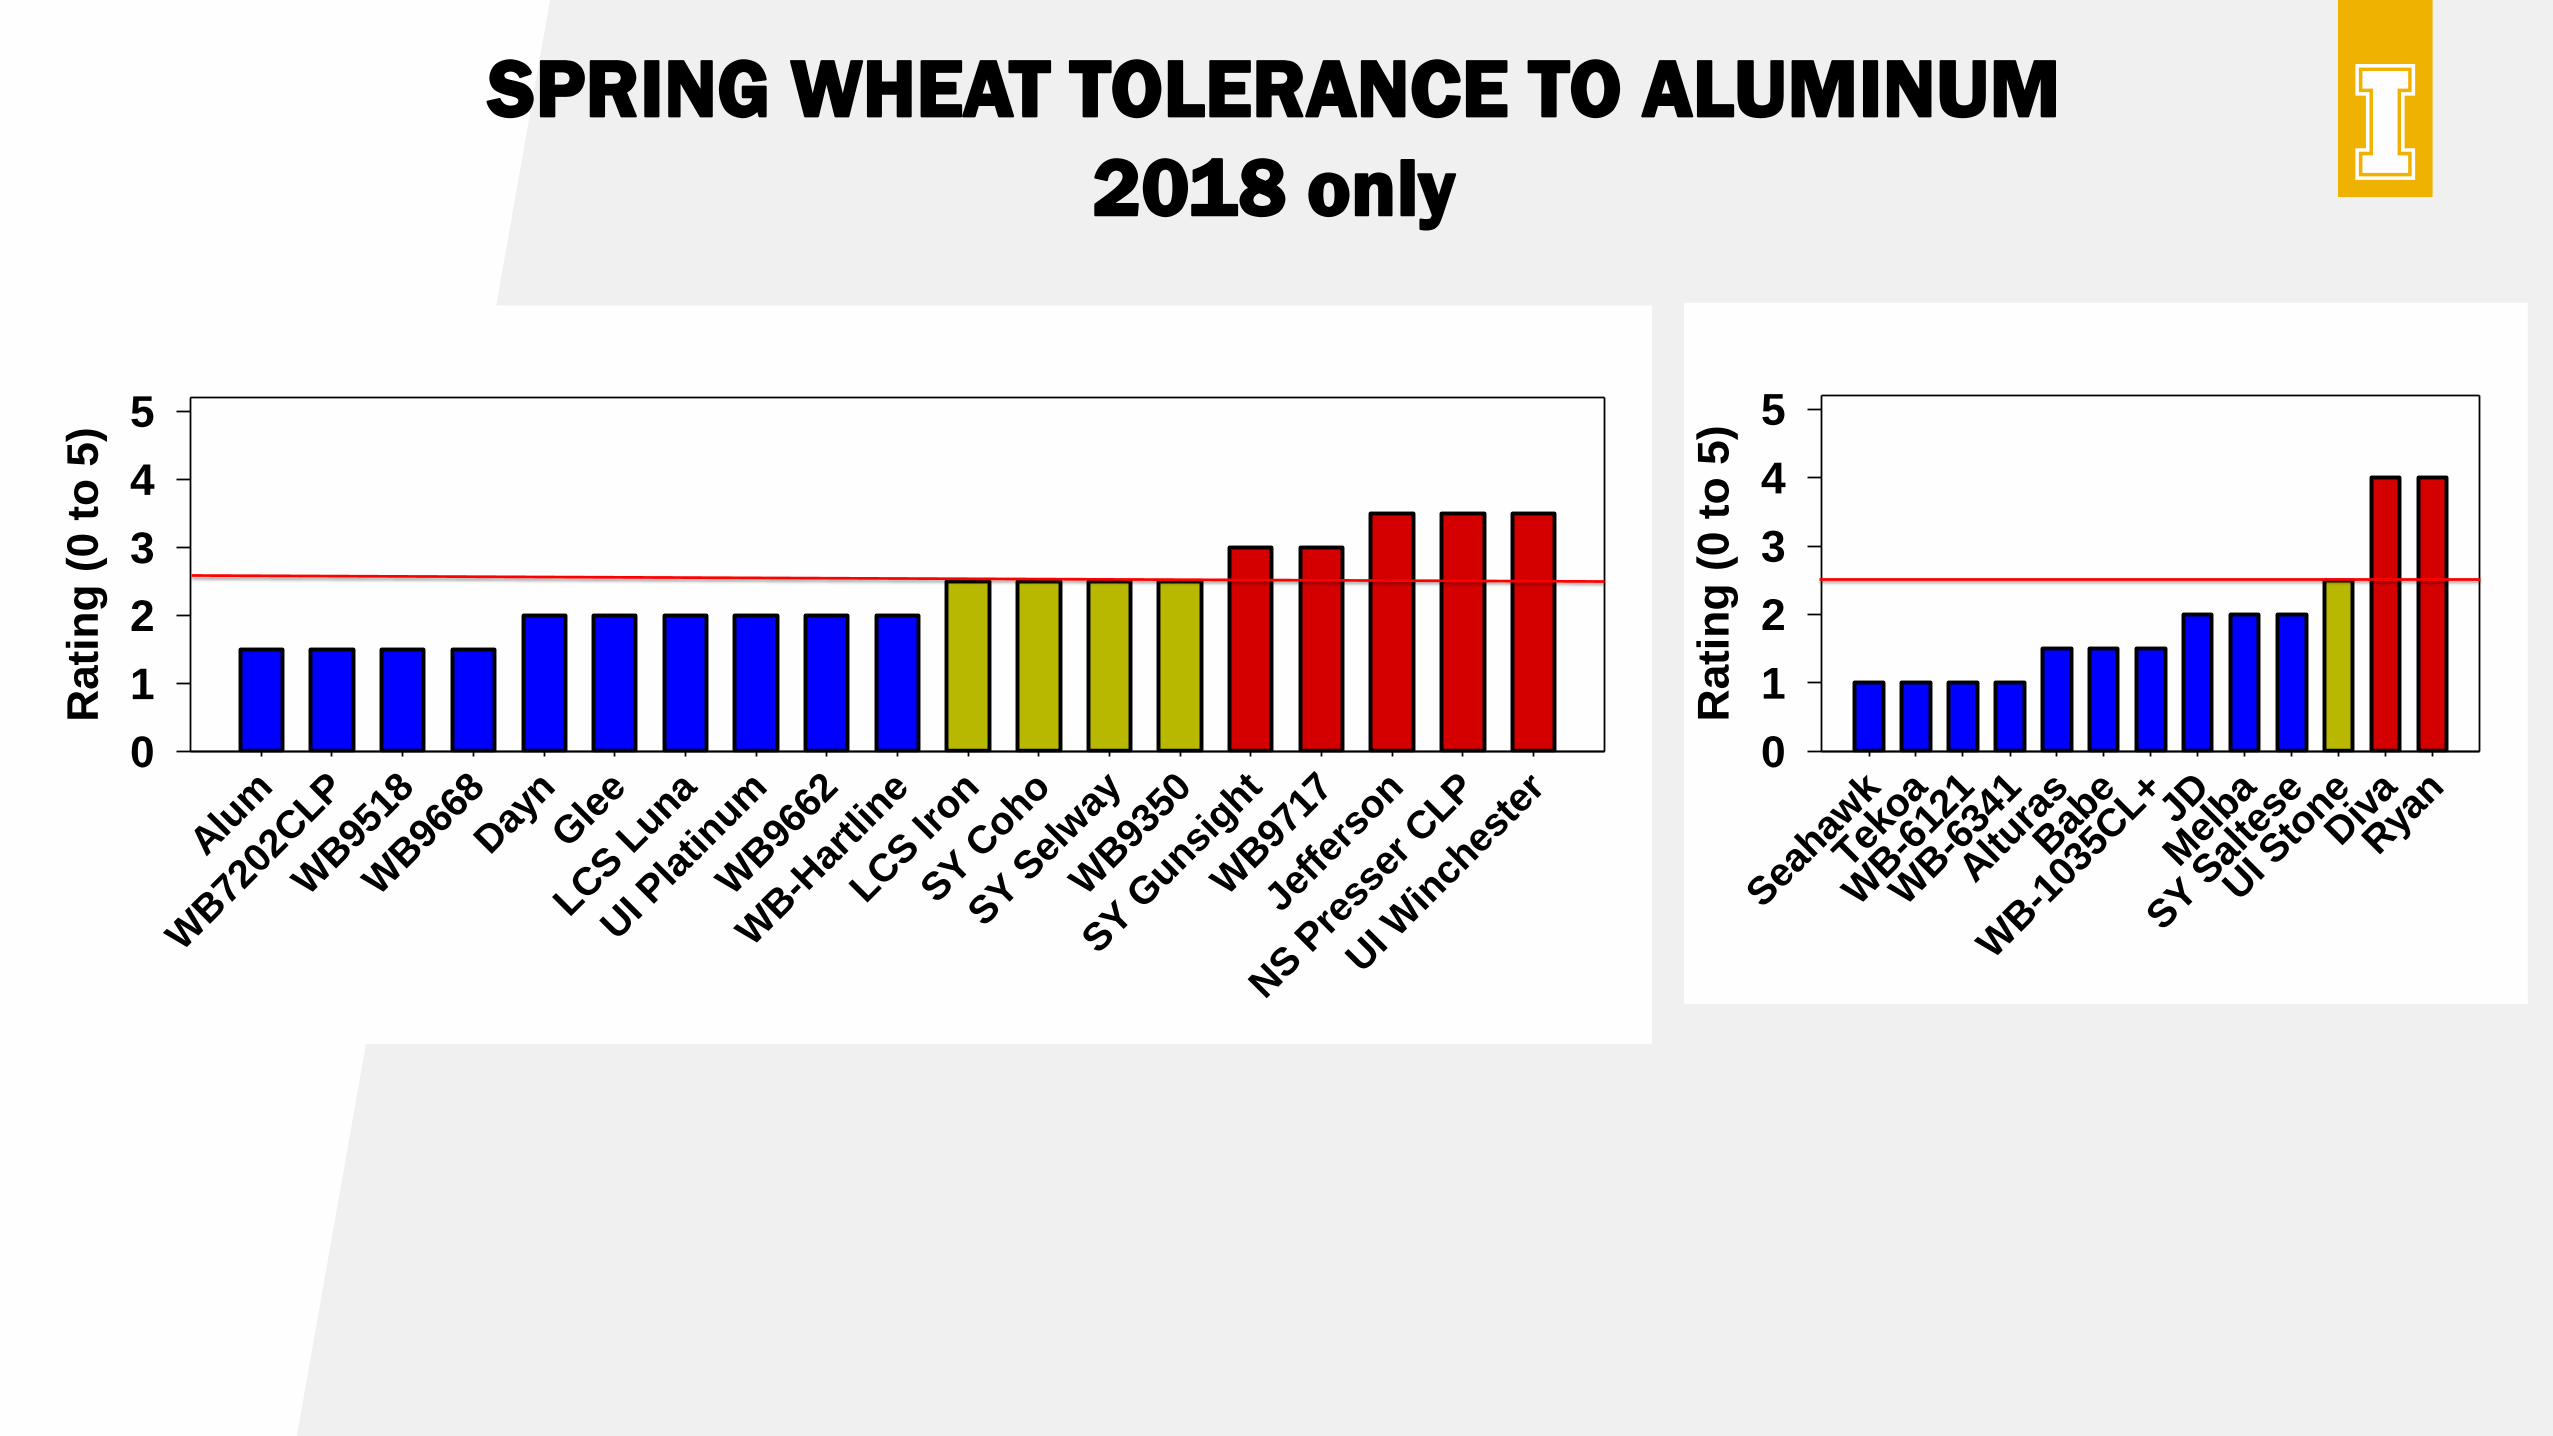
SPRING WHEAT TOLERANCE TO ALUMINUM
2018 only
Alu
m
WB72
02CLP
WB95
18
WB96
68
Day
nGle
e
LCS L
una
UI P
latin
um
WB96
62
WB-H
artli
ne
LCS Ir
on
SY C
oho
SY S
elw
ay
WB93
50
SY G
unsight
WB97
17
Jeffe
rson
NS P
ress
er C
LP
UI W
inch
este
r
Rati
ng
(0 t
o 5
)
0
1
2
3
4
5
Sea
hawk
Tekoa
WB-6
121
WB-6
341
Altu
ras
Bab
e
WB-1
035C
L+JD
Mel
ba
SY S
alte
se
UI S
toneDiv
a
Rya
n
Rati
ng
(0 t
o 5
)
0
1
2
3
4
5
MANAGEMENT OF SOIL ACIDITY – LIMING
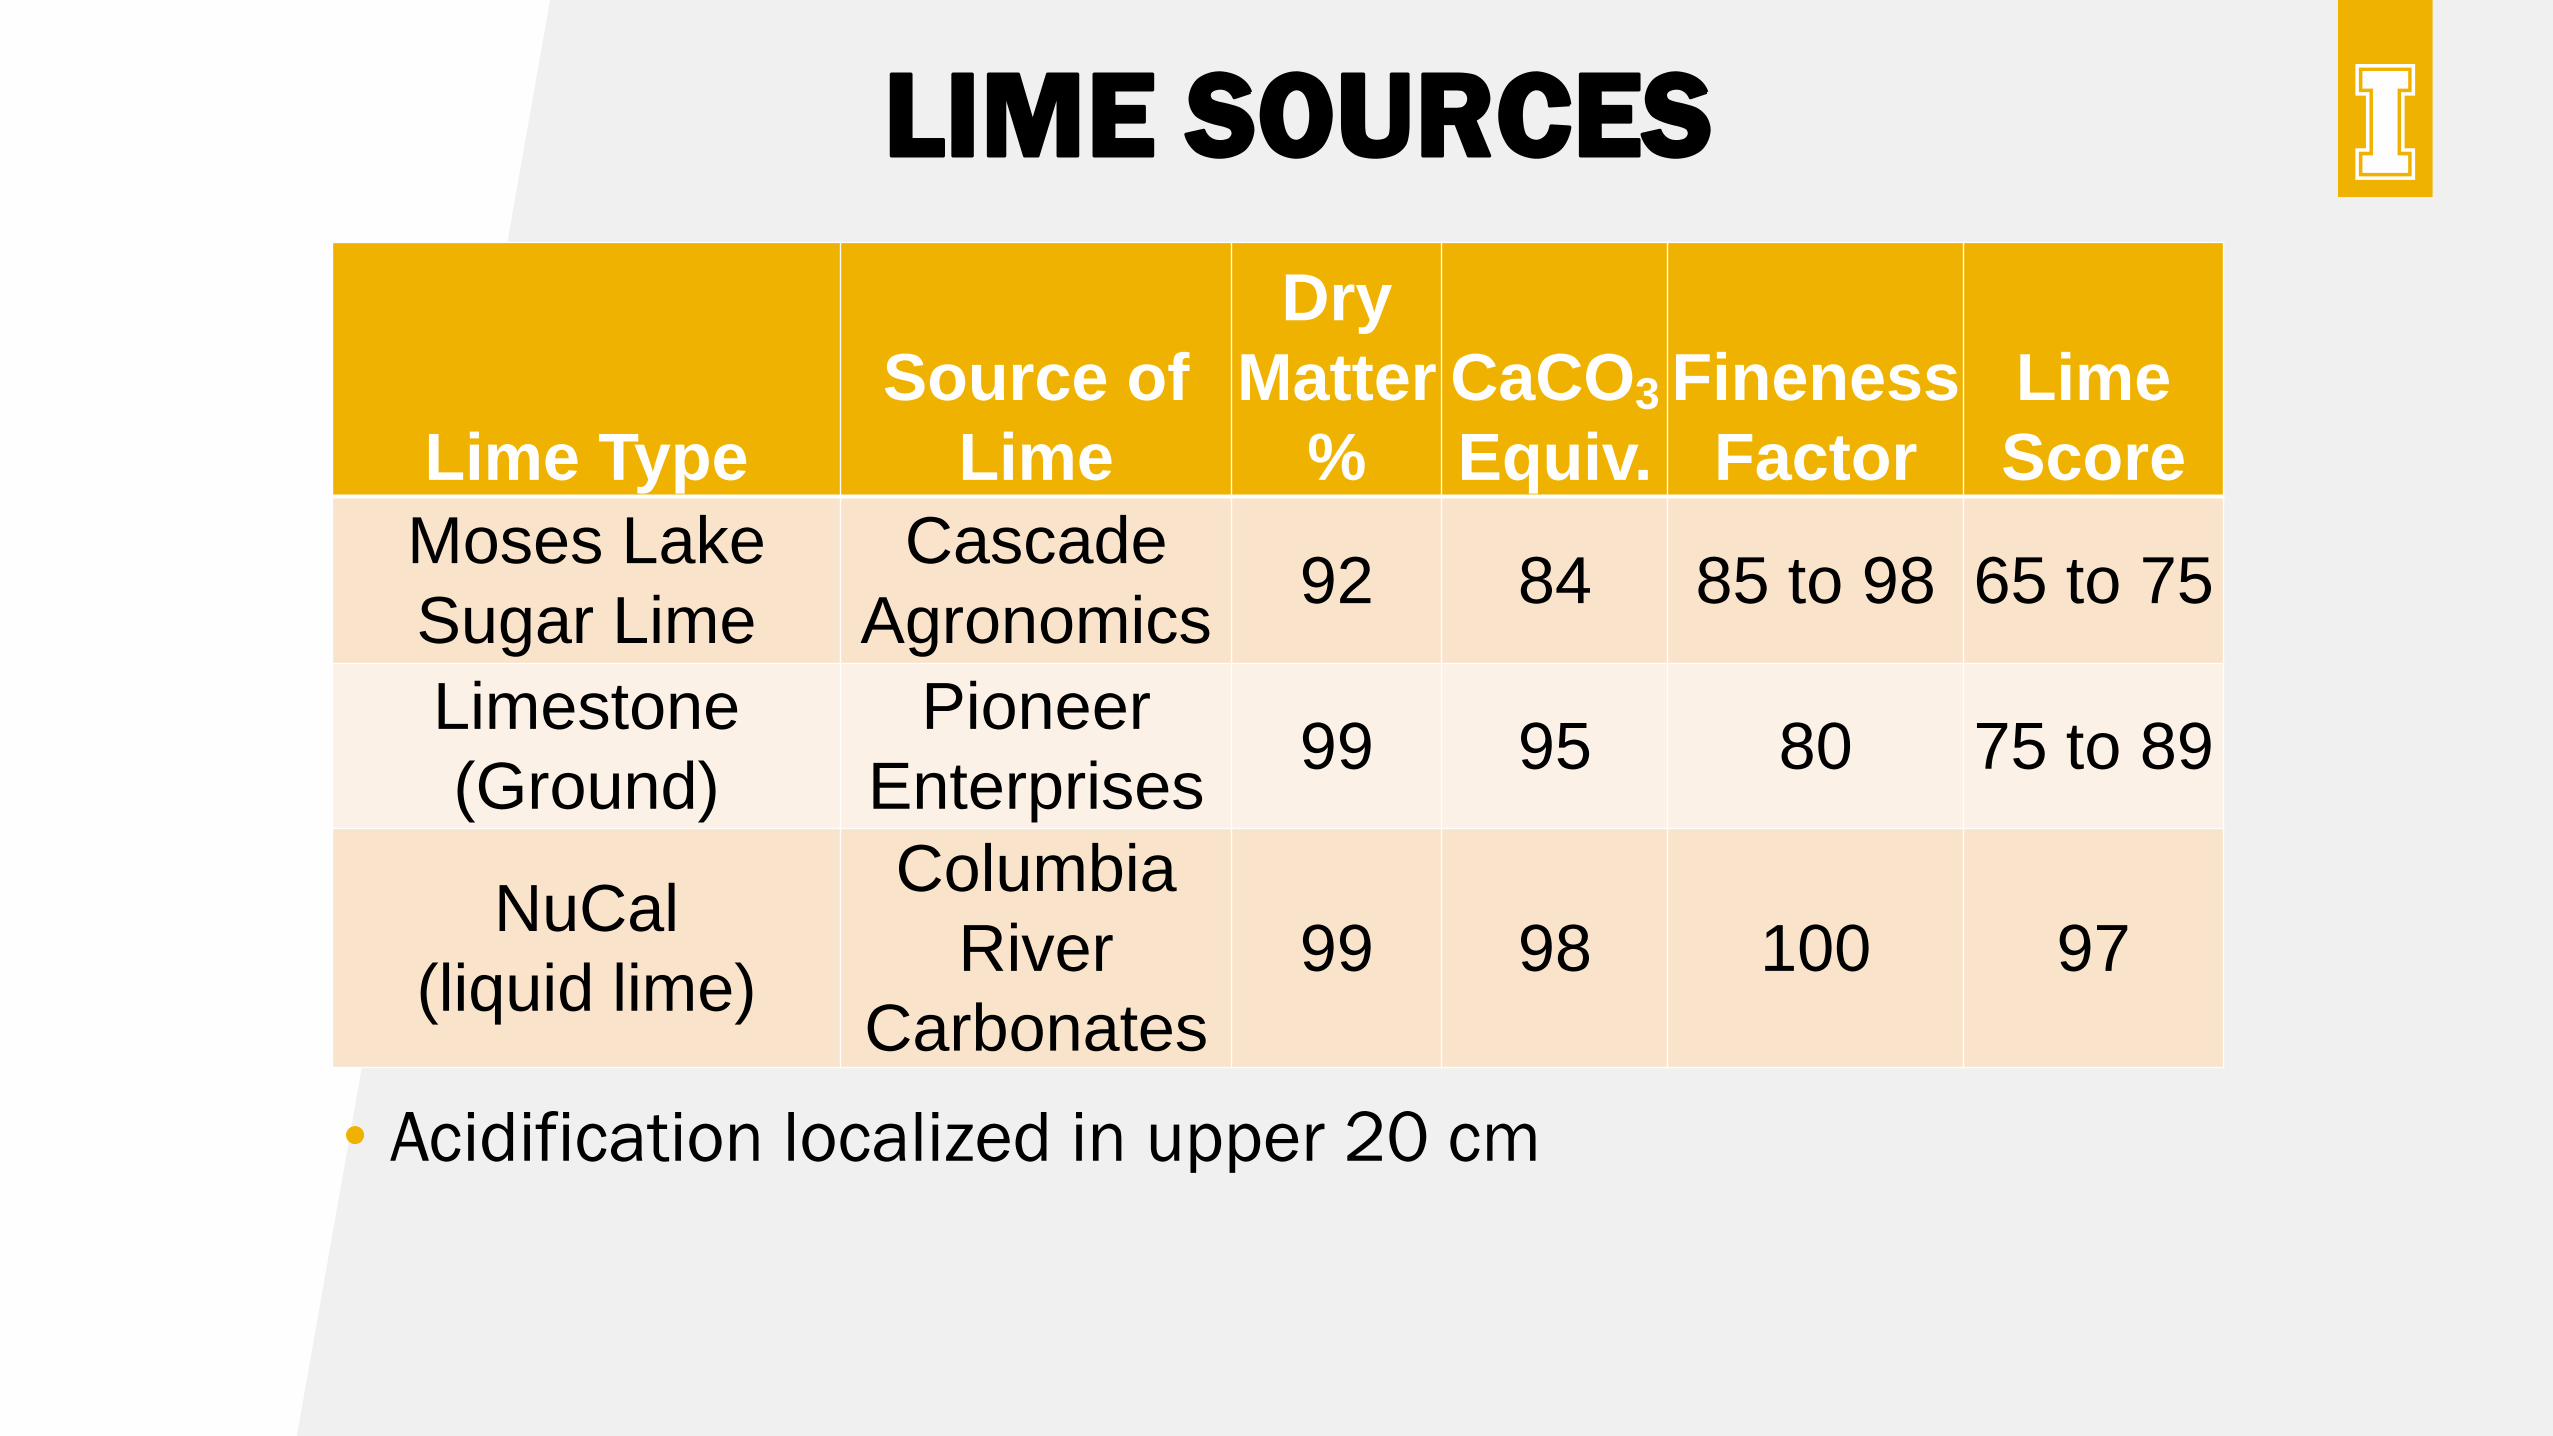
Lime Type
Source of
Lime
Dry
Matter
%
CaCO3
Equiv.
Fineness
Factor
Lime
Score
Moses Lake
Sugar Lime
Cascade
Agronomics92 84 85 to 98 65 to 75
Limestone
(Ground)
Pioneer
Enterprises99 95 80 75 to 89
NuCal
(liquid lime)
Columbia
River
Carbonates
99 98 100 97
LIME SOURCES
• Acidification localized in upper 20 cm
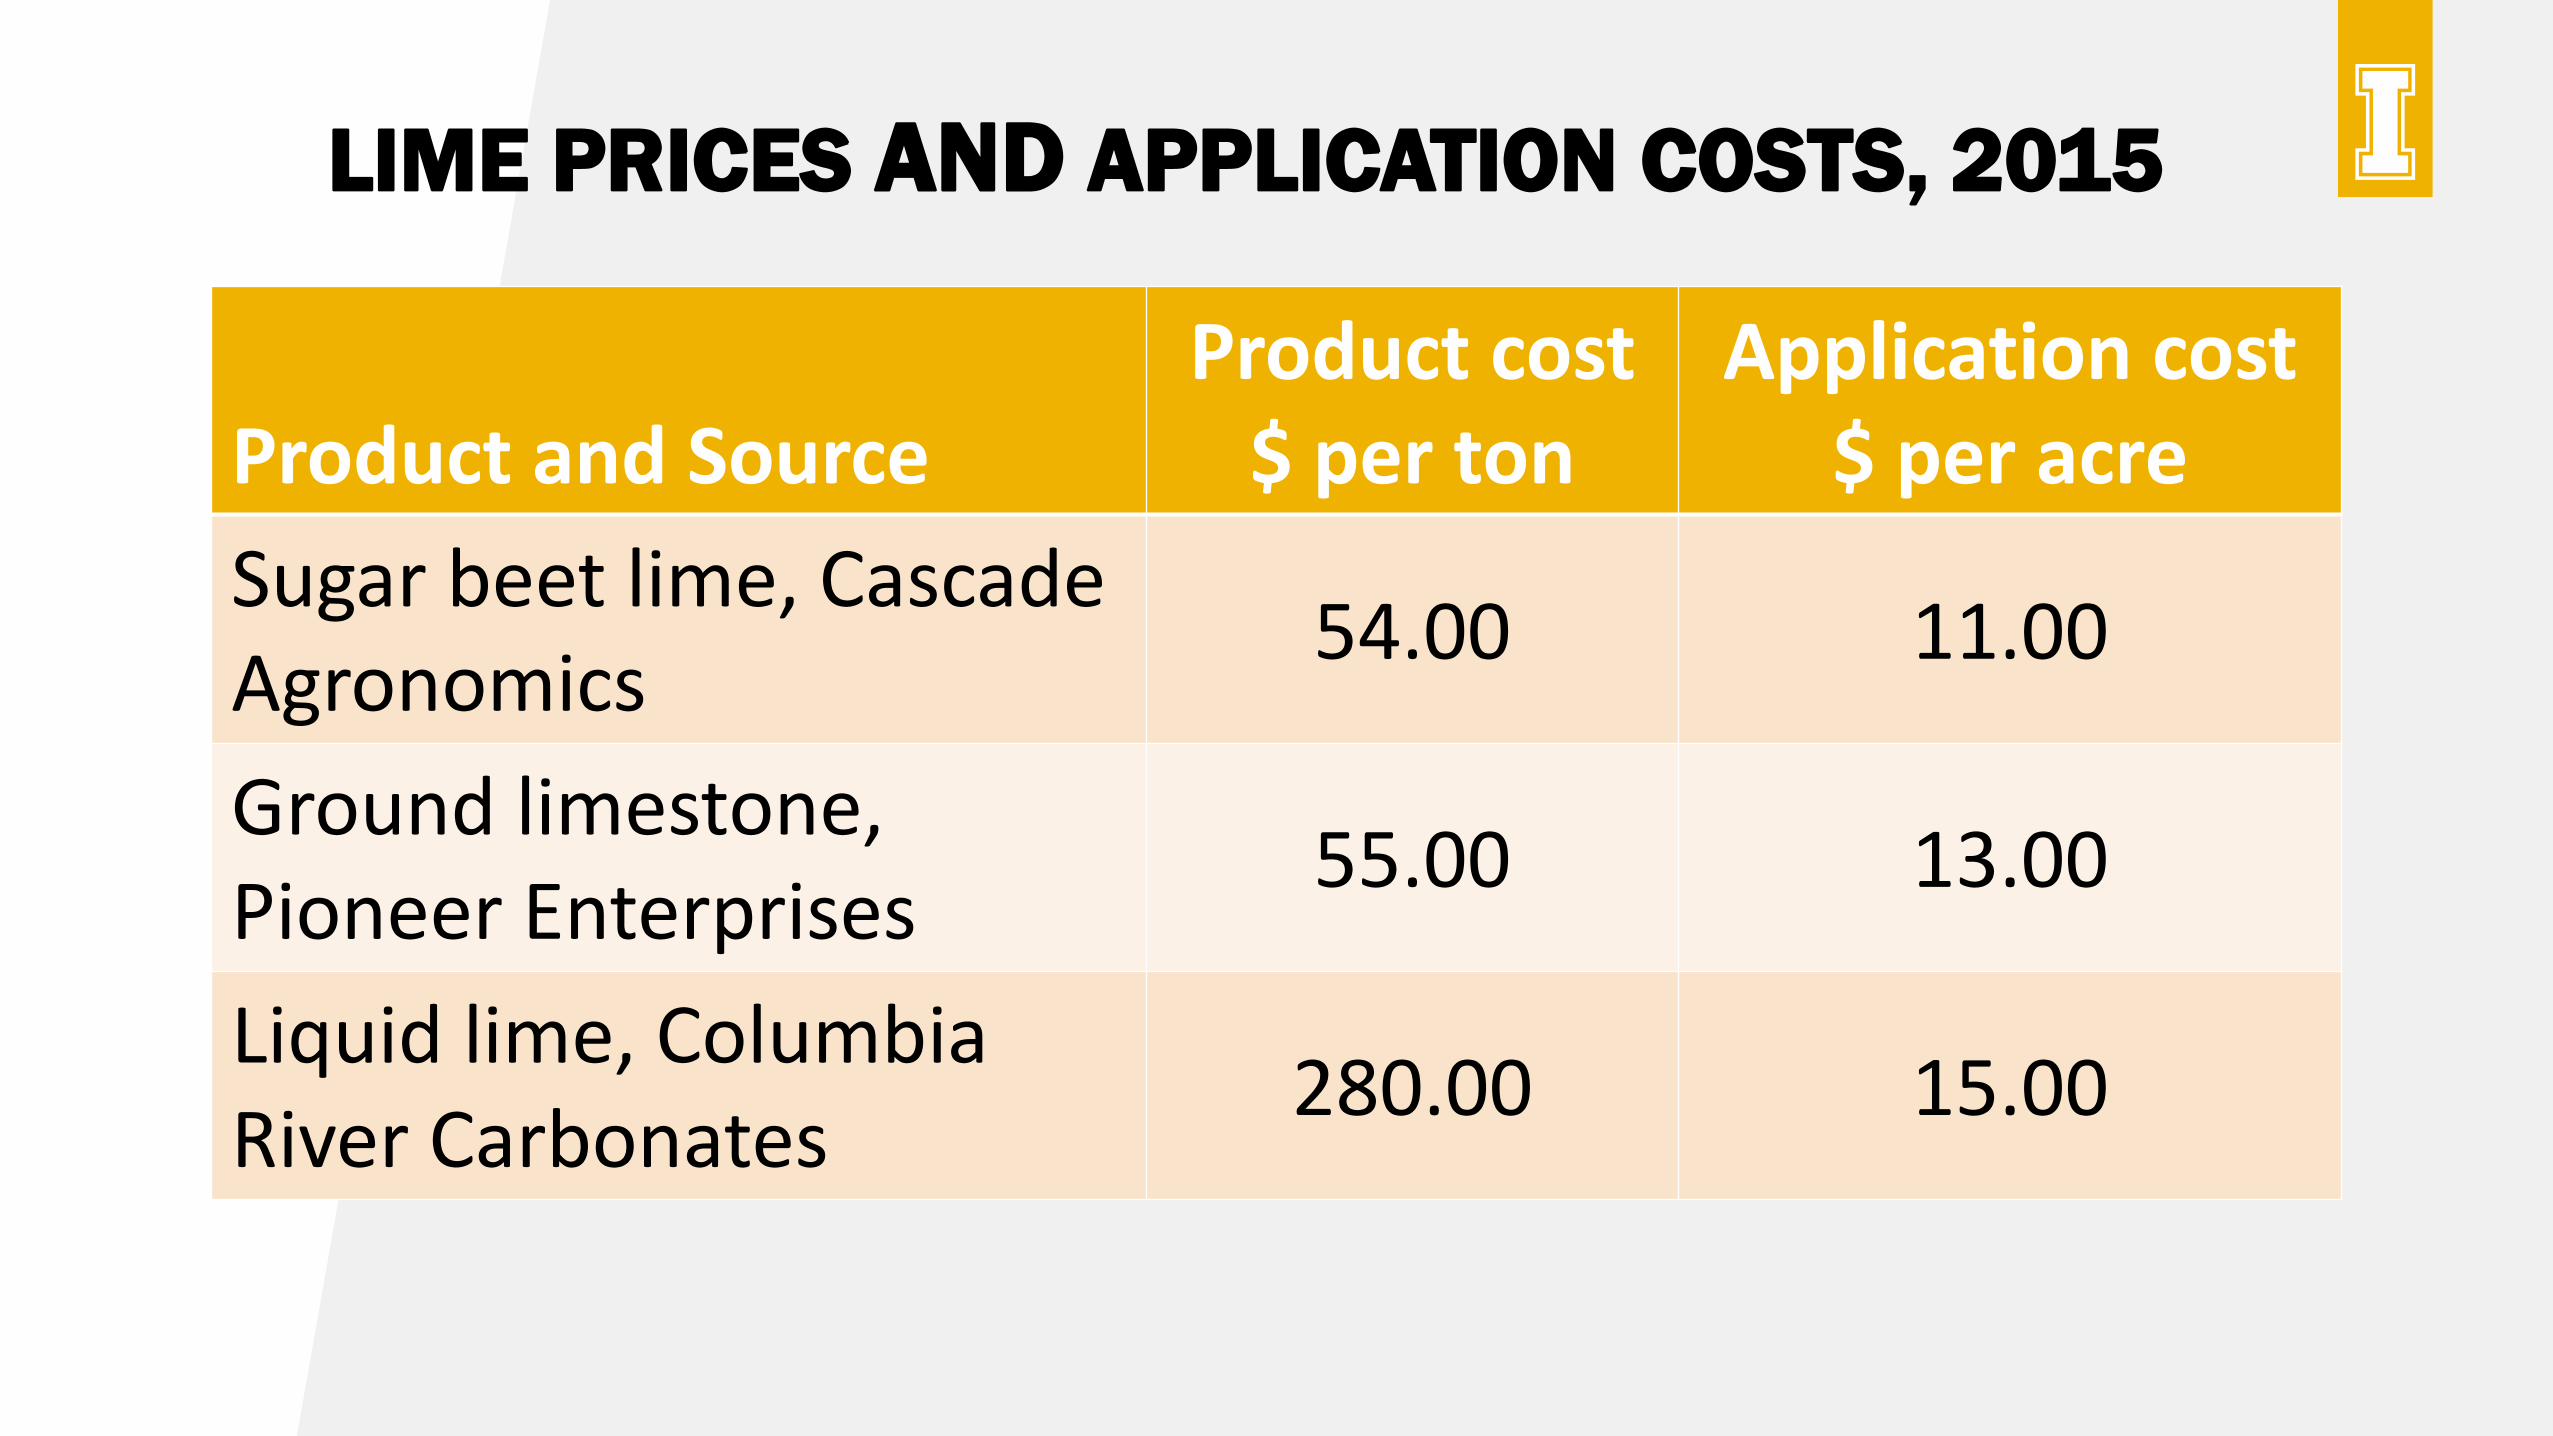
LIME PRICES AND APPLICATION COSTS, 2015
Product and SourceProduct cost
$ per tonApplication cost
$ per acre
Sugar beet lime, CascadeAgronomics
54.00 11.00
Ground limestone, Pioneer Enterprises
55.00 13.00
Liquid lime, Columbia River Carbonates
280.00 15.00
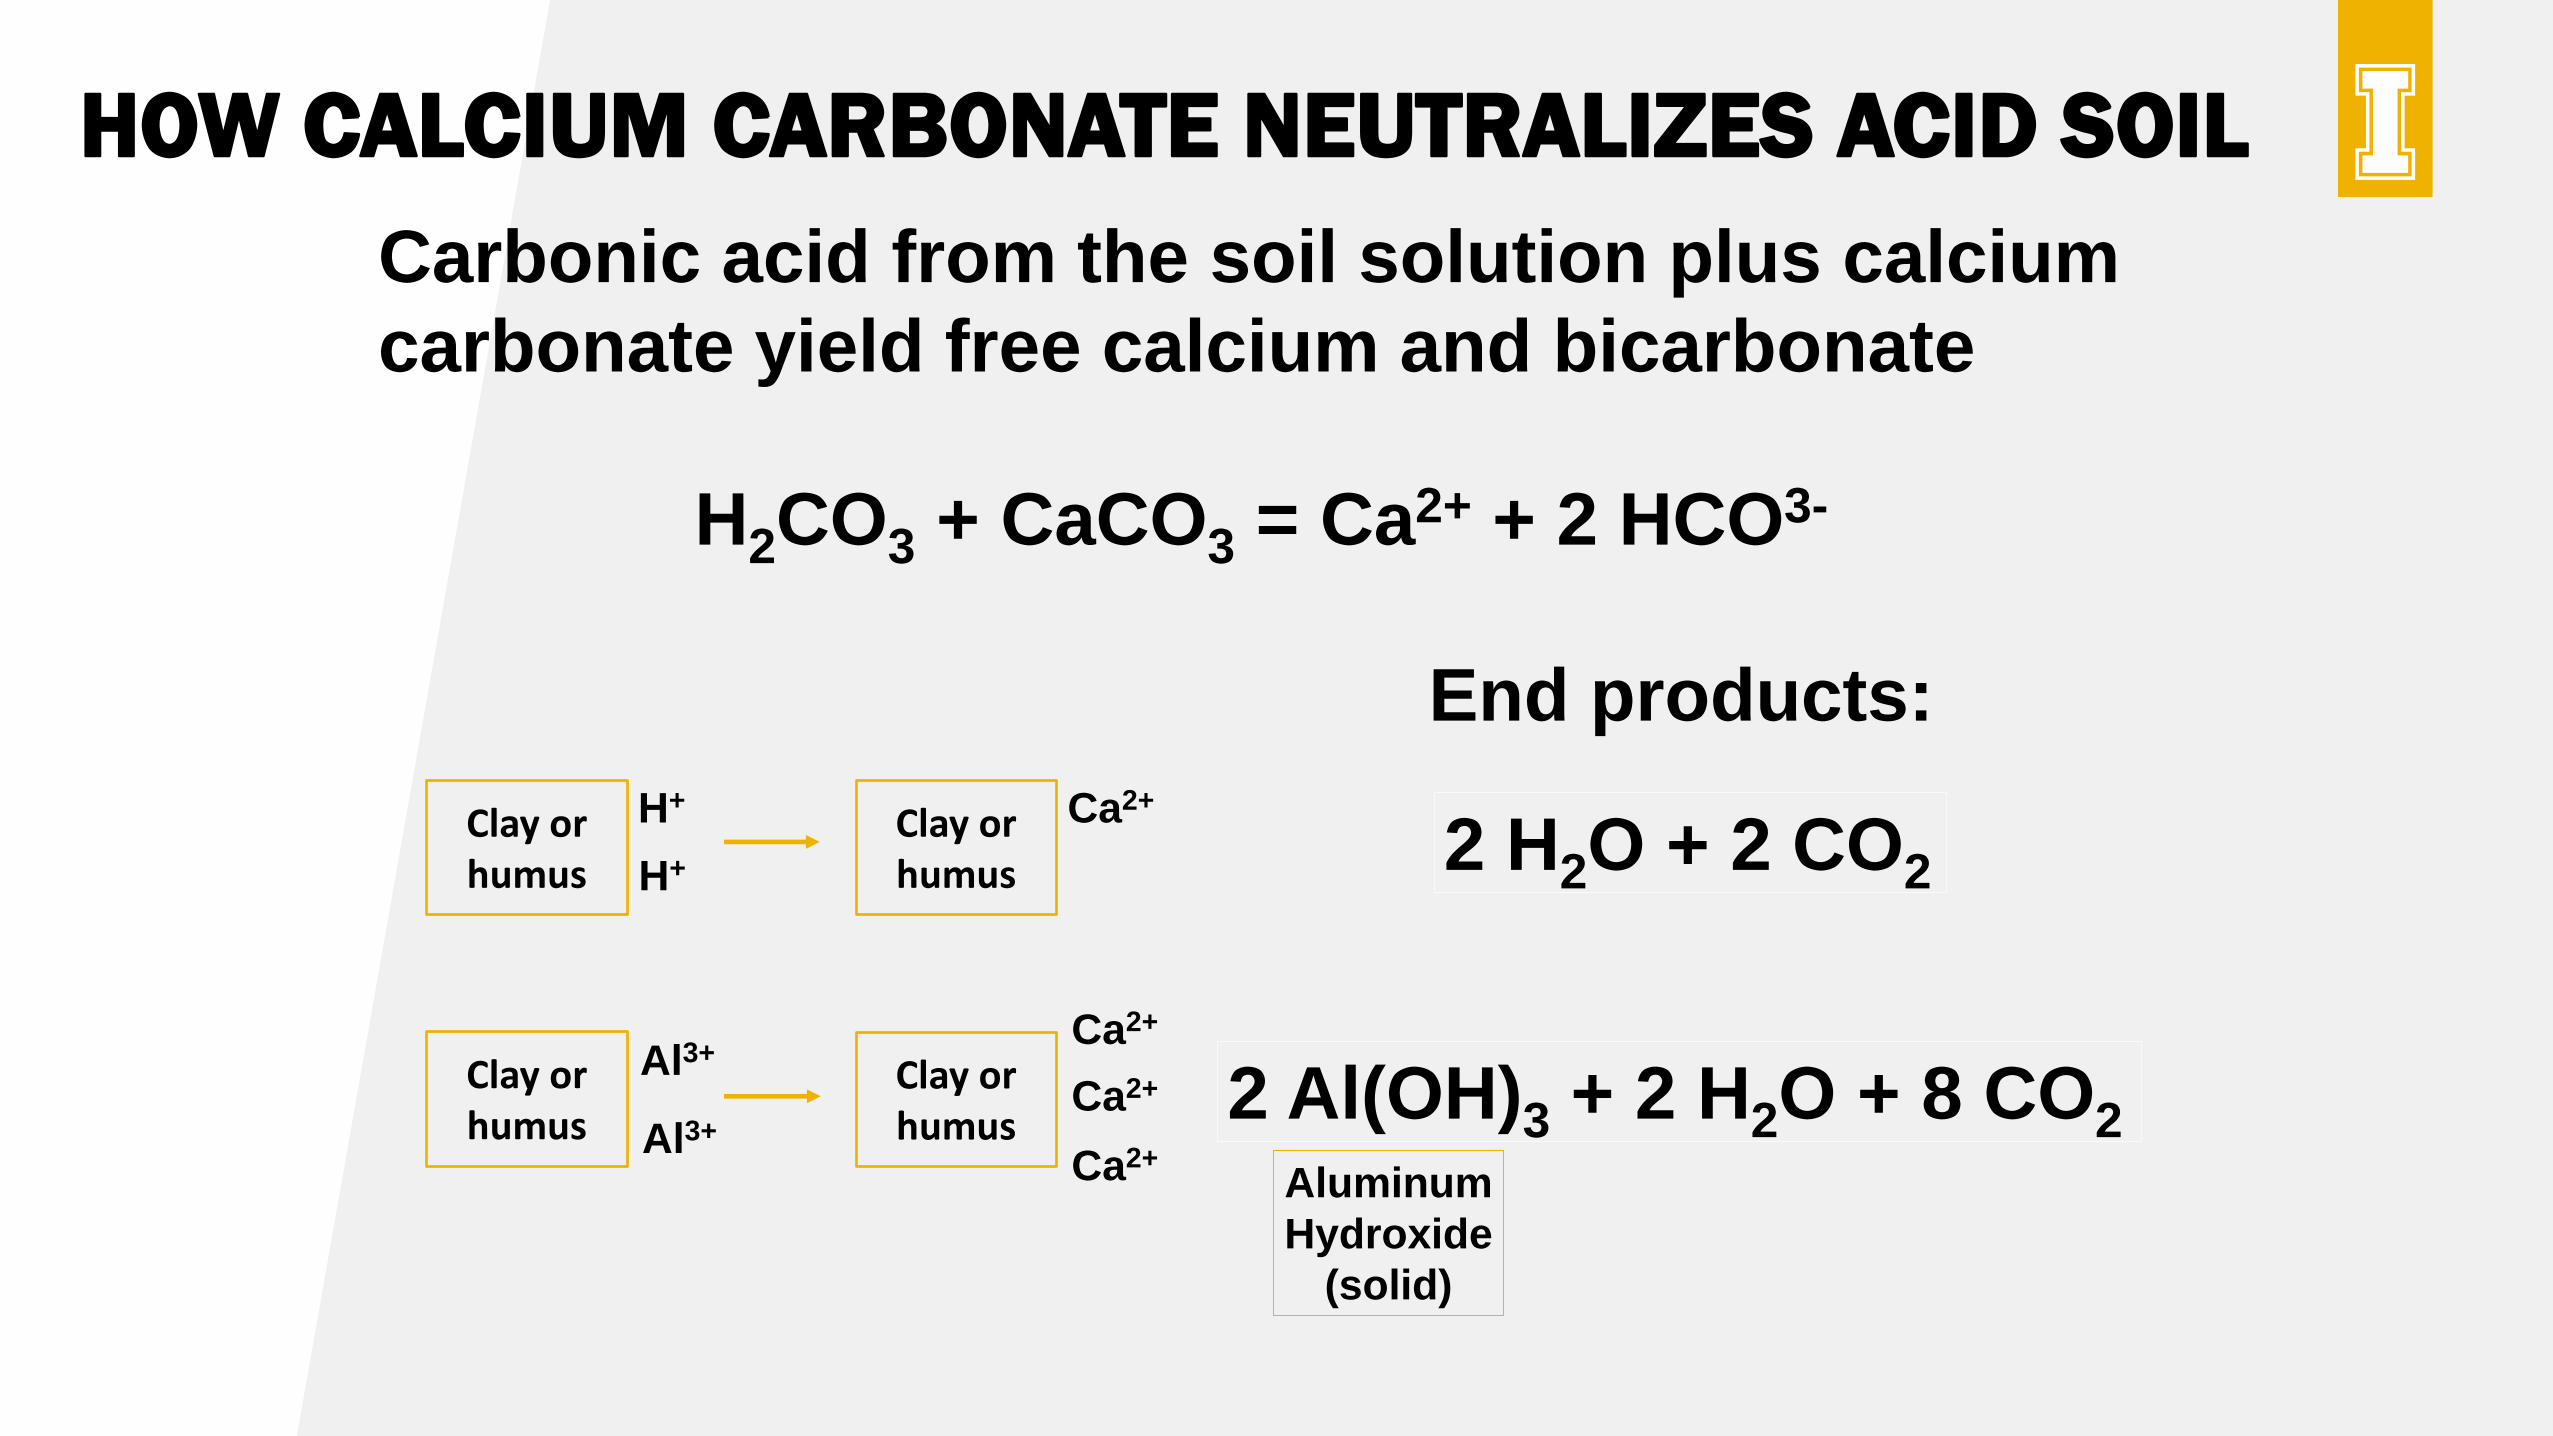
Carbonic acid from the soil solution plus calcium
carbonate yield free calcium and bicarbonate
HOW CALCIUM CARBONATE NEUTRALIZES ACID SOIL
End products:
H2CO3 + CaCO3 = Ca2+ + 2 HCO3-
2 H2O + 2 CO2Clay or humus
Clay or humus
H+
H+
Al3+
Al3+
Clay or humus
Ca2+
Clay or humus
Ca2+
Ca2+
Ca2+
2 Al(OH)3 + 2 H2O + 8 CO2
Aluminum
Hydroxide
(solid)
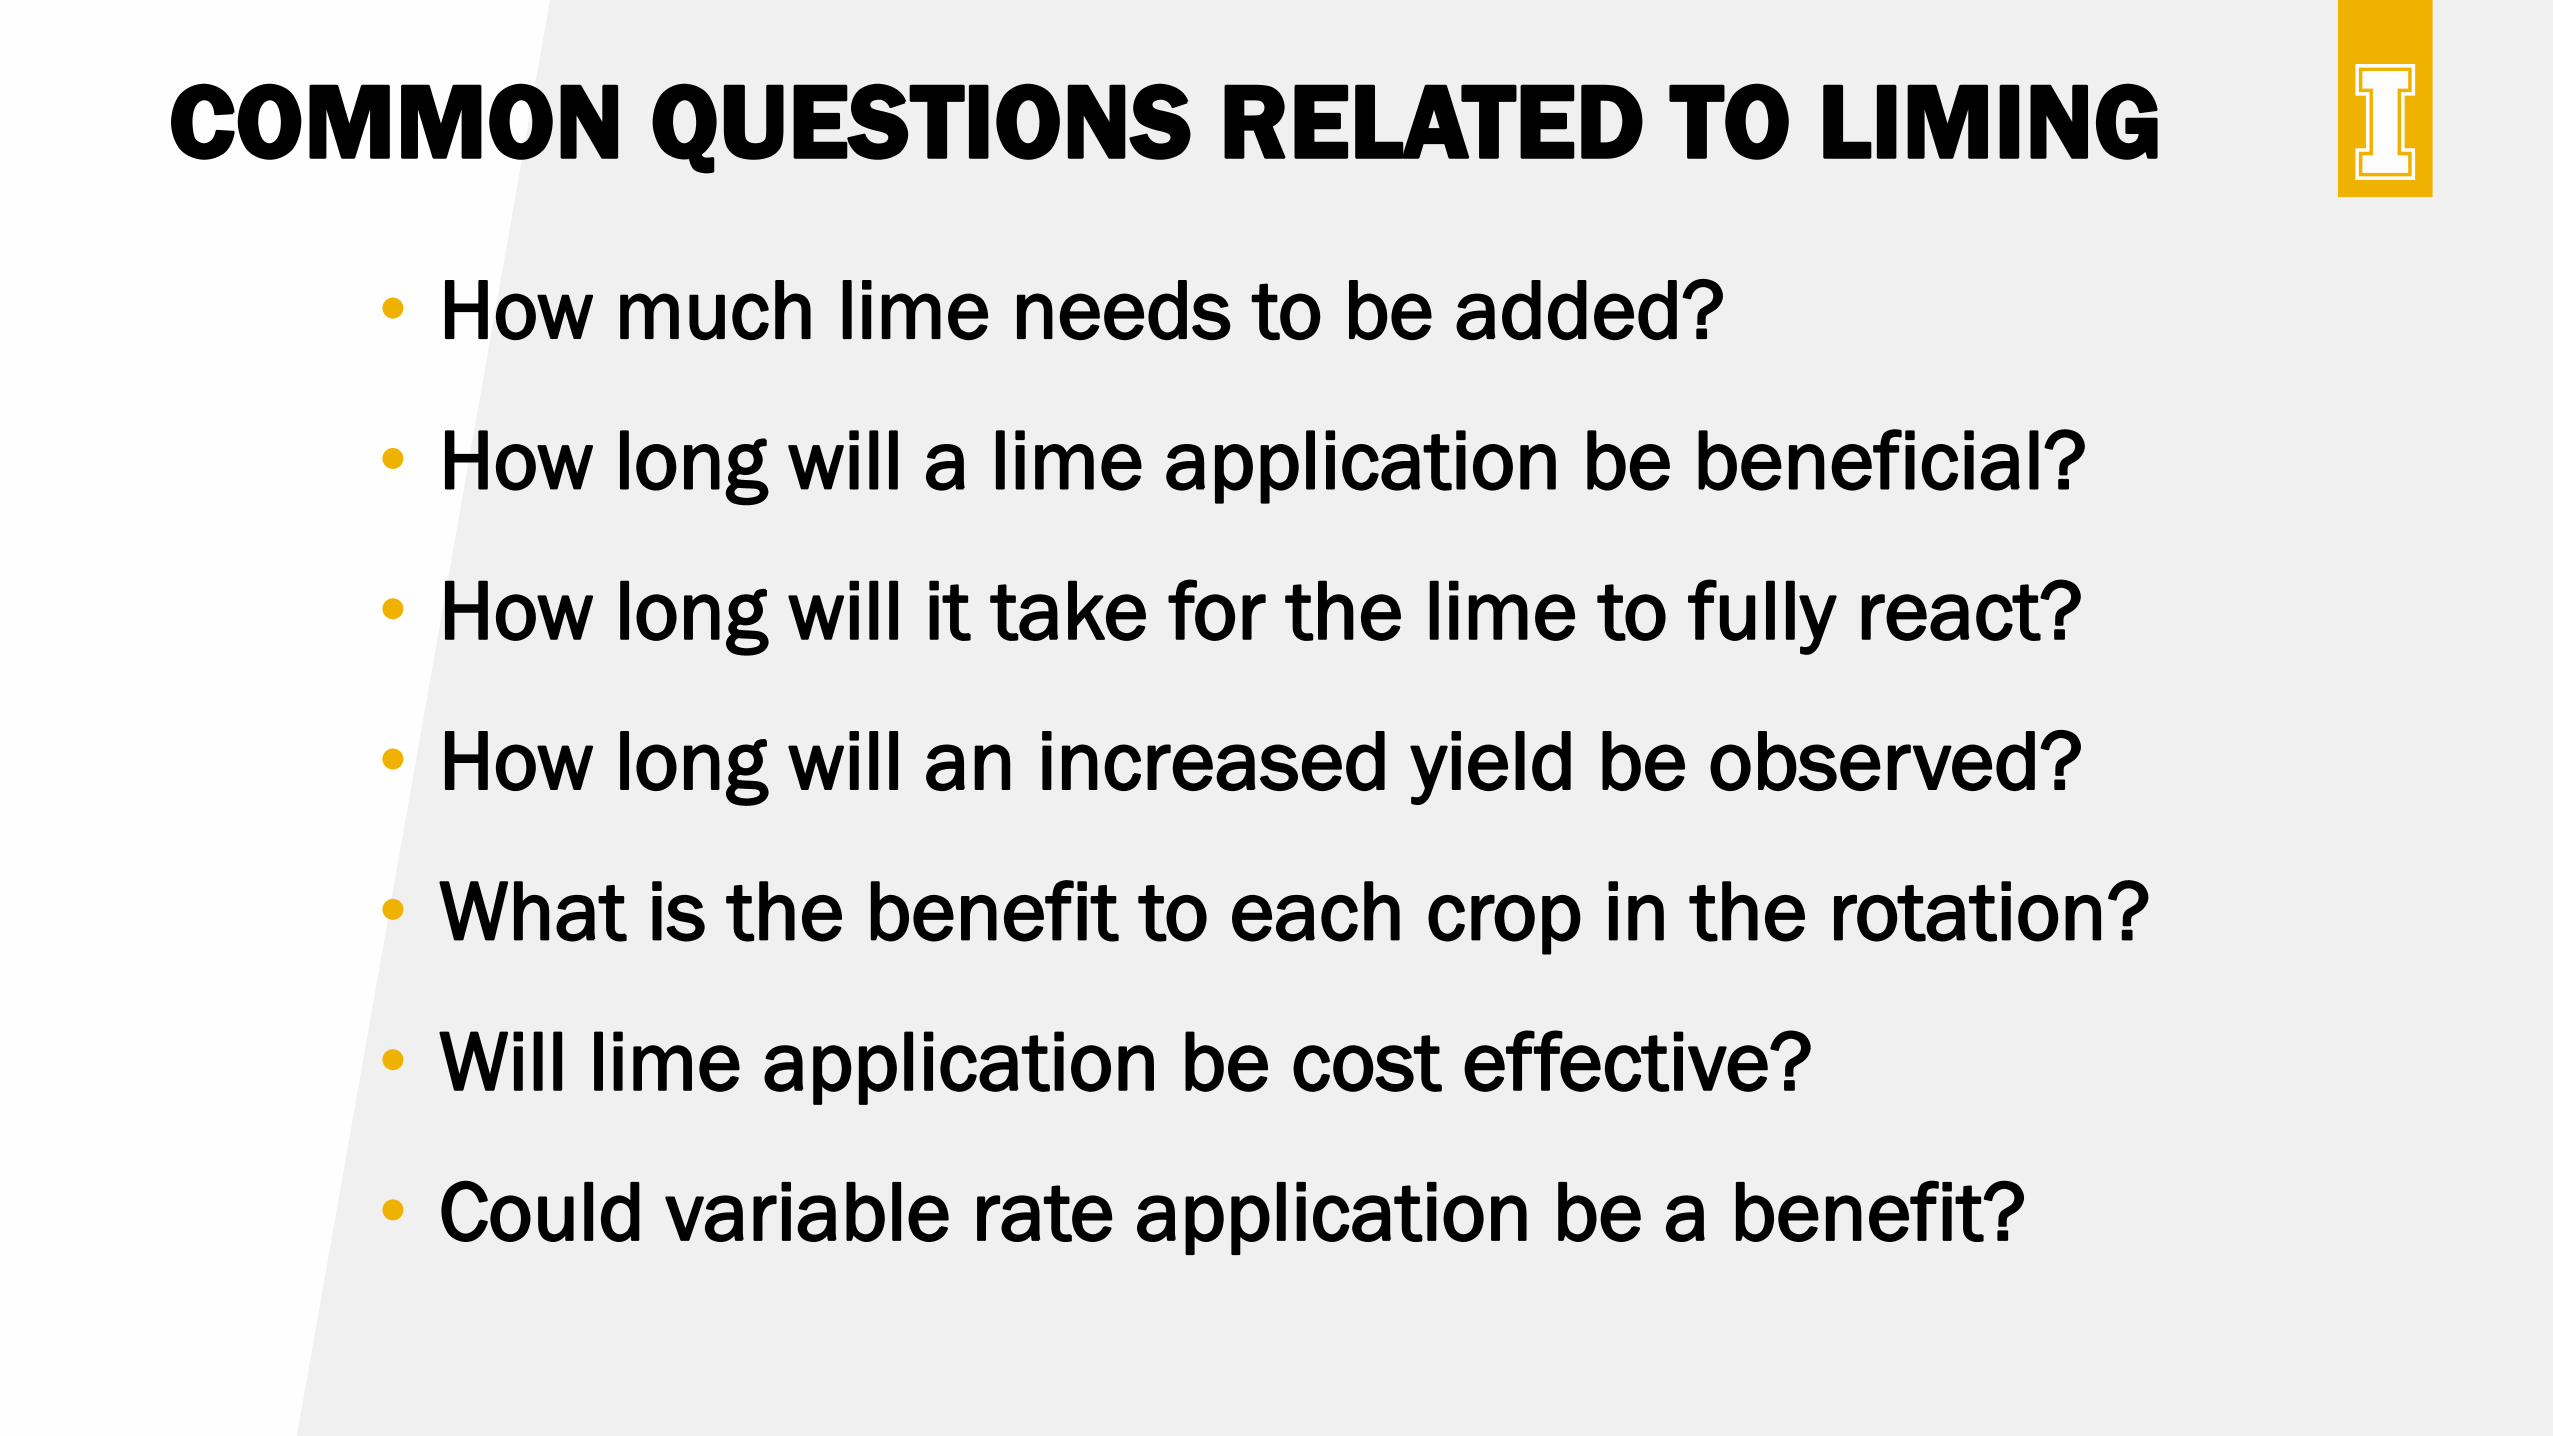
COMMON QUESTIONS RELATED TO LIMING
• How much lime needs to be added?
• How long will a lime application be beneficial?
• How long will it take for the lime to fully react?
• How long will an increased yield be observed?
• What is the benefit to each crop in the rotation?
• Will lime application be cost effective?
• Could variable rate application be a benefit?
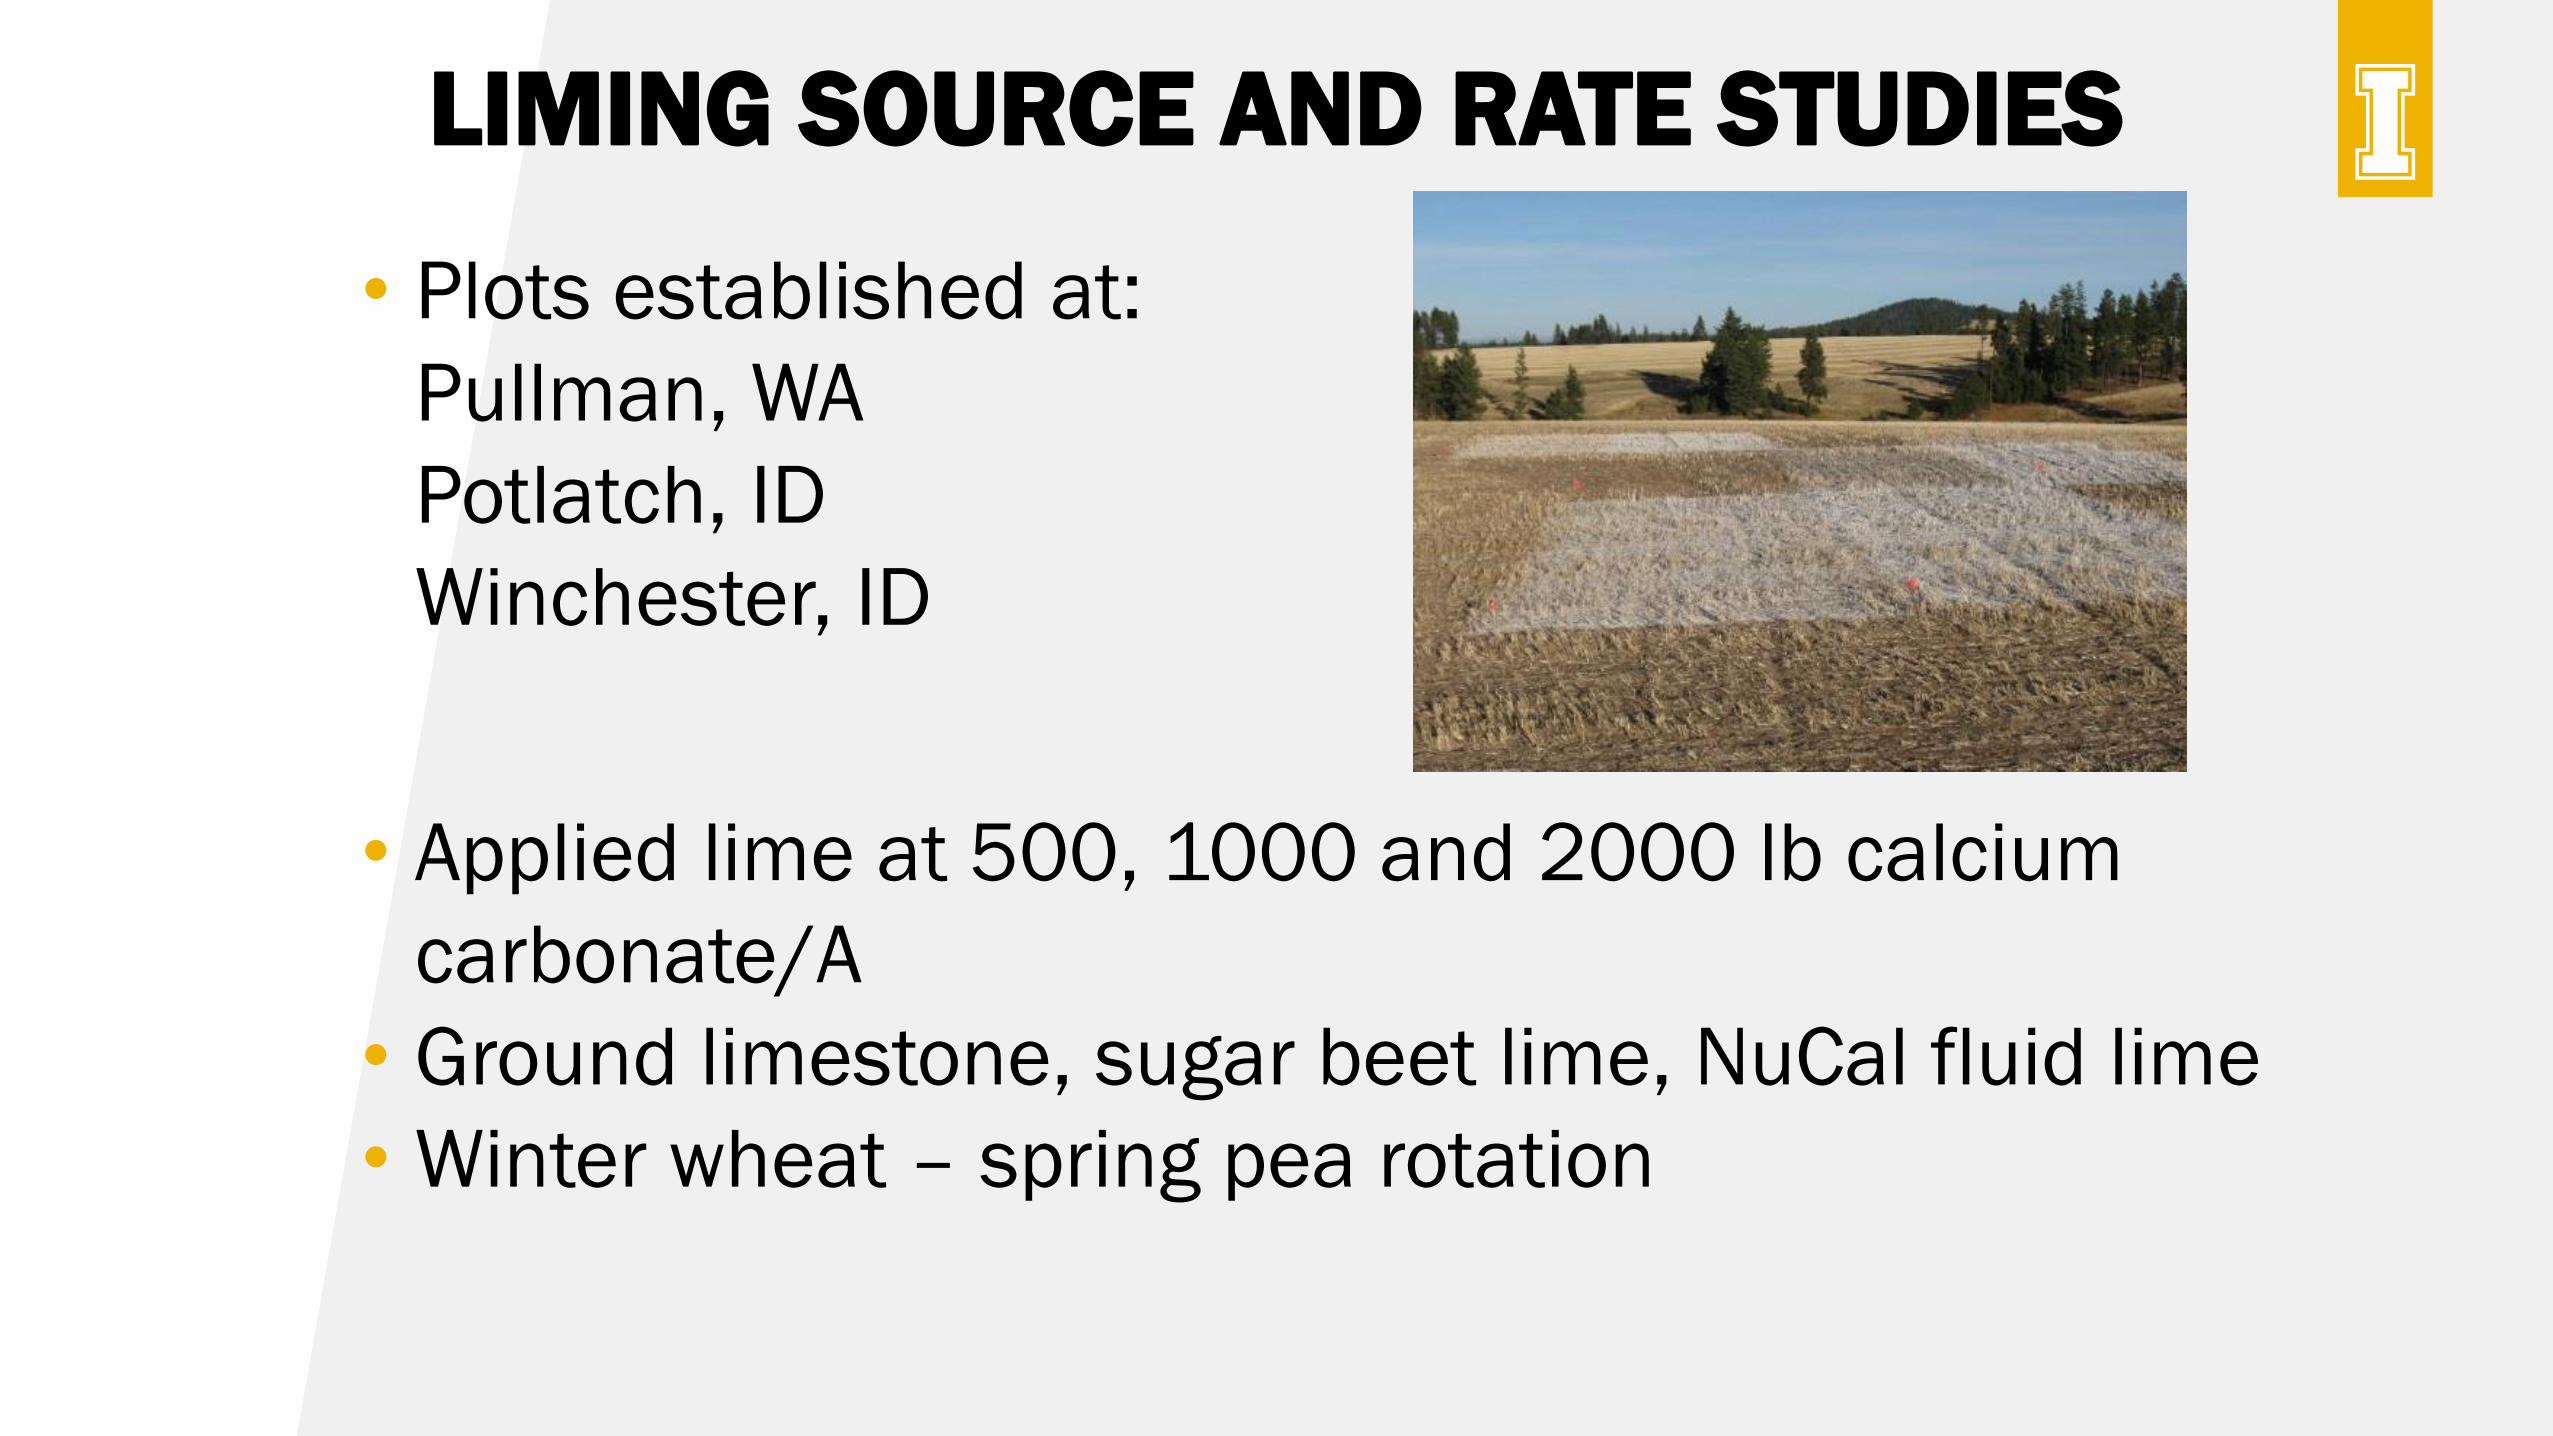
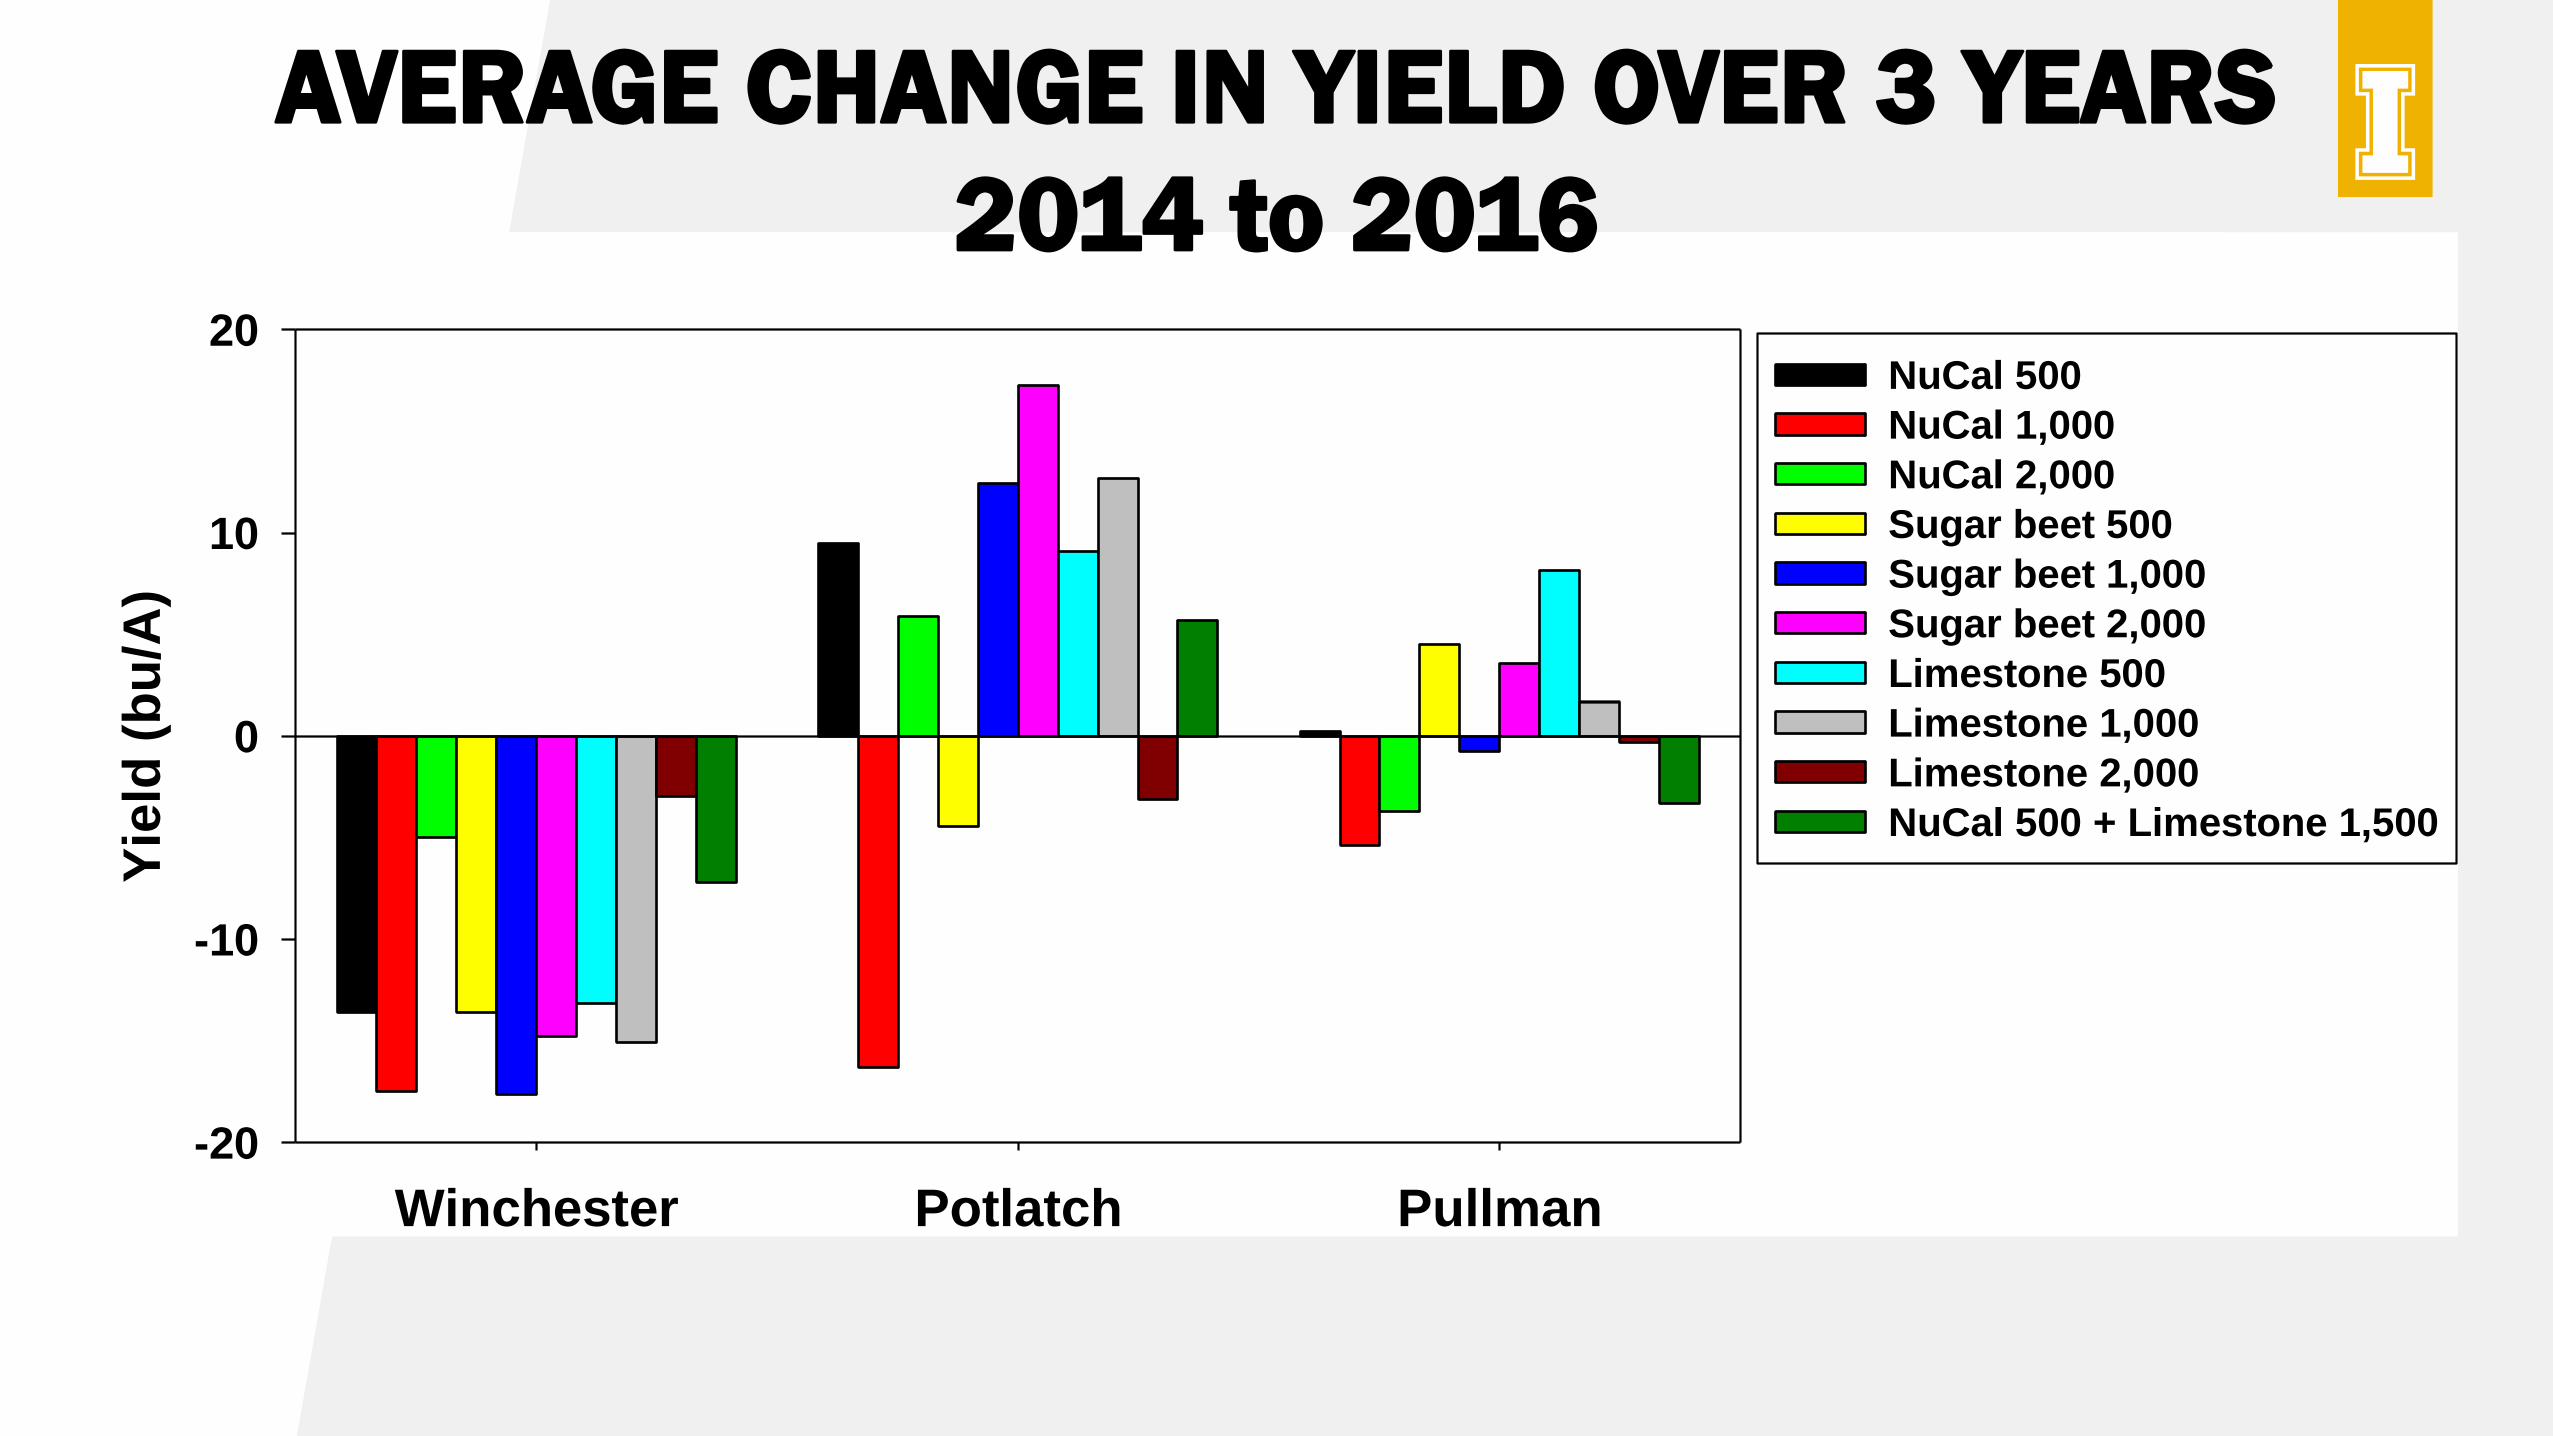
LIMING SOURCE AND RATE STUDIES
• Plots established at:
Pullman, WA
Potlatch, ID
Winchester, ID
• Applied lime at 500, 1000 and 2000 lb calcium
carbonate/A
• Ground limestone, sugar beet lime, NuCal fluid lime
• Winter wheat – spring pea rotation
Winchester Potlatch Pullman
Yie
ld (
bu
/A)
-20
-10
0
10
20NuCal 500
NuCal 1,000
NuCal 2,000
Sugar beet 500
Sugar beet 1,000
Sugar beet 2,000
Limestone 500
Limestone 1,000
Limestone 2,000
NuCal 500 + Limestone 1,500
AVERAGE CHANGE IN YIELD OVER 3 YEARS
2014 to 2016
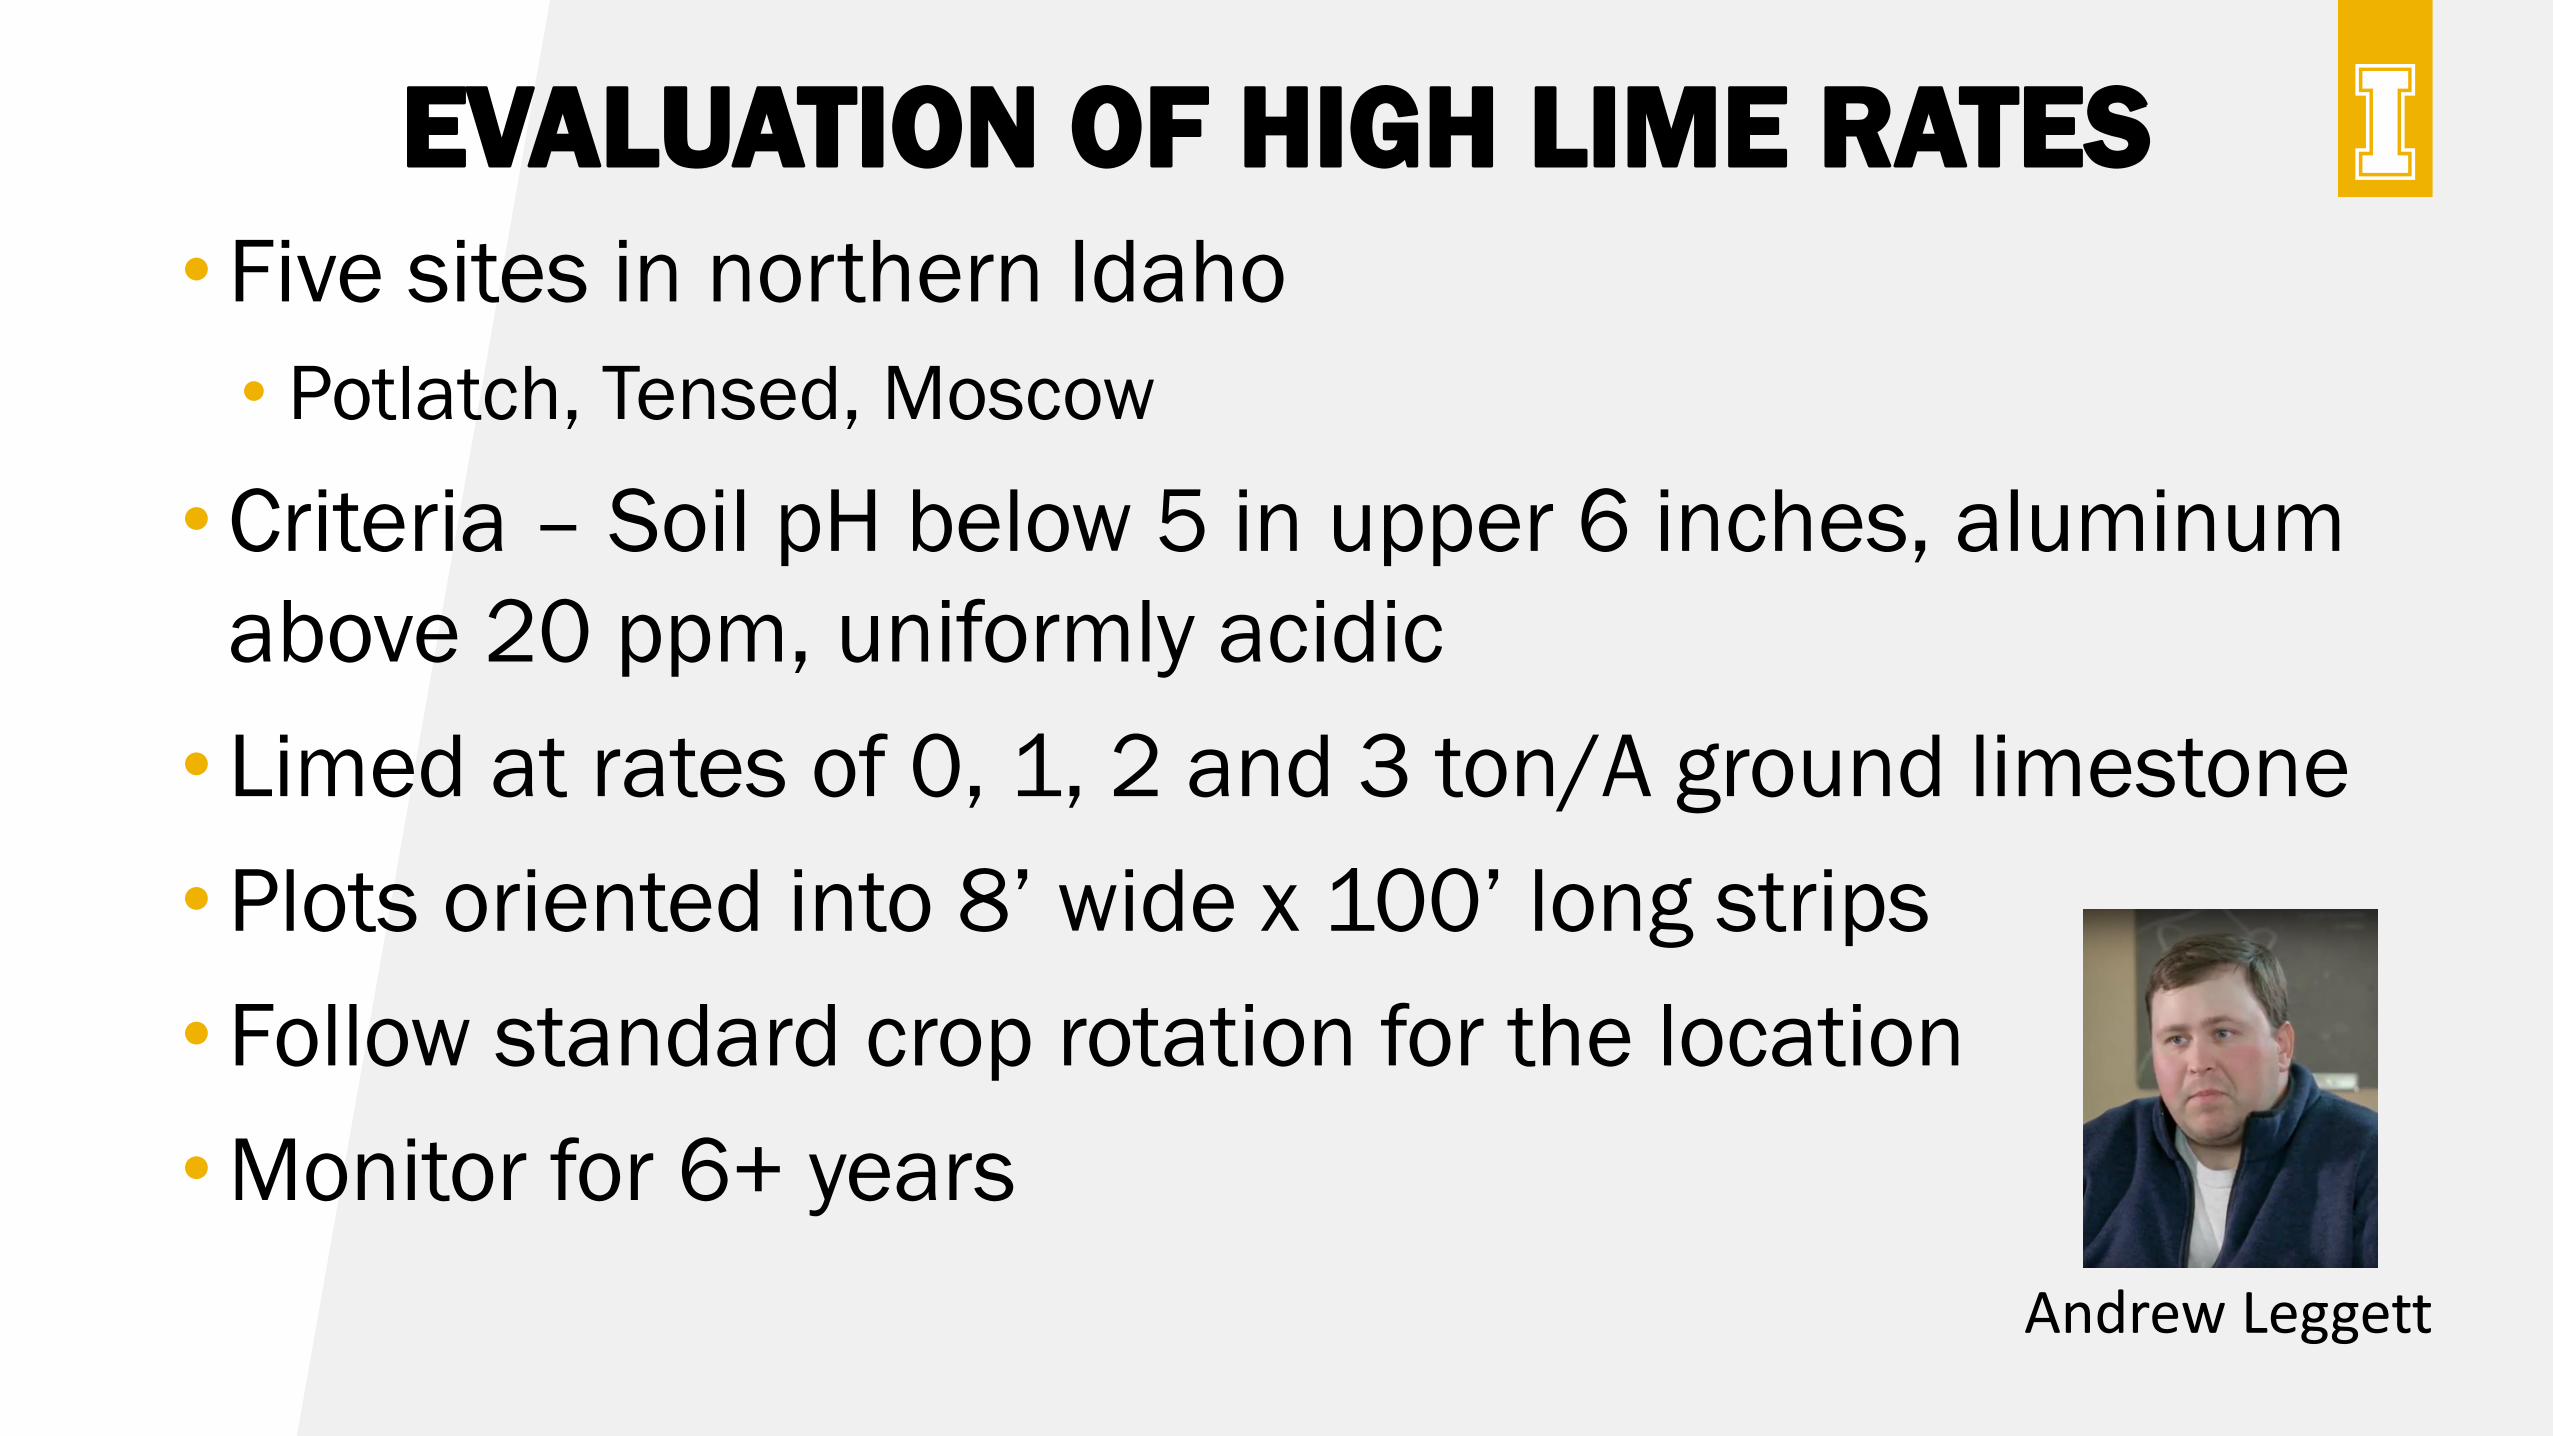
EVALUATION OF HIGH LIME RATES
• Five sites in northern Idaho
• Potlatch, Tensed, Moscow
•Criteria – Soil pH below 5 in upper 6 inches, aluminum
above 20 ppm, uniformly acidic
• Limed at rates of 0, 1, 2 and 3 ton/A ground limestone
• Plots oriented into 8’ wide x 100’ long strips
• Follow standard crop rotation for the location
•Monitor for 6+ years
Andrew Leggett
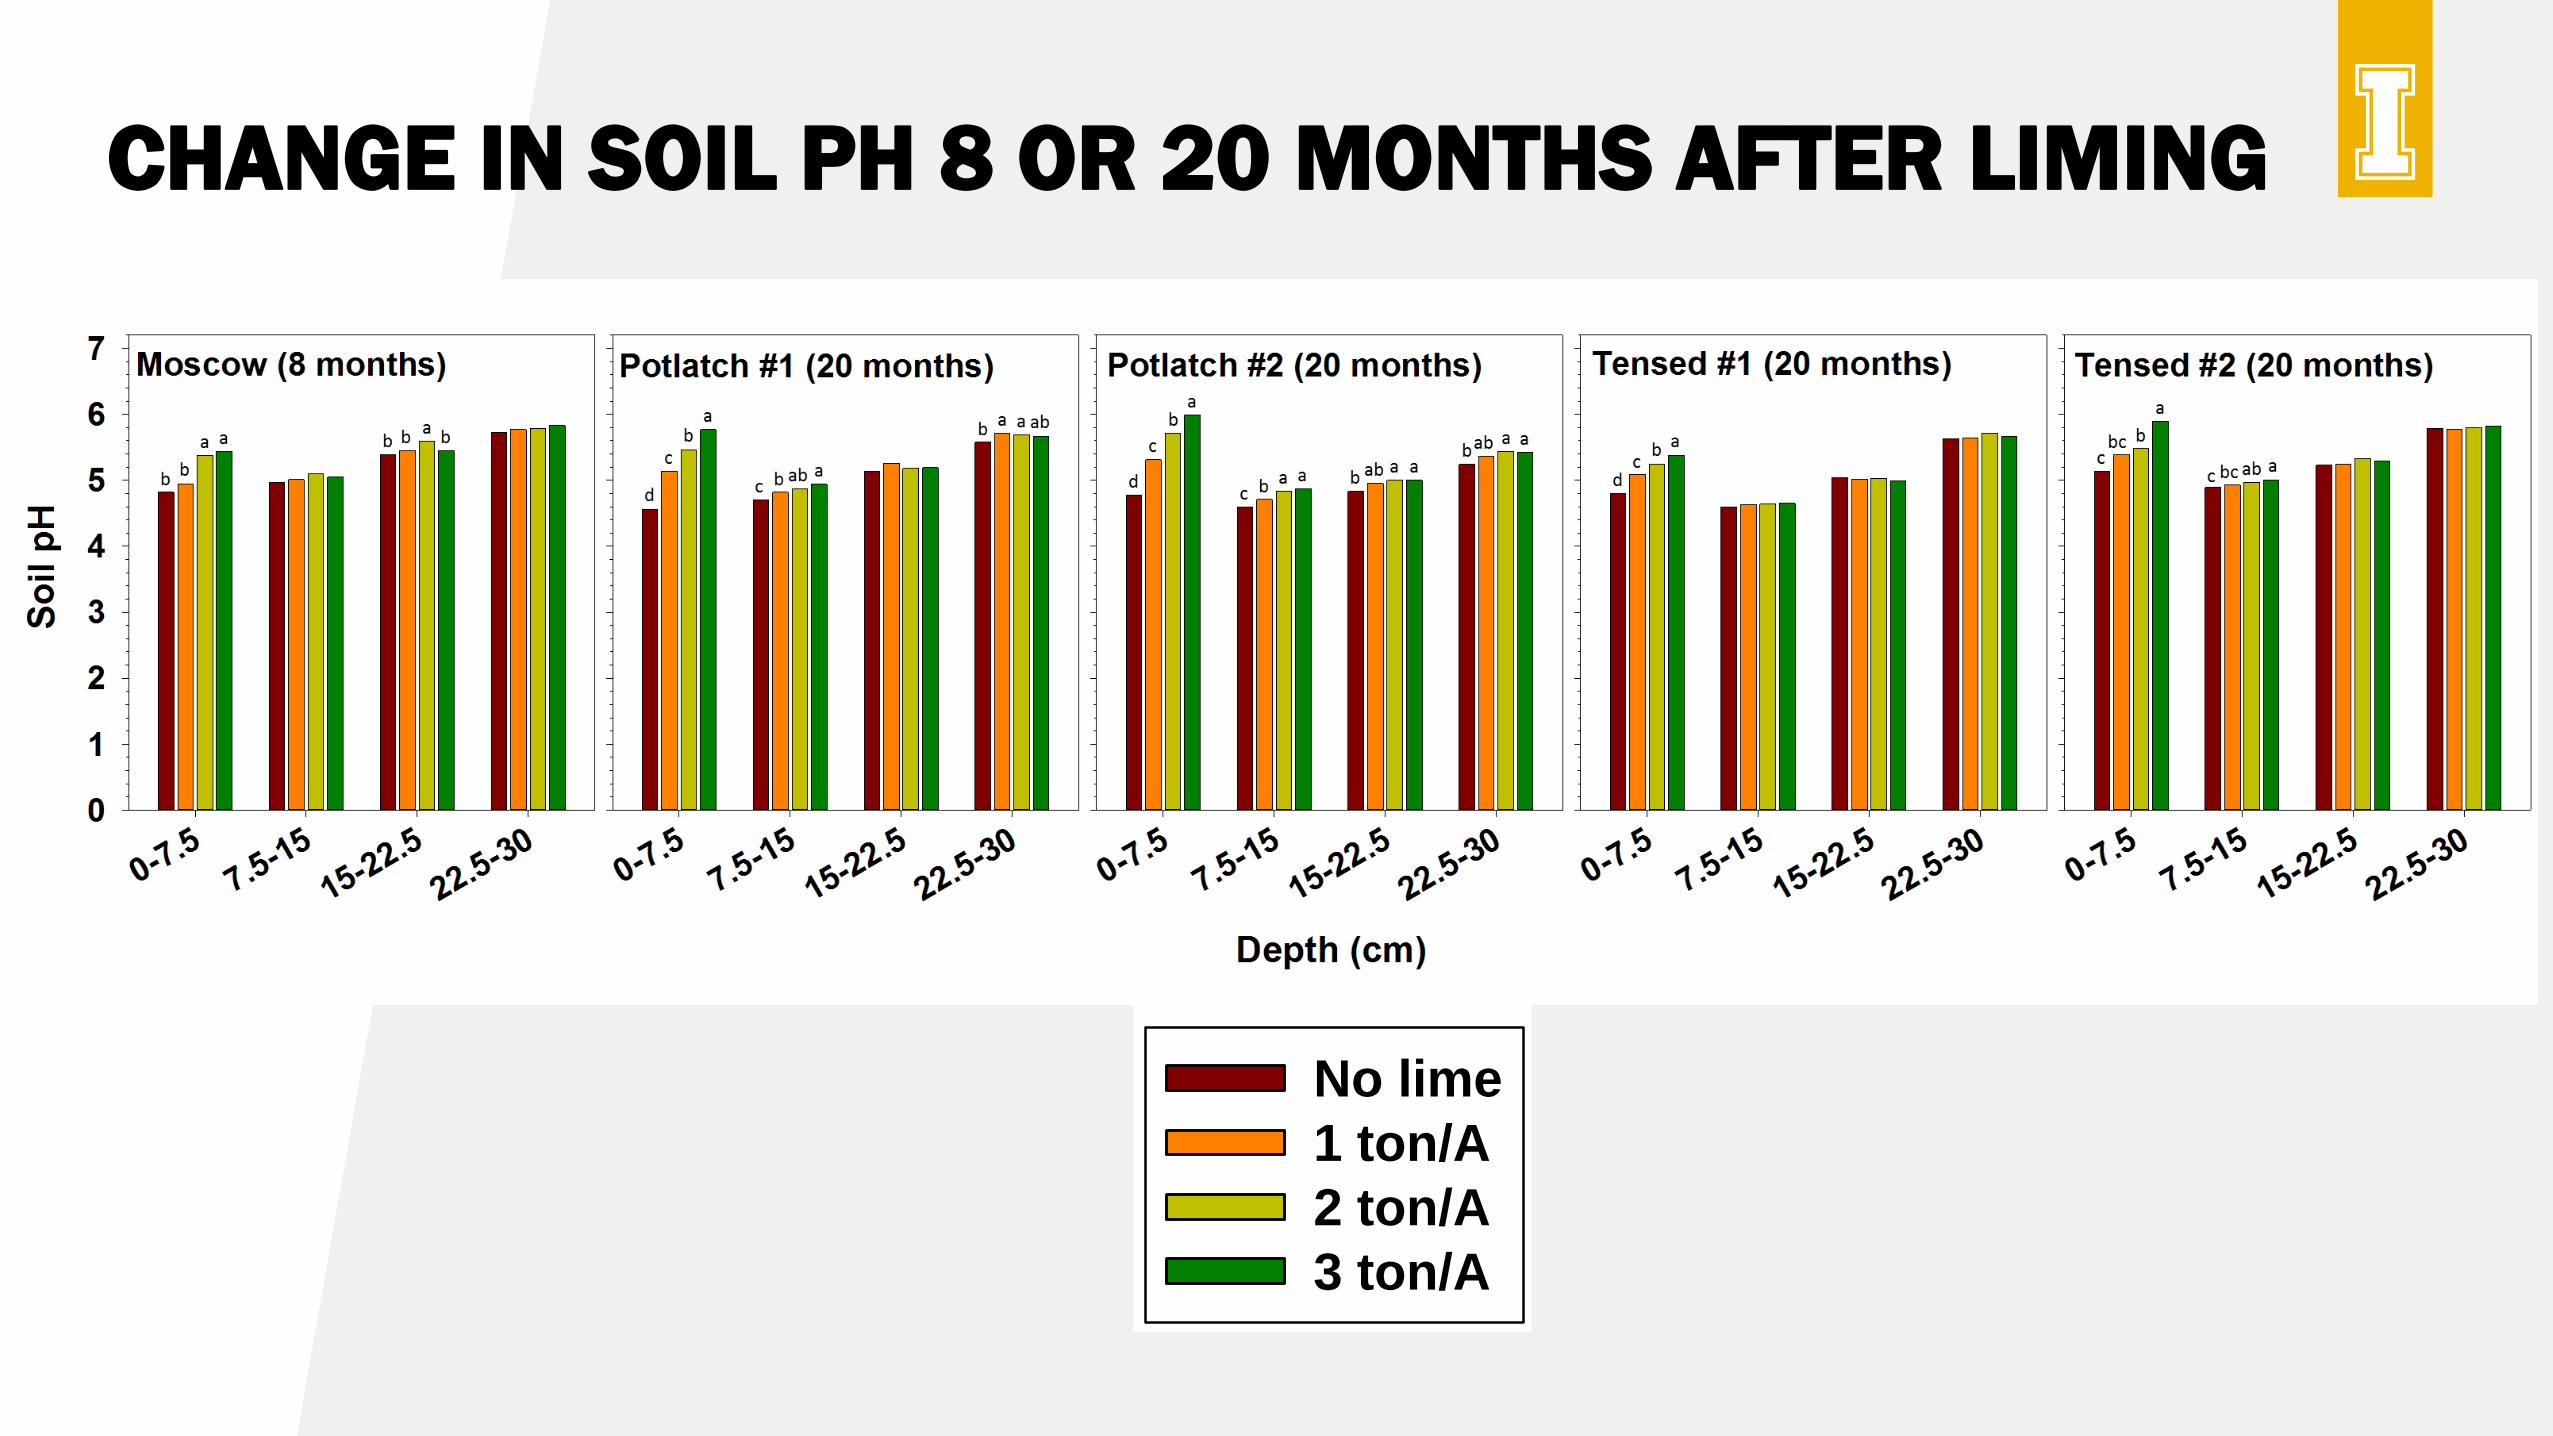
CHANGE IN SOIL PH 8 OR 20 MONTHS AFTER LIMING
Potlatch Tensed 1 Tensed 2
Yie
ld (
bu
/A)
0
20
40
60
80
No lime
1 ton/A
2 ton/A
3 ton/A
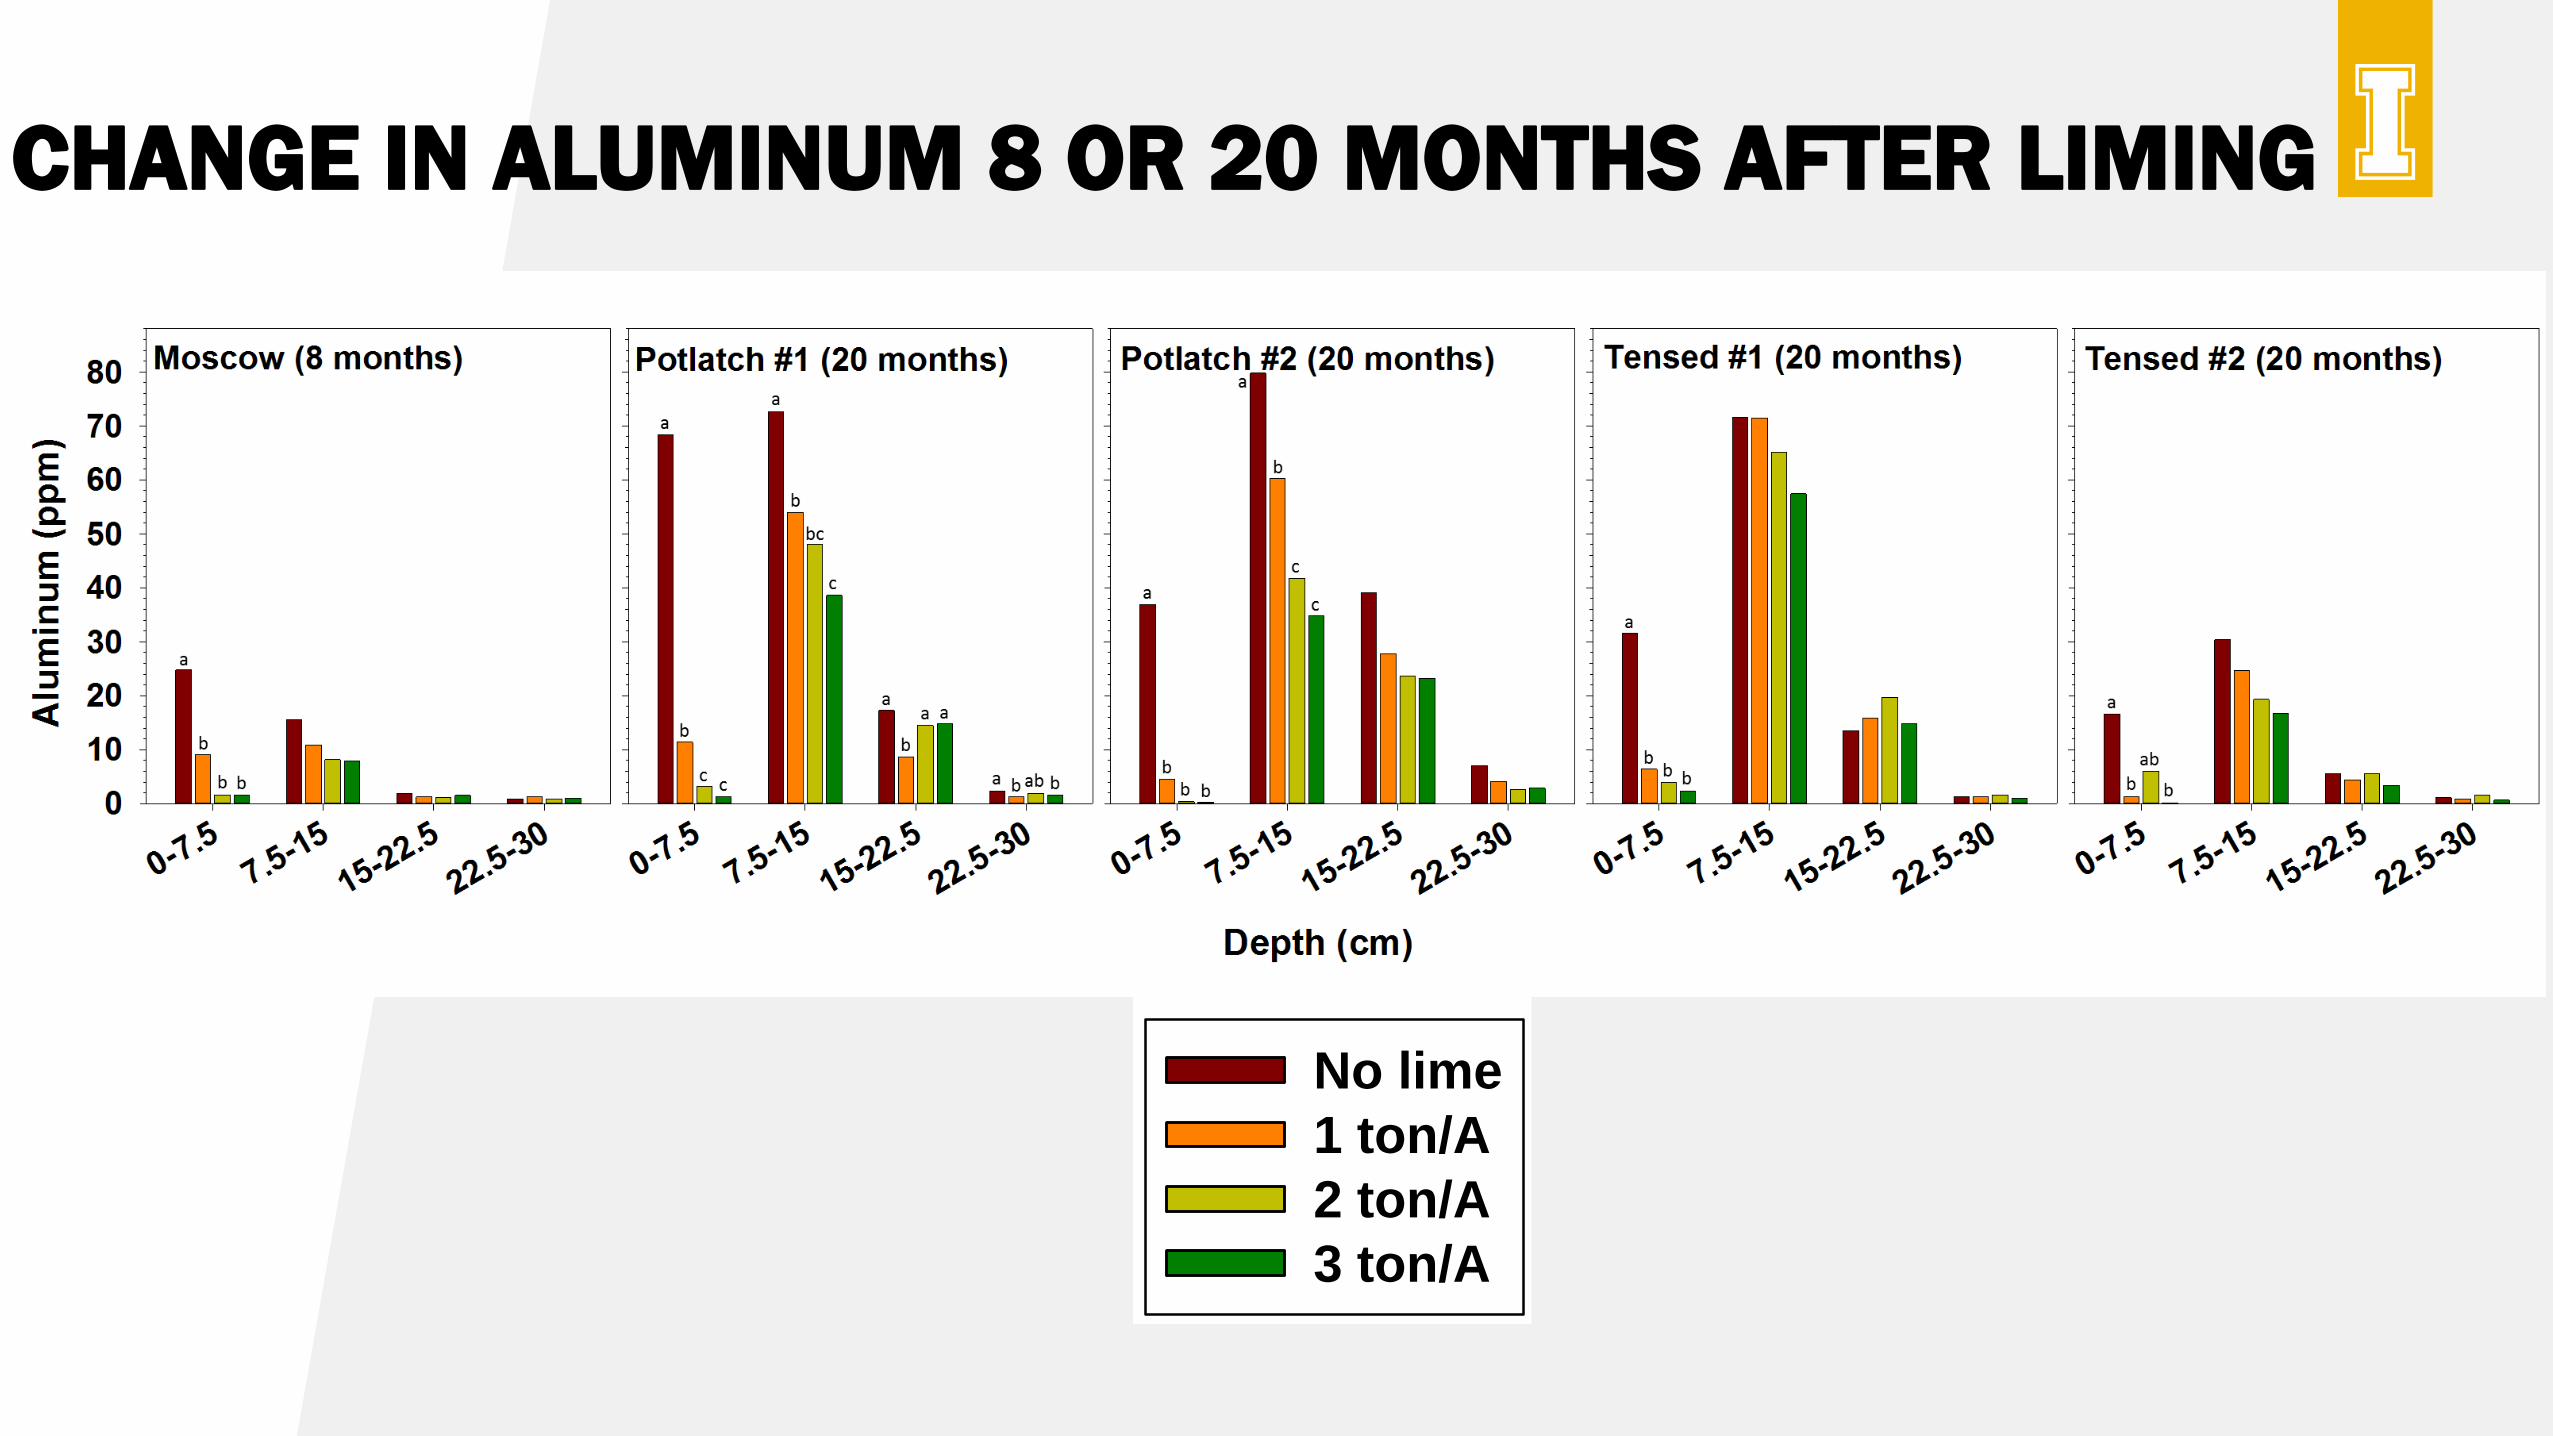
CHANGE IN ALUMINUM 8 OR 20 MONTHS AFTER LIMING
Potlatch Tensed 1 Tensed 2
Yie
ld (
bu
/A)
0
20
40
60
80
No lime
1 ton/A
2 ton/A
3 ton/A

YIELD INCREASE FOLLOWING LIME APPLICATION
Ground limestone
(ton/A)
Mos2018
W. Wheat
Pot#12017
Prevented
Pot#12018
W. Wheat
Pot#22017
W. Wheat
Pot#22018
Chickpea
Ten#12017
W. Wheat
Ten#12018
S. Canola
Ten#22017
W. Wheat
Ten#22018Lentil
0 102 -- 127 c 67 c -- 67 b 2351 57 9111 103 -- 131 bc 73 b -- 71 ab 2558 59 10452 106 -- 135 ab 78 a -- 76 a 2318 58 10653 109 -- 136 a 77 a -- 76 a 2466 60 1109
Ground limestone
(ton/A) Percent increase in yield1 1 -- 3 9 -- 6 9 4 152 4 -- 6 16 -- 13 -1 2 173 7 -- 7 15 -- 13 5 5 22
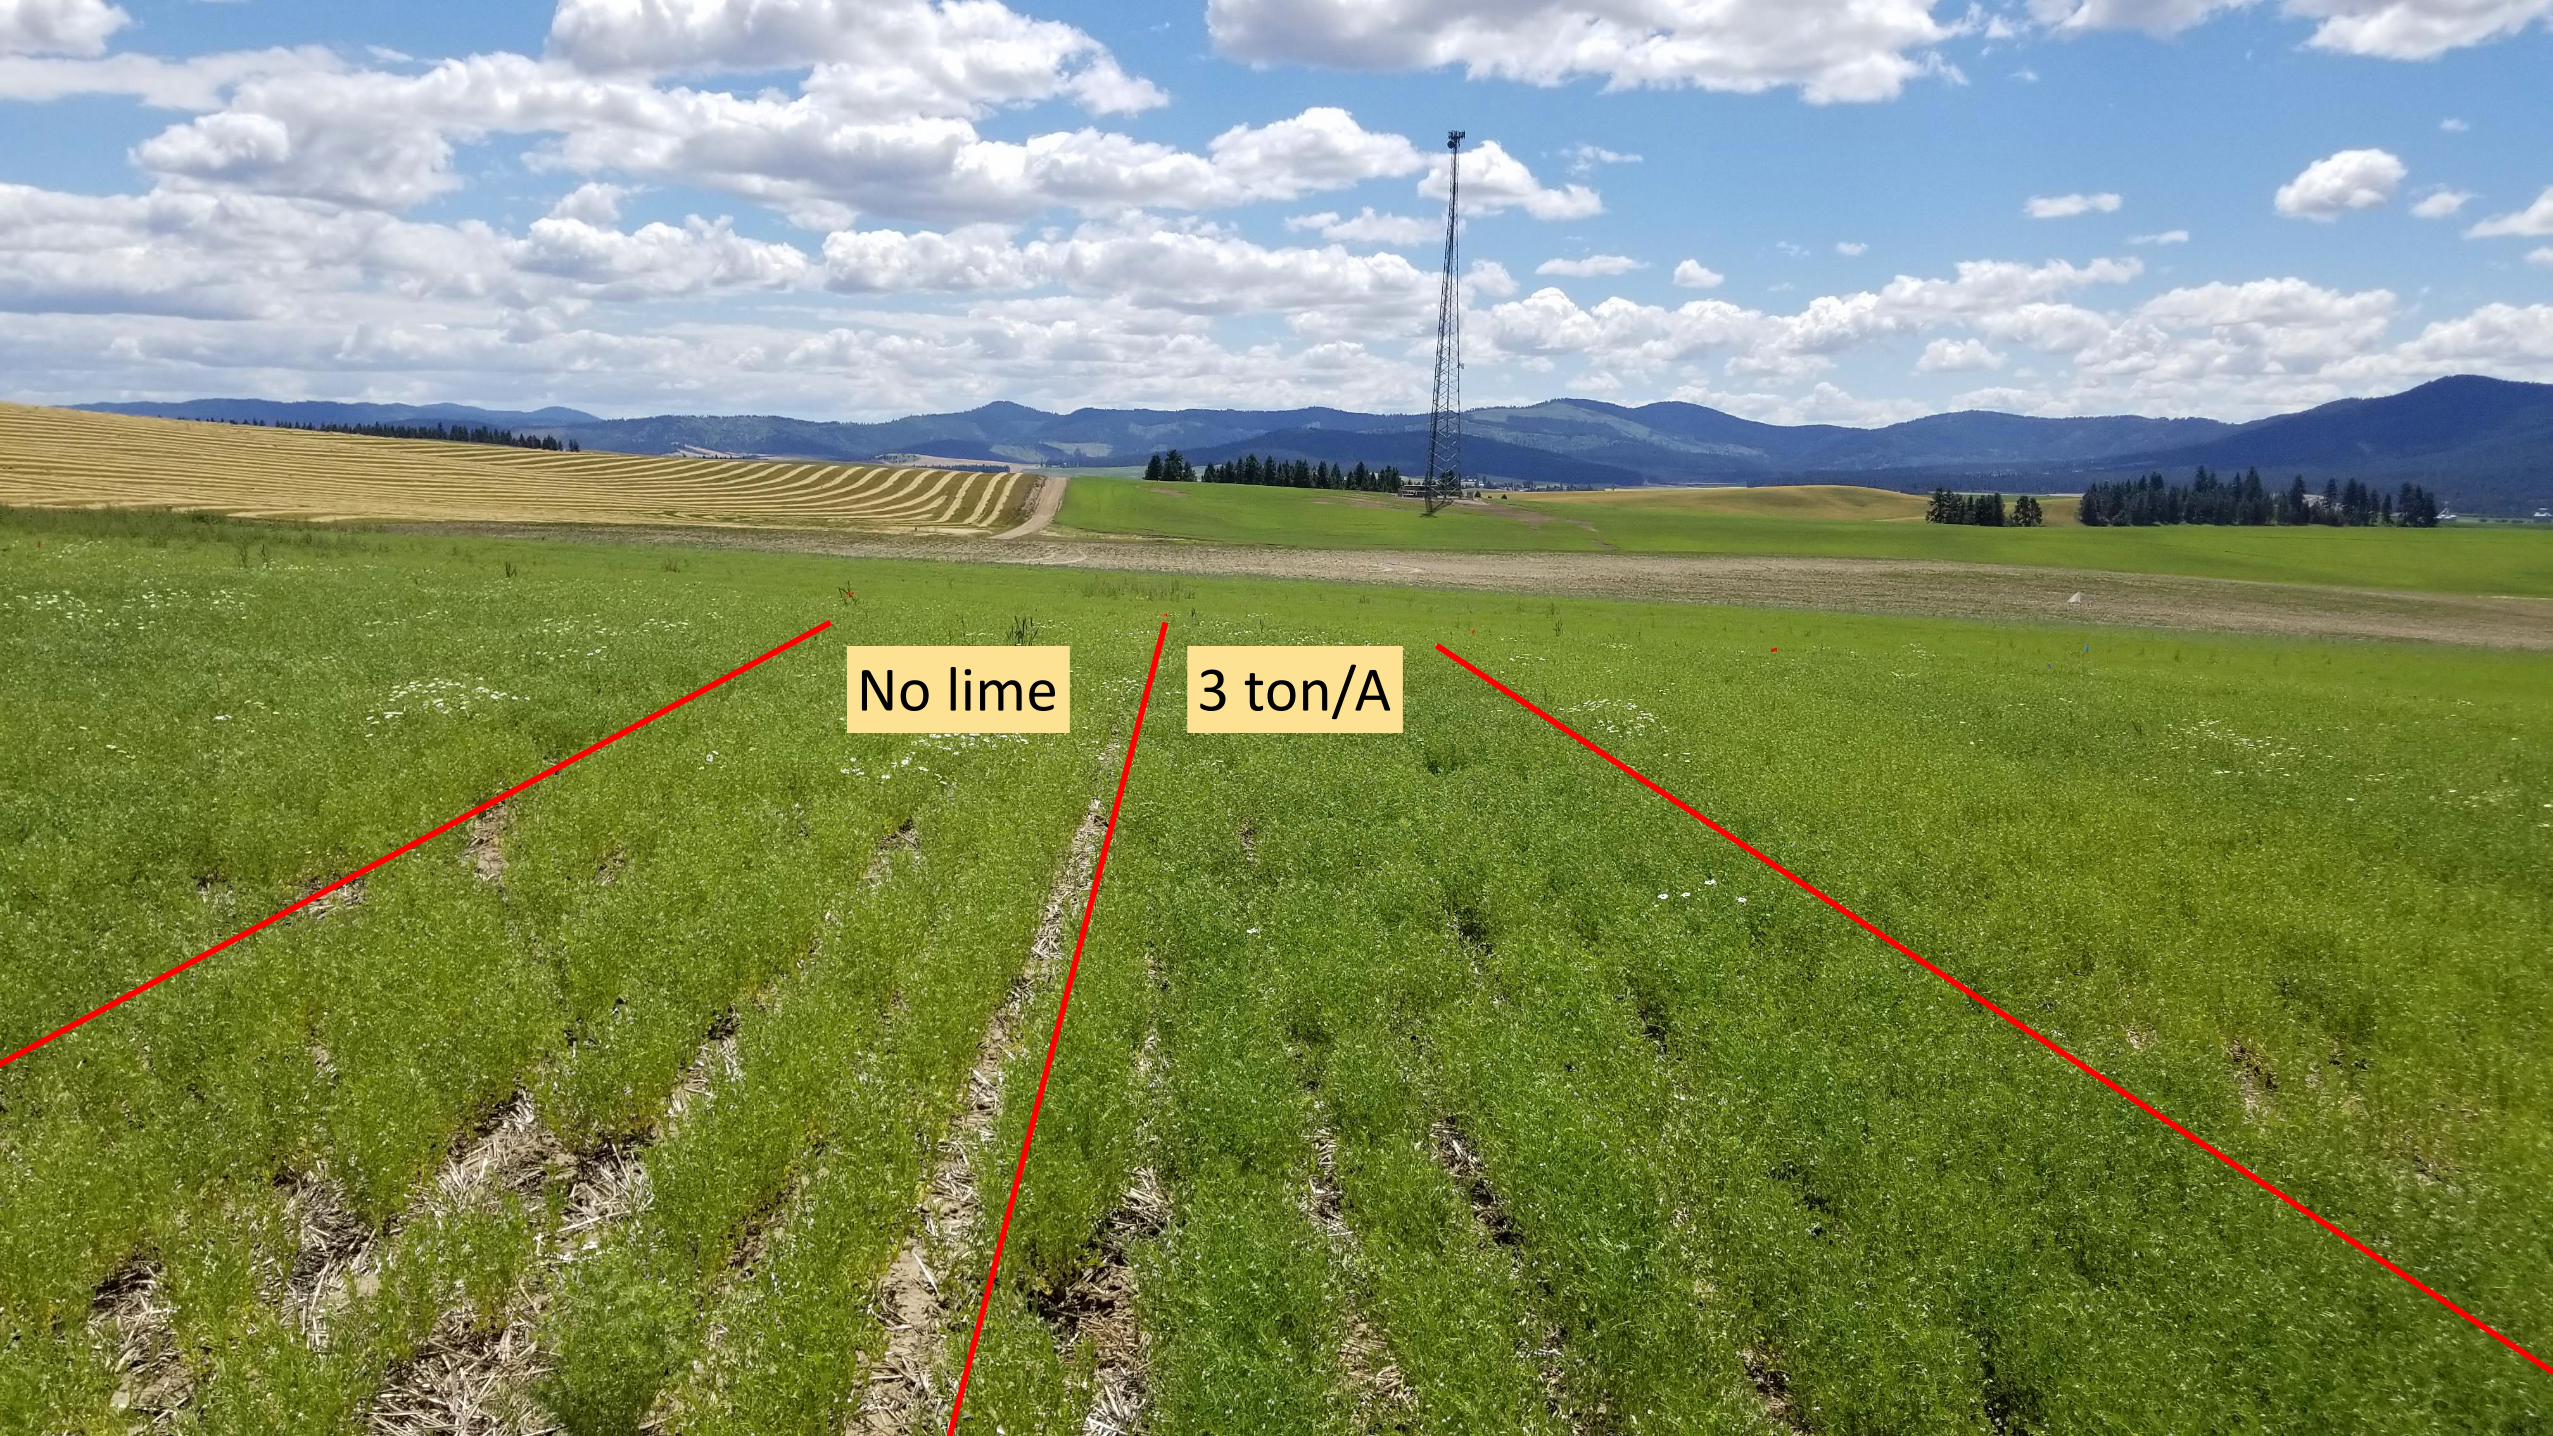
3 ton/ANo lime
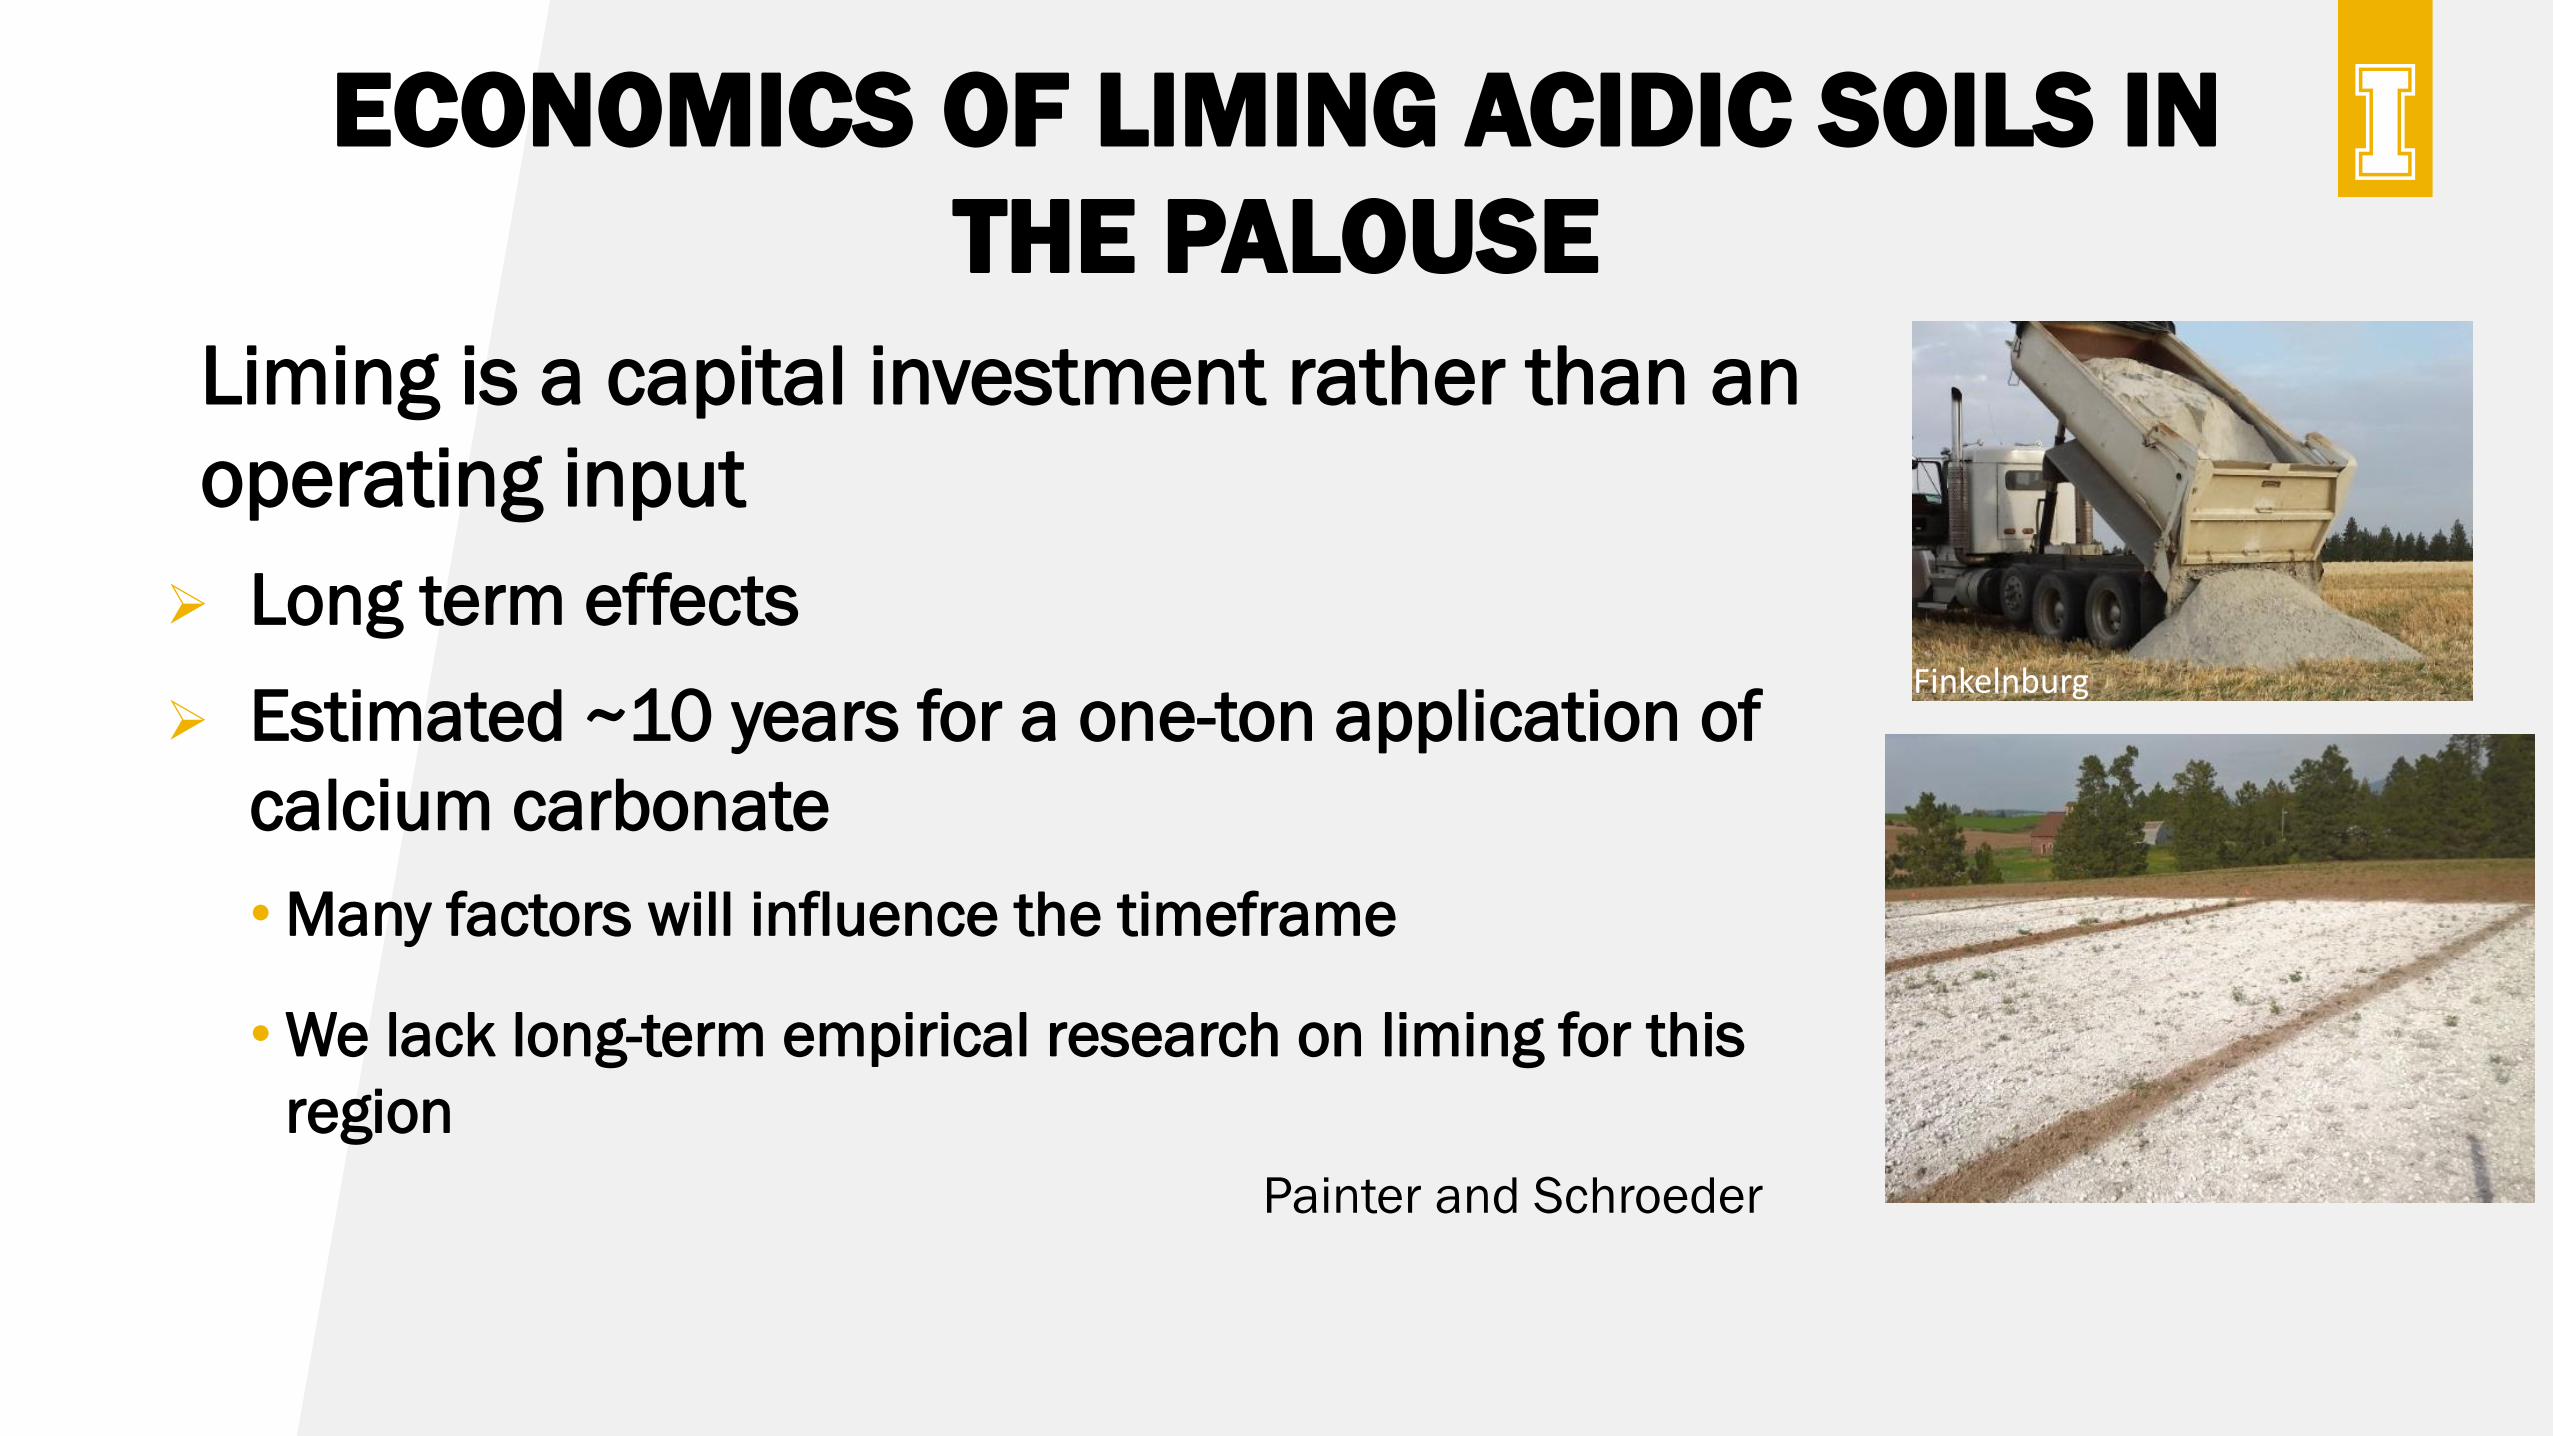
ECONOMICS OF LIMING ACIDIC SOILS IN
THE PALOUSE
Liming is a capital investment rather than an
operating input
Long term effects
Estimated ~10 years for a one-ton application of
calcium carbonate
• Many factors will influence the timeframe
• We lack long-term empirical research on liming for this
region
Finkelnburg
Painter and Schroeder
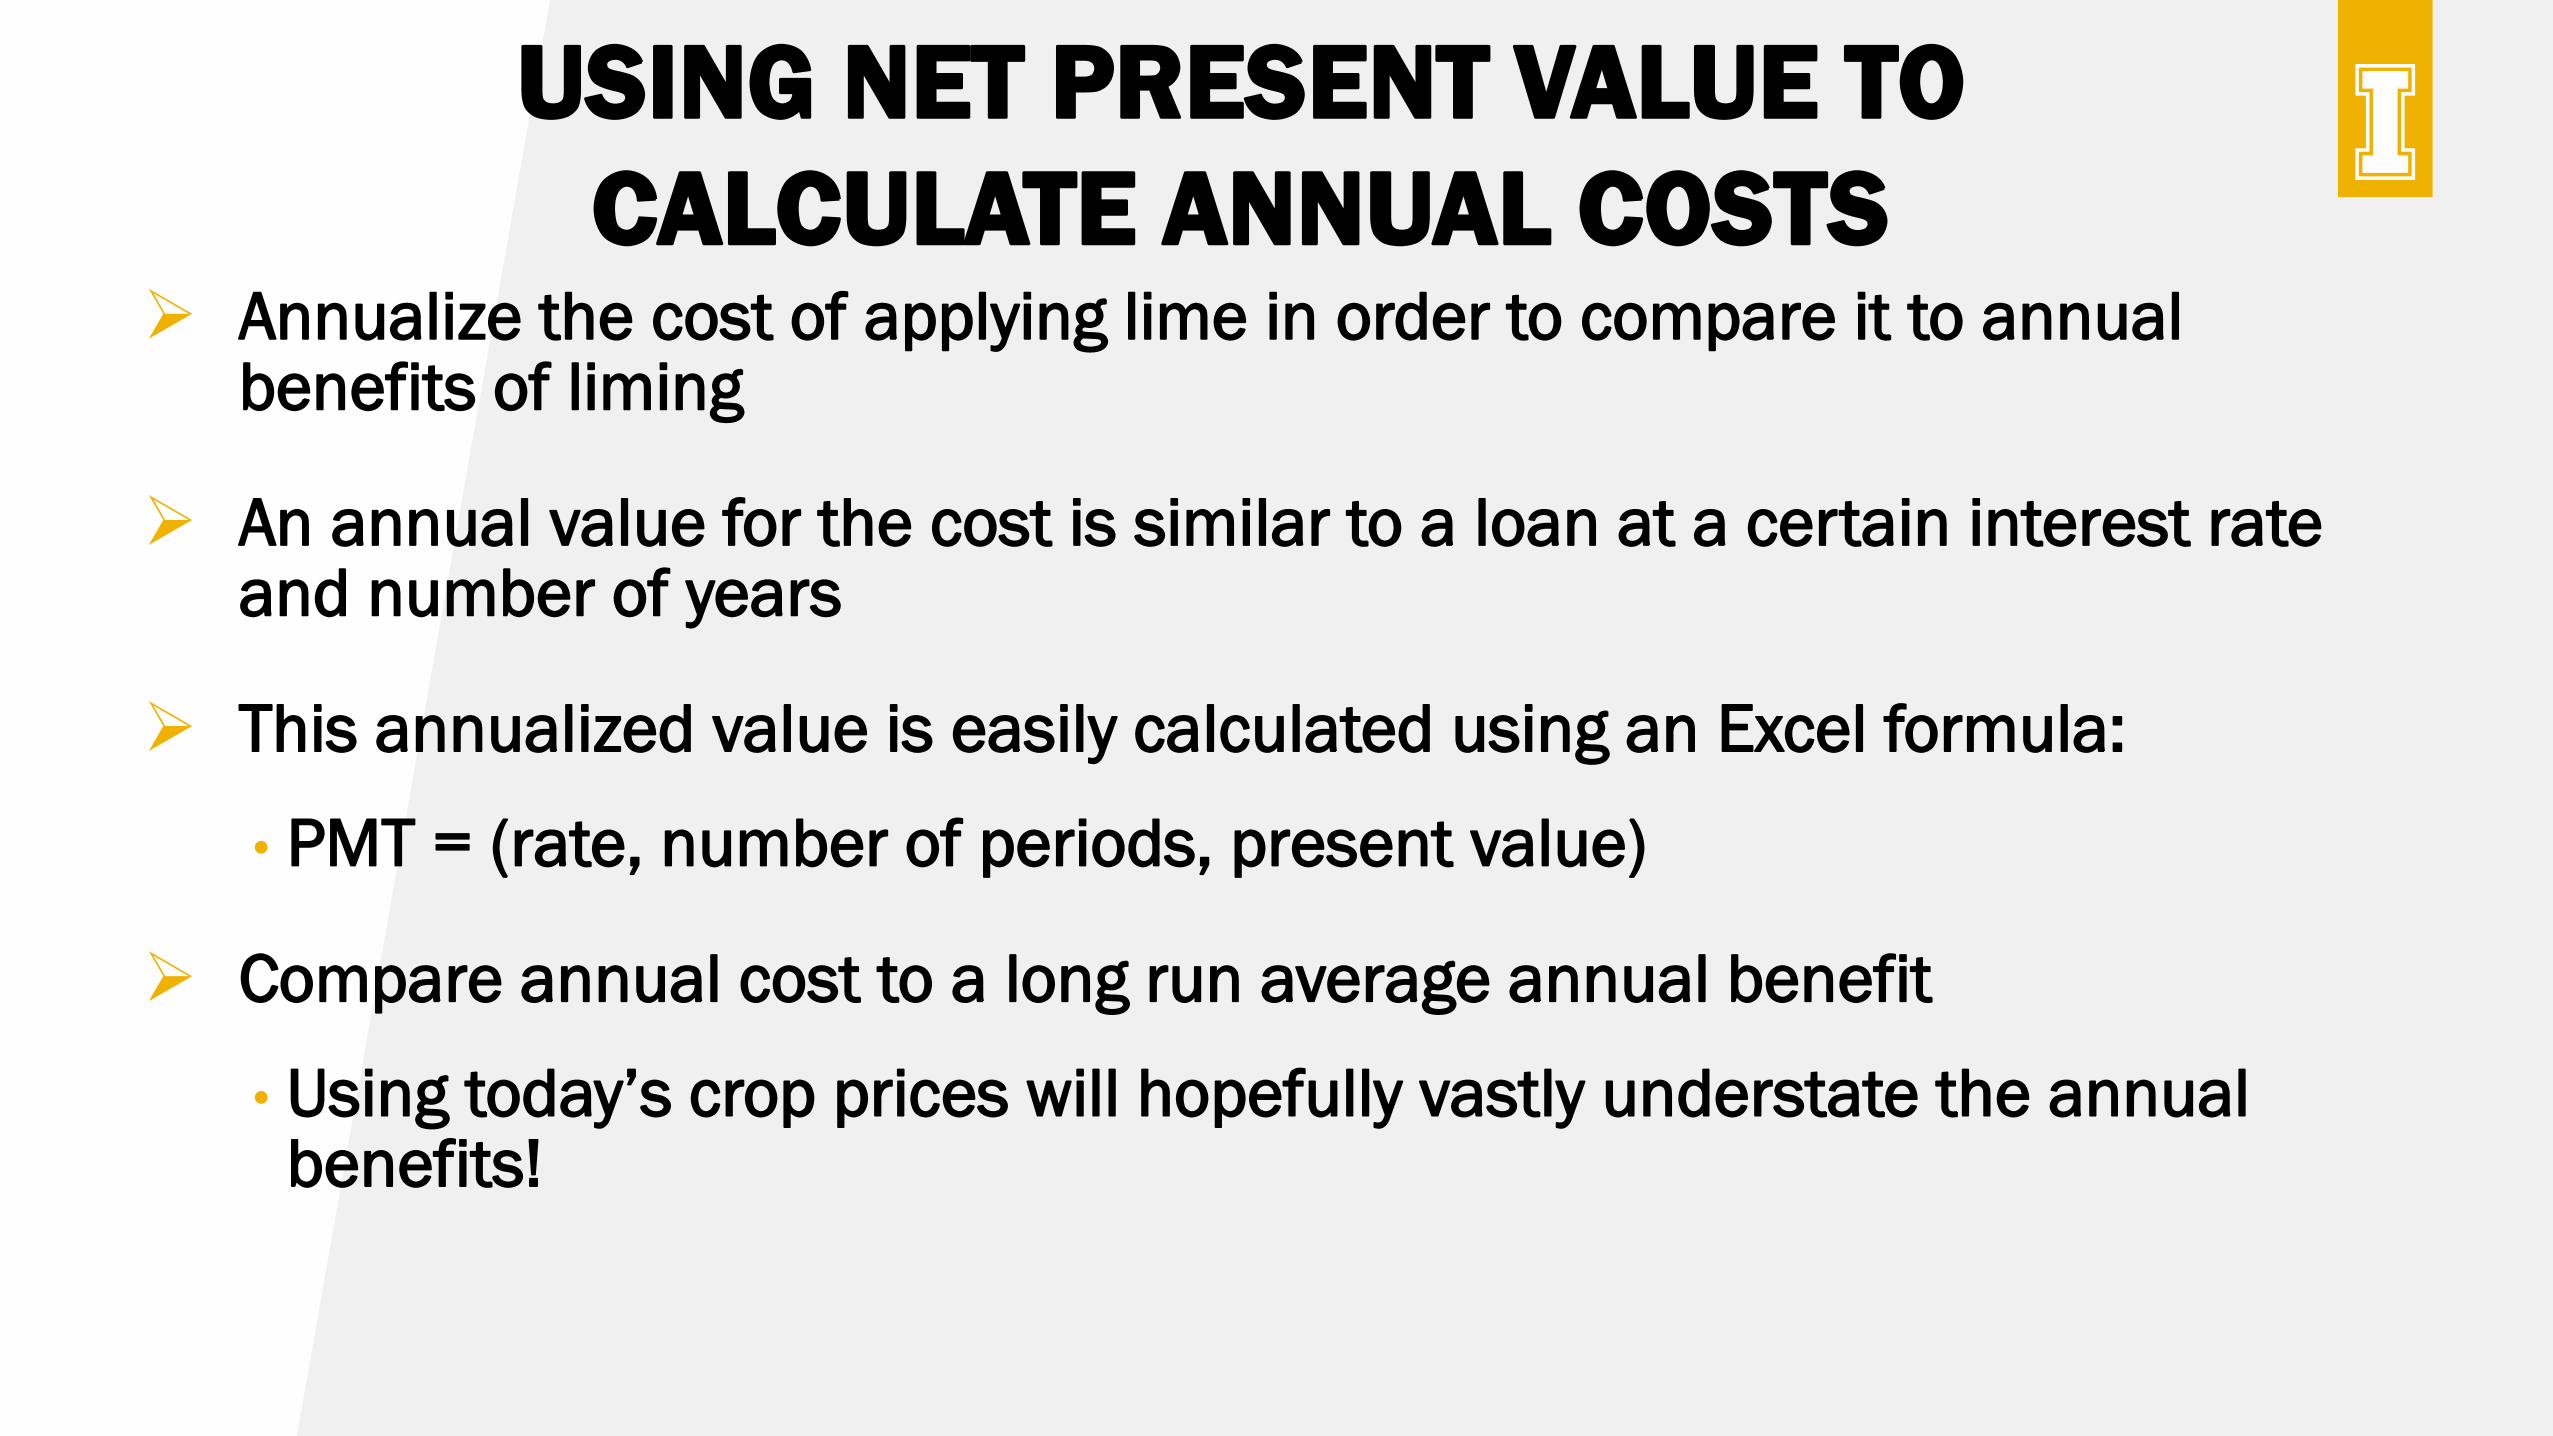
USING NET PRESENT VALUE TO
CALCULATE ANNUAL COSTS Annualize the cost of applying lime in order to compare it to annual
benefits of liming
An annual value for the cost is similar to a loan at a certain interest rate and number of years
This annualized value is easily calculated using an Excel formula:
• PMT = (rate, number of periods, present value)
Compare annual cost to a long run average annual benefit
• Using today’s crop prices will hopefully vastly understate the annual benefits!
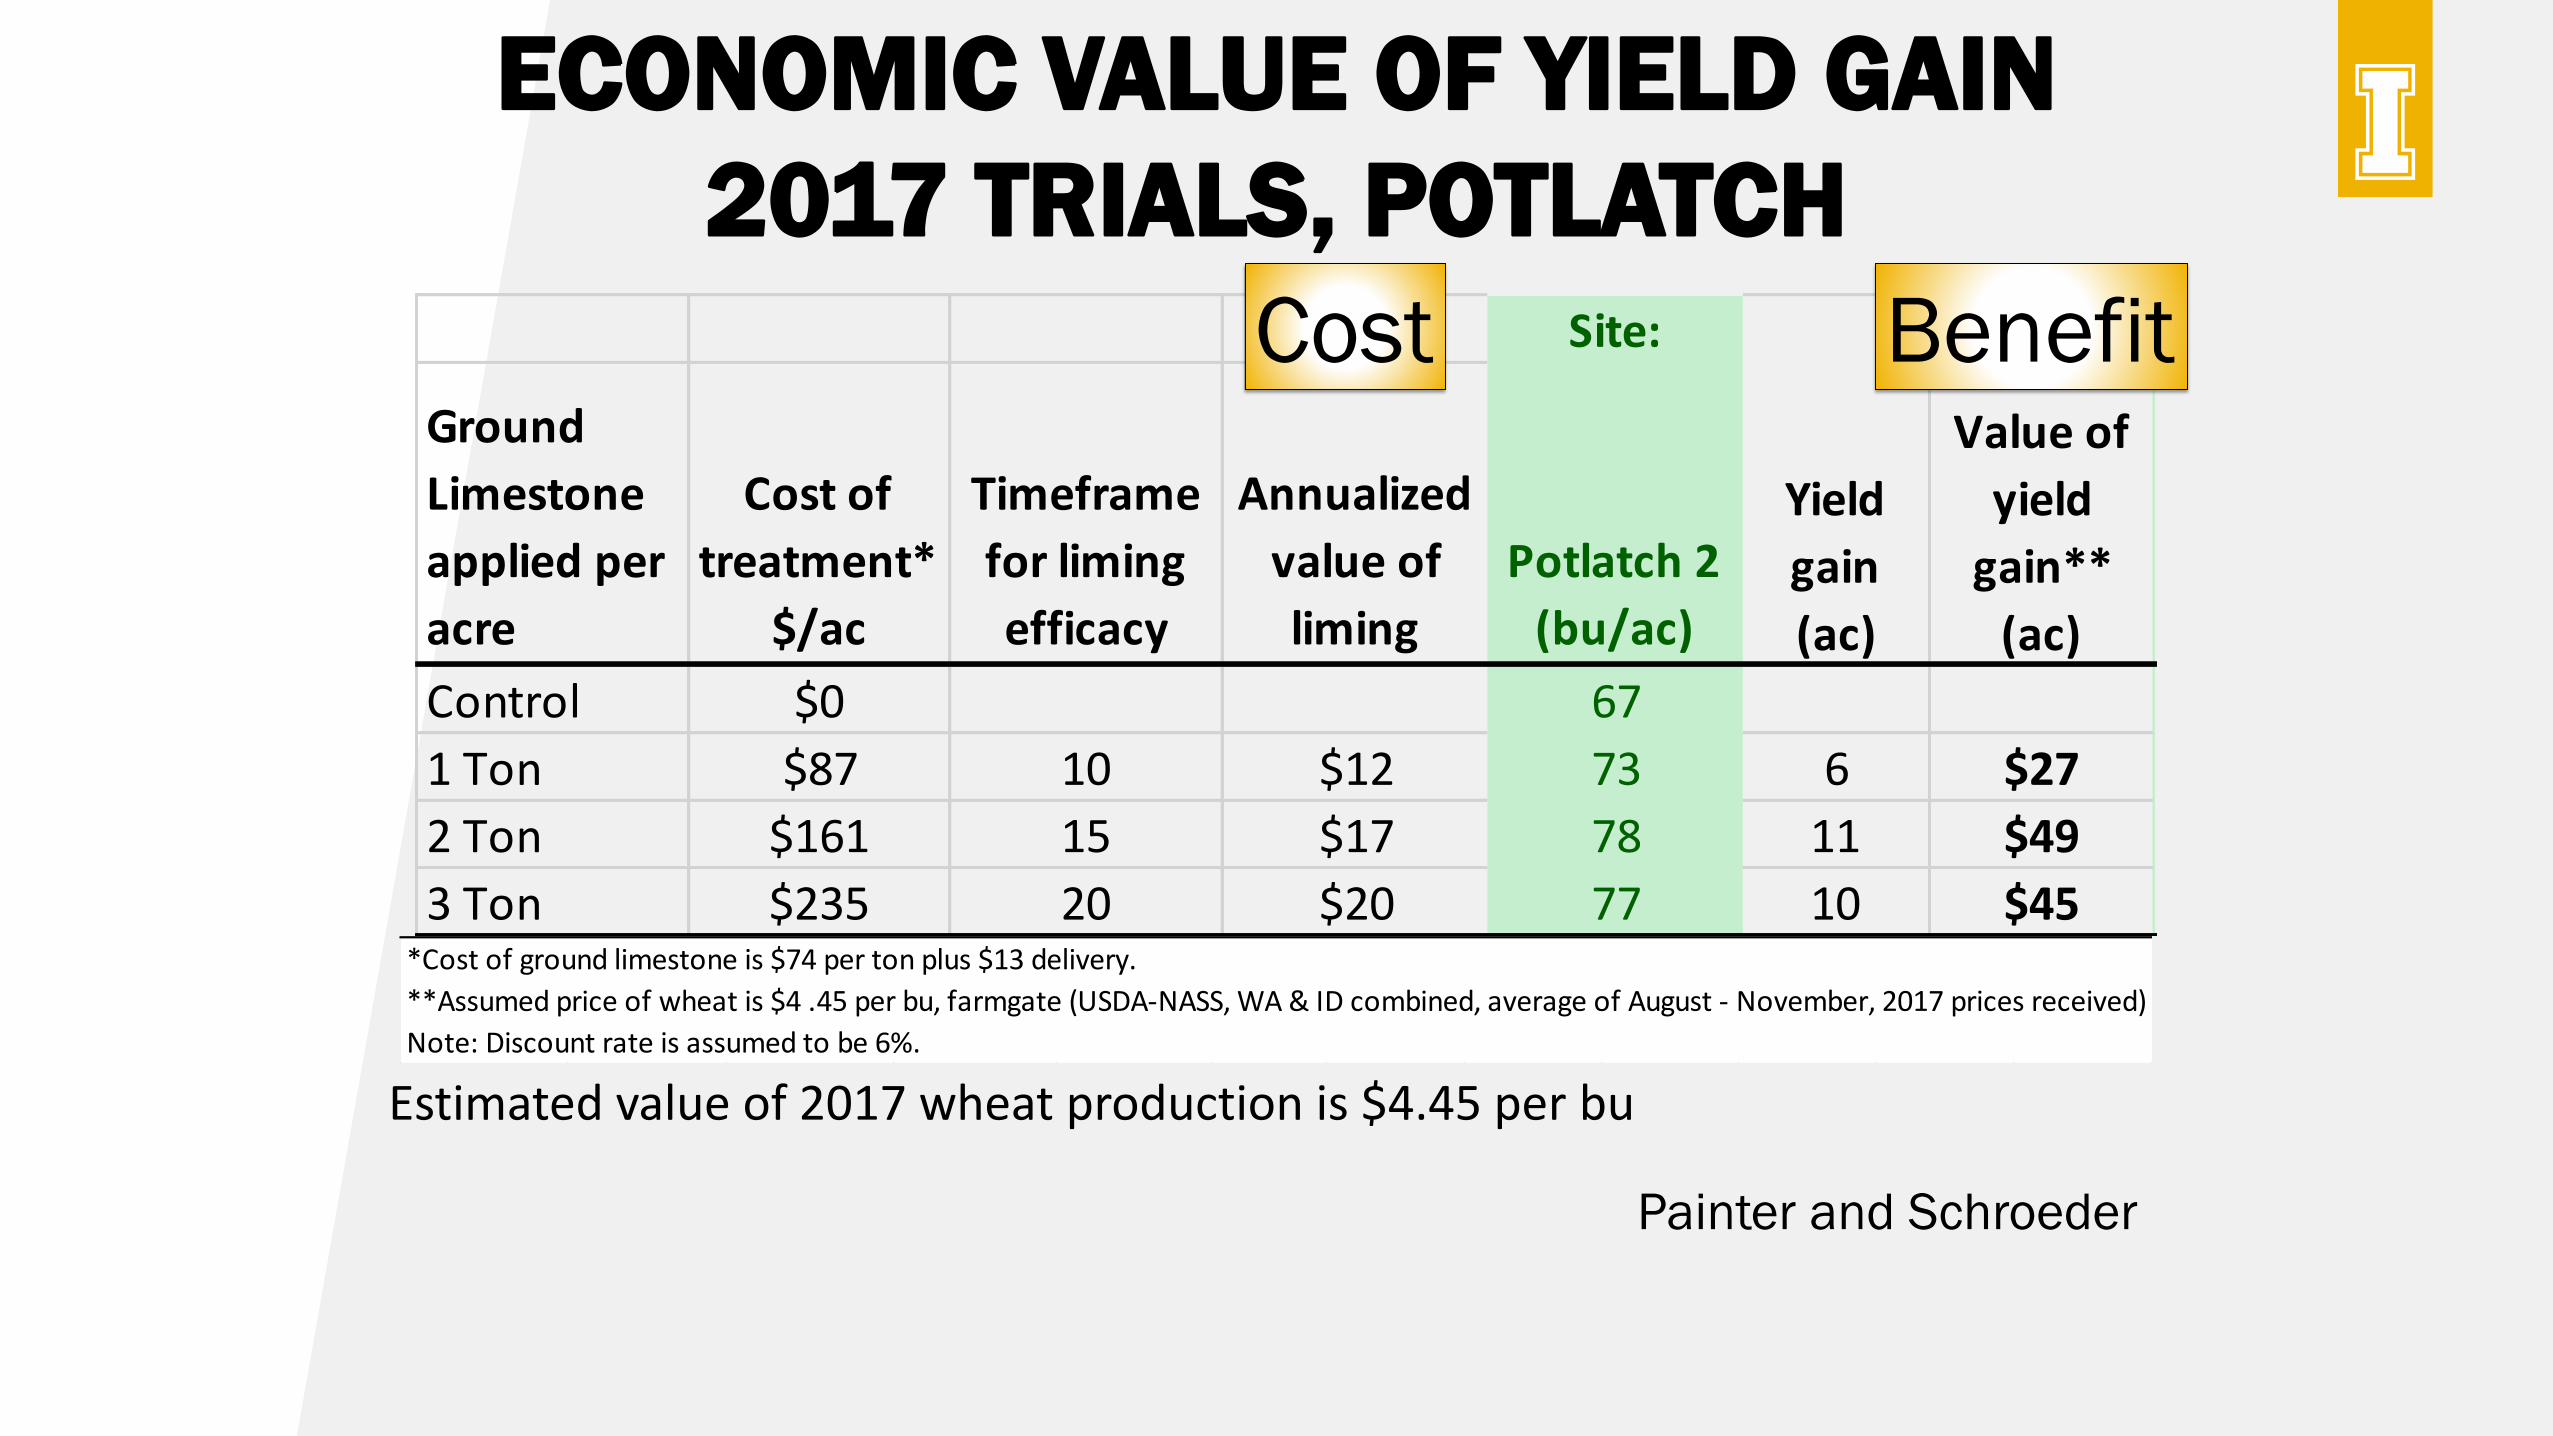
ECONOMIC VALUE OF YIELD GAIN
2017 TRIALS, POTLATCH
*Cost of ground limestone is $74 per ton plus $13 delivery.
**Assumed price of wheat is $4 .45 per bu, farmgate (USDA-NASS, WA & ID combined, average of August - November, 2017 prices received)
Note: Discount rate is assumed to be 6%.
Estimated value of 2017 wheat production is $4.45 per bu
Site:
Ground
Limestone
applied per
acre
Cost of
treatment*
$/ac
Timeframe
for liming
efficacy
Annualized
value of
liming
Potlatch 2
(bu/ac)
Control $0 67
1 Ton $87 10 $12 73 6 $27
2 Ton $161 15 $17 78 11 $49
3 Ton $235 20 $20 77 10 $45
Yield
gain
(ac)
Value of
yield
gain**
(ac)
Painter and Schroeder
BenefitCost
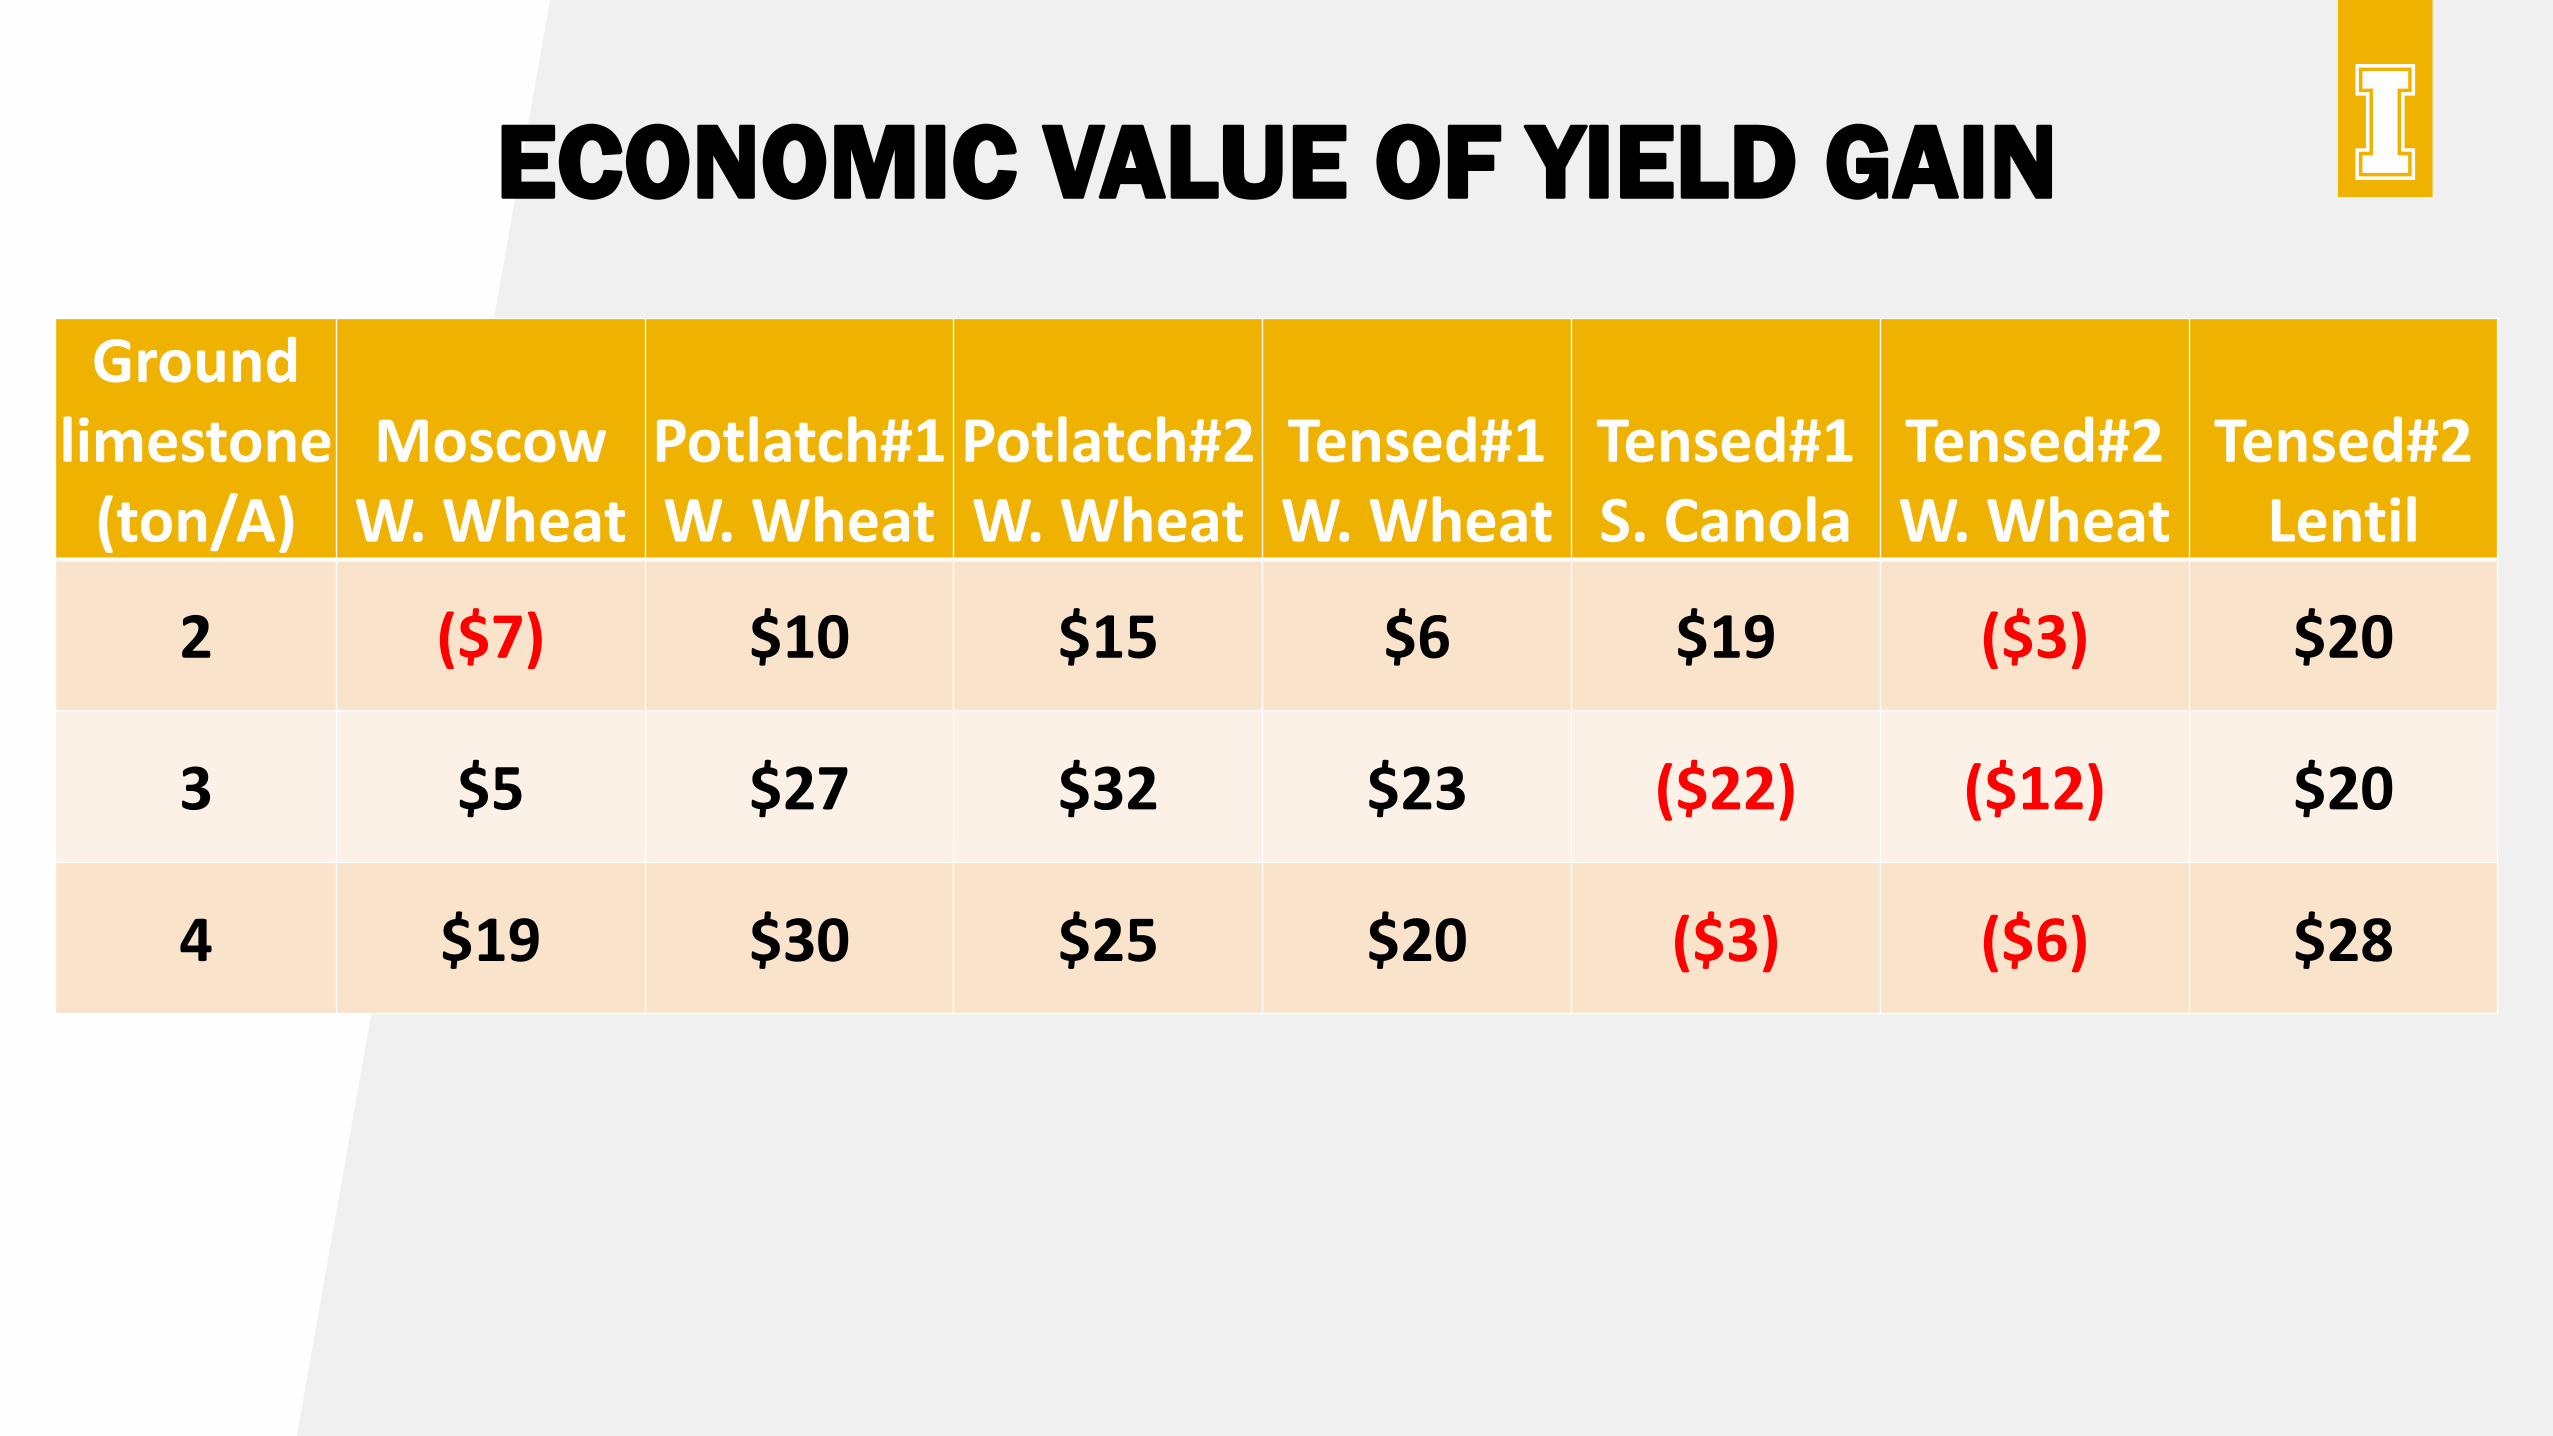
ECONOMIC VALUE OF YIELD GAIN
Ground limestone
(ton/A)Moscow
W. WheatPotlatch#1 W. Wheat
Potlatch#2 W. Wheat
Tensed#1 W. Wheat
Tensed#1 S. Canola
Tensed#2 W. Wheat
Tensed#2 Lentil
2 ($7) $10 $15 $6 $19 ($3) $20
3 $5 $27 $32 $23 ($22) ($12) $20
4 $19 $30 $25 $20 ($3) ($6) $28
IDENTIFYING THE PROBLEM•Sample from upper 6 inches for soil pH
•Test multiple samples from one field due to variability across landscape
• Interested in knowing quantity of KCl extractable Al, CEC, base saturation in addition to soil pH
•Avoid tissue testing for Al
•Lime requirement - the amount of CaO or CaCO3
that is needed to raise the pH to a target value–Not a particularly reliable lime requirement test for the PNW
OTHER STRATEGIES TO MINIMIZE SOIL ACIDITY
• Proper management of fertilizer
– Avoid excessive nitrogen fertilizer application
– Consider variable rate nitrogen application
• Diverse crop rotation (legumes, barley)
– Crops that have lower or no fertilizer requirements
• Avoid removal of residue by baling or burning
– Loss of OM and cations which lower buffering capacity of soil
HANDS-ON ACTIVITIES:
HANDHELD PH METER
ROTATION STRATEGIES FOR ACID SOILS
INFLUENCE OF SOIL PH ON CEREAL PATHOGENS
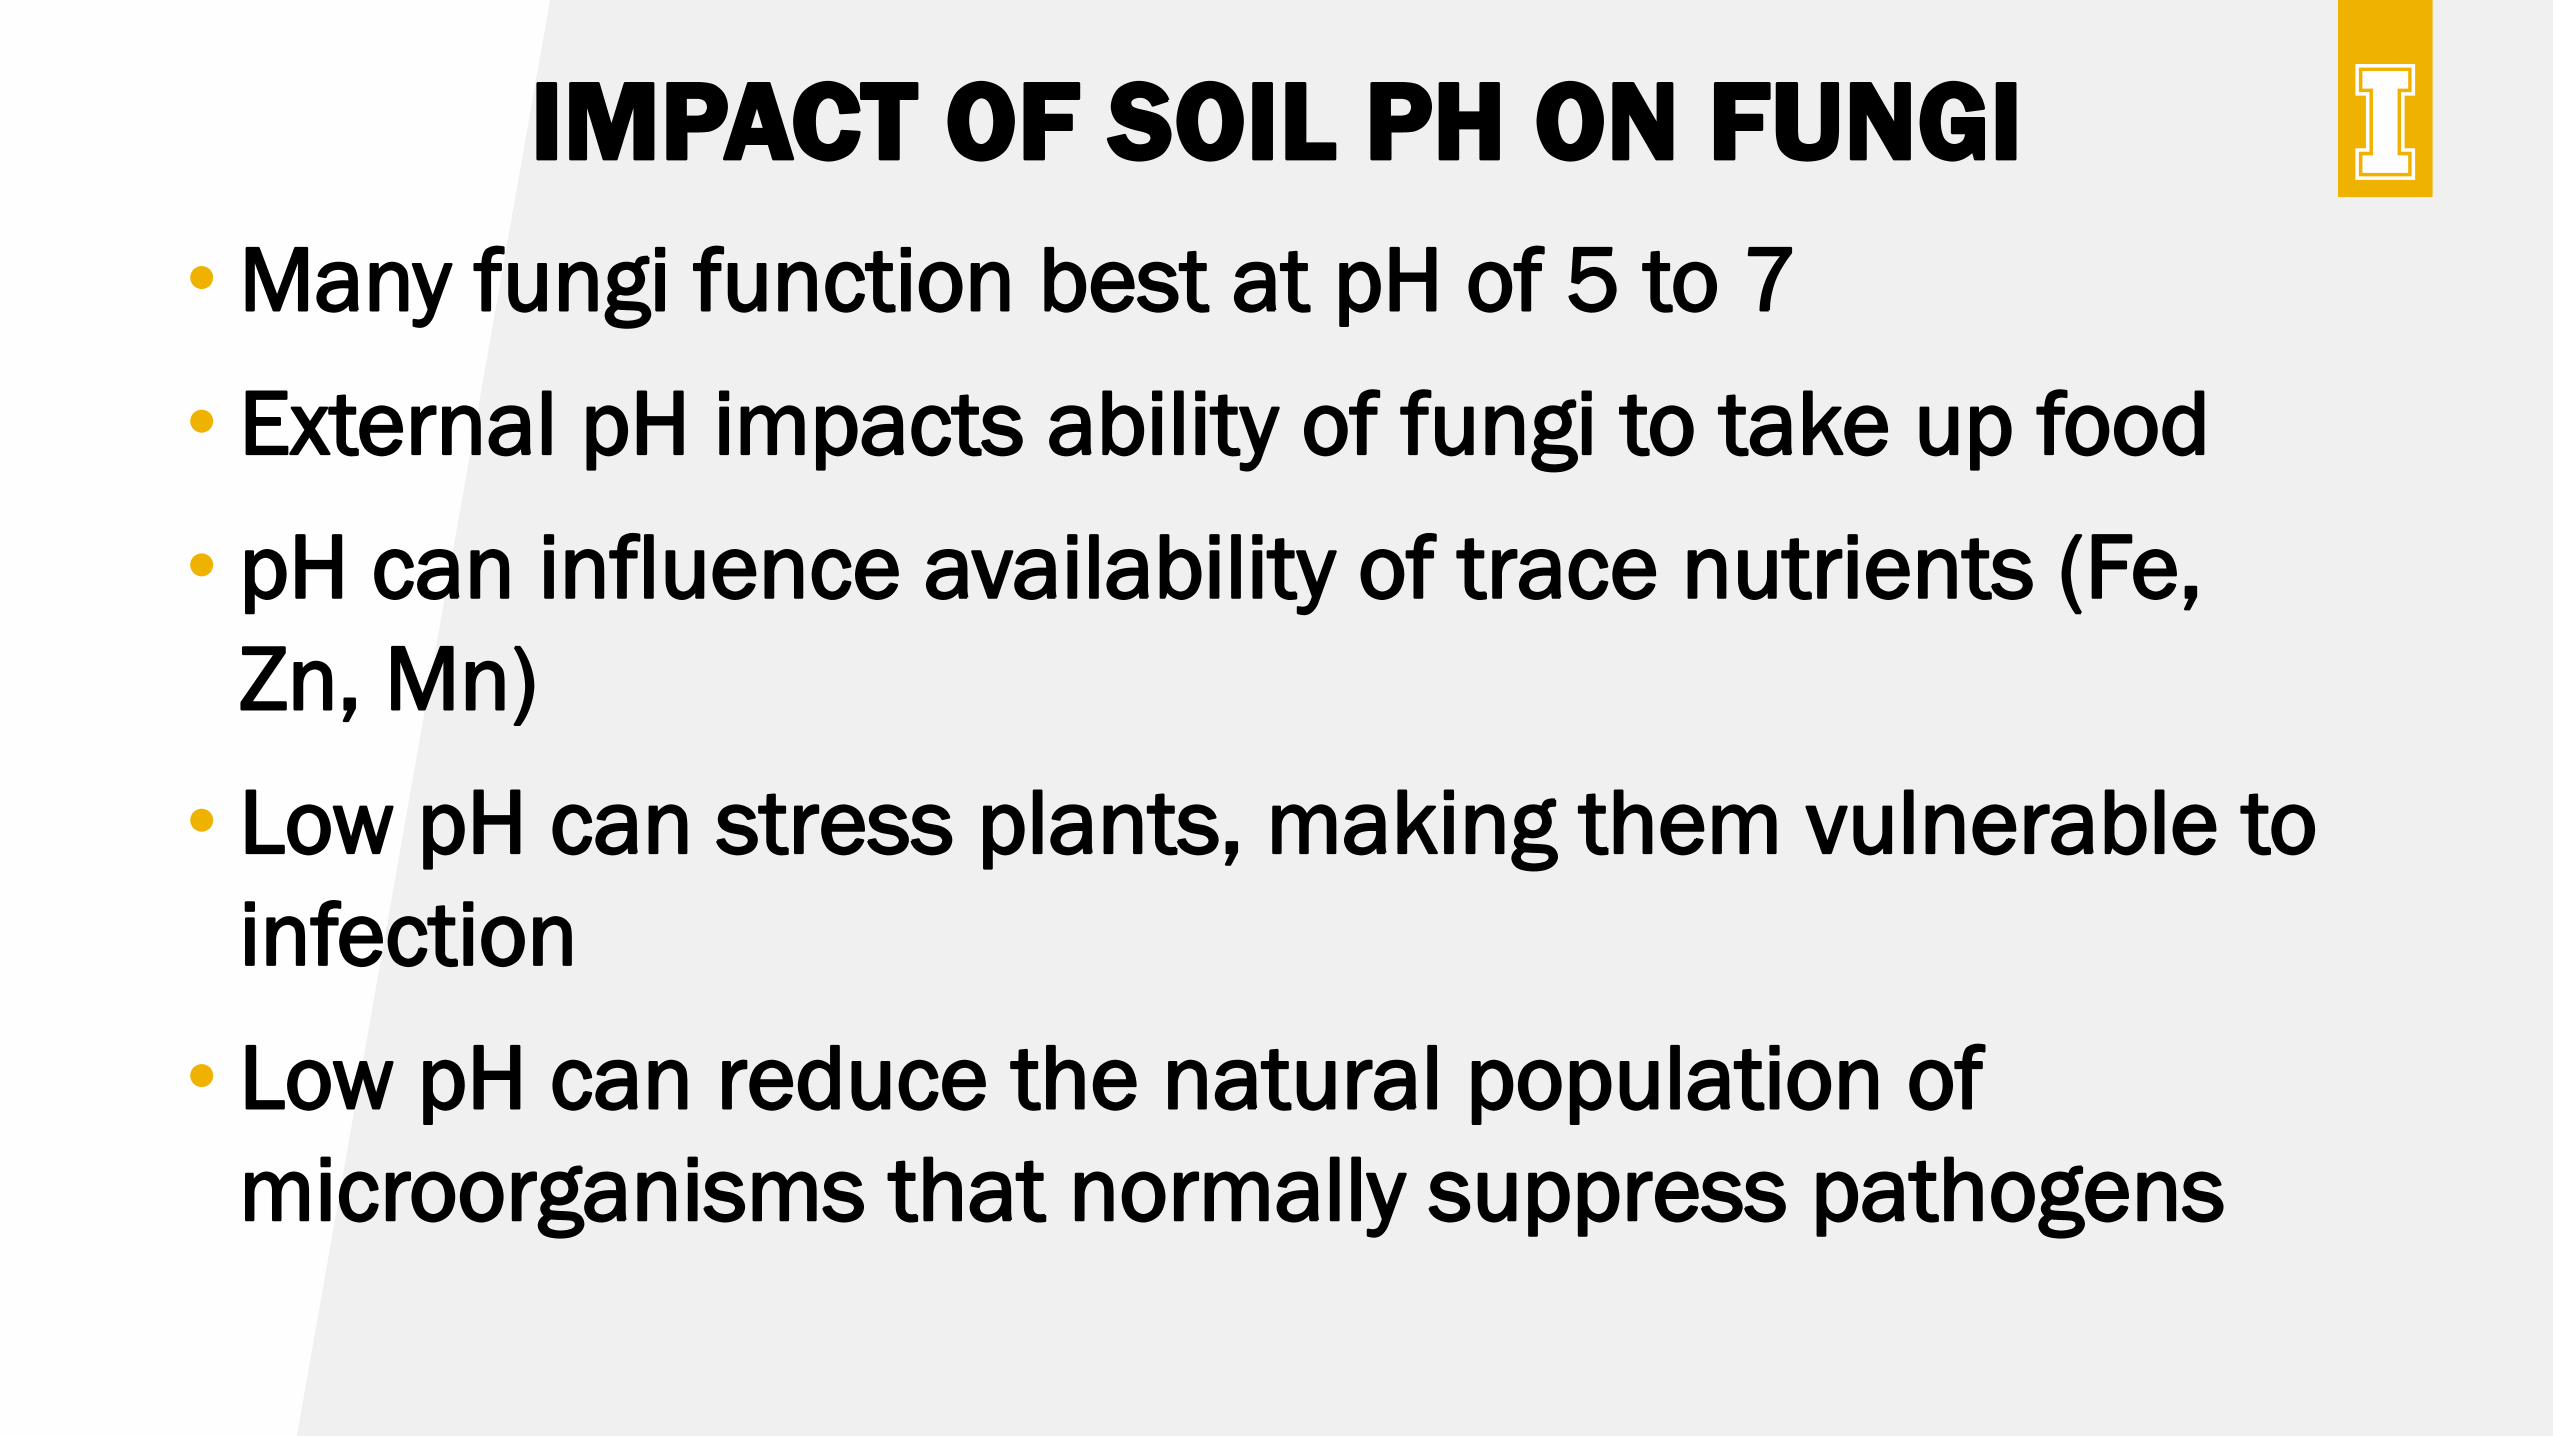
• Many fungi function best at pH of 5 to 7
• External pH impacts ability of fungi to take up food
• pH can influence availability of trace nutrients (Fe,
Zn, Mn)
• Low pH can stress plants, making them vulnerable to
infection
• Low pH can reduce the natural population of
microorganisms that normally suppress pathogens
IMPACT OF SOIL PH ON FUNGI
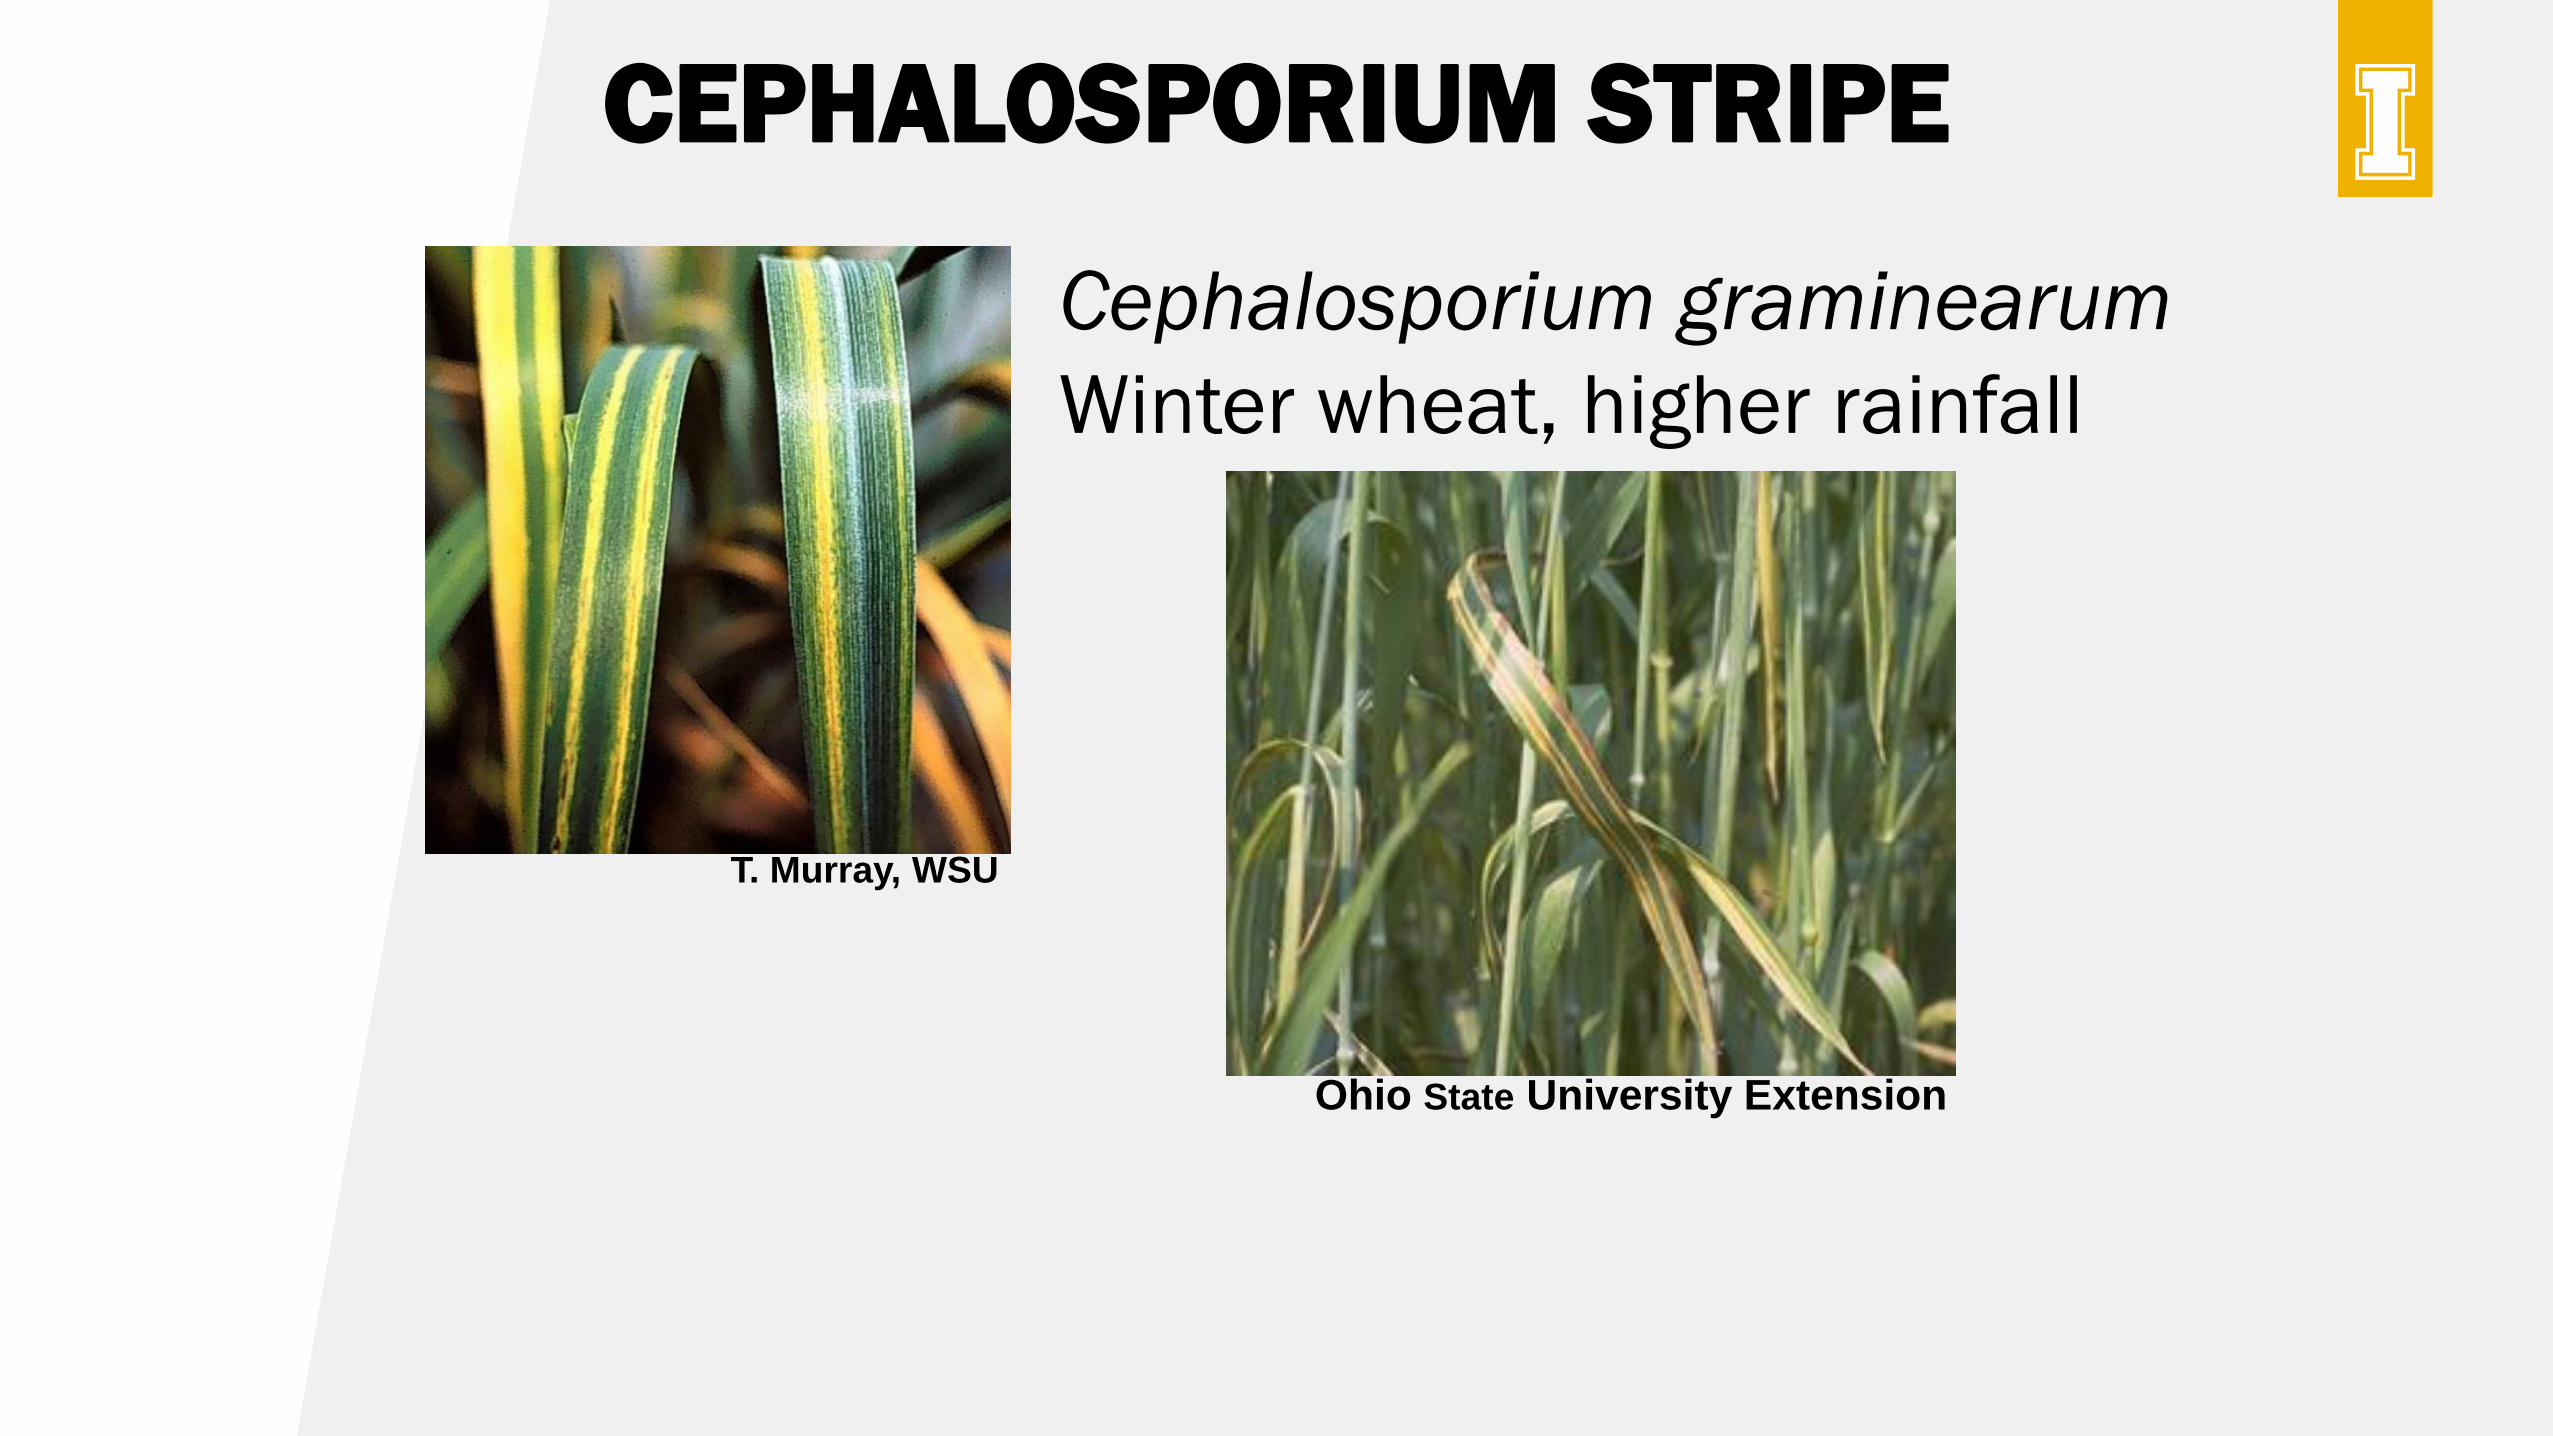
CEPHALOSPORIUM STRIPE
Ohio State University Extension
T. Murray, WSU
Cephalosporium graminearum
Winter wheat, higher rainfall
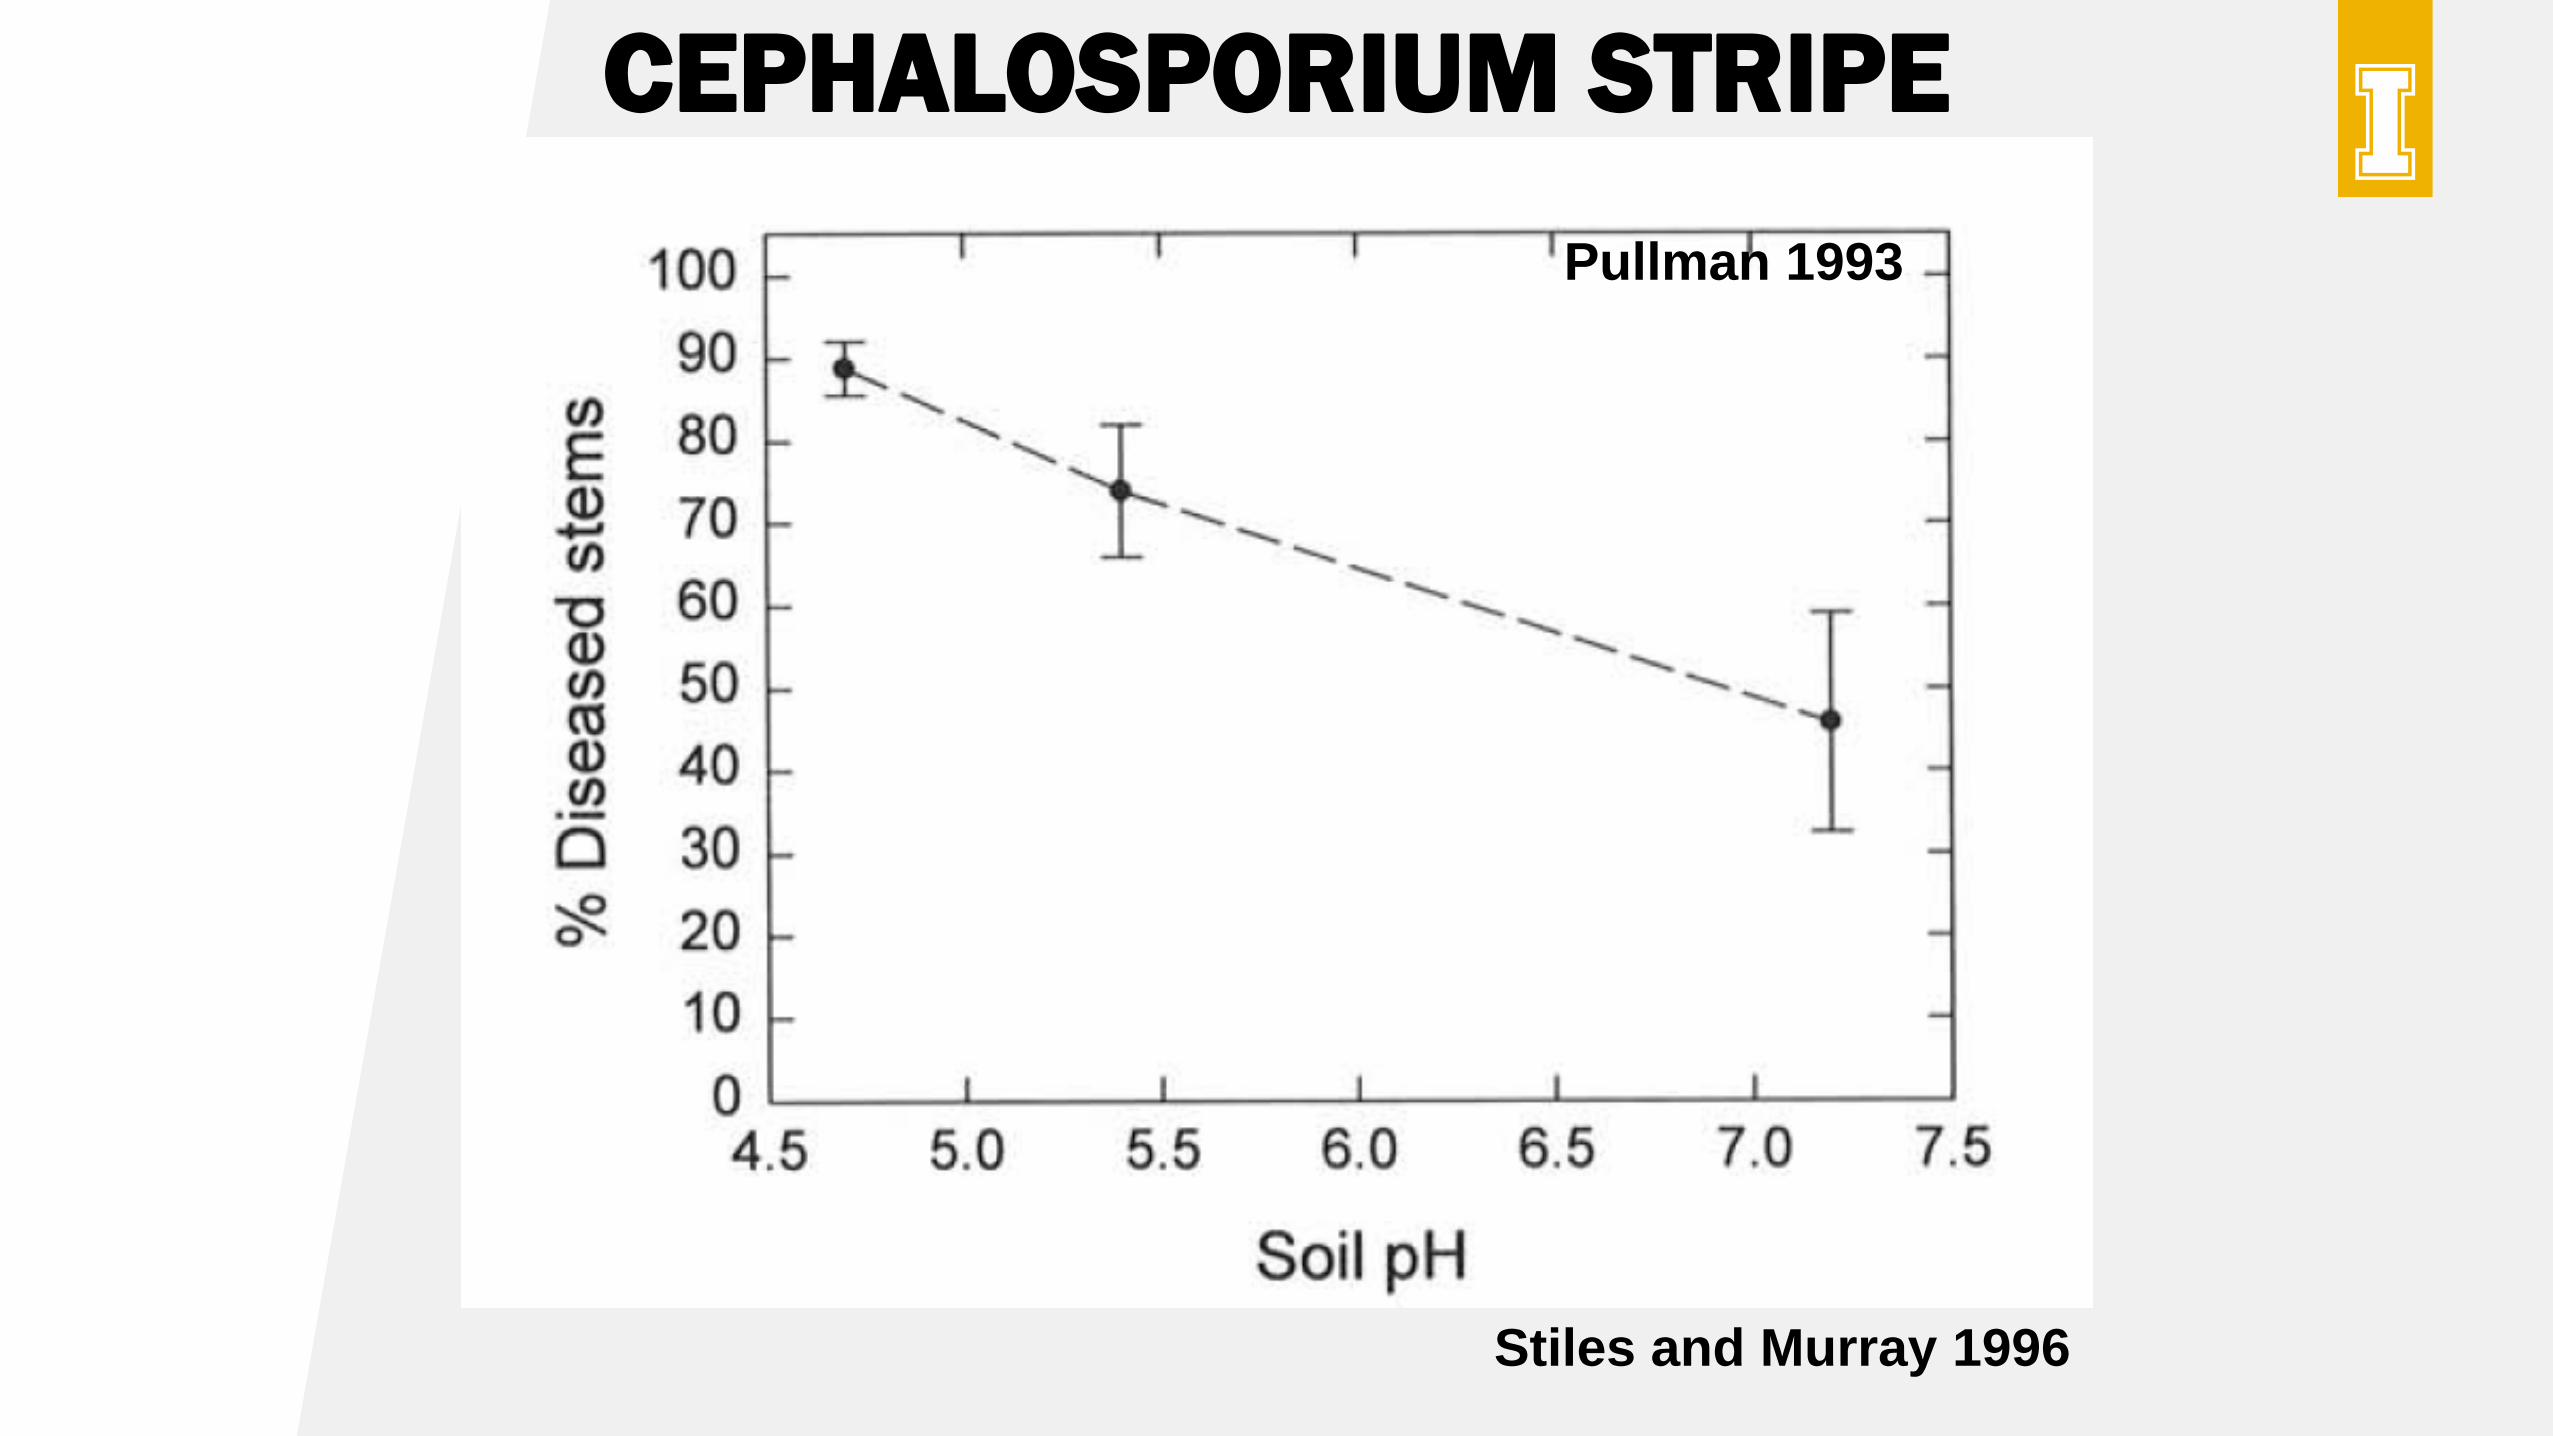
CEPHALOSPORIUM STRIPE
Pullman 1993
Stiles and Murray 1996
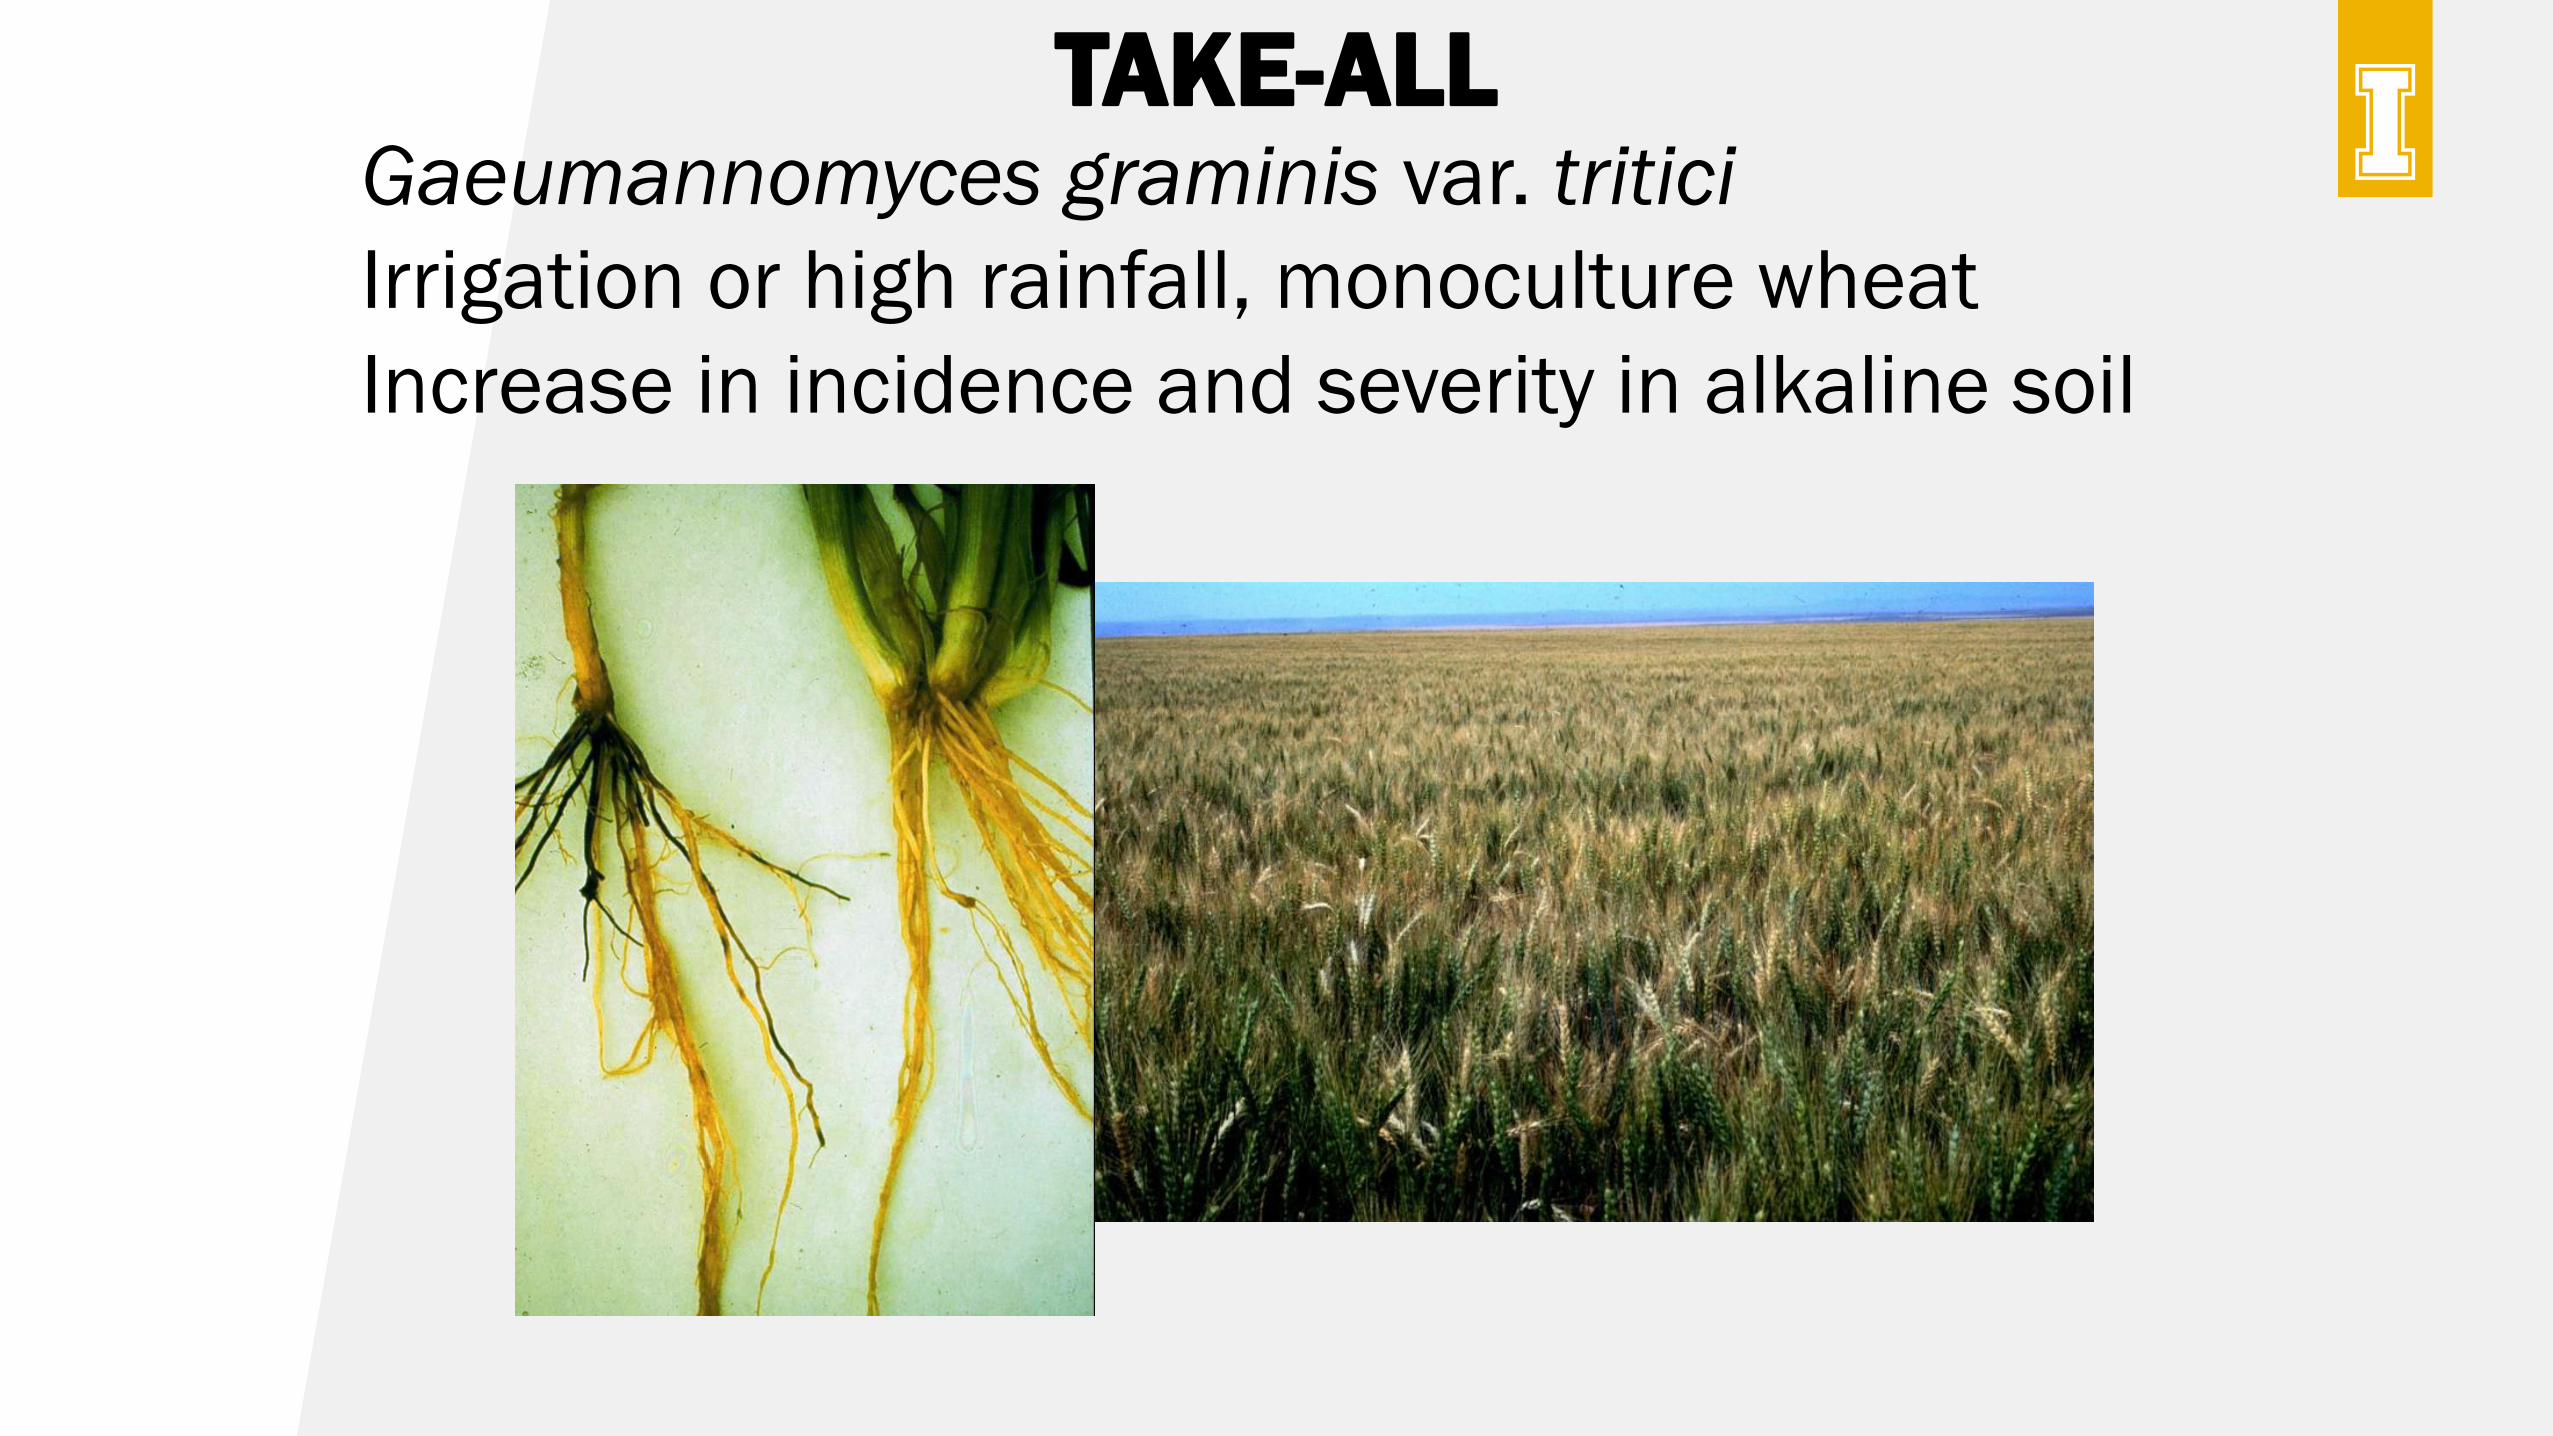
TAKE-ALLGaeumannomyces graminis var. tritici
Irrigation or high rainfall, monoculture wheat
Increase in incidence and severity in alkaline soil
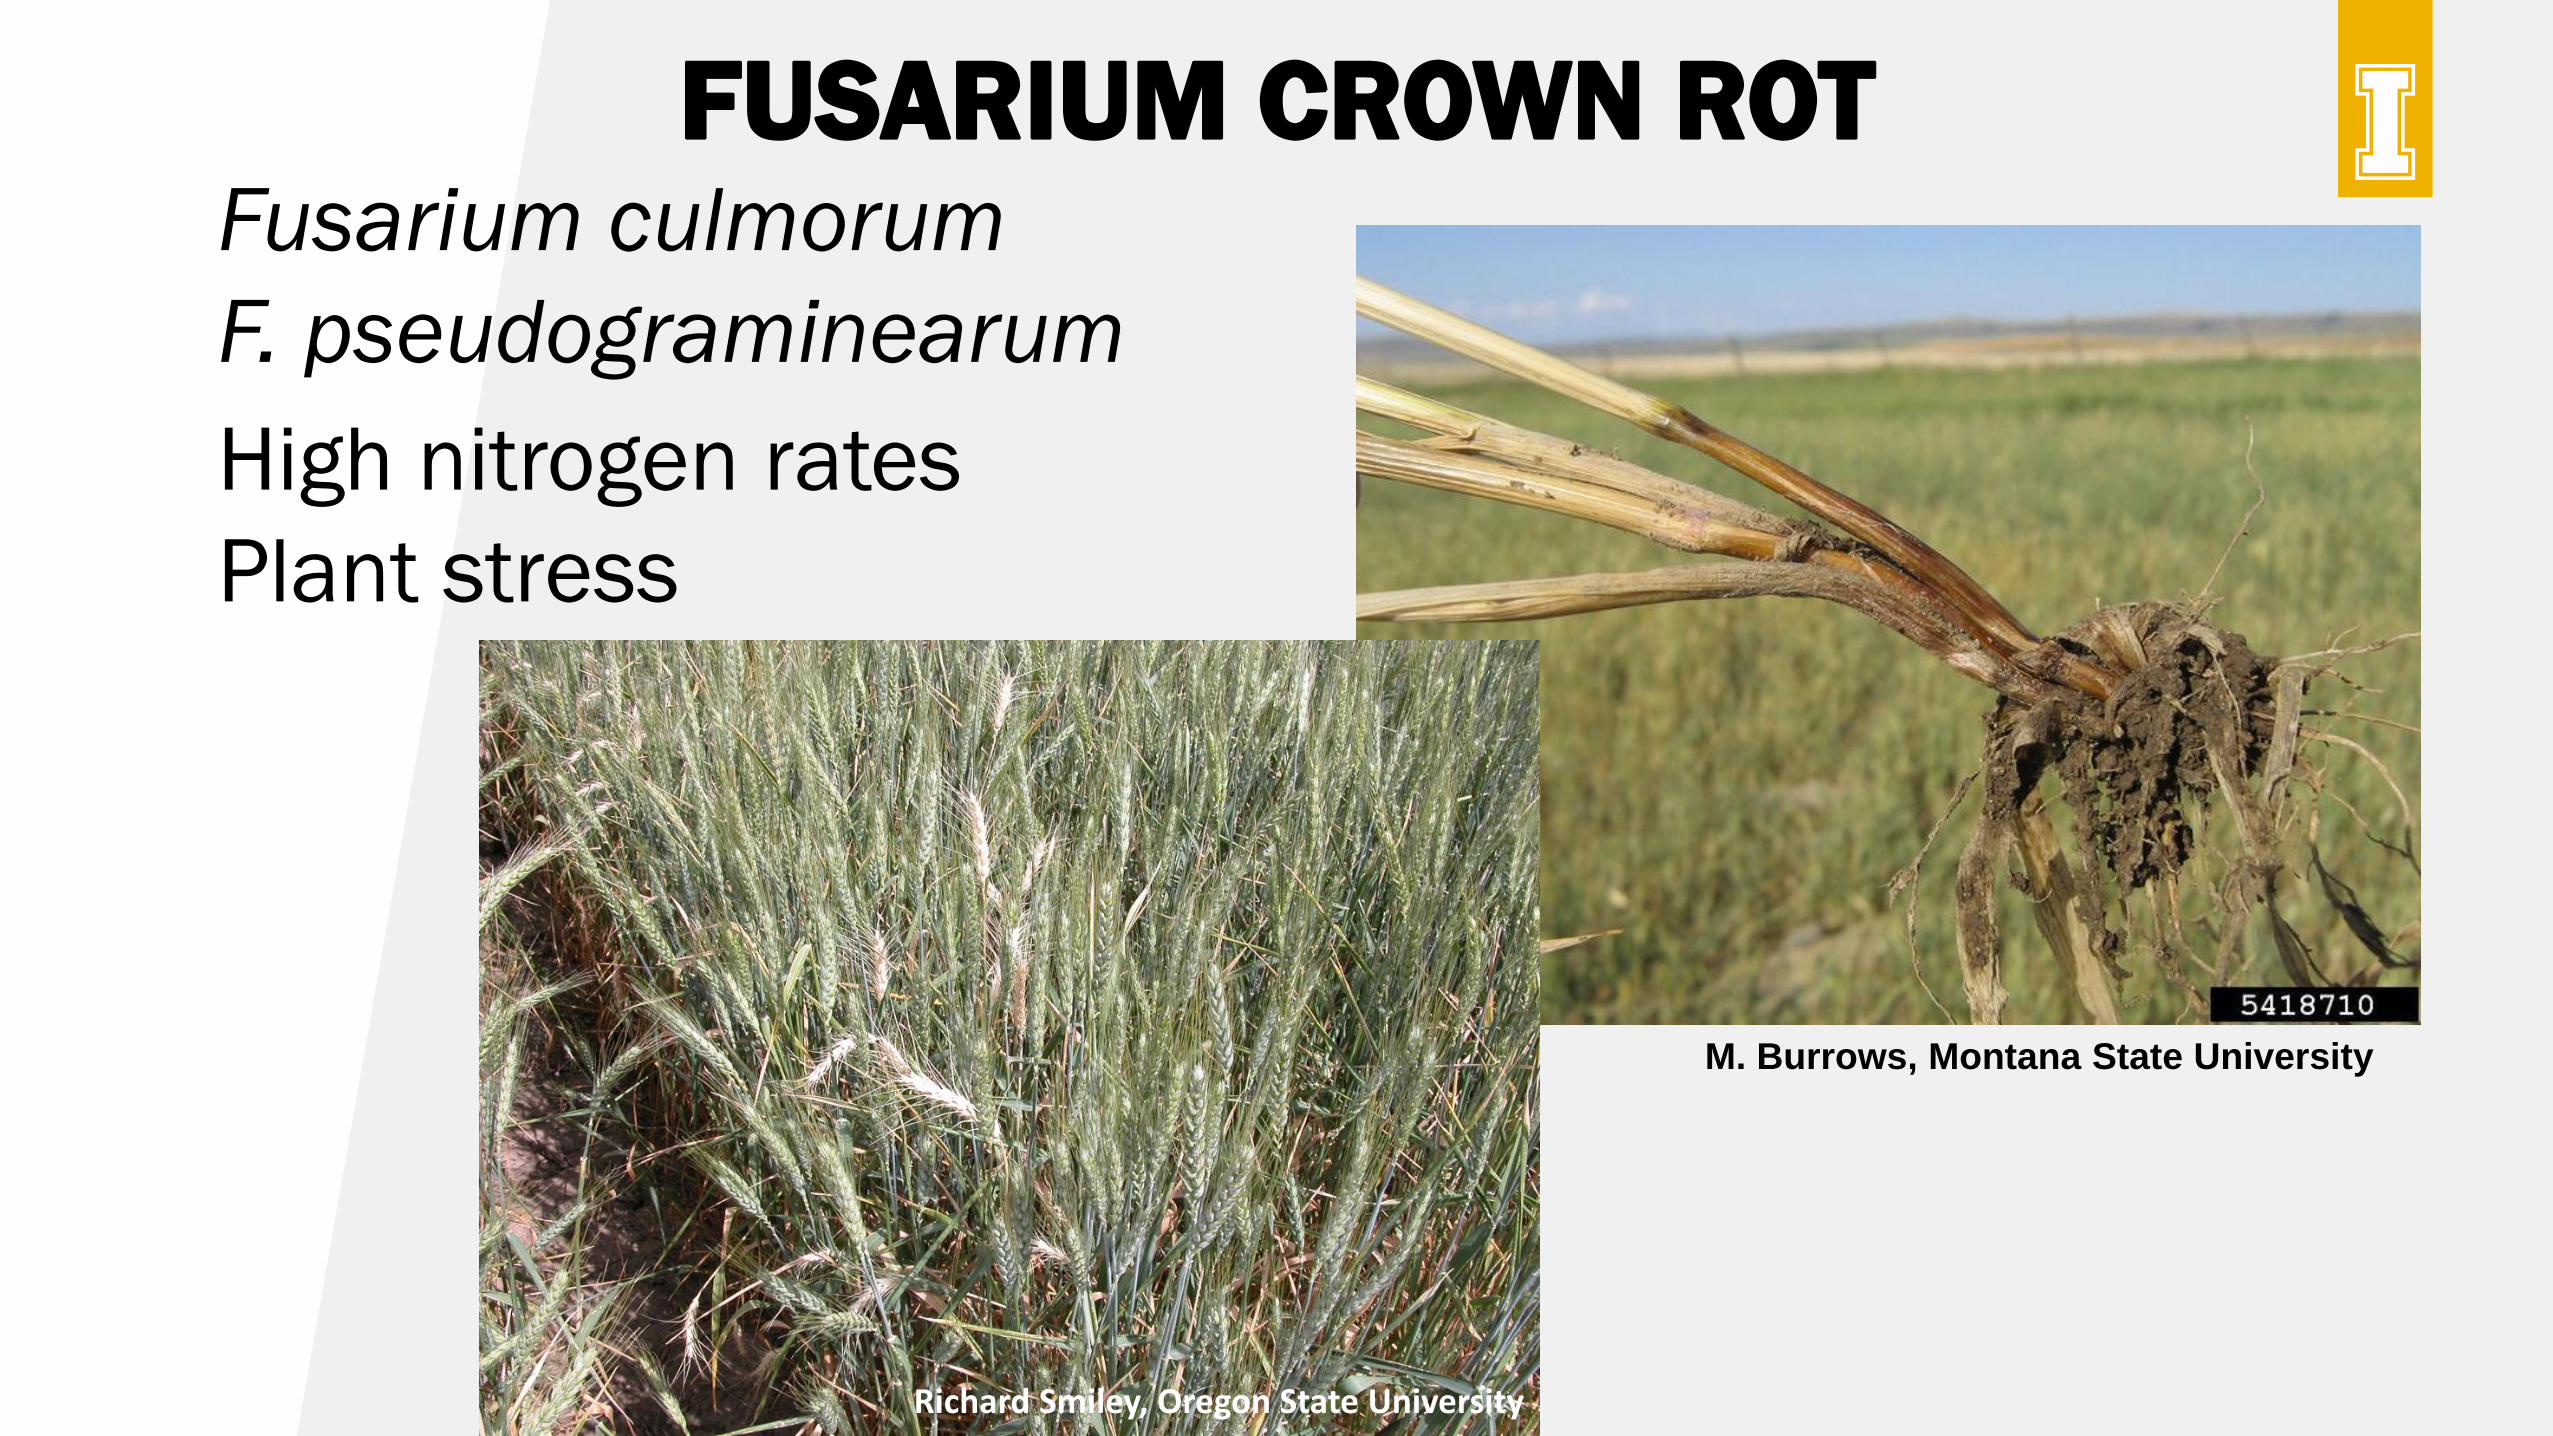
FUSARIUM CROWN ROTFusarium culmorum
F. pseudograminearum
High nitrogen rates
Plant stress
M. Burrows, Montana State University
Richard Smiley, Oregon State University
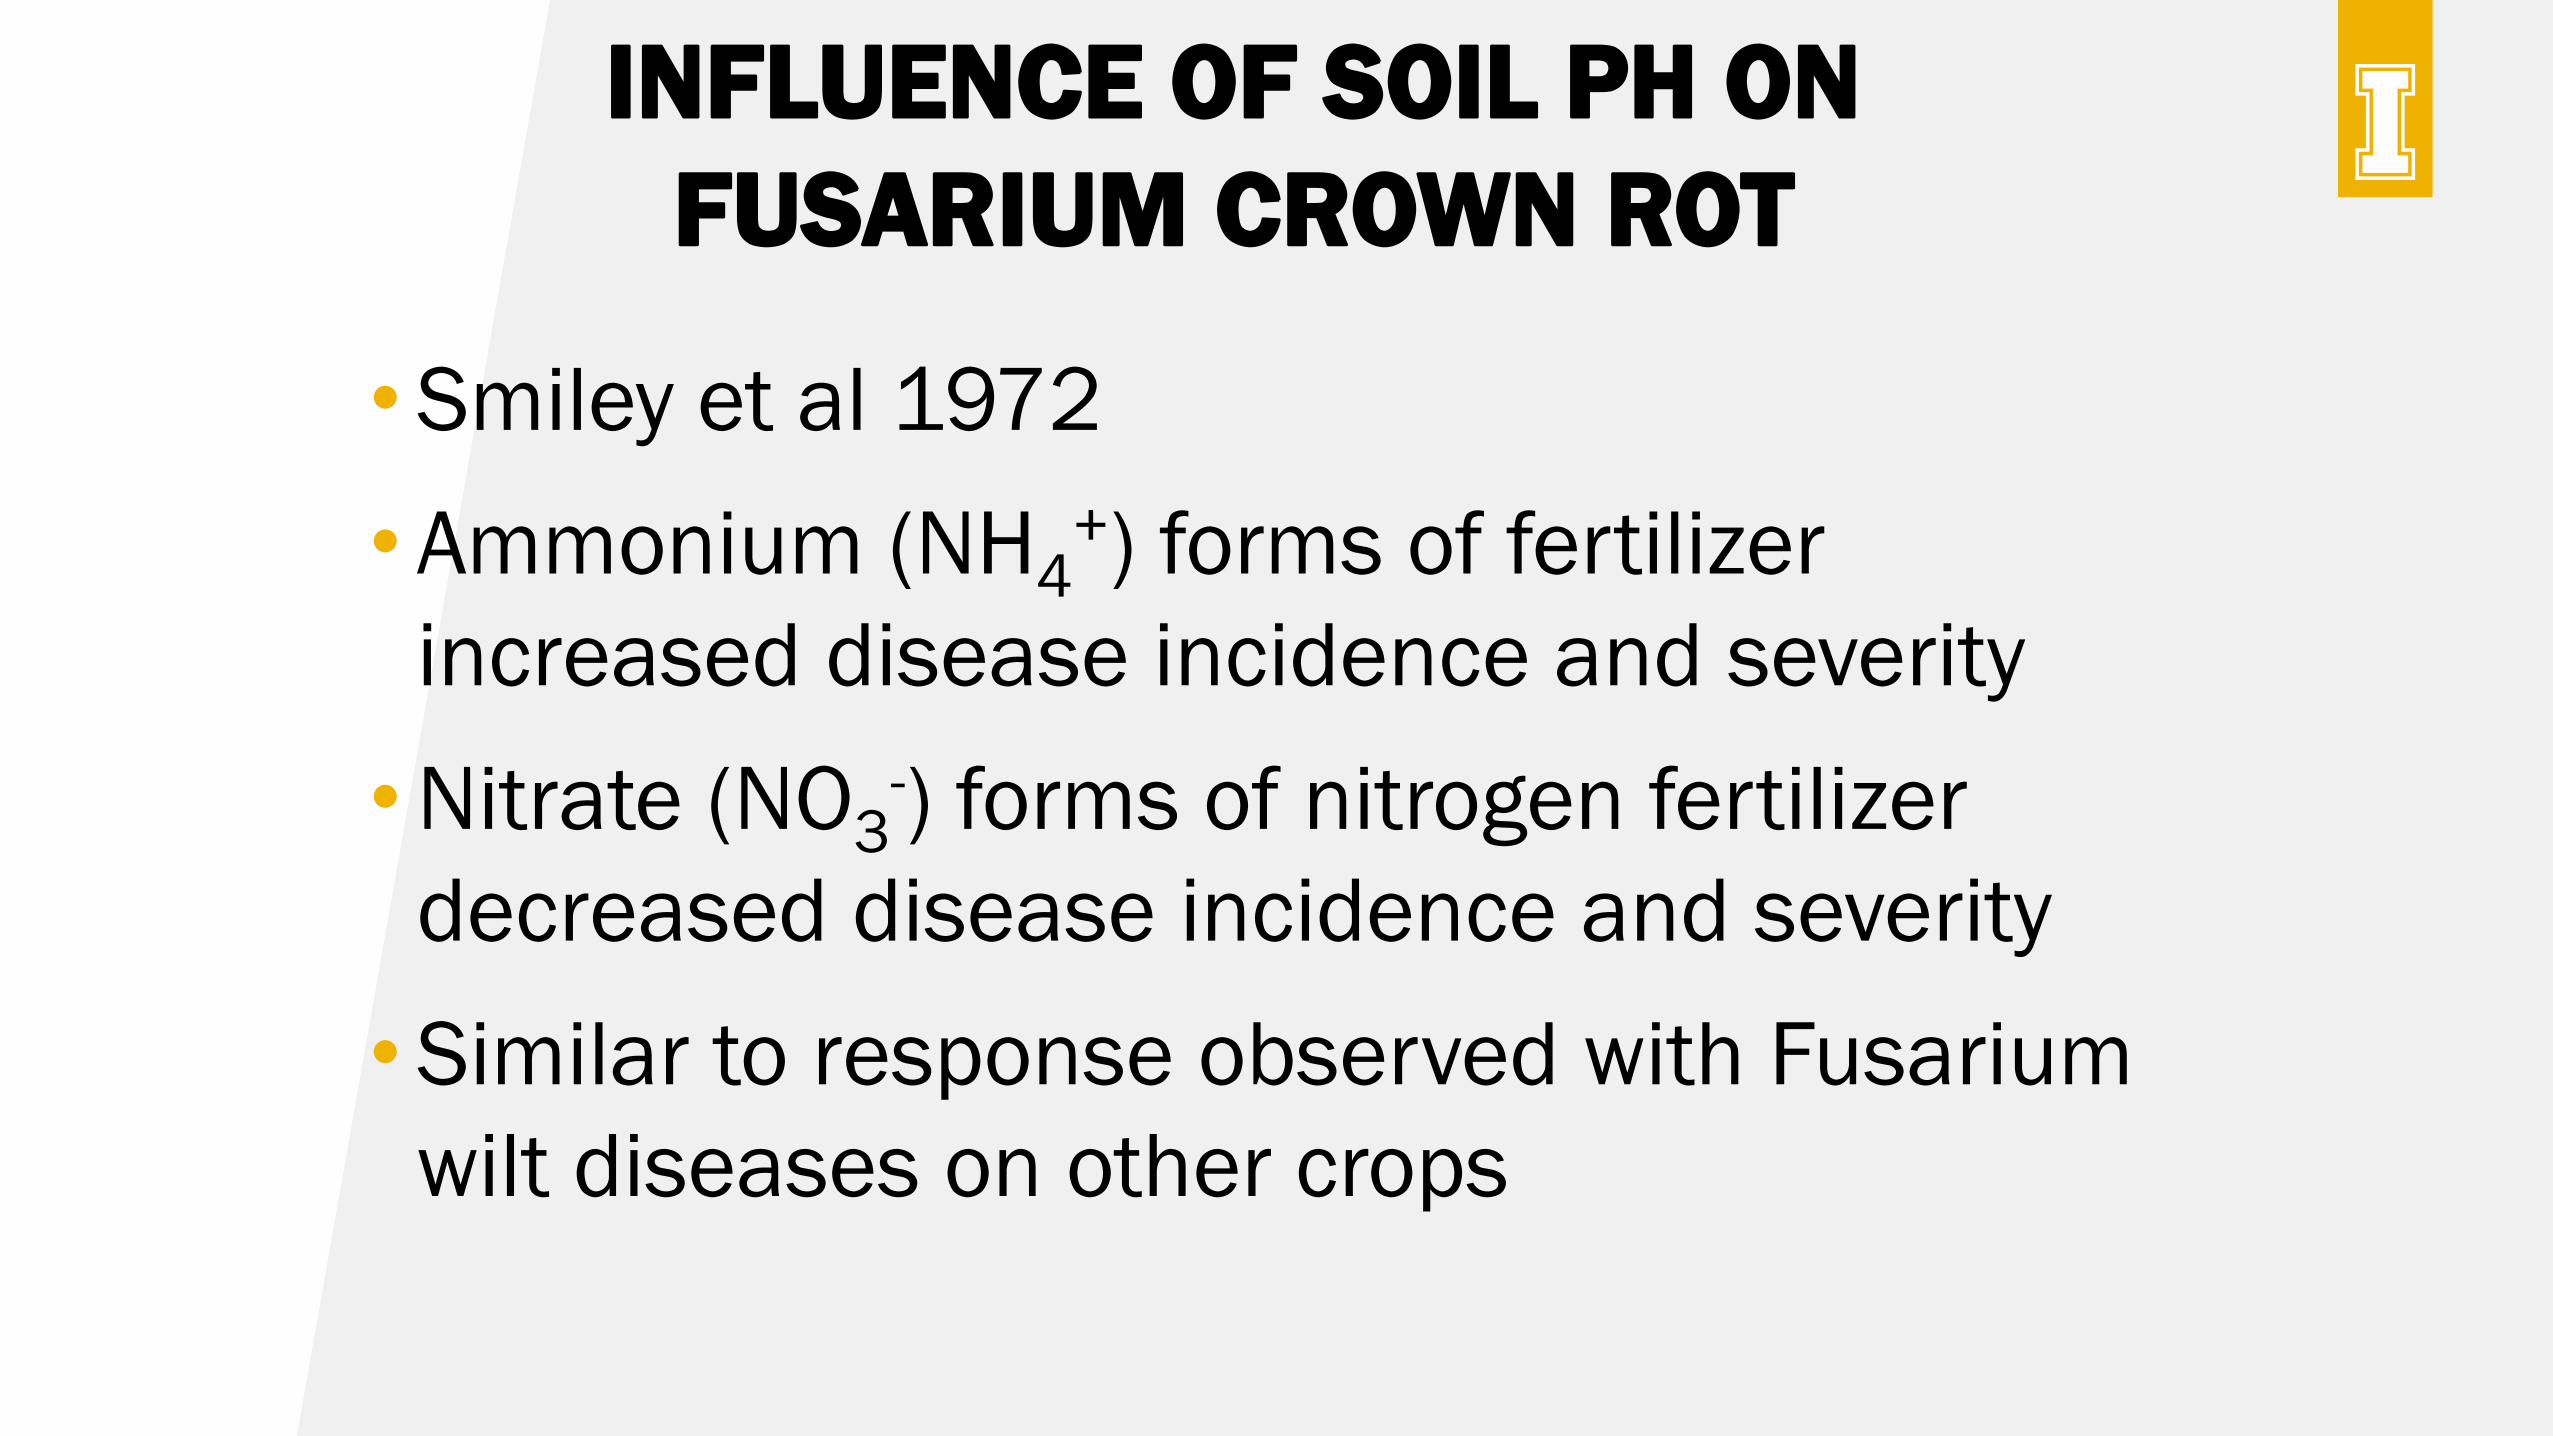
•Smiley et al 1972
• Ammonium (NH4+) forms of fertilizer
increased disease incidence and severity
•Nitrate (NO3-) forms of nitrogen fertilizer
decreased disease incidence and severity
•Similar to response observed with Fusarium
wilt diseases on other crops
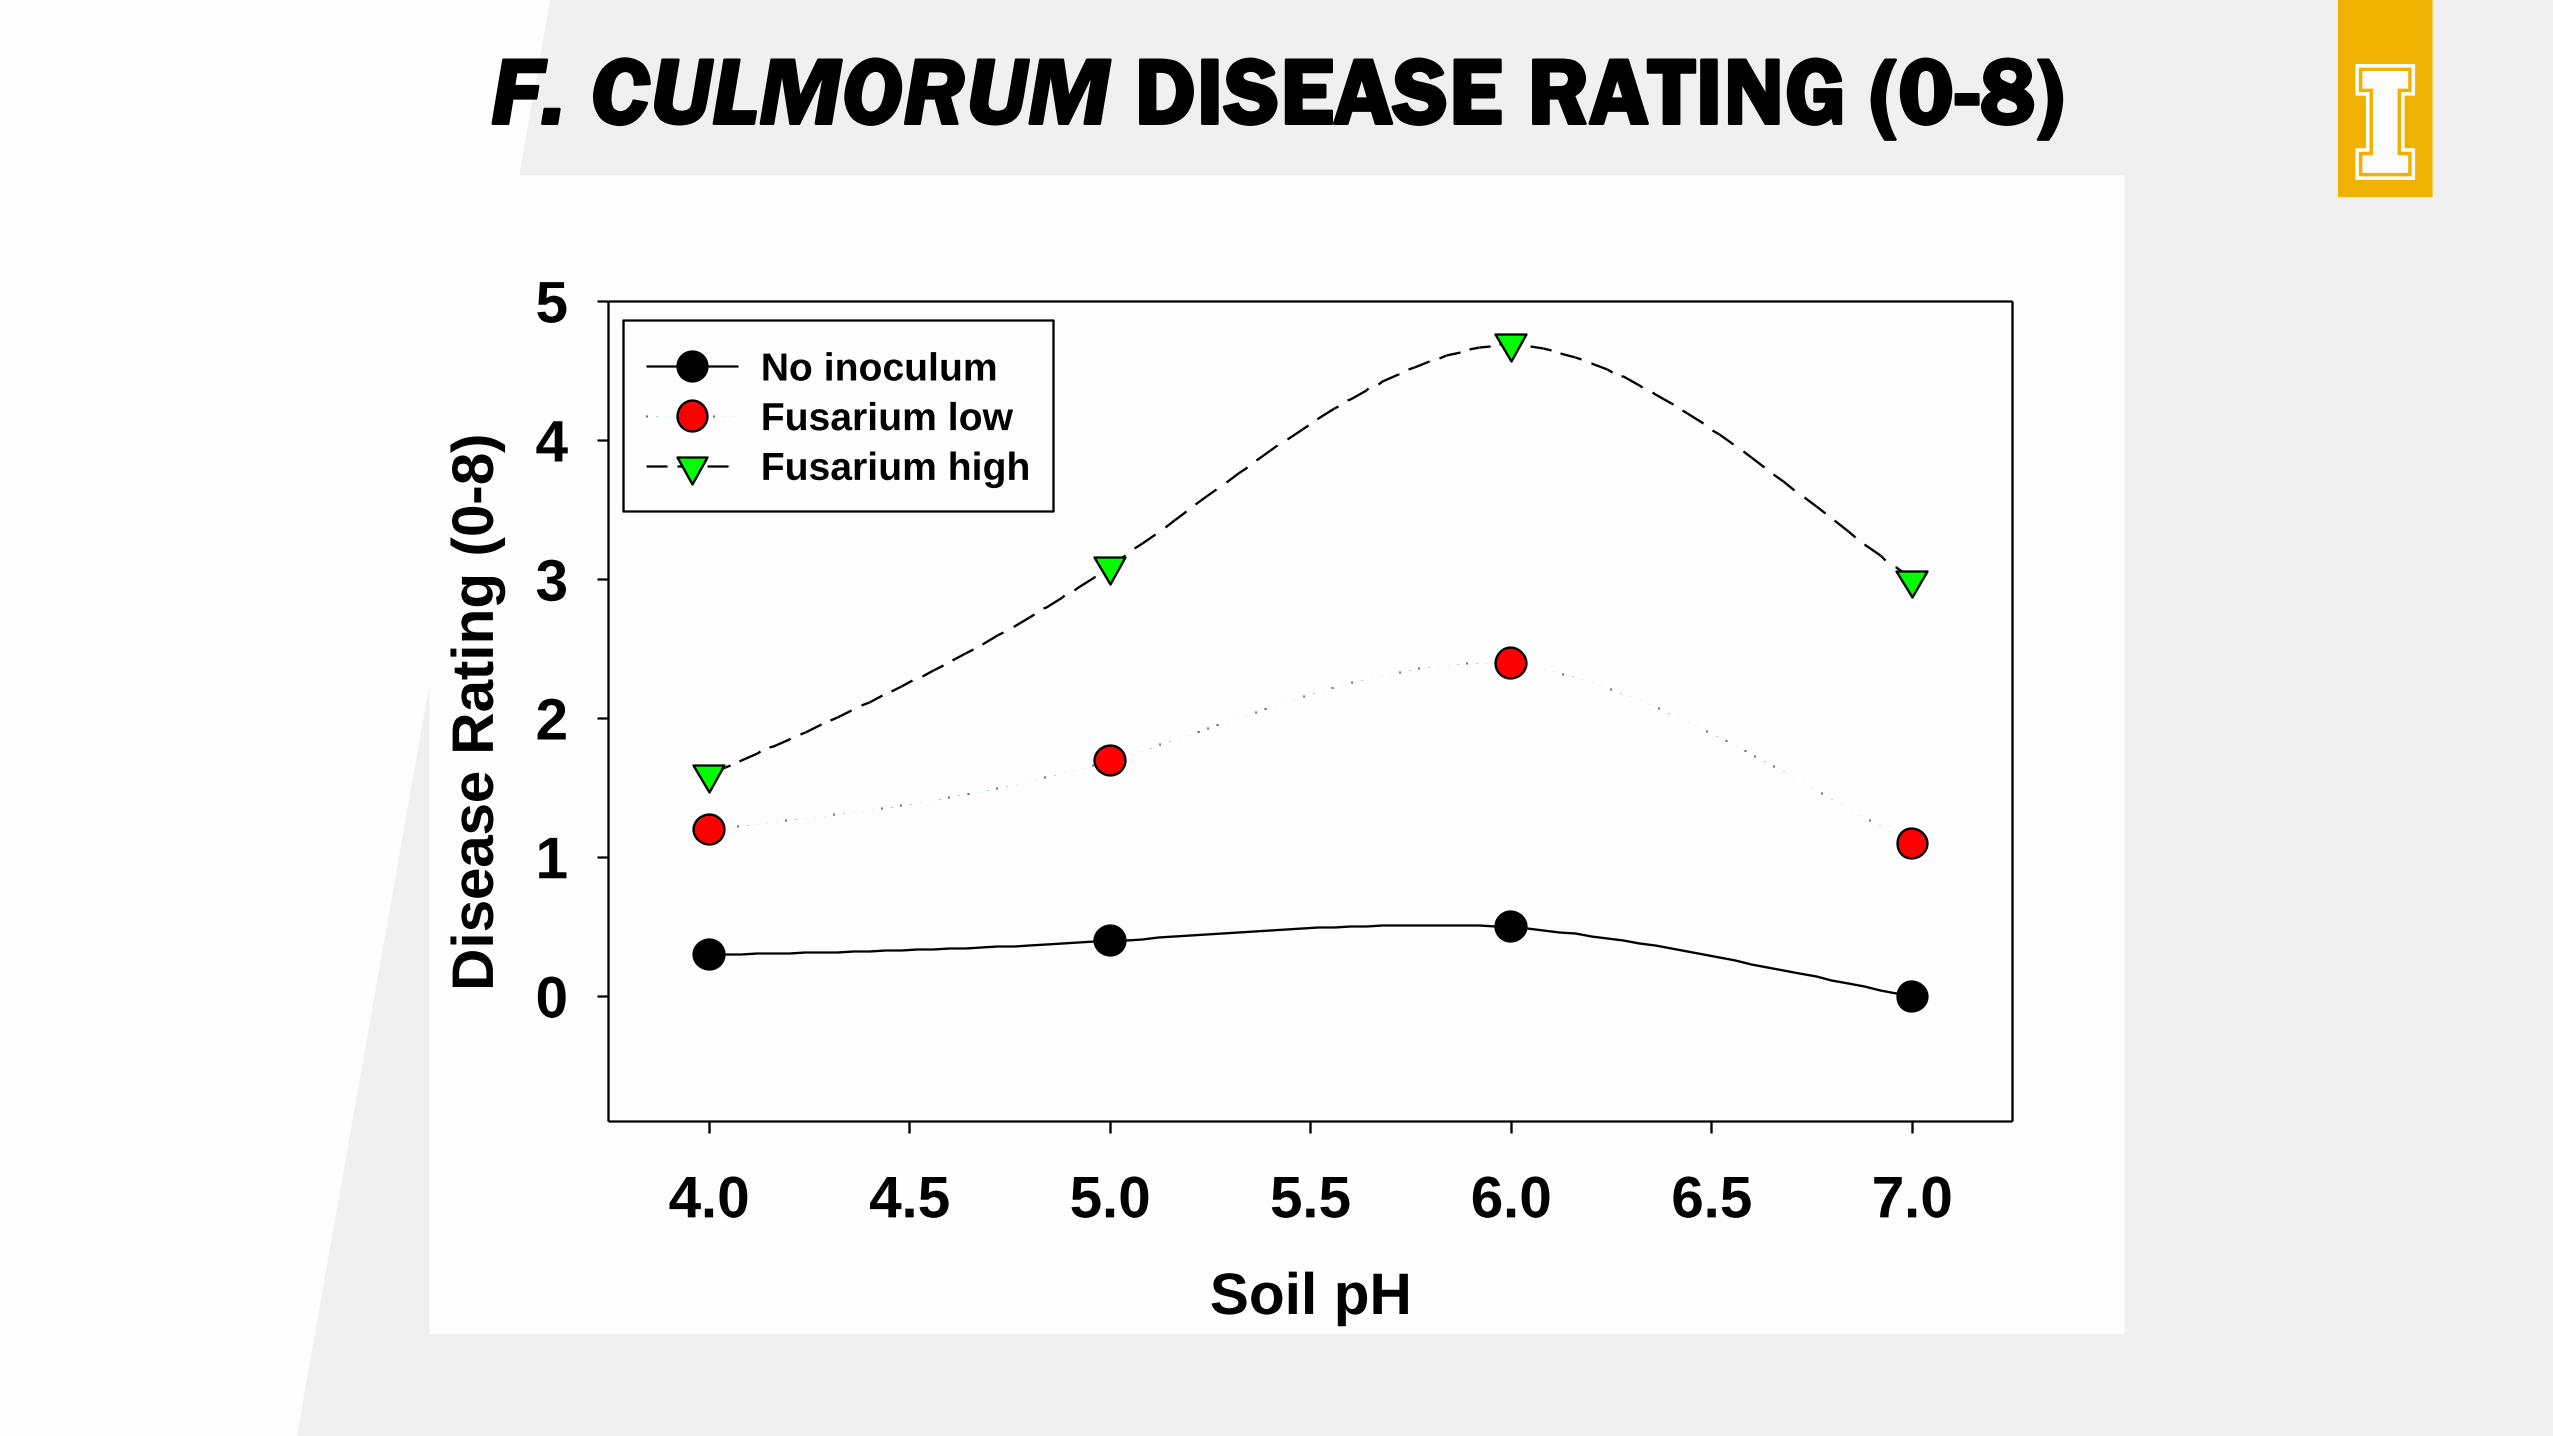
INFLUENCE OF SOIL PH ON
FUSARIUM CROWN ROT
INFLUENCE OF SOIL PH ON
FUSARIUM CROWN ROT
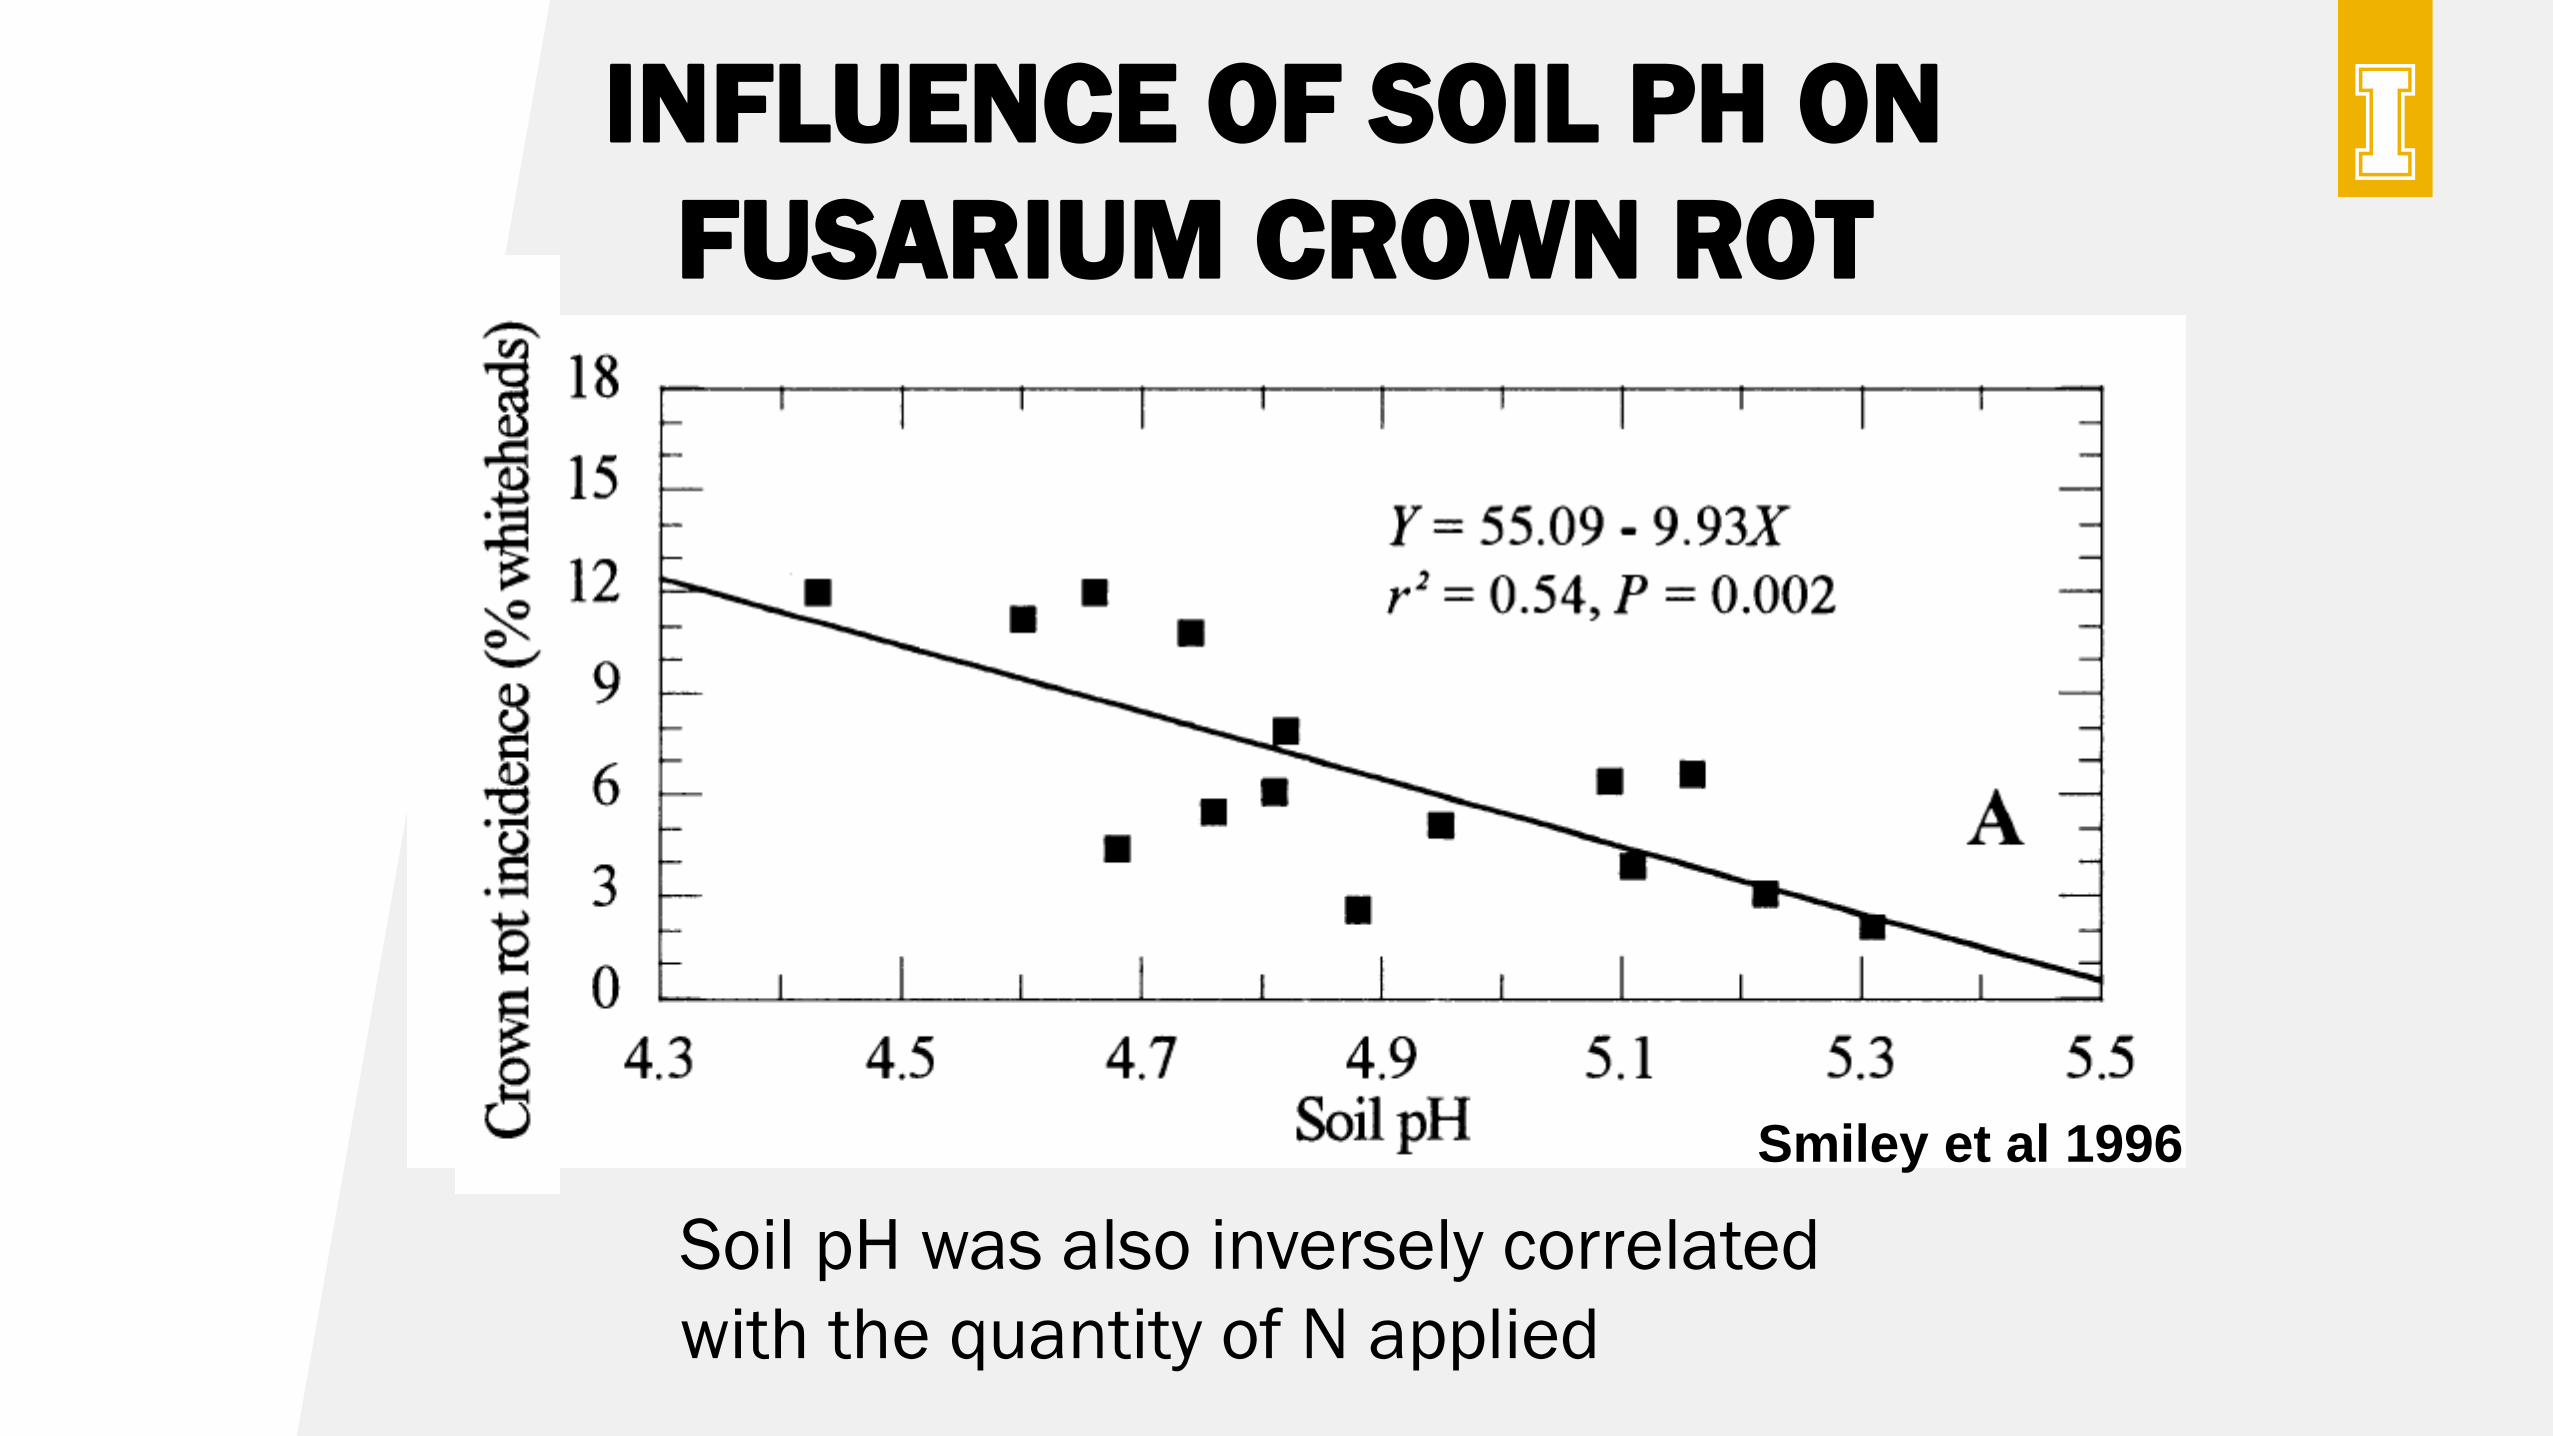
Smiley et al 1996
Soil pH was also inversely correlated
with the quantity of N applied
Soil pH
4.0 4.5 5.0 5.5 6.0 6.5 7.0
Dis
ease R
ati
ng
(0-8
)
0
1
2
3
4
5No inoculum
Fusarium low
Fusarium high
F. CULMORUM DISEASE RATING (0-8)
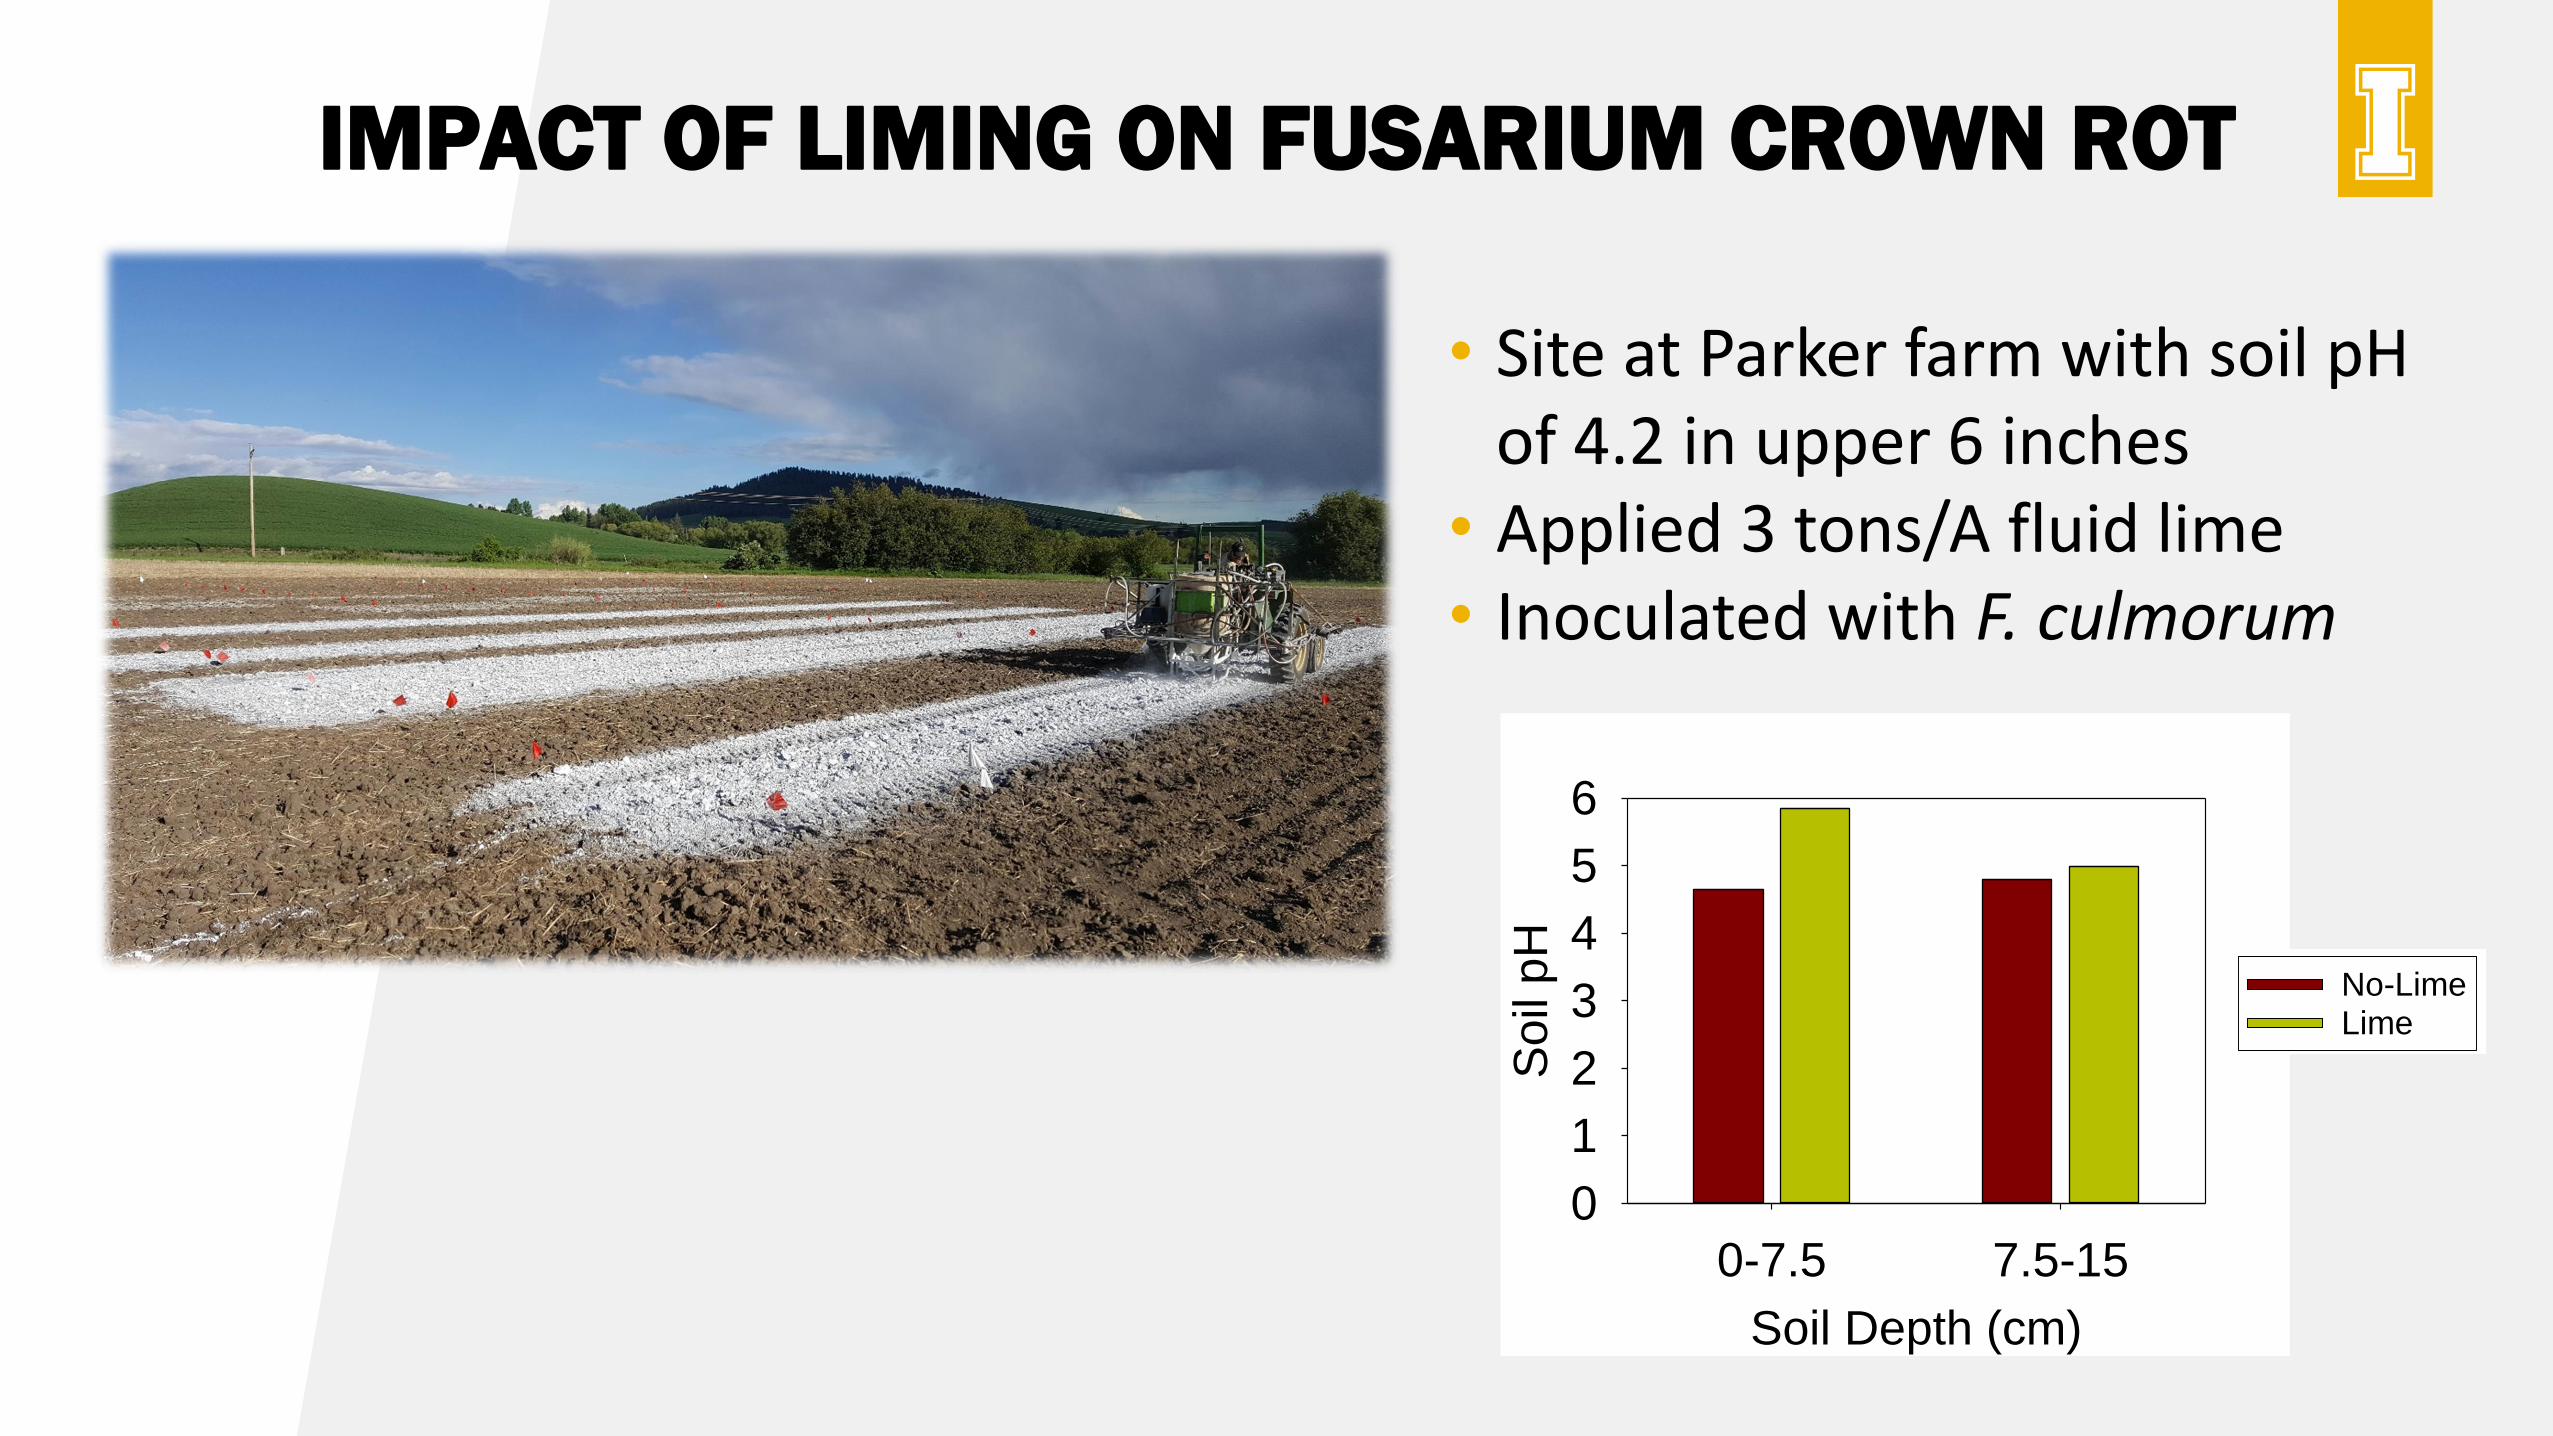
IMPACT OF LIMING ON FUSARIUM CROWN ROT
• Site at Parker farm with soil pH of 4.2 in upper 6 inches
• Applied 3 tons/A fluid lime• Inoculated with F. culmorum
Soil Depth (cm)
0-7.5 7.5-15
So
il p
H
0
1
2
3
4
5
6
2016
Glee Hartline
Dis
ea
se
Incid
en
ce
(%
)
0
20
40
60
80
No-LimeLime

F. CULMORUM RESPONSE TO LIMING
2016
Glee Hartline
Yie
ld (
bu
/A)
0
10
20
30
40
50
602016
Glee Hartline
Dis
ea
se
Incid
en
ce
(%
)
0
20
40
60
80
2017
Glee Hartline
Yie
ld (
bu
/A)
0
10
20
30
40
50
602017
Glee Hartline
Dis
ea
se
Incid
en
ce
(%
)
0
20
40
60
80
2016
Glee Hartline
Dis
ease Incid
ence (
%)
0
20
40
60
80
No-LimeLime

IDENTIFYING ALUMINUM TOXICITY IN WHEAT
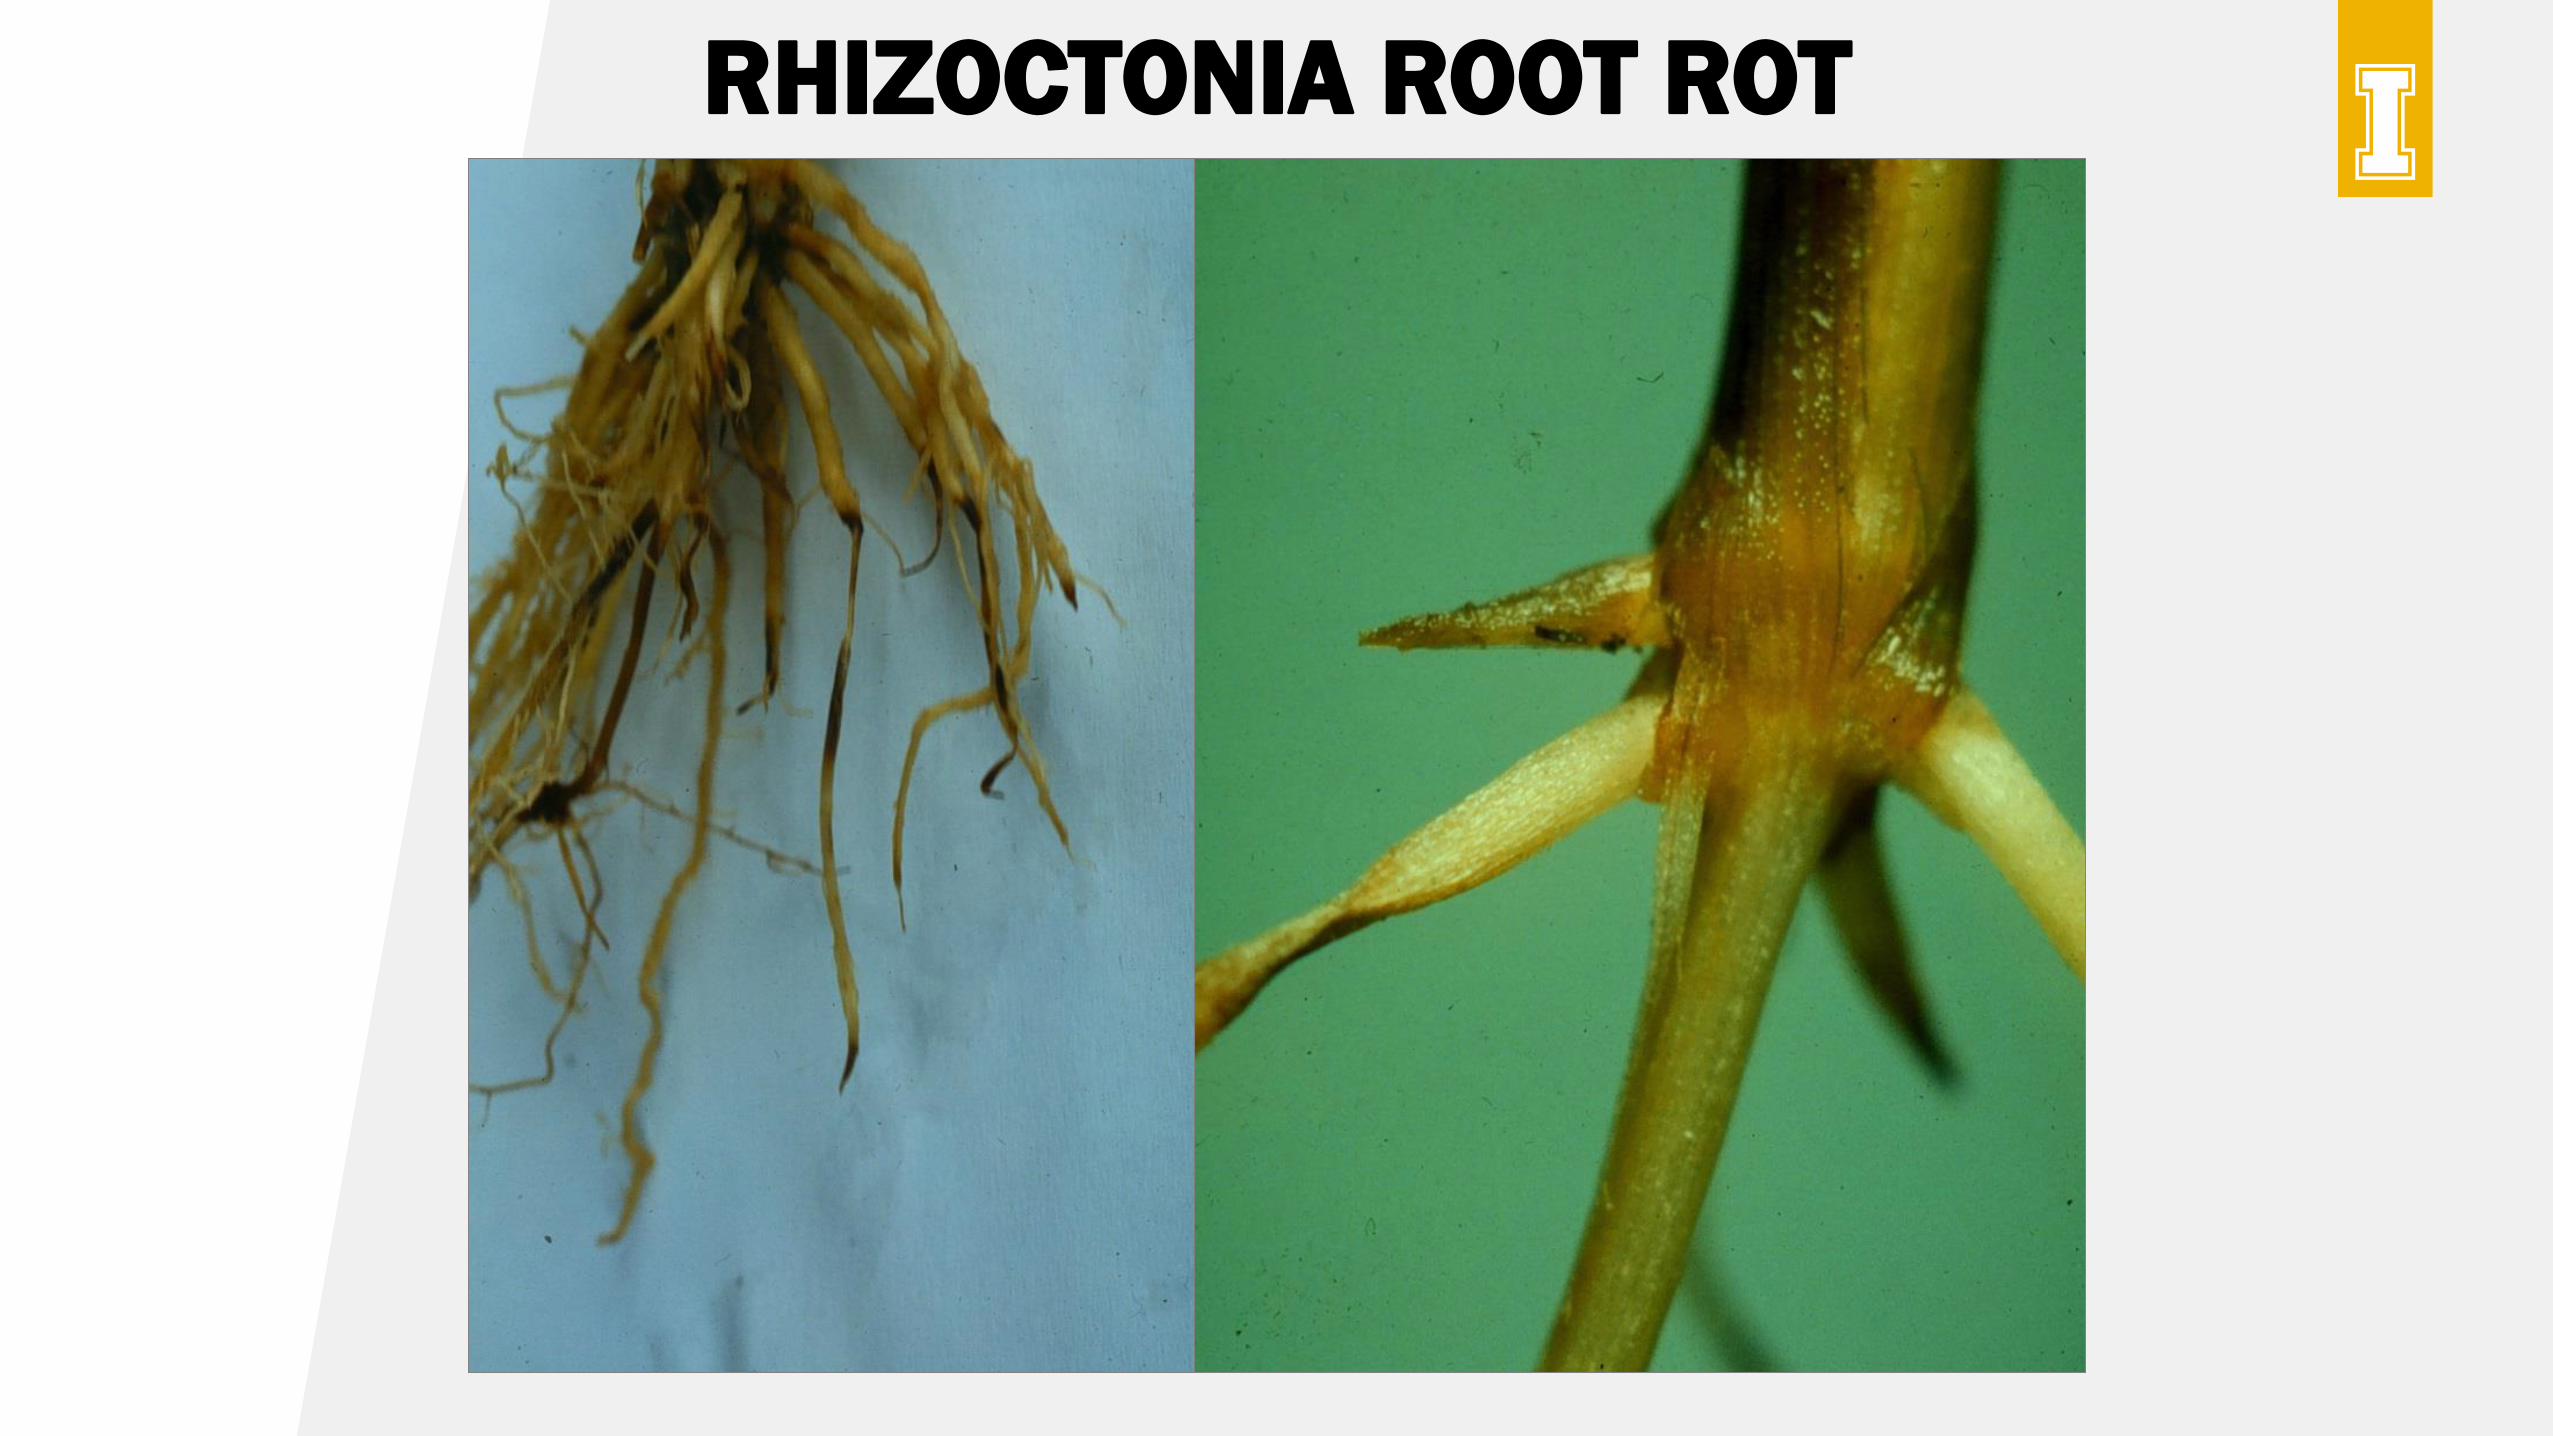
RHIZOCTONIA ROOT ROT
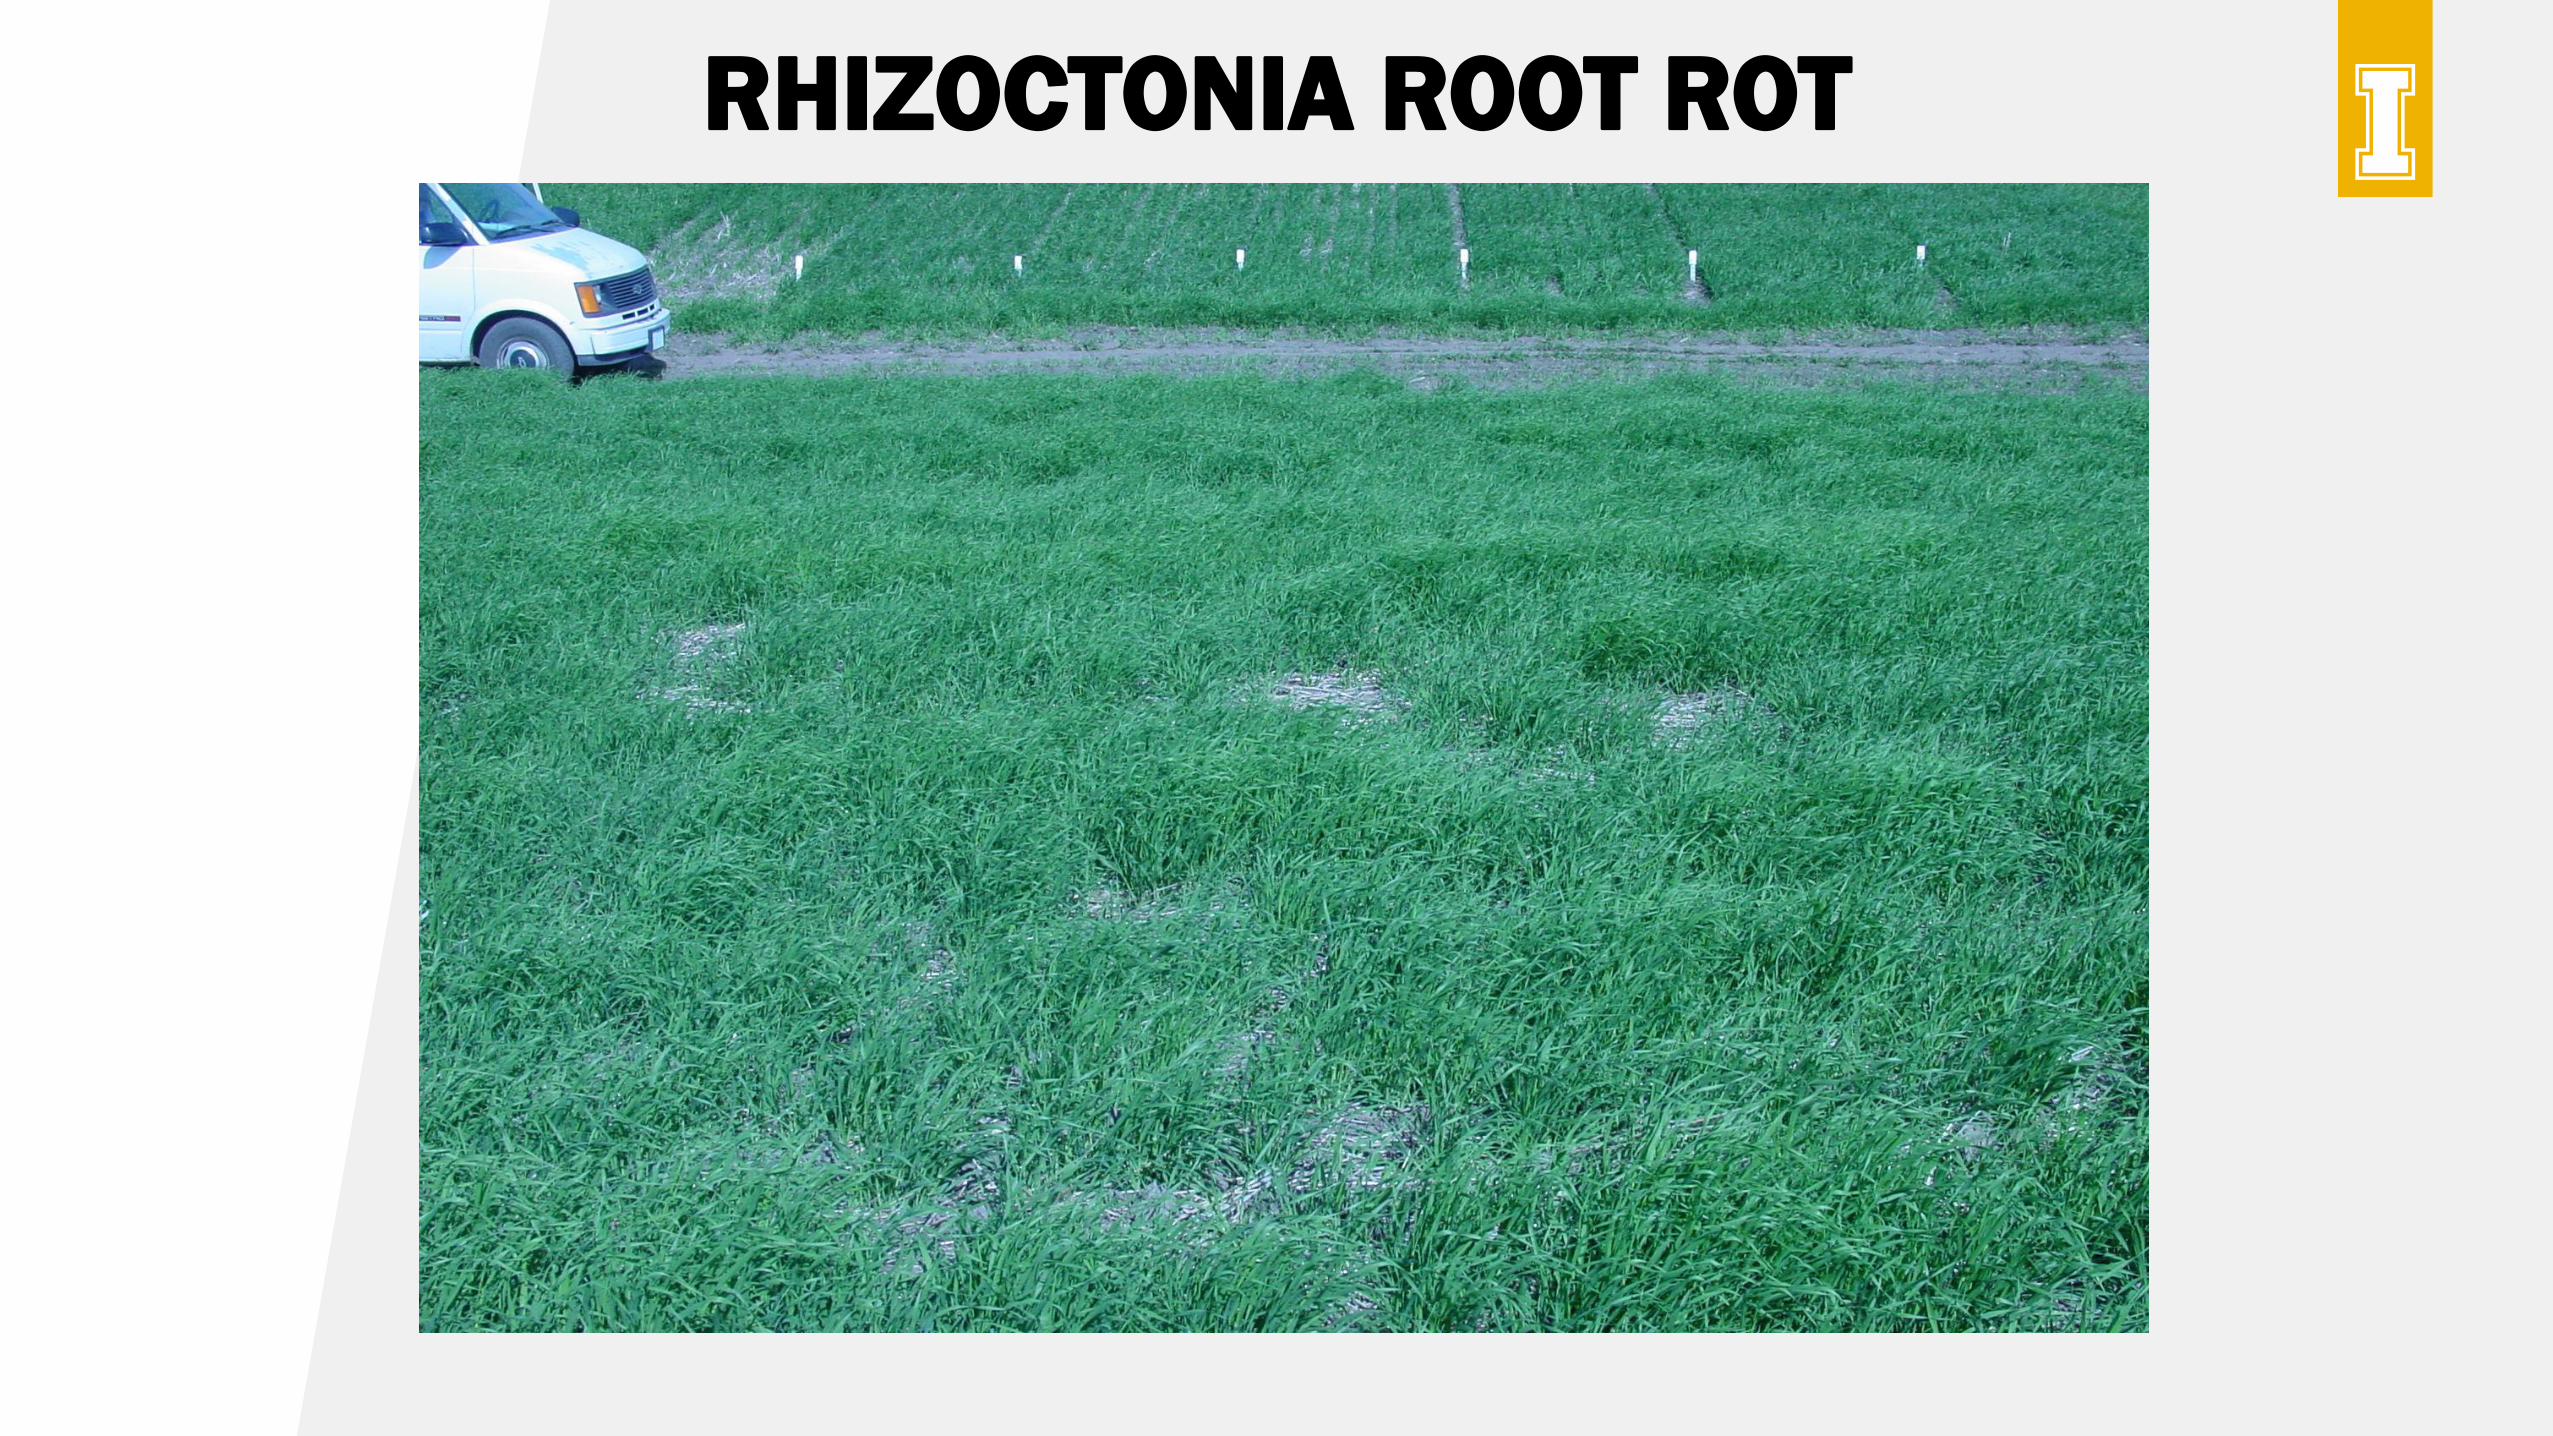
RHIZOCTONIA ROOT ROT
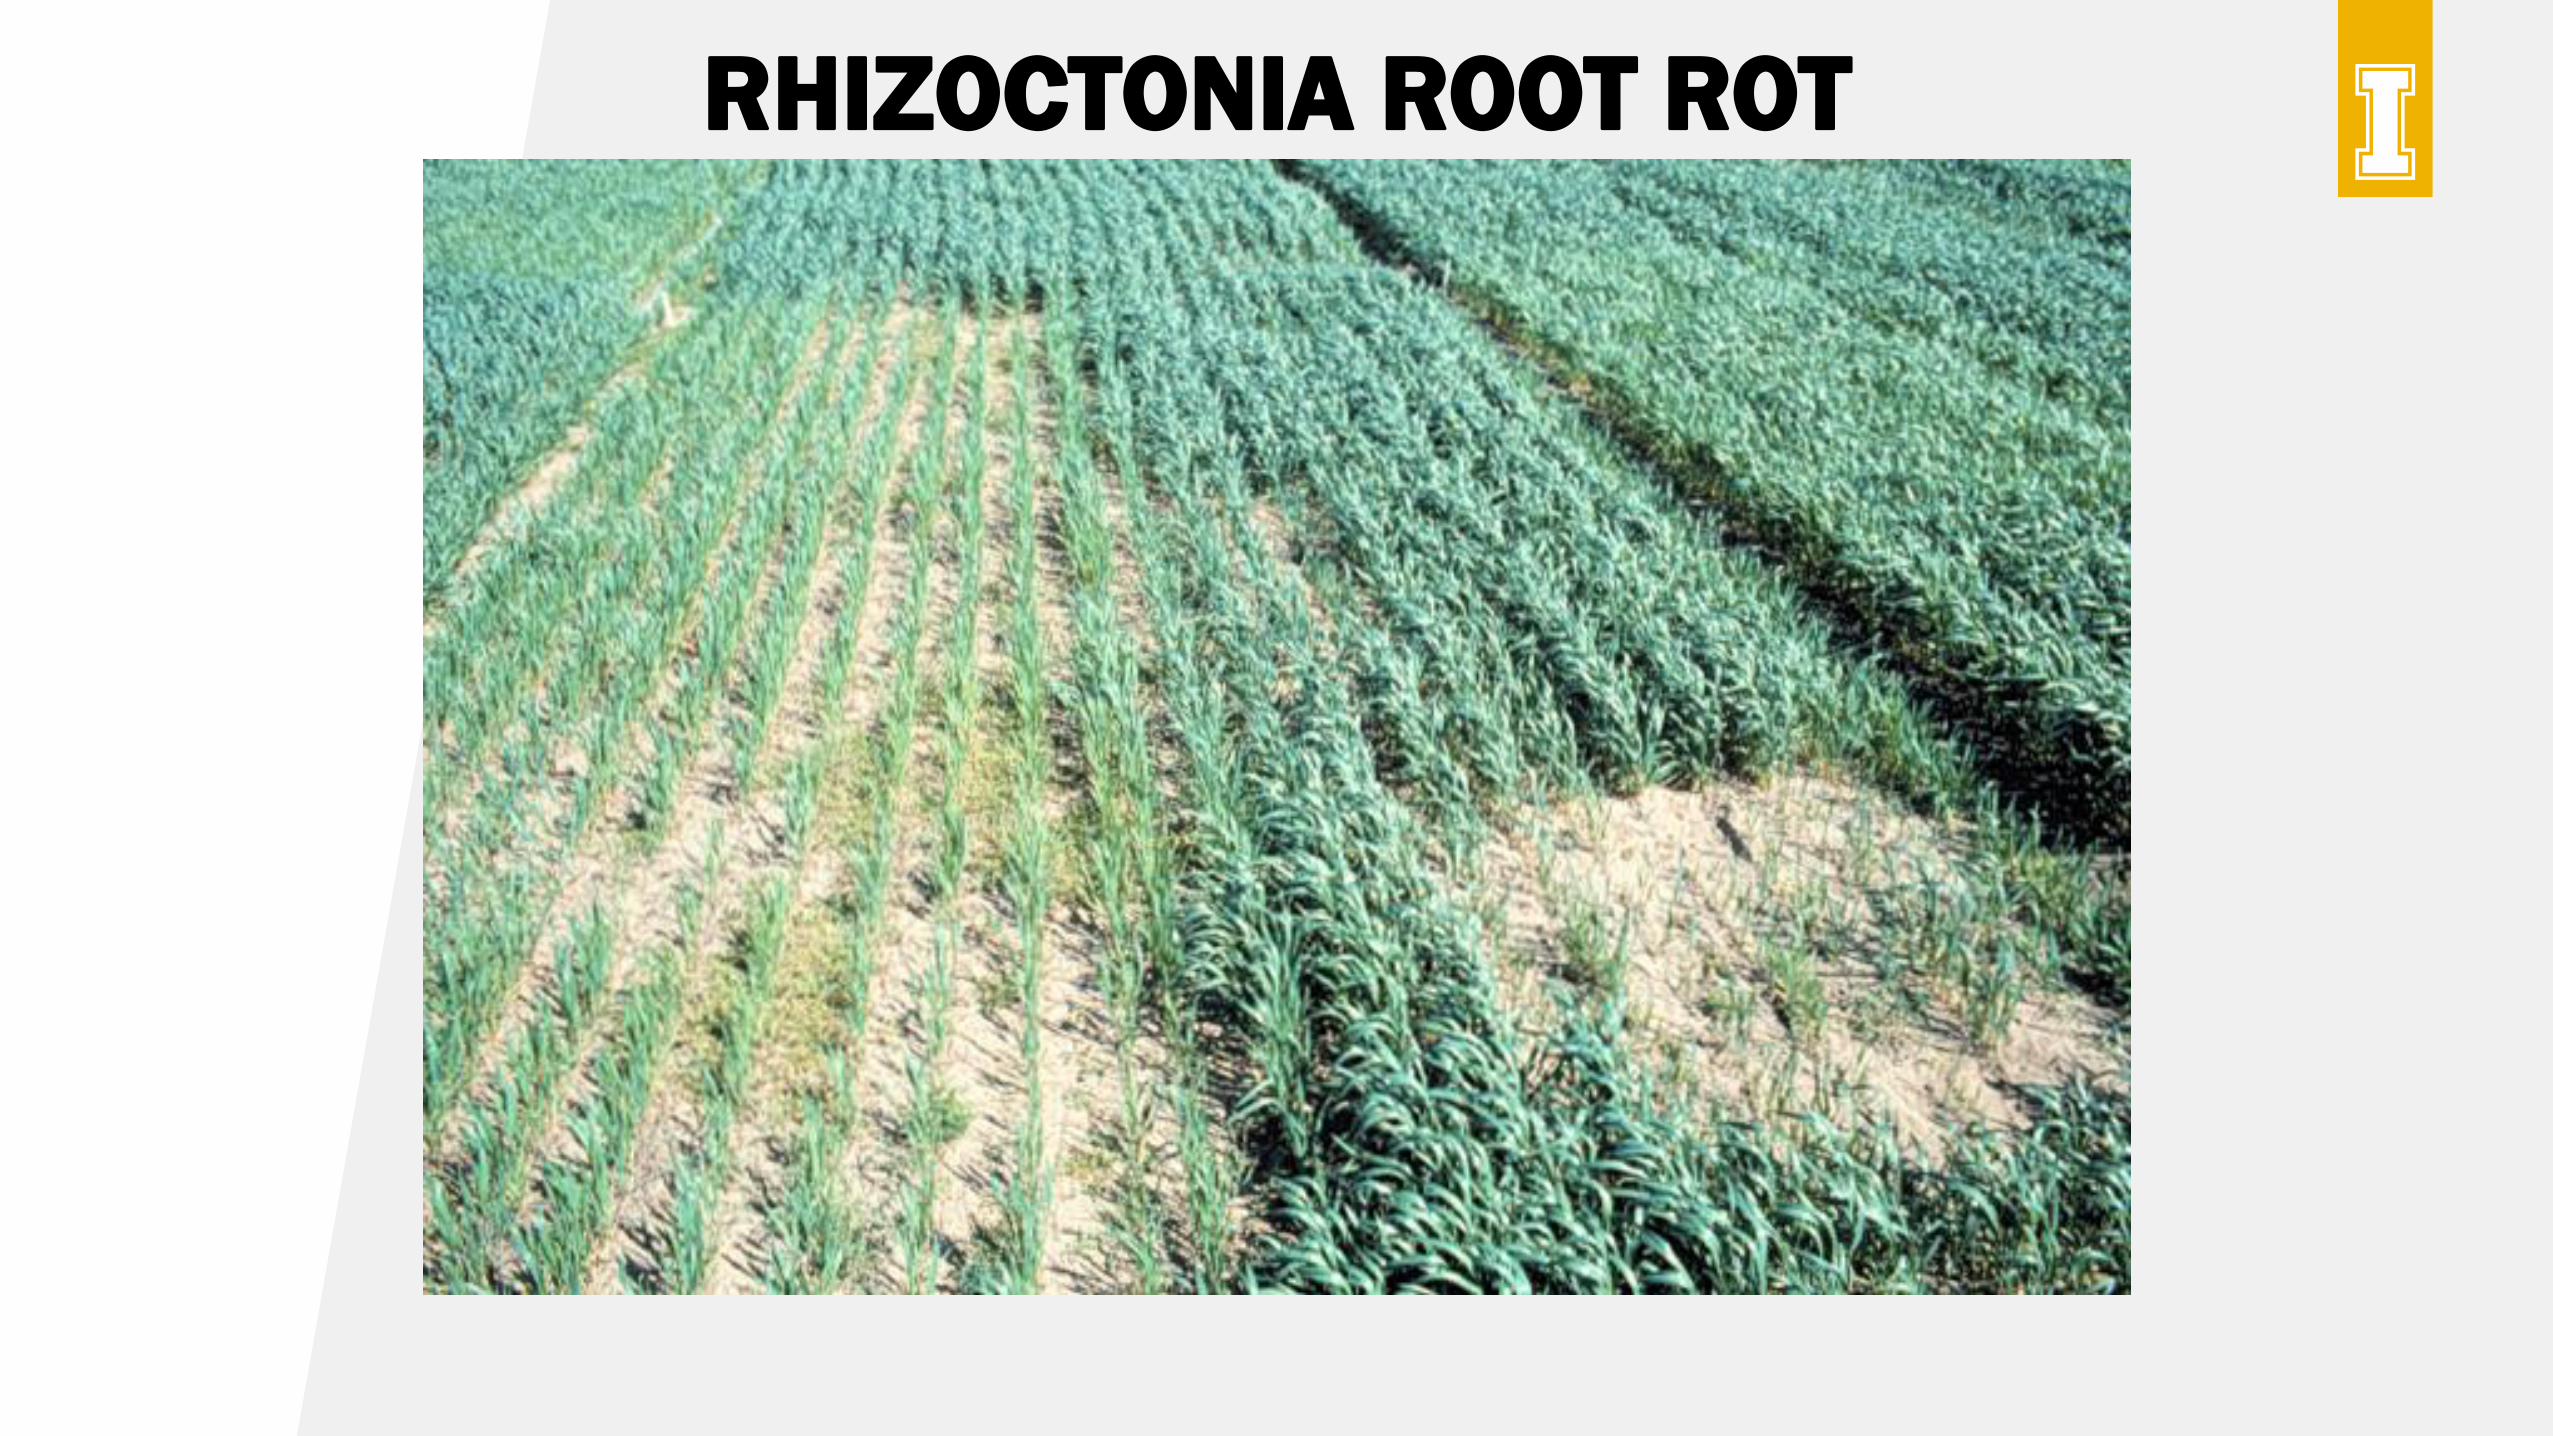
RHIZOCTONIA ROOT ROT
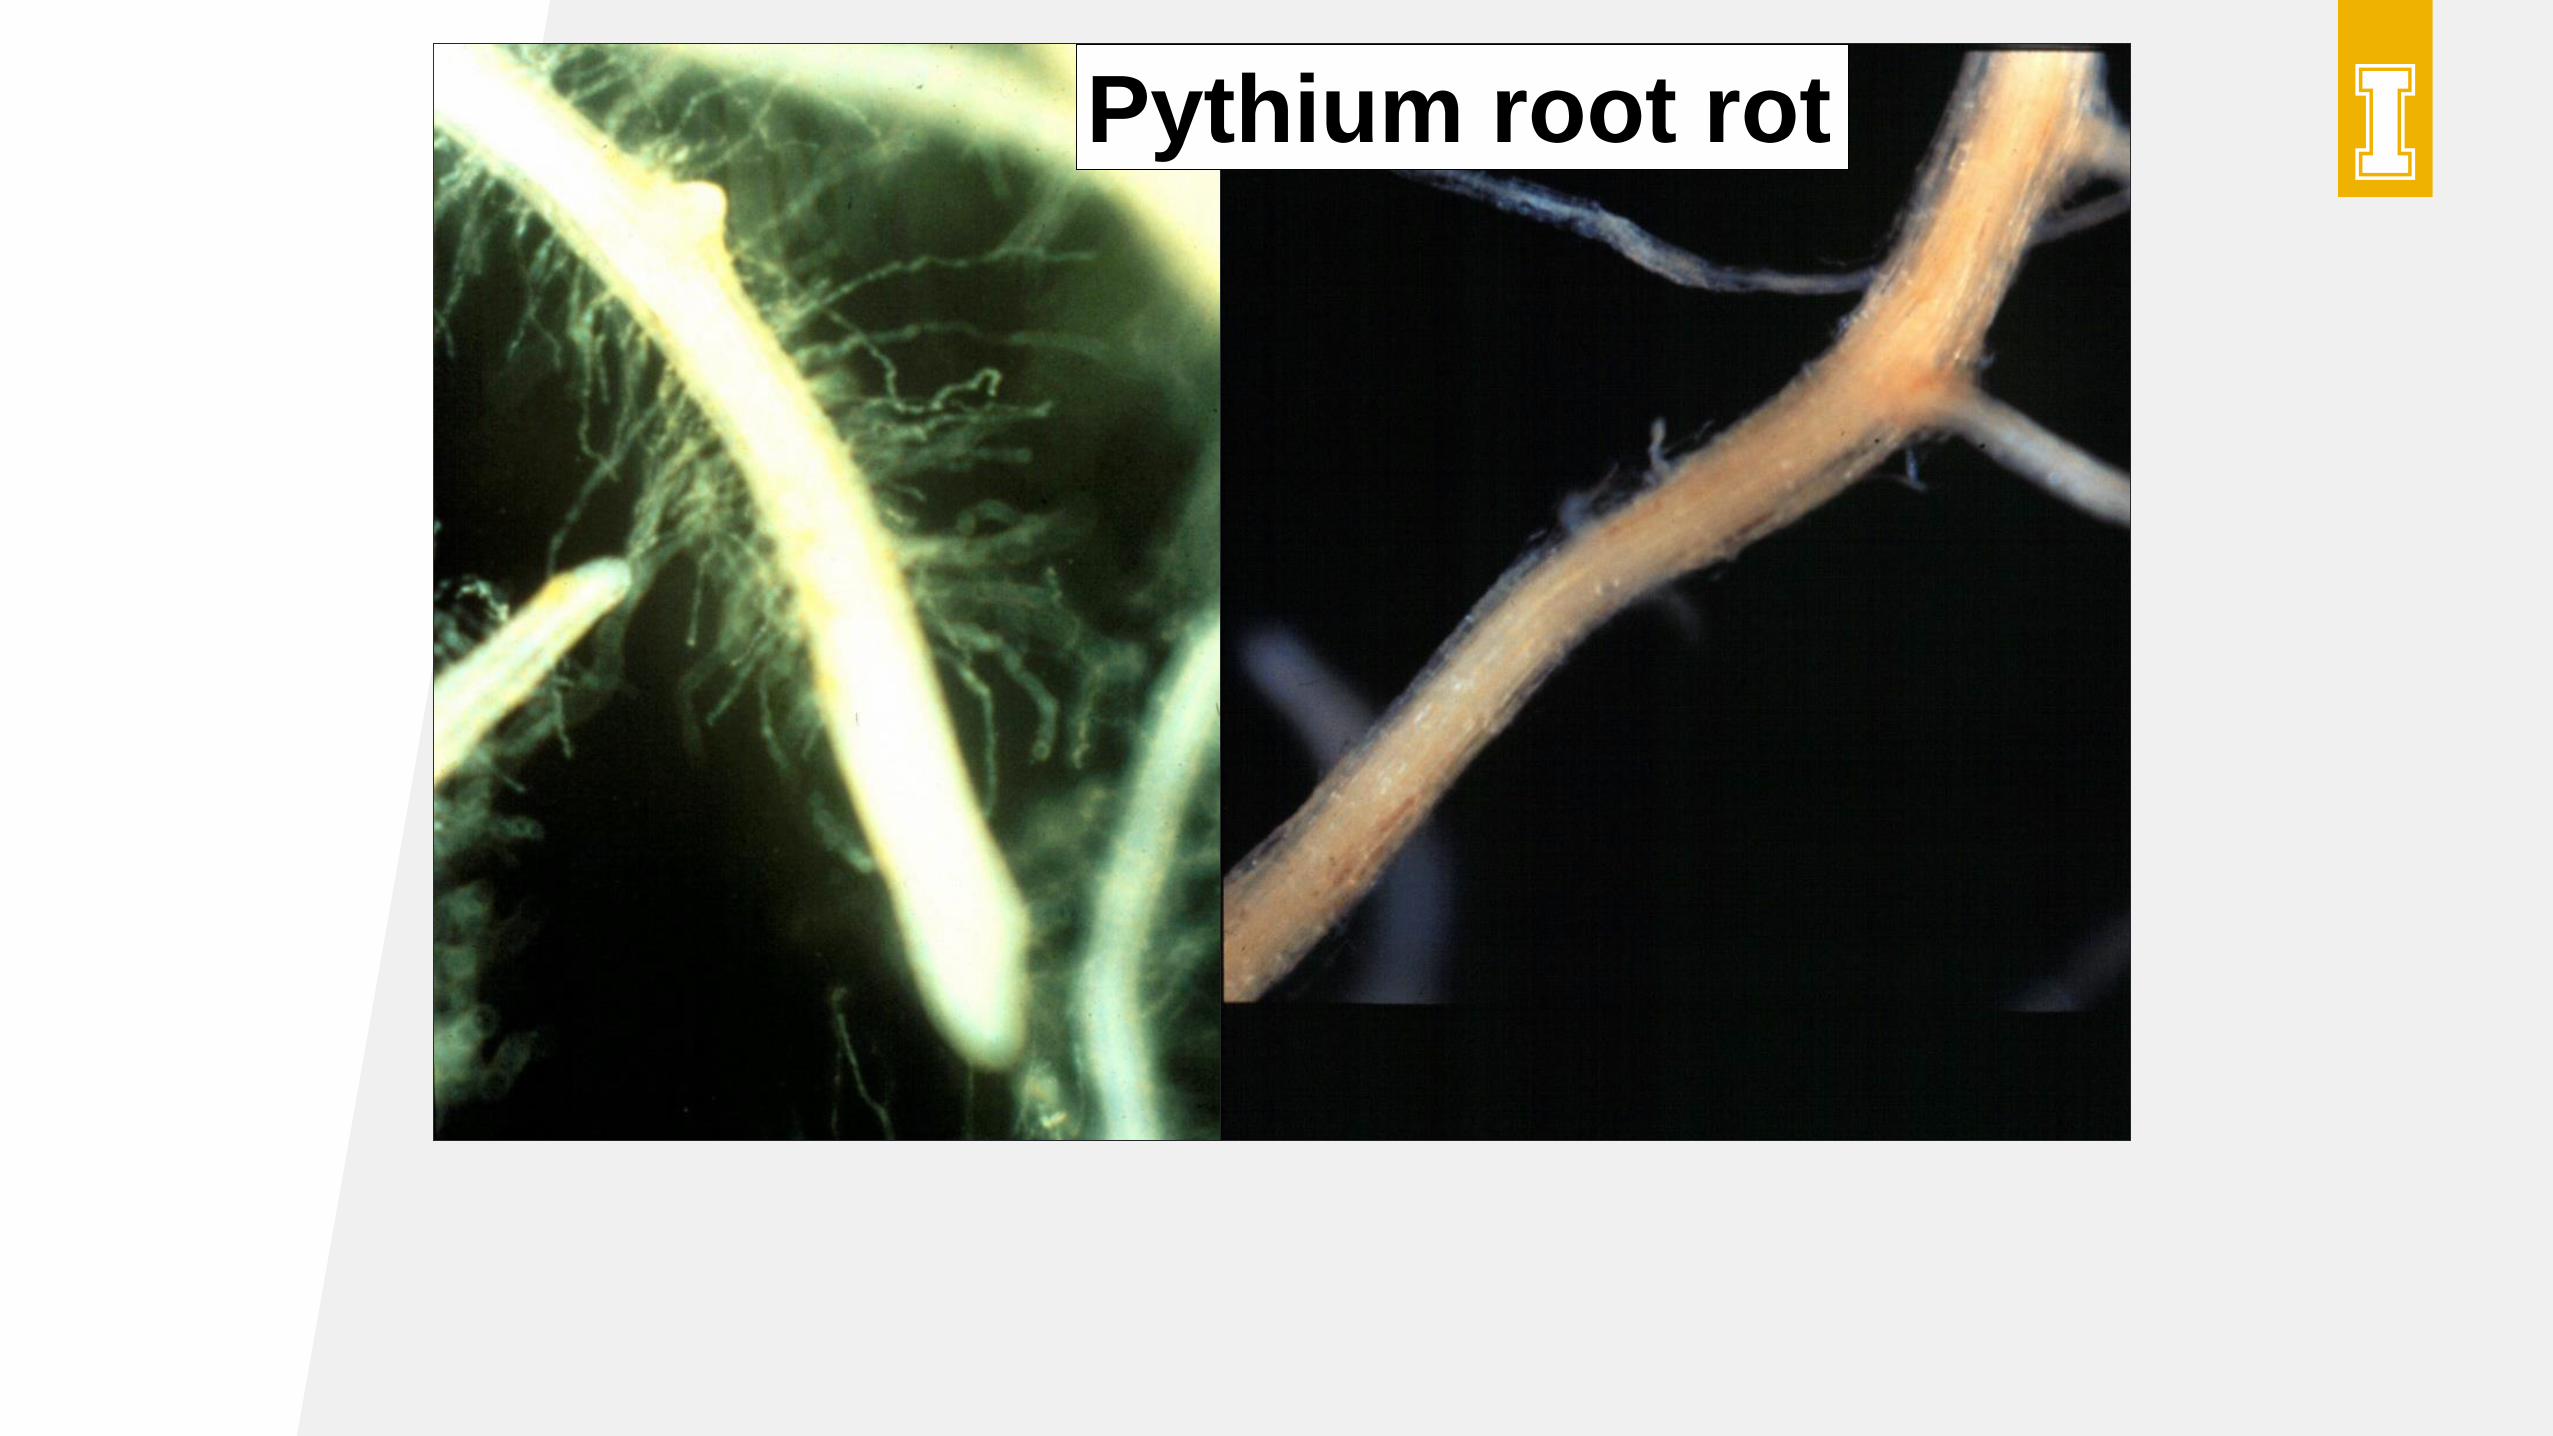
Pythium root rot
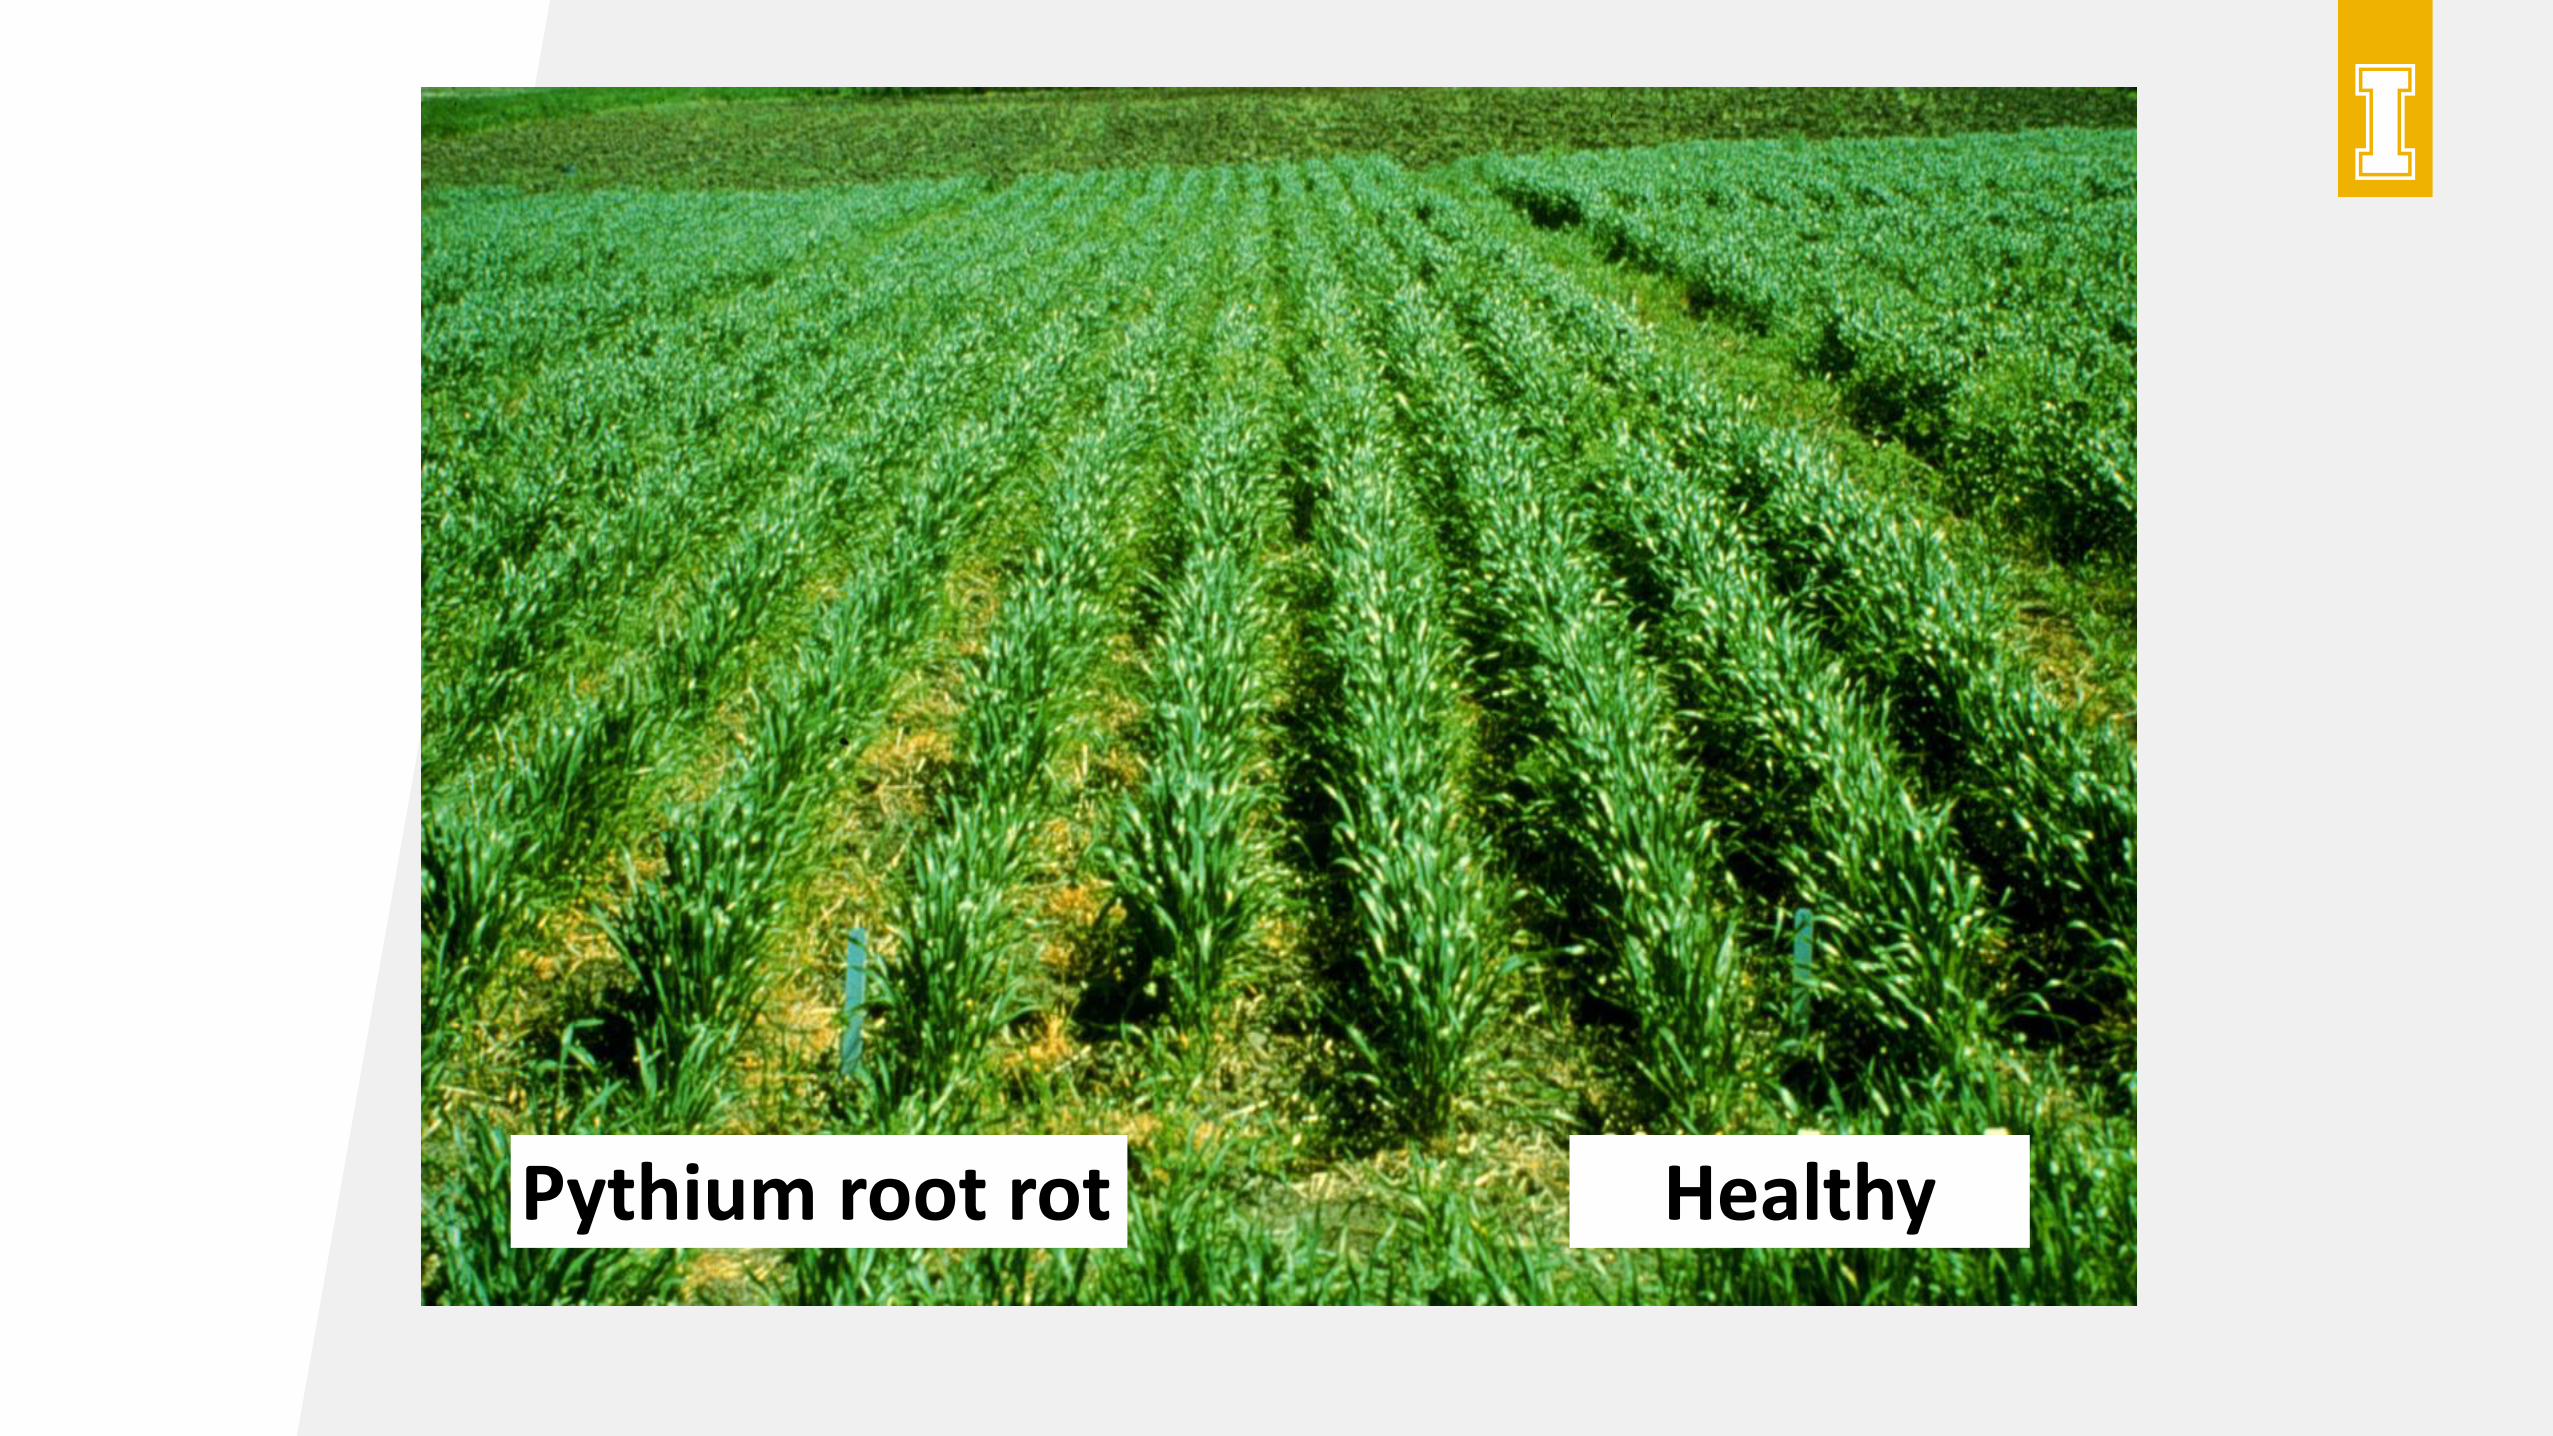
Pythium root rot Healthy
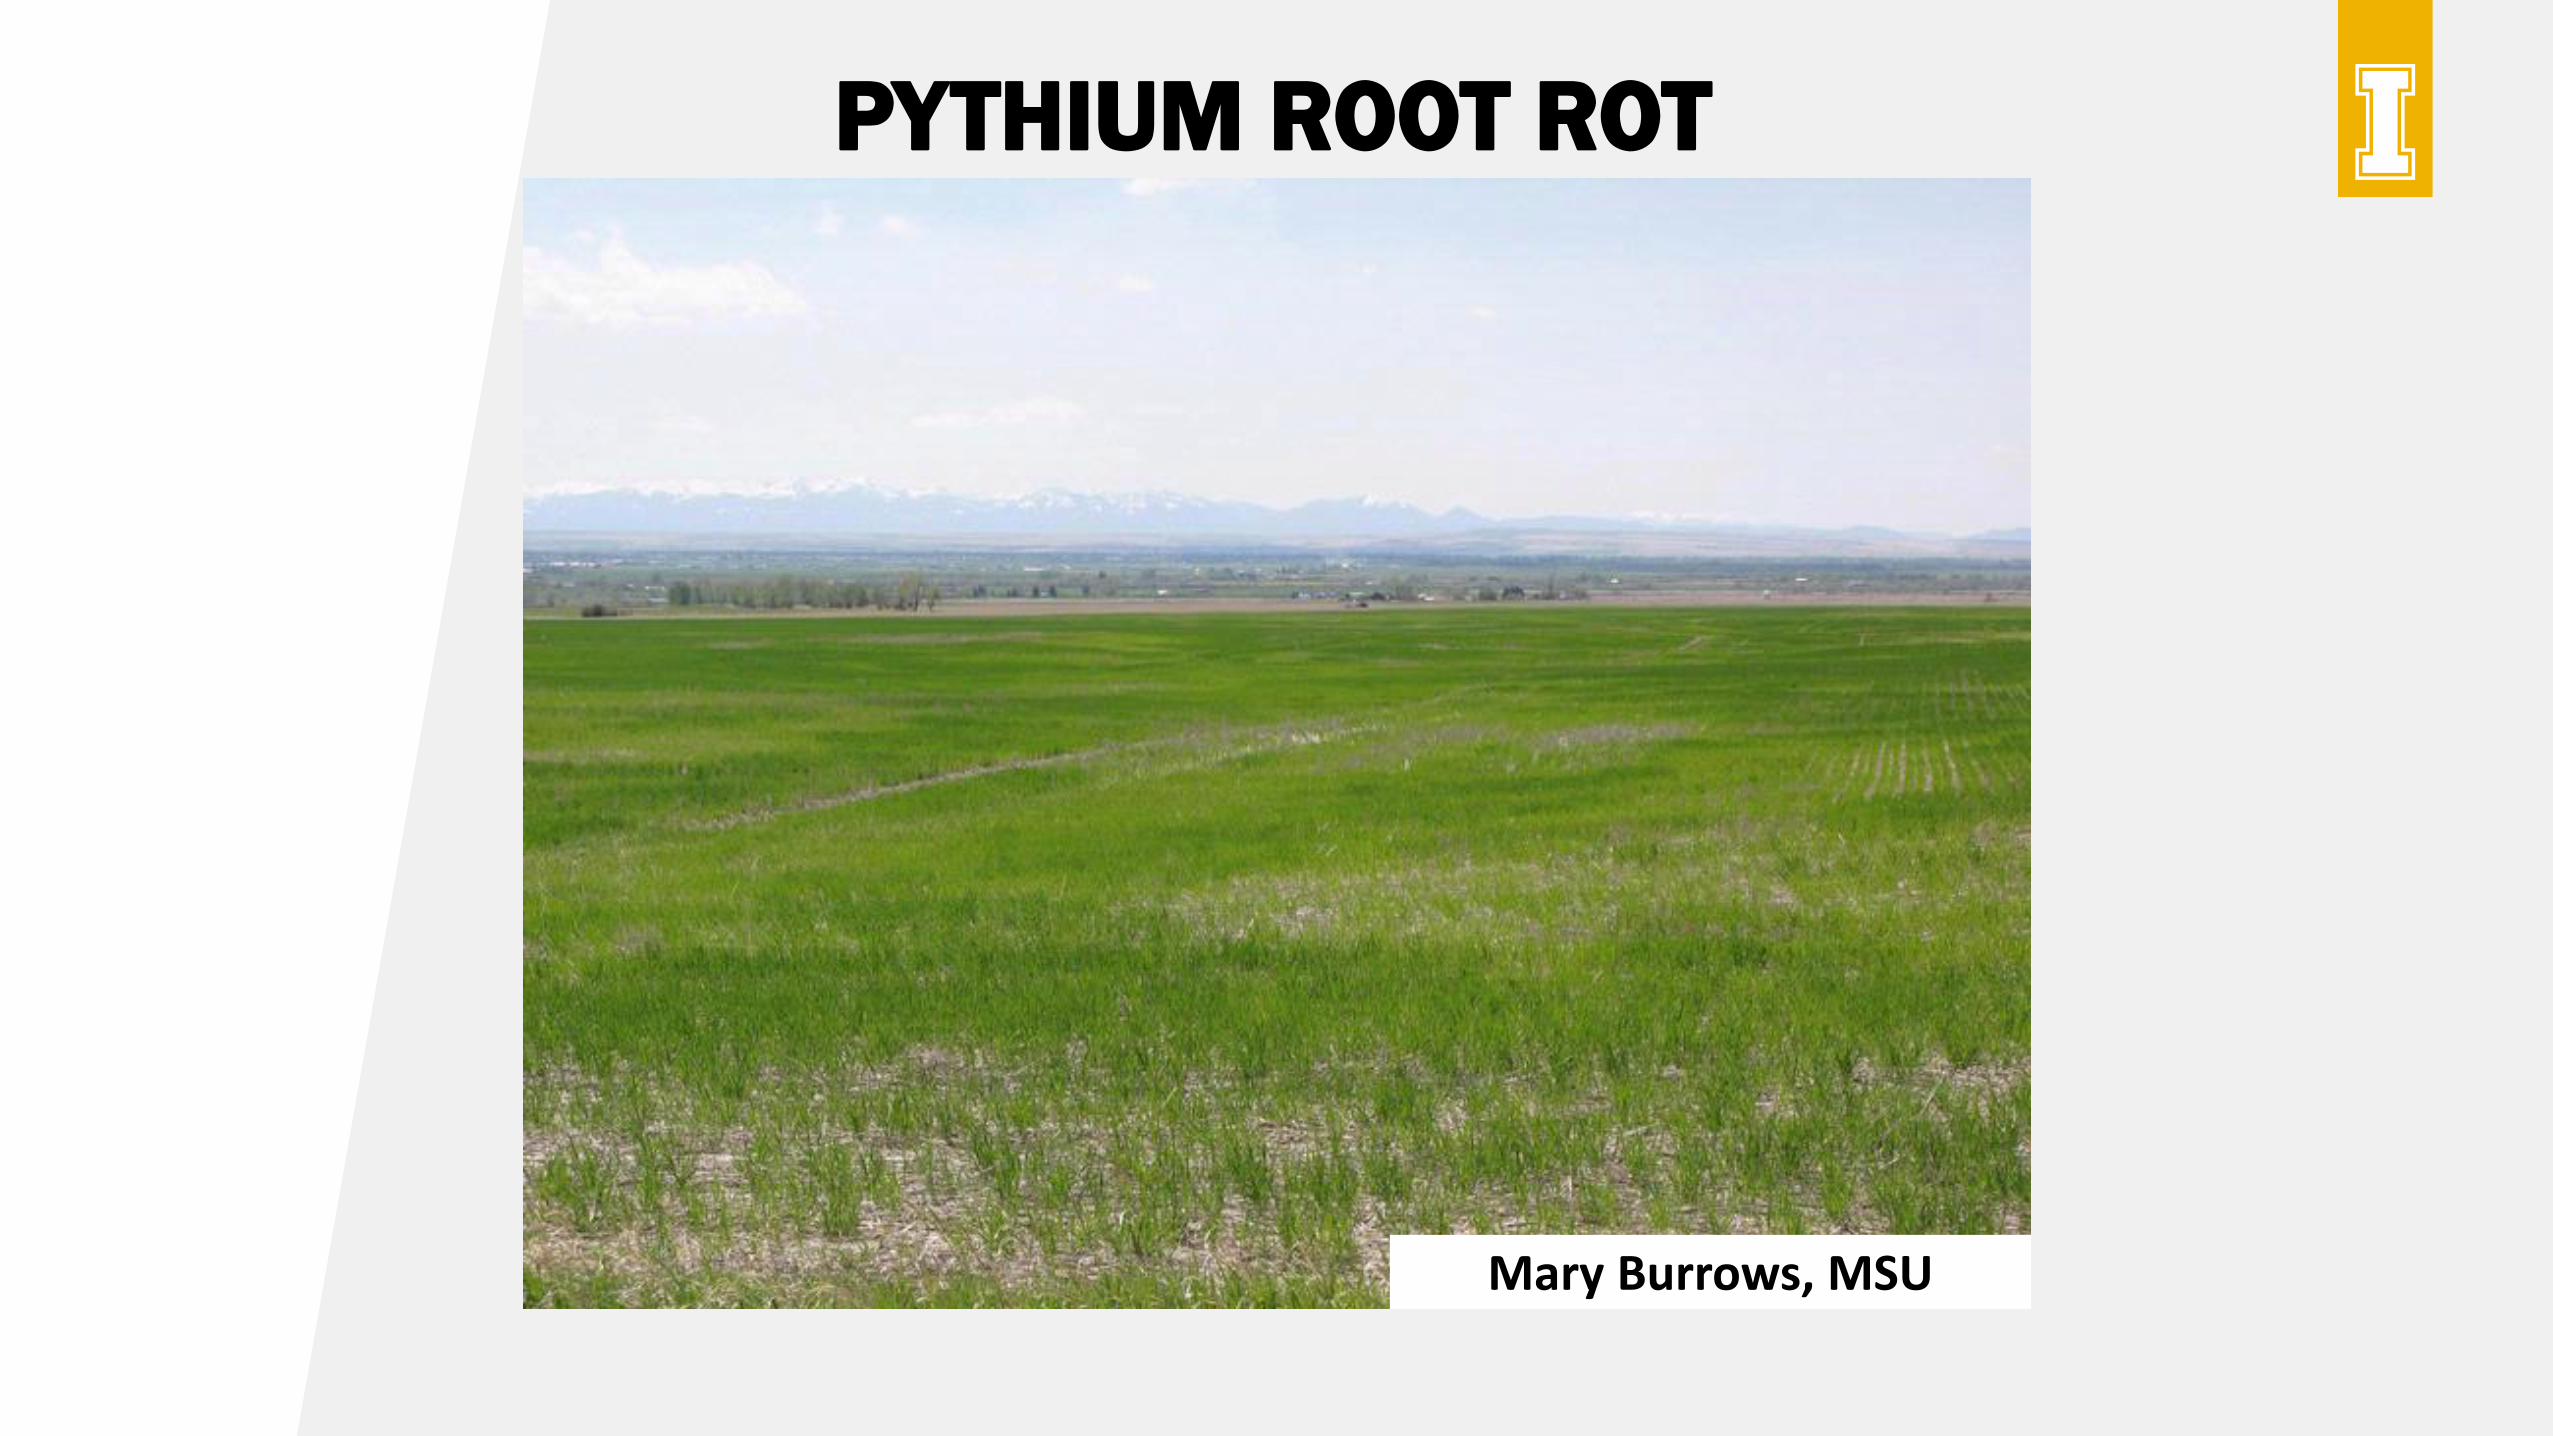
PYTHIUM ROOT ROT
Mary Burrows, MSU
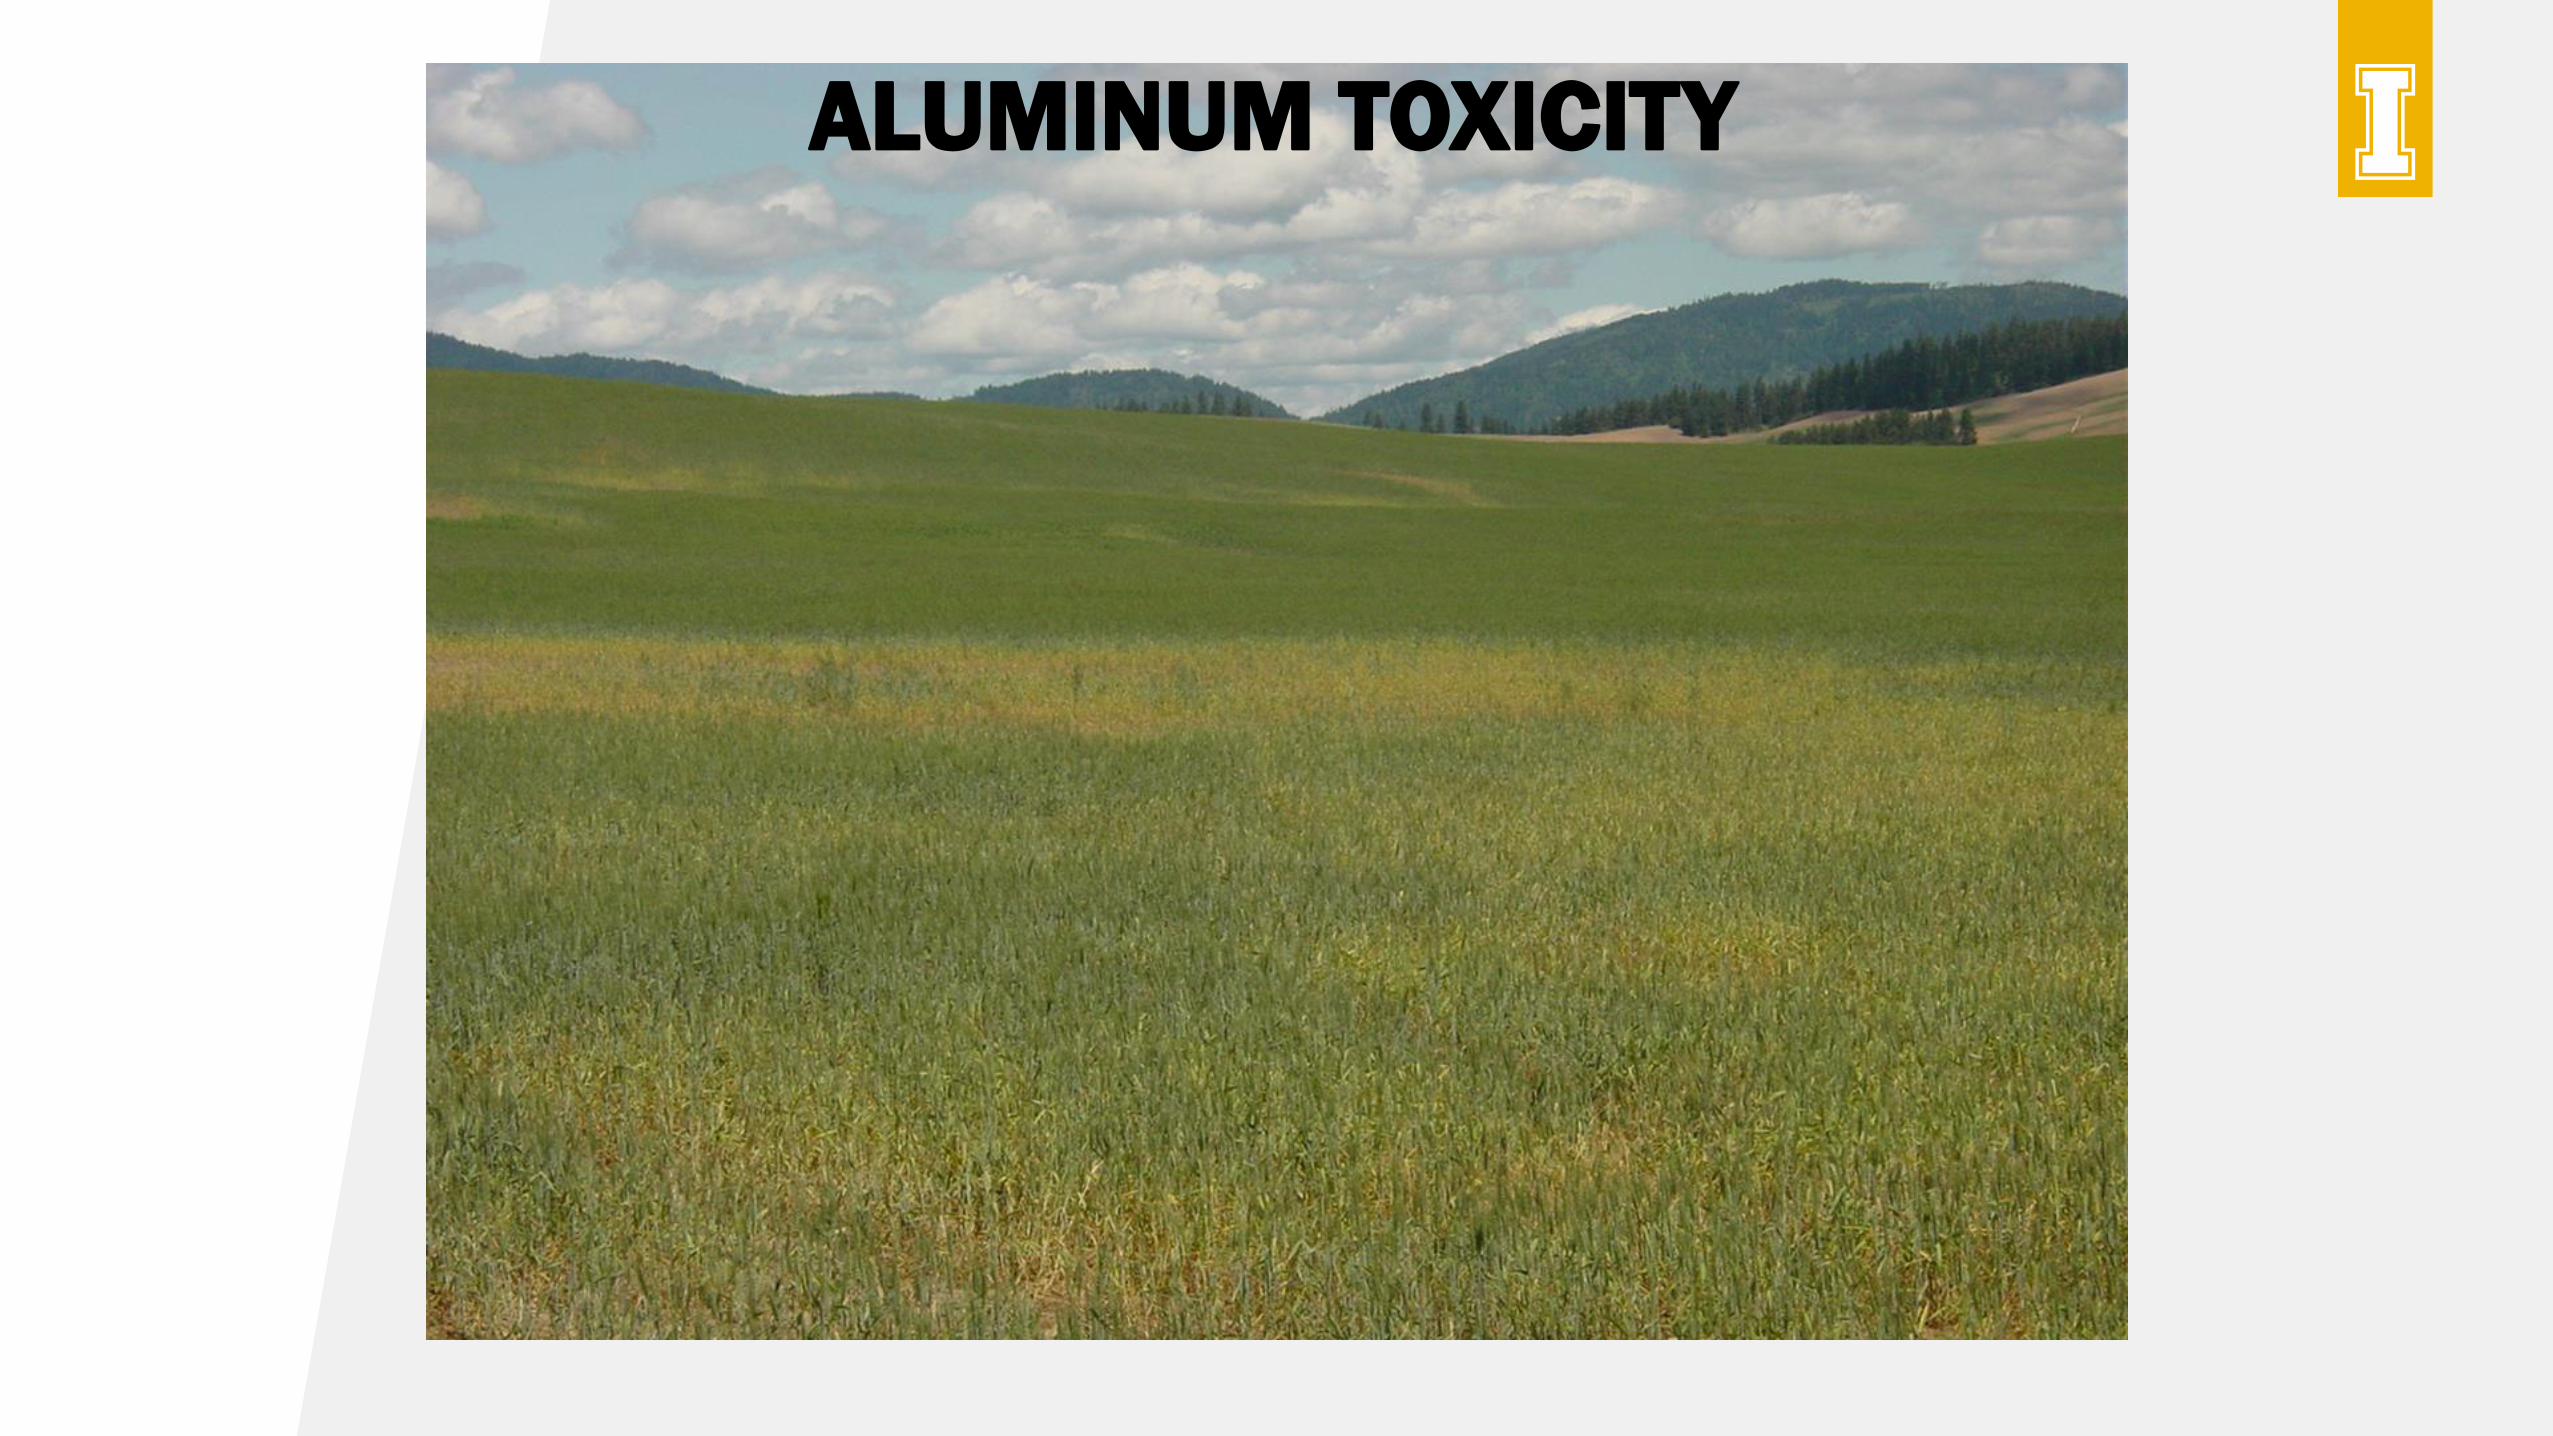
ALUMINUM TOXICITY
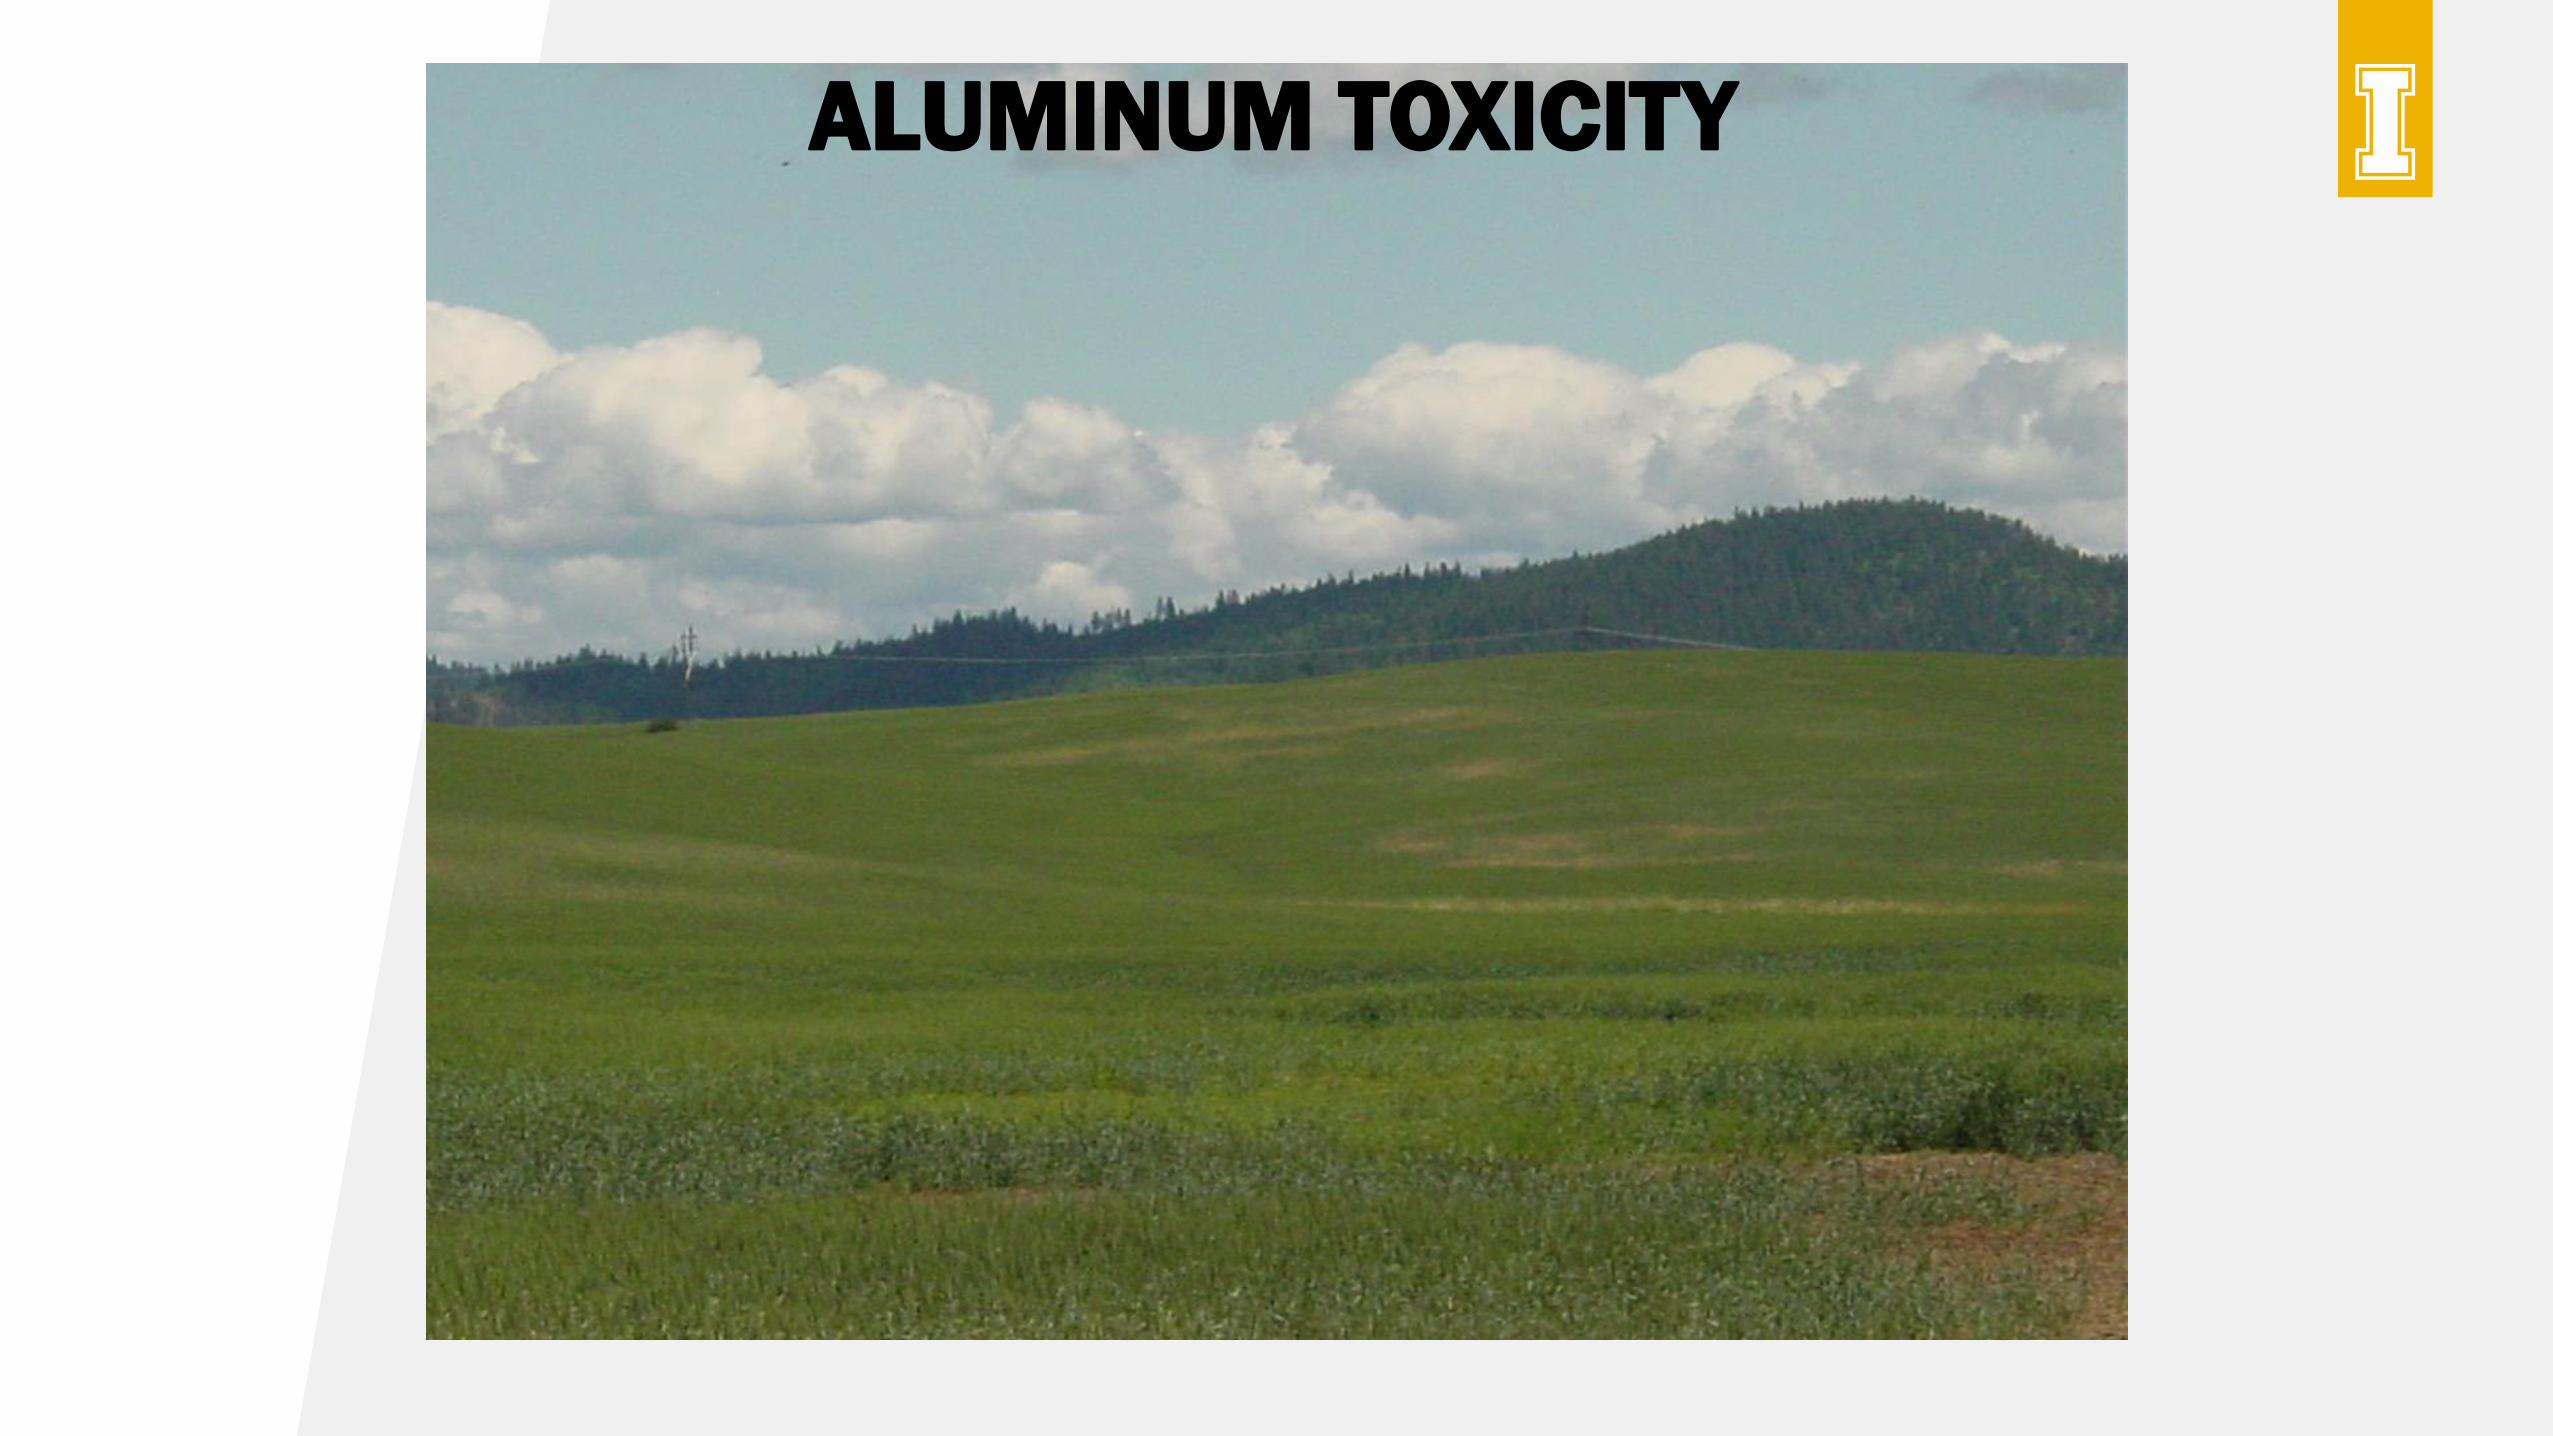
ALUMINUM TOXICITY
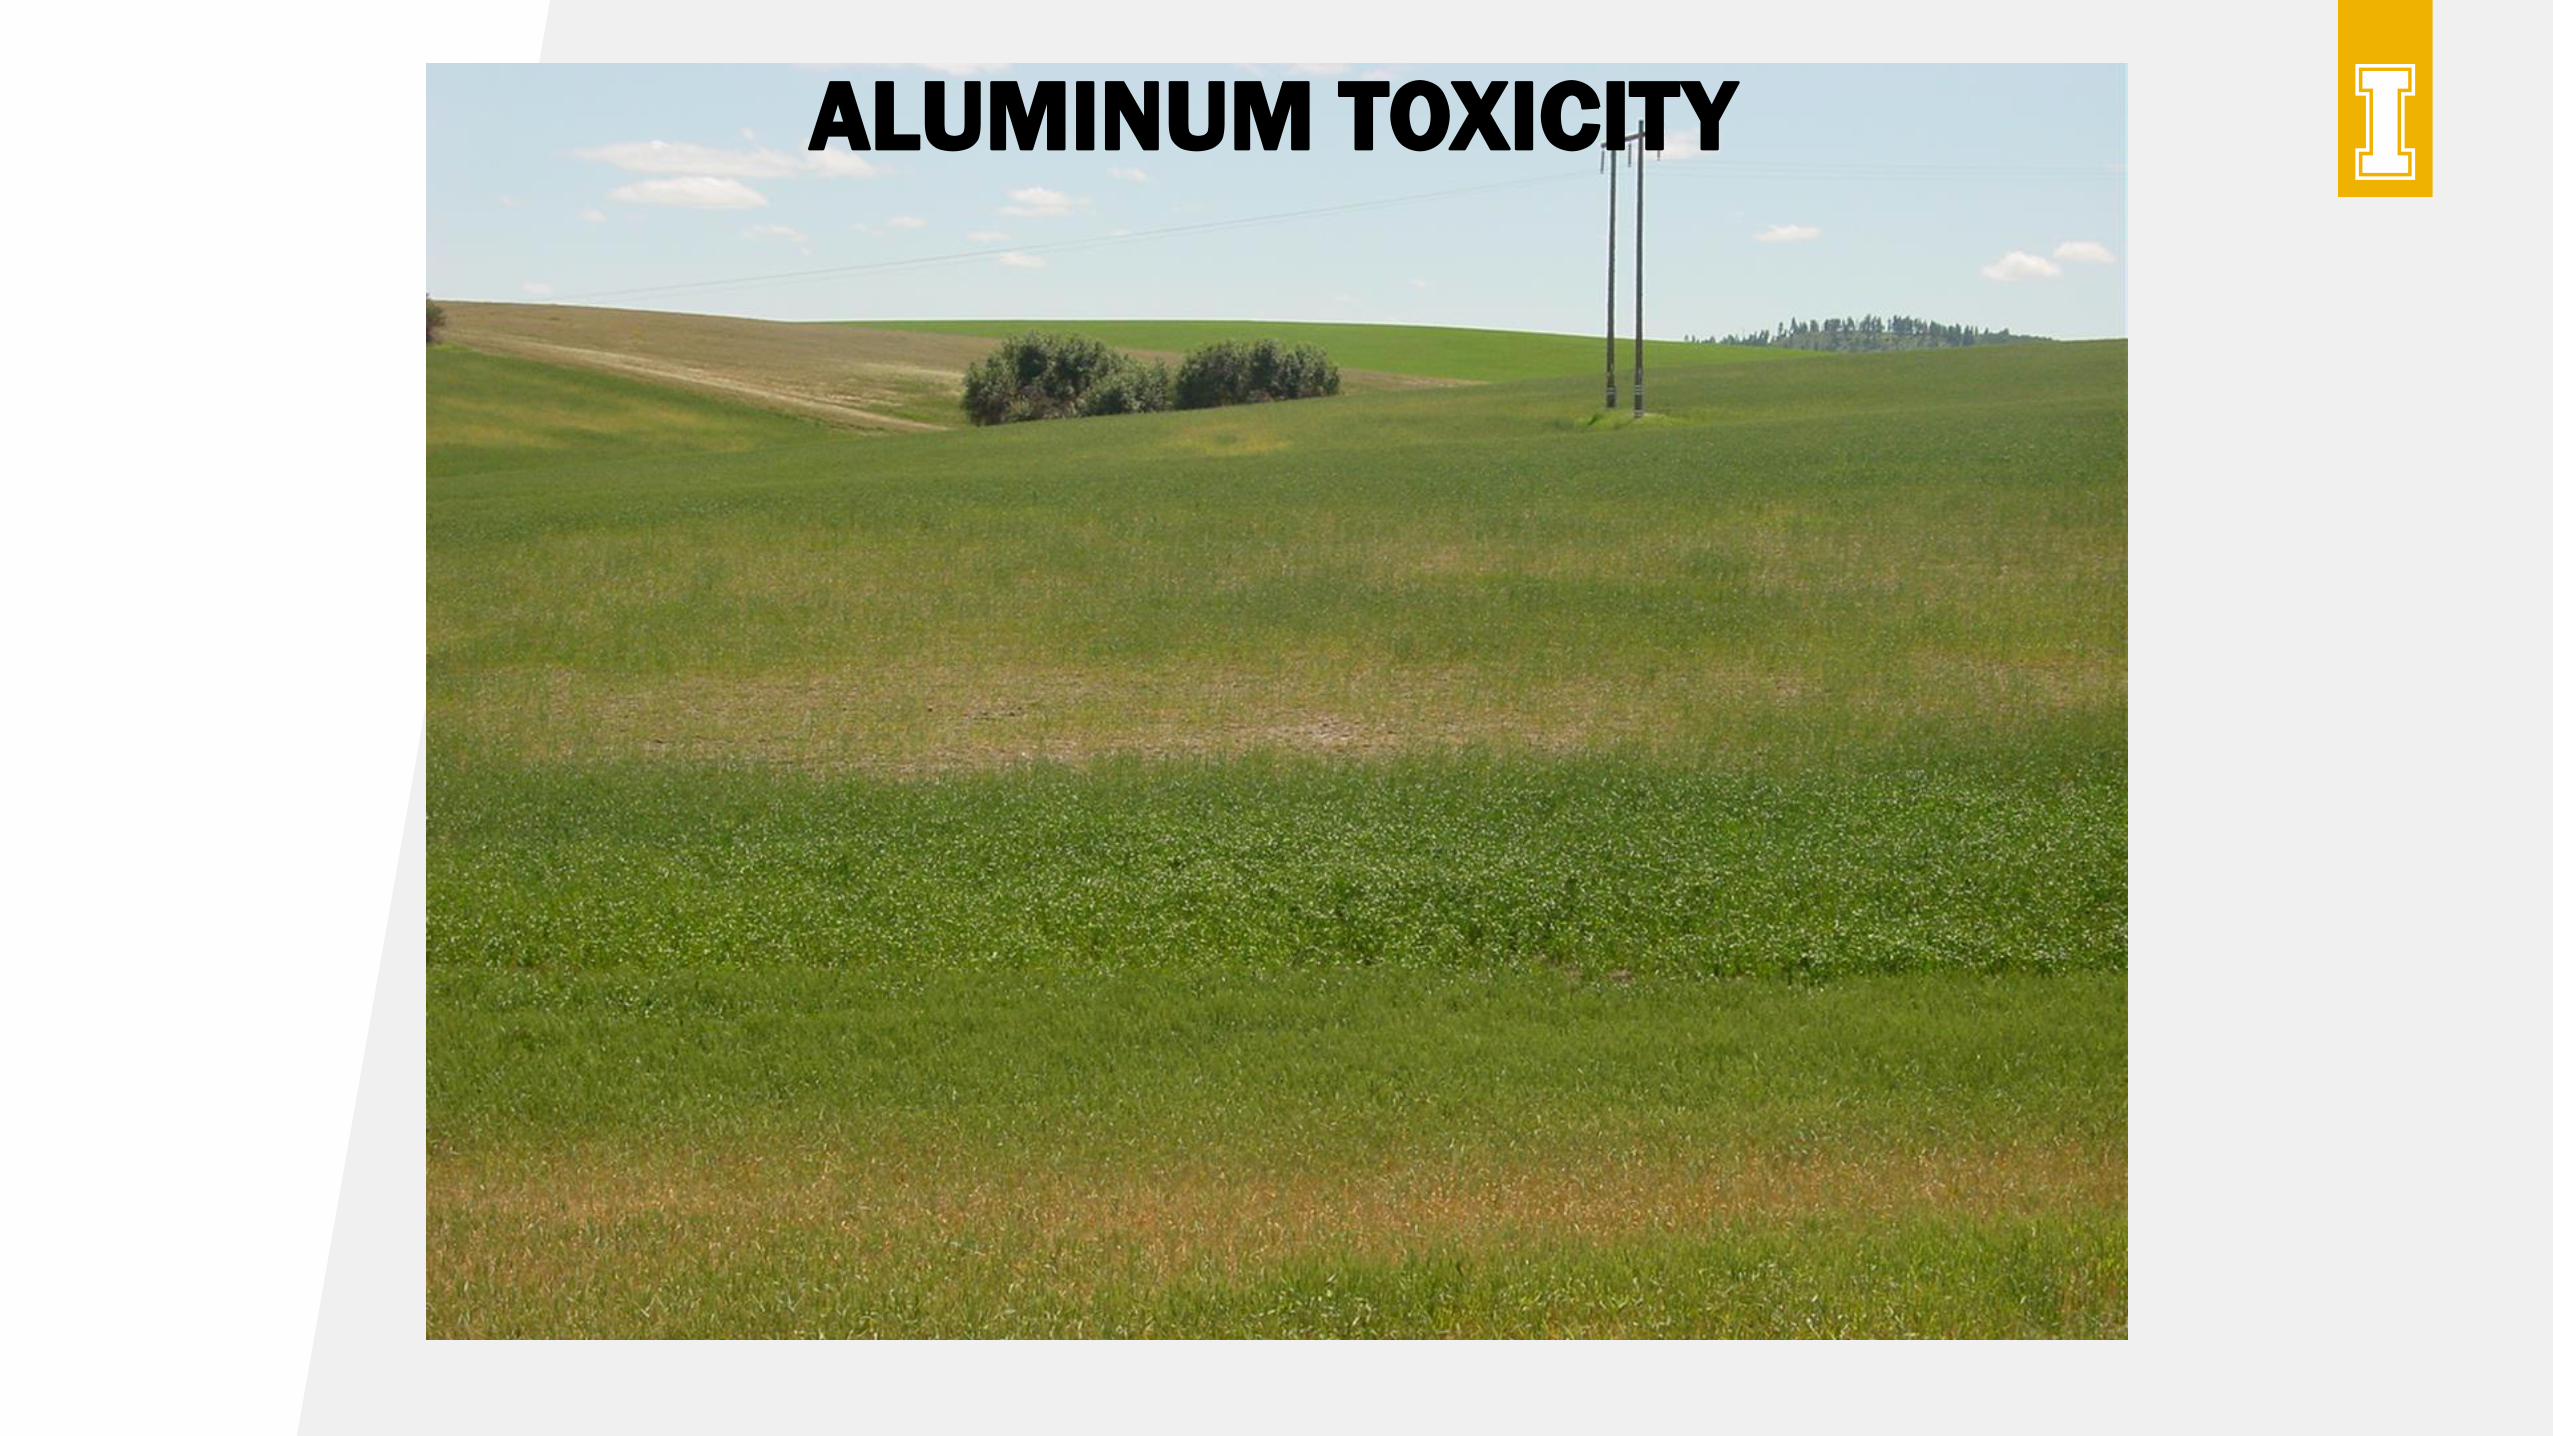
ALUMINUM TOXICITY
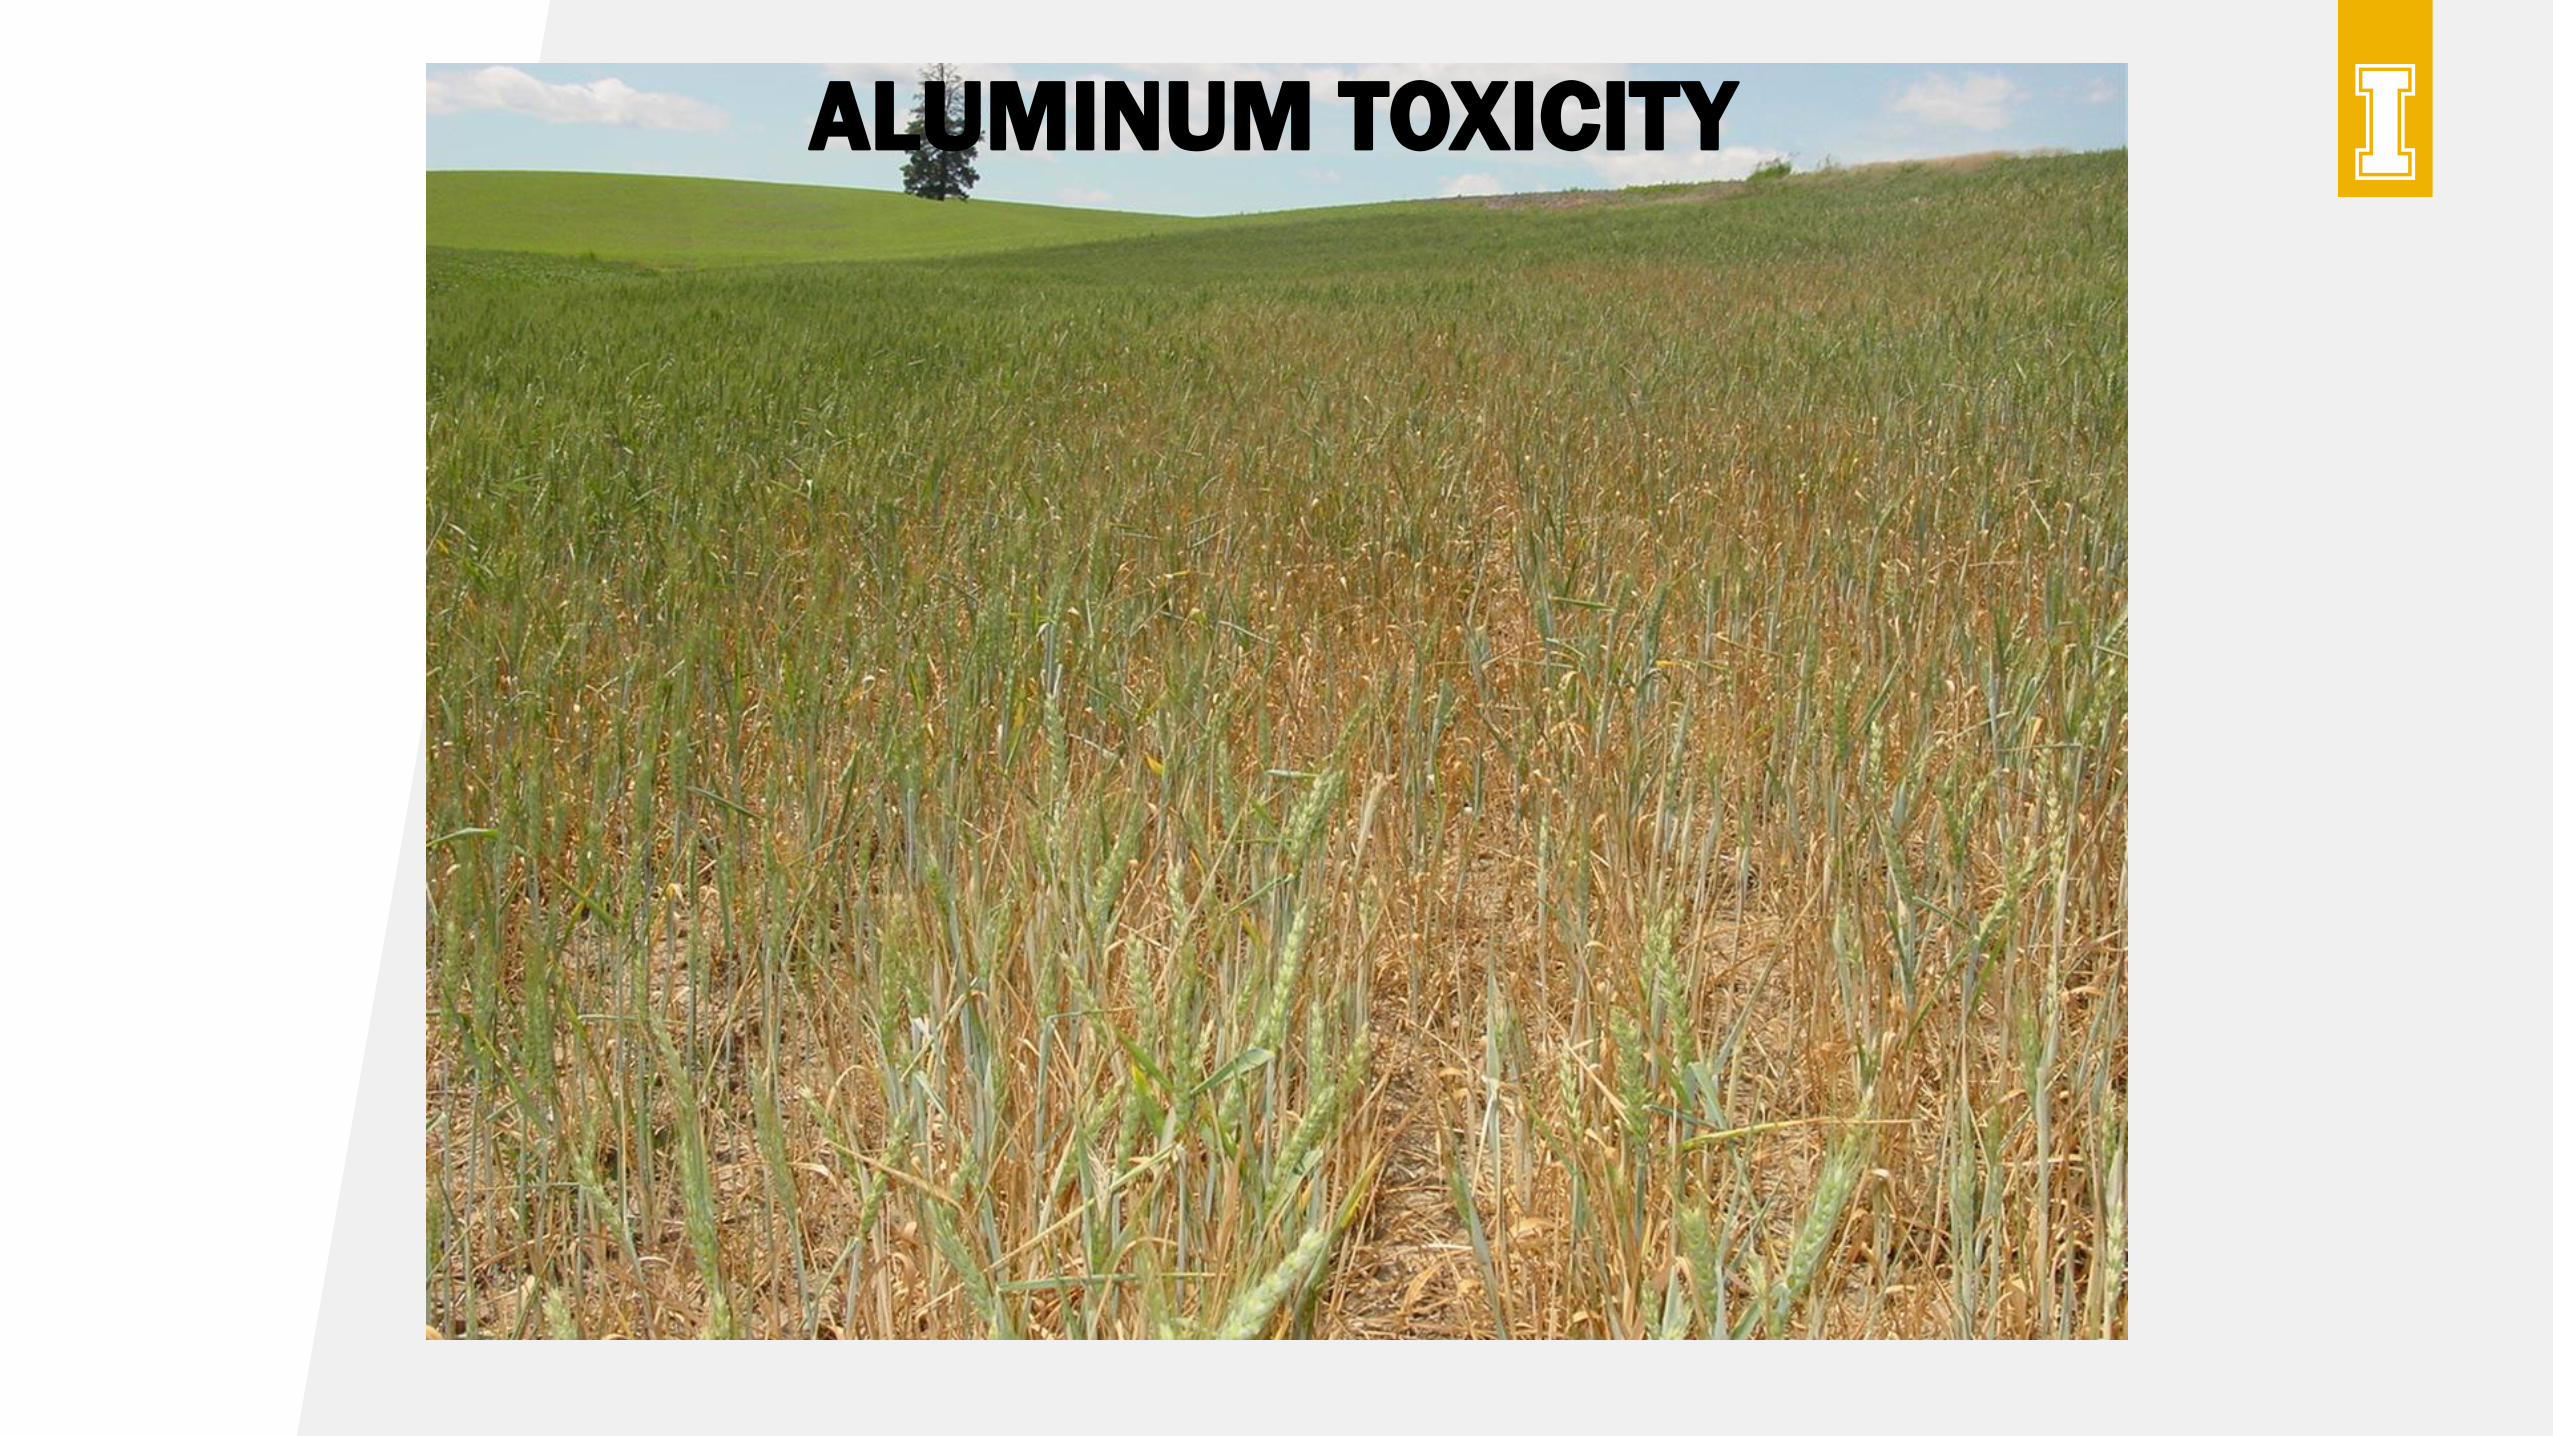
ALUMINUM TOXICITY
IDENTIFYING ALUMINUM TOXICITY
•Reduced seedling vigor
•Reduced tillering
•Yellow and stunting of plants
•Patches may occur anywhere in a field
•Associated with low soil pH (<5) in upper 6 inches

Thank you!