Embed Size (px)
Citation preview

1
CENG 491
SOFTWARE REQUIREMENTS SPECIFICATION
HTML5 Canvas Workflow Diagram Editor
iFlowEdit
Sponsored by
INNOVA IT Solutions Inc.
TriUlti
KARAOĞUZ, Mehmet Ozan
KAYRAK, Alaattin
KORKMAZ, Ozan
ORAL, Hakan
November 21, 2011
2
Contents
1. Introduction .............................................................................................................................................. 3
1.1 Problem Definition .......................................................................................................................... 3
1.2 Purpose ........................................................................................................................................... 3
1.3 Scope ............................................................................................................................................... 3
1.4 User and Literature Survey ............................................................................................................. 3
1.5 Definitions and Abbreviations ......................................................................................................... 4
1.6 References ...................................................................................................................................... 4
1.7 Overview ......................................................................................................................................... 4
2. Overall Description.................................................................................................................................... 4
2.1 Product Perspective ........................................................................................................................ 4
2.2 Product Functions ........................................................................................................................... 5
2.3 Constraints, Assumptions and Dependencies ............................................................................... 14
3. Specification Requirements .................................................................................................................... 15
3.1 Interface Requirements ................................................................................................................ 15
3.2 Functional Requirements .............................................................................................................. 15
3.3 Non-functional Requirements ...................................................................................................... 18
4. Data Model and Description ................................................................................................................... 19
4.1 Data Description ........................................................................................................................... 19
5. Behavioral Model and Description ......................................................................................................... 23
5.1 Description for Software Behavior ................................................................................................ 23
5.2 State Transition Diagrams ............................................................................................................. 23
6. Planning ................................................................................................................................................... 23
6.1 Team Structure ............................................................................................................................. 23
6.2 Estimation ..................................................................................................................................... 24
6.3 Process Model ............................................................................................................................... 25
7. Conclusion ............................................................................................................................................... 25
3
1. Introduction
This document contains the software requirements for iFlowEdit which is an editor to create and edit work flow diagrams. The approach used in this specification is adapted from IEEE Std 830-1998. The project group, namely TriUlti, guarantees that everything about the project is described clearly and well-organized.
1.1 Problem Definition
The work flow diagrams are used to organize steps of plans, describe processes and
their relations among them with input-output information. To organize and manage their
projects faster and easier, many companies and organizations use work flow editors. On
the other hand, in the market of work flow editors, there are many problems due to
compatibility platforms and reaching all features.
The iFlowEdit will be a work flow diagram editor which is platform independent and
also does not require Adobe Flash. It only requires Internet browser regardless of
operating system of device, which is why it gets rid of compatibility problems in the
market. In addition, it is open source software, so anyone can easily reach its all features.
1.2 Purpose
This document provides a complete description of all the functions and the
specifications of the INNOVA IT‘s HTML5 Canvas Workflow Diagram Editor - iFlowEdit.
This documentation is written for the purpose of guiding development process of the
iFlowEdit.
1.3 Scope
This software system will be designed to maximize productivity of the editor by
providing tools that assist in drawing work flow diagrams. More specifically, this system is
designed to draw the diagrams with templates and it keeps the projects in the database
of the system. Therefore, user can load and reload the data to/from server to reach his
workspace later.
1.4 User and Literature Survey
There are many companies and organizations that provide solutions on workflow
editors. Creately is the most common one and it won a lot of awards on this area and it is
in the Top 10 applications of Asia. A lot of common companies such as Adobe,
TechCrunch indicate that Creately is a good diagramming tool. In addition to Creately,
Gliffy and Edraw are the programs that provide work flow diagram creations. However;
Creately and other diagramming tools do not support all the features of diagramming to
4
free users. In addition to this, users who do not have Adobe Flash on their devices cannot
use Creately. On the contrary, iFlowEditor supplies all features and people can use it
different environment .Thus, more company and organization users can use this system
and it will take the place of Creately and other programs. Main issue is easiness of the
usability of the editor. Therefore, one of our main purposes will be to create easy user
interface.
1.5 Definitions and Abbreviations
SRS : Software Requirements Specification SDD : Software Design Description XAML : Extensible Application Markup Language GUI : Graphical User Interface JSON : JavaScript Object Notation OS : Operating System IEEE : Institute of Electrical & Electronics Engineers, Inc. WF : Work Flow JS : Javascript
1.6 References
http://e27.sg/2010/09/22/asias-top-10-apps-unveiled/
http://creately.com/customer-love
http://www.gliffy.com/
http://www.edrawsoft.com/flowchart.php
1.7 Overview
The remainder of this document is two chapters, the first providing a full description
of the project and it lists all the functions performed by the system. The final chapter
concerns details of each of the system functions and actions. These two sections are
cross-referenced by topic, to increase understanding.
2. Overall Description
2.1 Product Perspective
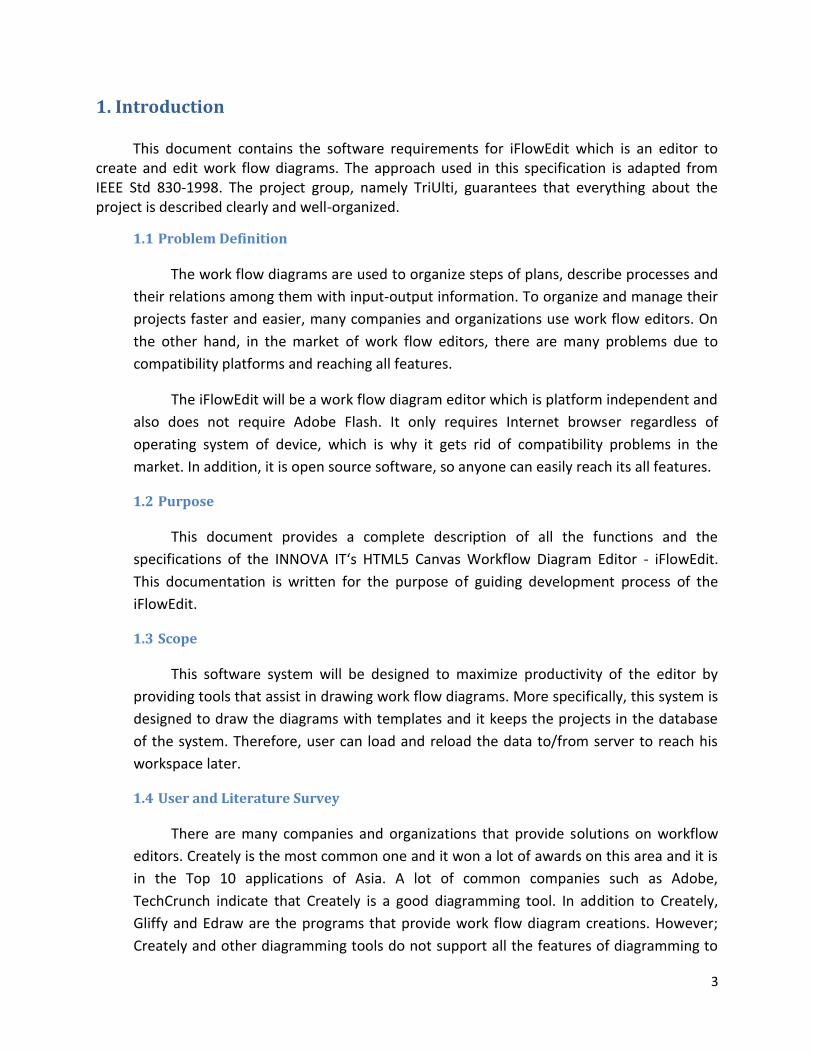
System consists of two main parts. The first one is the client side that contains the user interface to create diagrams and their specialties by users. Second one is the server side of the system that provides functionality of dynamically loading and saving of client side of system. With this way, user can save any diagram data into server side in XAML type to later use for Microsoft Workflow Foundation. There also exists minor parts of server side, which will be used as data conversion of sent and received data.
5
Figure 1
2.2 Product Functions
2.2.1 User Use Cases
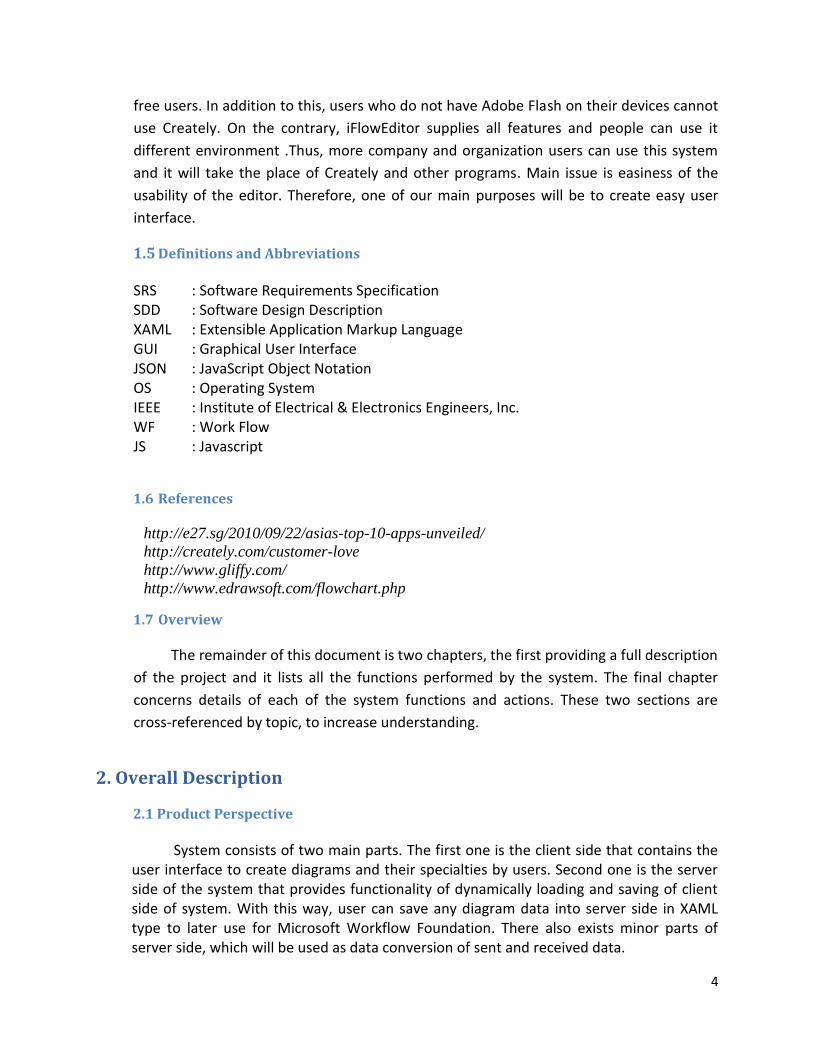
2.2.1.1 Add Activity
Diagram:
Description: This use case describes how a user adds an activity onto the canvas.
Step-by-Step Description:
1. User selects a diagram.
2. User selects an activity.
3. User drags and drops the selected activity onto the canvas.
6
2.2.1.2 Move Activity
Diagram:
Description: This use case describes how a user moves a selected activity to
different location.
Step-by-Step Description:
1. User selects an activity which is on the canvas. 2. User does mouse down on the activity. 3. User moves the mouse to the desired location. 4. User does mouse up.
2.2.1.3 Delete Activity
Diagram:
Description: This use case describes how a user deletes activity.
Step-by-Step Description:
1. User selects an activity which is on the canvas. 2. User clicks on “Delete” button which is on the User GUI.
7
2.2.1.4 Add Connection
Diagram:
Description: This use case describes how to be added connection between the
activities by users.
Step-by-Step Description:
1. User selects an activity as starting activity. 2. User clicks on “Connection” button. 3. User selects a destination activity to complete the connection. 4. User selects type of the connection.
2.2.1.5 Delete Connection
Diagram:
Description: This use case describes how a user deletes selected connection.
Step-by-Step Description:
1. User selects a connection. 2. User clicks on “Delete” button.
8
2.2.1.6 Change Connection Point
Diagram:
Description: This use case describes how to change a created connection point of an activity.
Step-by-Step Description:
1. User selects a connection. 2. User selects one of the connection points which is desired to be changed. 3. User moves the selected point to the desired connection point.
2.2.1.7 Change Activity Attributes
Diagram:
Description: This use case describes how a user changes an activity attribute.
Step-by-Step Description:
1. User selects an activity. 2. User finds the attribute name on the properties panel. 3. User changes the attribute value on the properties panel.
9
2.2.1.8 Select Item
Diagram:
Description: This use case describes how to select items on the canvas.
Step-by-Step Description:
1. User clicks on an empty place on canvas. 2. User moves mouse and makes desired items to be under the selection
area.
2.2.1.9 Cut Item
Diagram:
Description: This use case describes how a user cuts selected items.
Step-by-Step Description:
1. User selects any item/s.
2. User clicks on “Cut” button.
10
2.2.1.10 Copy Item
Diagram:
Description: This use case describes how a user copies selected items.
Step-by-Step Description:
1. User selects any item/s. 2. User clicks on “Copy” button.
2.2.1.11 Paste Item
Diagram:
Description: This use case describes how a user paste copied or cut items.
Step-by-Step Description:
1. User clicks on “Paste” button.
11
2.2.1.12 Zoom
Diagram:
Description: This use case describes how users zoom in or out.
Step-by-Step Description:
1. User clicks on “Zoom In” or “Zoom Out” button.
2.2.2 Server Function Use Cases
2.2.2.1 Convert JSON to XAML
Diagram:
Description: This use case describes how the server process on JSON data.
Step-by-Step Description:
1. Server receives data from system.
2. Server receives data from system.
12
3. Server converts JSON data to XAML data.
4. Server saves XAML data to files.
2.2.2.2 Convert XAML to JSON
Diagram:
Description: This use case describes how the server process on XAML data.
Step-by-Step Description:
1. Server reads XAML file.
2. Server converts XAML data to JSON data.
3. Server sends JSON data to system.
2.2.3 System Use Cases
2.2.2.1 Parse JSON
Diagram:
Description: This use case describes how the system parses JSON data.
13
Step-by-Step Description:
1. System receives JSON data from server.
2. System parses the data.
3. System draw parsed data to surface.
2.2.2.2 Convert Surface Data to JSON
Diagram:
Description: This use case describes how the system converts surface data to JSON data.
Step-by-Step Description:
1. System gets surface data.
2. System converts it to JSON data.
2.2.2.3 Calculate best path of connection
Diagram:
Description: This use case describes how to create the best path between the activities.
14
Step-by-Step Description:
1. System determines the shortest paths between the two activities. 2. System determines the appropriate path between the shortest paths.
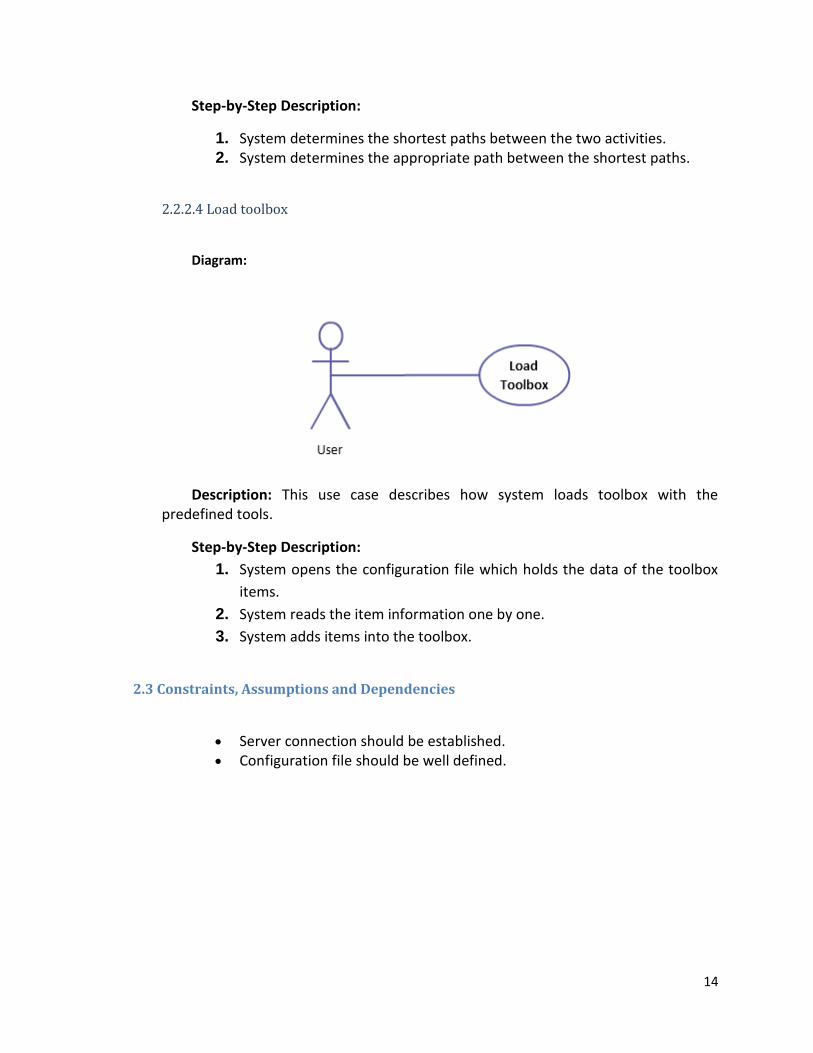
2.2.2.4 Load toolbox
Diagram:
Description: This use case describes how system loads toolbox with the predefined tools.
Step-by-Step Description:
1. System opens the configuration file which holds the data of the toolbox
items.
2. System reads the item information one by one.
3. System adds items into the toolbox.
2.3 Constraints, Assumptions and Dependencies
Server connection should be established. Configuration file should be well defined.
15
3. Specification Requirements
3.1 Interface Requirements
3.1.1 Software Interface Requirements
We have just two software requirements for the system. One of them is
operating system. OS should be exists because of its hosting the browser. Any of major
OSes can be possible interface choice. The other one requirement is browser. Browser
should be installed in OS in order to display the system. Using browser could be any of
major browsers.
3.1.2 Hardware Interface Requirements
There are two main hardware interfaces of the system. First one is the client side
hardware requirement which contains displaying of output and getting input from a
device like mouse or touchscreen. Second one is the server side hardware requirements
which are hard disk and Internet connection. Server side of the system requires high
speed of disk access; therefore server needs approximately 15000 rpm disk access
speed. There is also needed high speed Internet connection between server and the
clients. Hence, 100 Mbps Internet connections is required not to lose too much time
because of data transfer between server side and client side of the system.
3.2 Functional Requirements
3.2.1 Move Activity Basic Data Flow:
1. User selects an activity which is on the canvas. 2. User does mouse down action on the activity. 3. User moves the mouse to the desired location. 4. User does mouse up action.
Alternative Data Flow 1: 3. User pushes up, down, right and left keys of keyboard.
16
3.2.2 Delete Activity
Basic Data Flow:
1. User selects an activity which is on the canvas. 2. User clicks on “Delete” button which is on the User GUI.
Alternative Data Flow 1: 2. User pushes delete key of the keyboard.
3.2.3 Delete Connection Basic Data Flow:
1. User selects a connection. 2. User clicks on “Delete” button.
Alternative Data Flow 1:
2. User pushes delete key of the keyboard.
3.2.4 Select Items
Basic Data Flow:
1. User clicks on an empty place on canvas. 2. User moves mouse and makes desired items to be under the selection
area.
Alternative Data Flow 1: 1. User holds “Ctrl” key of keyboard. 2. User clicks desired activities and connections.
3.2.5 Cut Items
Basic Data Flow:
1. User selects any number of items. 2. User clicks on “Cut” button.
Alternative Data Flow 1: 1. User selects the item that is desired to be cut.
17
2. User pushes “Ctrl+X” key combination.
Alternative Data Flow 2:
1. User pushes right click of the mouse.
2. User clicks the “Cut Item” button of the context menu.
3.2.6 Copy Items
Basic Data Flow:
1. User selects any number of items. 2. User clicks on “Copy” button.
Alternative Data Flow 1:
1. User selects the item that is desired to be copy. 2. User pushes “Ctrl+C” key combination.
Alternative Data Flow 2:
1. User pushes right click of the mouse. 2. User clicks the “Copy Item” button of the context menu.
3.2.7 Paste Items
Basic Data Flow:
1. User clicks on “Paste” button.
Alternative Data Flow 1:
1. User pushes “Ctrl+V” key combination.
Alternative Data Flow 2:
1. User pushes right click of the mouse. 2. User clicks the “Paste Item” button of the context menu.
3.2.8 Zoom
Basic Data Flow:
1. User clicks on “Zoom In” or “Zoom Out” button.
18
Alternative Data Flow 1: 1. User holds “Ctrl” key of keyboard. 2. User moves scroll forward to zoom in and moves scroll back to zoom out.
3.3 Non-functional Requirements
3.3.1 Performance Requirements
Performance requirements of the system are different for server side and client
side.
Client Side: First of all, loading a document with 50 activities and 50 connections
should be performed in at least 1 second. In addition, any common operations on an
equivalent document should be performed in at least 0.2 second. Moreover saving that
kind of document should be performed in at least 0.5 second. Finally, on a document
like that, creating a connection should be performed at least 0.1 second.
Server Side: System is expected to be fast enough to write client side data to the
disk on the server side and send the database data back to the client side. There is an
assumption for this which depends on the disk access and writes time of the disk. It
costs to the system approximately 0.5 sec to write on or to read back.
3.3.2 Design Constraints
3.3.2.1 Programming Languages
At server side, C# programming language will be used in order to be compatible with
WF.Net and manipulate XAML easily by .Net framework elements.
On the other hand, at client-side HTML5, JavaScript, Processing-JS, Ext-JS and Ajax will
be used for the user interaction and server communication.
3.3.2.2 Usability
There will be a web interface for users to connect system without another tool. We plan
to follow W3C usability standards.
3.3.2.3 Accessibility
There will be no restriction of any web browser usage. That is, all of the known browsers
on the market will run the system smoothly.
19
4. Data Model and Description
4.1 Data Description
4.1.1 Data Objects
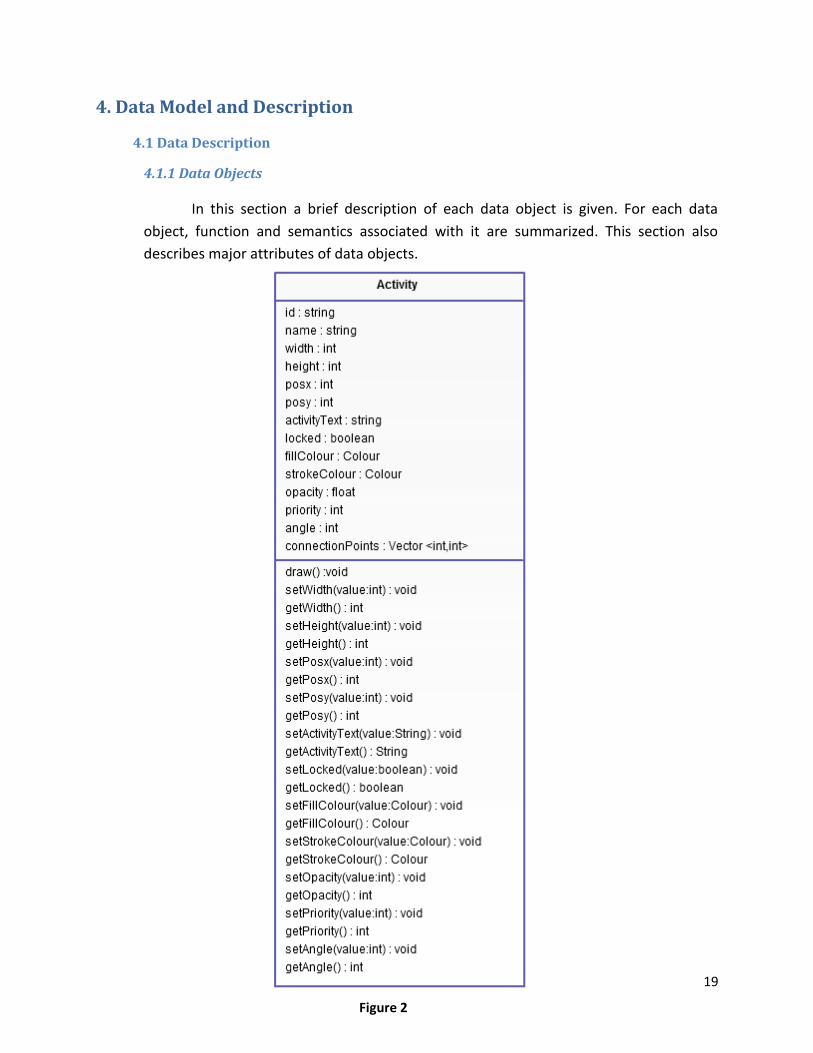
In this section a brief description of each data object is given. For each data
object, function and semantics associated with it are summarized. This section also
describes major attributes of data objects.
Figure 2
20
Activity: This data object represents item that user drops on working space, that
is, any shape data on the canvas is hold in its own activity object.
id: The unique identifier of an activity object.
name: It is the name of the activity object, which is used to show the user which
shape it is.
width: The width of the shape defined in activity object.
height: The height of the shape defined in activity object.
posx: Position value of activity on x-coordinate.
posy: Position value of activity on y-coordinate.
activityText: Text that is written on activity.
locked: Flag to stick an activity object on canvas.
fillColour : Represents the colour value of the activity object.
strokeColour: Represents the colour value of the strokes of the activity object.
opacity: Holds the opacity values to determine the transparency of the activity
object.
priority: Represents the precedence of the activity object whether it is above or
below another activity object.
angle: The angle of the activity object that determines the rotation of it.
connectionPoints: An array that holds the connection points of the activity
object.
21
Figure 2
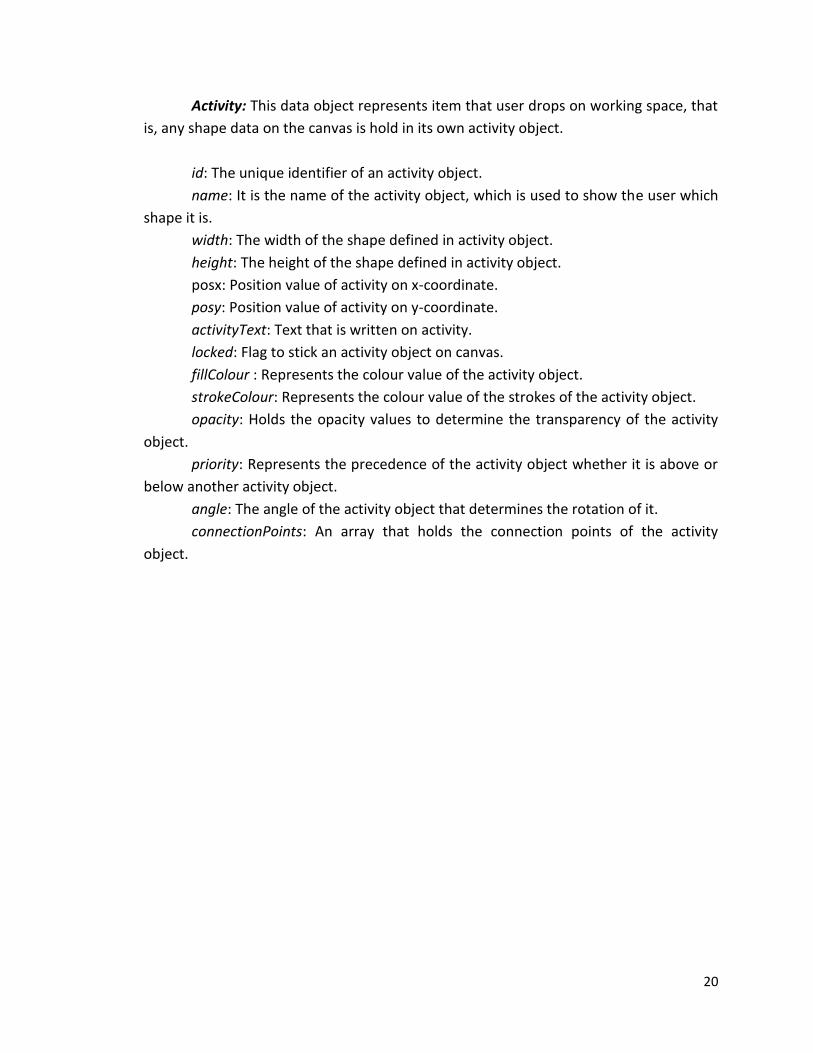
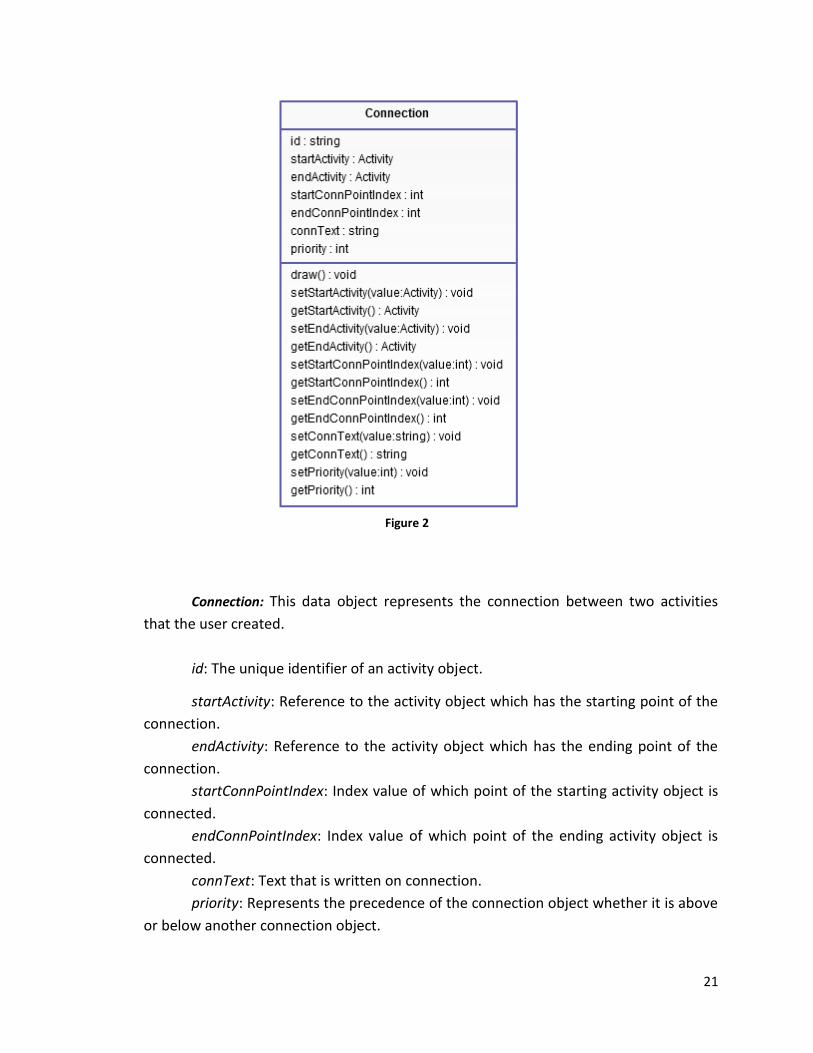
Connection: This data object represents the connection between two activities
that the user created.
id: The unique identifier of an activity object.
startActivity: Reference to the activity object which has the starting point of the
connection.
endActivity: Reference to the activity object which has the ending point of the
connection.
startConnPointIndex: Index value of which point of the starting activity object is
connected.
endConnPointIndex: Index value of which point of the ending activity object is
connected.
connText: Text that is written on connection.
priority: Represents the precedence of the connection object whether it is above
or below another connection object.
22
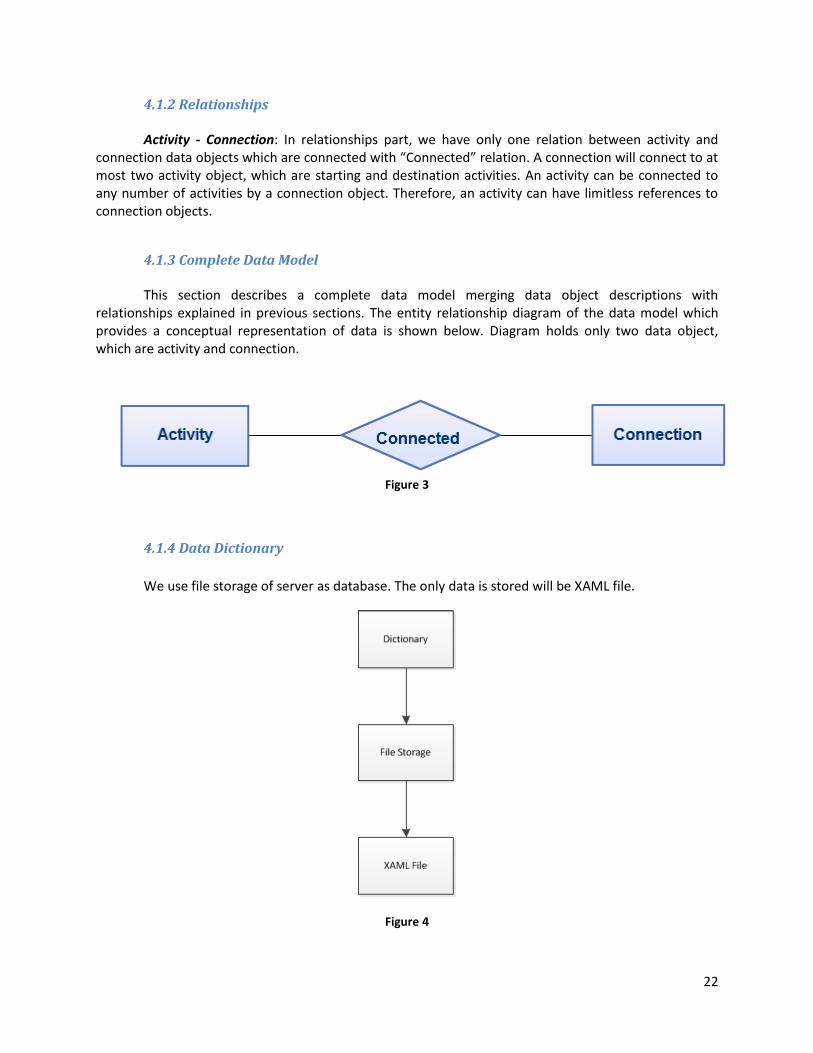
4.1.2 Relationships Activity - Connection: In relationships part, we have only one relation between activity and connection data objects which are connected with “Connected” relation. A connection will connect to at most two activity object, which are starting and destination activities. An activity can be connected to any number of activities by a connection object. Therefore, an activity can have limitless references to connection objects.
4.1.3 Complete Data Model
This section describes a complete data model merging data object descriptions with relationships explained in previous sections. The entity relationship diagram of the data model which provides a conceptual representation of data is shown below. Diagram holds only two data object, which are activity and connection.
Figure 3
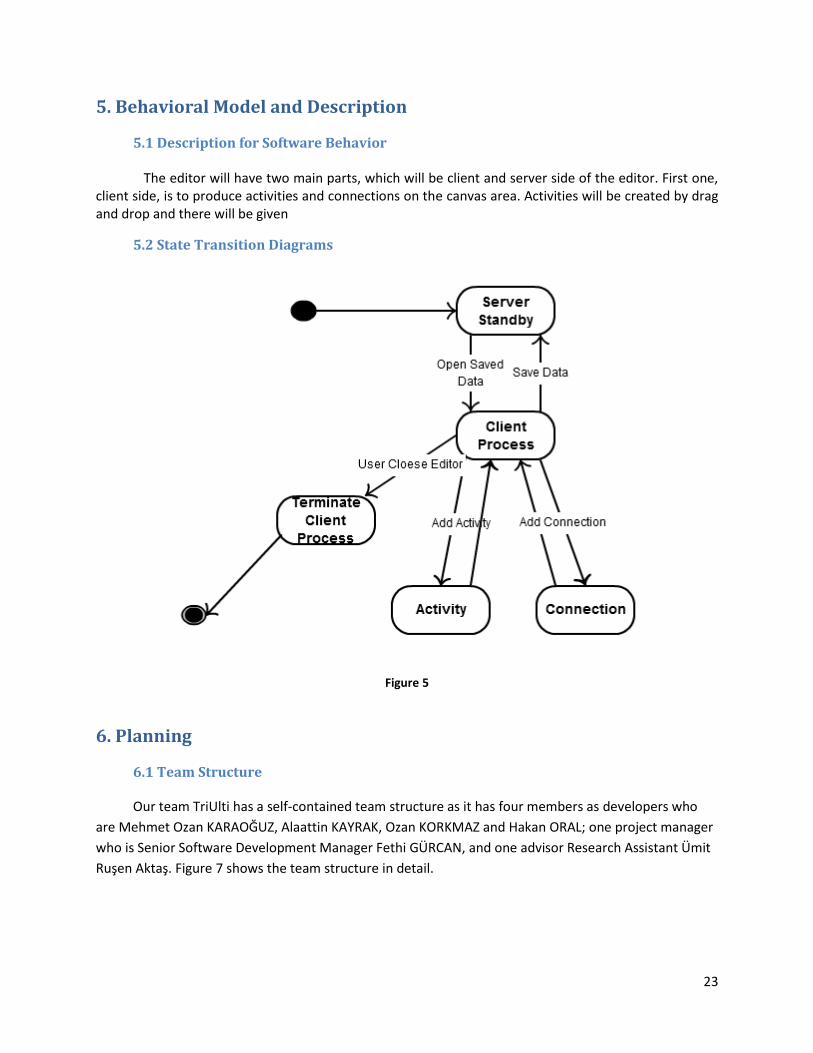
4.1.4 Data Dictionary
We use file storage of server as database. The only data is stored will be XAML file.
Figure 4
23
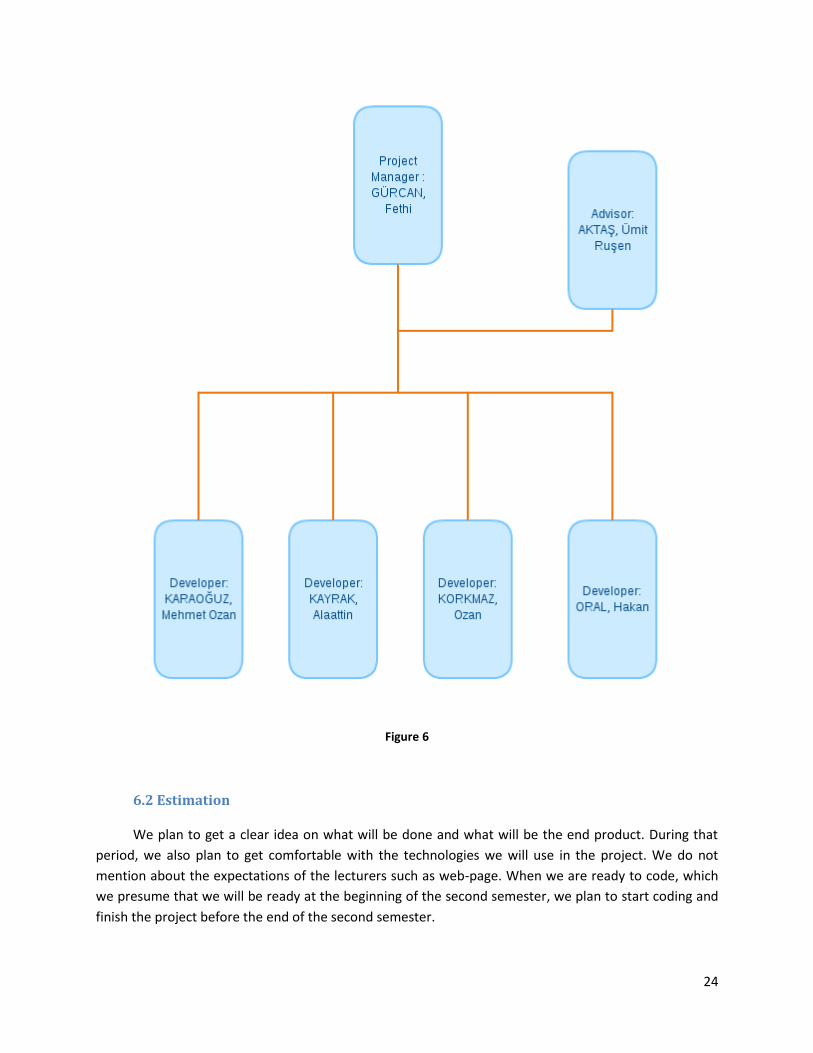
5. Behavioral Model and Description
5.1 Description for Software Behavior The editor will have two main parts, which will be client and server side of the editor. First one, client side, is to produce activities and connections on the canvas area. Activities will be created by drag and drop and there will be given
5.2 State Transition Diagrams
Figure 5
6. Planning
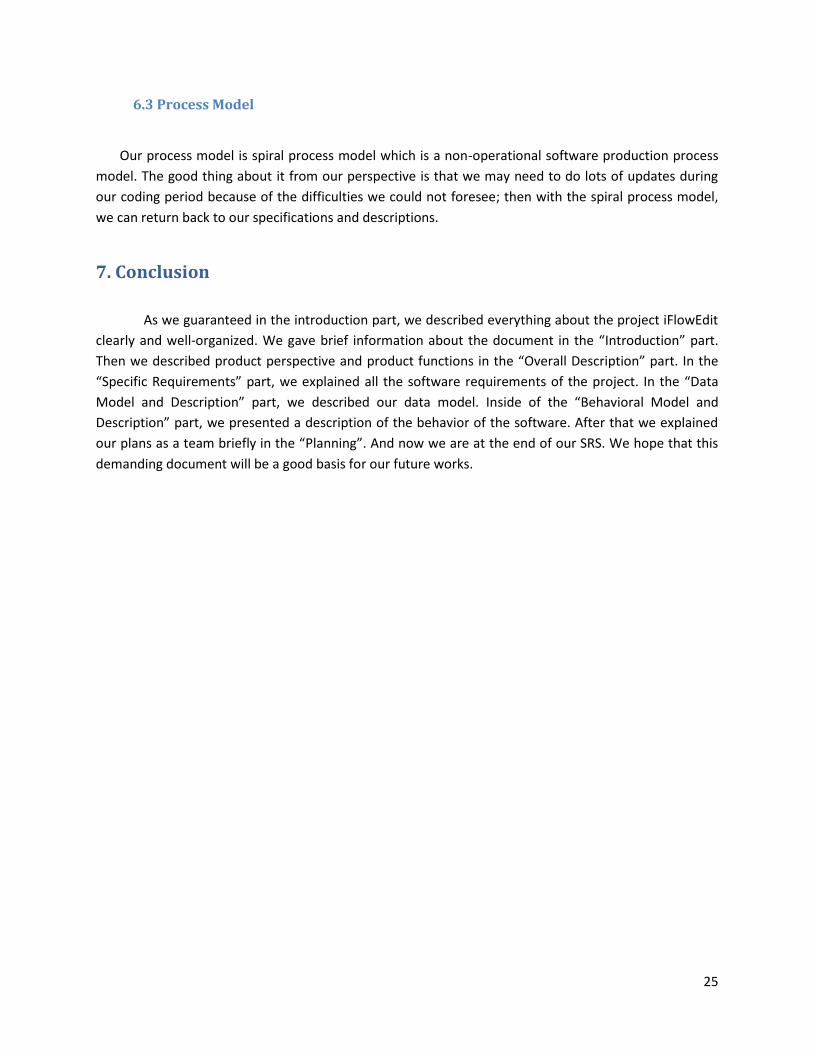
6.1 Team Structure
Our team TriUlti has a self-contained team structure as it has four members as developers who
are Mehmet Ozan KARAOĞUZ, Alaattin KAYRAK, Ozan KORKMAZ and Hakan ORAL; one project manager
who is Senior Software Development Manager Fethi GÜRCAN, and one advisor Research Assistant Ümit
Ruşen Aktaş. Figure 7 shows the team structure in detail.
24
Figure 6
6.2 Estimation
We plan to get a clear idea on what will be done and what will be the end product. During that
period, we also plan to get comfortable with the technologies we will use in the project. We do not
mention about the expectations of the lecturers such as web-page. When we are ready to code, which
we presume that we will be ready at the beginning of the second semester, we plan to start coding and
finish the project before the end of the second semester.
25
6.3 Process Model
Our process model is spiral process model which is a non-operational software production process
model. The good thing about it from our perspective is that we may need to do lots of updates during
our coding period because of the difficulties we could not foresee; then with the spiral process model,
we can return back to our specifications and descriptions.
7. Conclusion
As we guaranteed in the introduction part, we described everything about the project iFlowEdit
clearly and well-organized. We gave brief information about the document in the “Introduction” part.
Then we described product perspective and product functions in the “Overall Description” part. In the
“Specific Requirements” part, we explained all the software requirements of the project. In the “Data
Model and Description” part, we described our data model. Inside of the “Behavioral Model and
Description” part, we presented a description of the behavior of the software. After that we explained
our plans as a team briefly in the “Planning”. And now we are at the end of our SRS. We hope that this
demanding document will be a good basis for our future works.