Embed Size (px)
Citation preview
SOFTWARE RELATEDSOFTWARE-RELATEDMEASUREMENT:MEASUREMENT: RISKS AND OPPORTUNITIES
CEM KANER, J.D., PH.D.
OCTOBER 2007
COPYRIGHT © CEM KANERCOPYRIGHT © CEM KANER
INTRODUCTIONI've seen published claims that only 5% of software companies have metrics programs. Why so low? Are we just undisciplined and lazy? Most managers who I know have tried at least one y gmeasurement program--and abandoned them because so many programs do more harm than good, at a high cost. This session has three parts:three parts:
• Measurement theory and how it applies to software development metrics (which, at their core, are typically human performance measures).
• A couple of examples of qualitative measurements that can drive useful behavior.drive useful behavior.
• Analysis of some of the metrics that you're considering for the upcoming deployment of objectives.
2
MY FOCUSMost software engineering measures are human performance measures.
Writings on software engineering measurement routinely ignore Writings on software engineering measurement routinely ignore or underestimate the human factors of measurement, the ways in which people operate in a world in which they are being
dmeasured.
Rather than focus on good mechanics (see McConnel’s Software Estimation for that) or underlying mathematics (Zuse’s Framework ) y g (for Software Measurement or Fenton & Pfleeger’s Software Metrics) or naïve recipes, I ask…
• Wh t l t ft l t d h f • What can we apply to software-related human performance measurement from social science fields that focus on human performance?
3
MEASUREMENT THEORY• It’s not about counting things
• It’s about estimating the value of something
W d ’ b b b h l b • We don’t count bugs because we care about the total number of bugs
• We count bugs because we want to estimate:We count bugs because we want to estimate:
– a product’s quality, or
– a product’s reliability, orp y
– the probable tech support cost, or
– the skill or productivity of a tester, or
– the incompetence of a programmer, or
– the time needed before we can ship the product, or
– something else (whatever it is)…
4
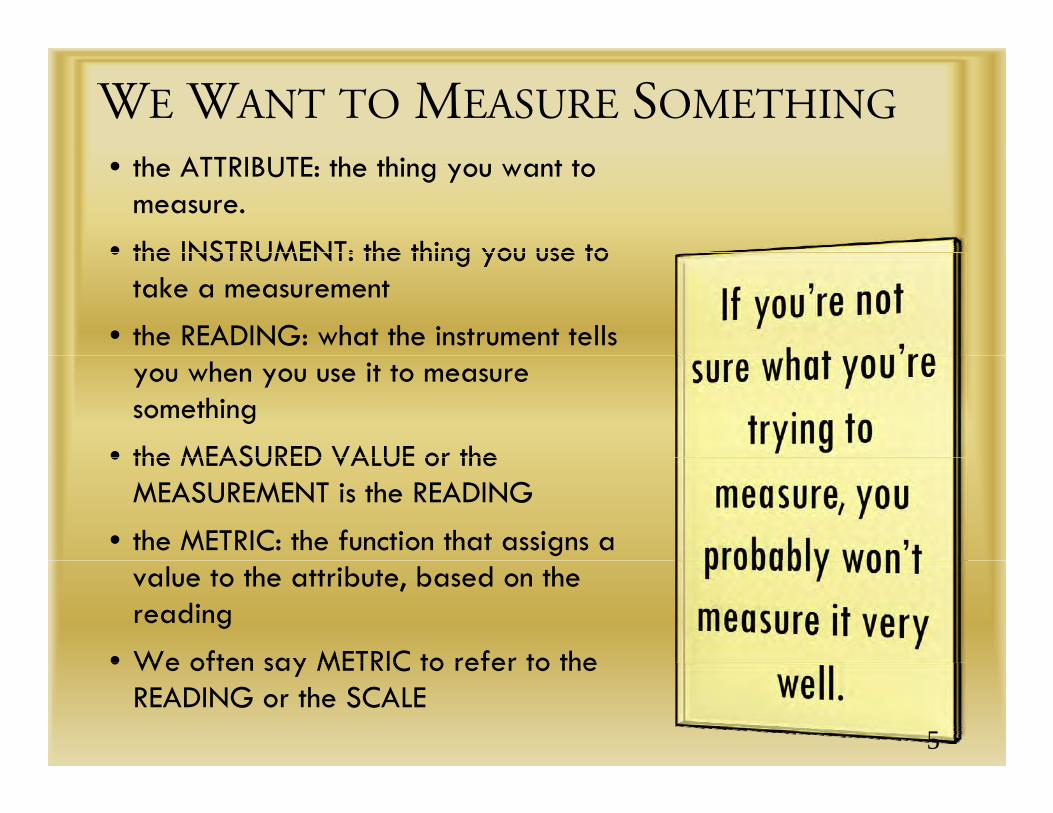
WE WANT TO MEASURE SOMETHING• the ATTRIBUTE: the thing you want to
measure.
• the INSTRUMENT: the thing you use to • the INSTRUMENT: the thing you use to take a measurement
• the READING: what the instrument tells you when you use it to measure something
• the MEASURED VALUE or the • the MEASURED VALUE or the MEASUREMENT is the READING
• the METRIC: the function that assigns a value to the attribute, based on the reading
• We often say METRIC to refer to the • We often say METRIC to refer to the READING or the SCALE
5
WHY DO WE WANT TO MEASURE IT?• make an estimate (this is often seen as value-neutral)
• prediction (an estimate of the future)
d l d l ( )• develop a model (science)
• evaluate someone or something
• coach someone• coach someone
• provide a basis for a commitment
• make a commitmentmake a commitment
• defend against criticism
• decide whether someone is lying (or incompetent)y g ( p )
• Estimates and predictions and models (in business) are usually used for those other purposes.
• That creates effects on all the humans involved.
6
MEASUREMENT: TRIVIAL CASE• Attribute: Width of the projector screen
• Instrument: Tape measure
R d 40 h (f h )• Reading: 40 inches (from the tape measure)
• Metric: inches on tape = inches of width
A few complexities of simple measurementsA few complexities of simple measurements
• Measurement error (random variation in reading the tape)
• Scale of the measurement (what you can read off the tape)Scale of the measurement (what you can read off the tape)
• Precision of the measurement (inches? miles?)
• Purpose of the measurement p
• Scope of the measurement (just this one screen?)
7
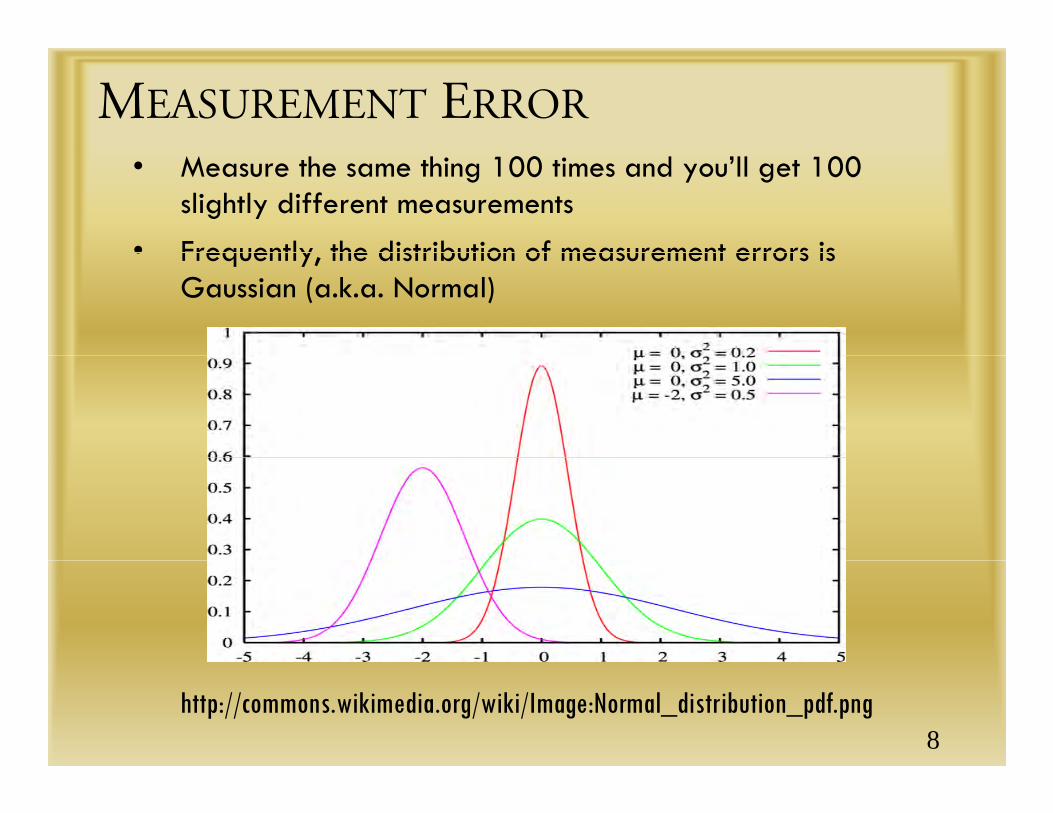
MEASUREMENT ERROR• Measure the same thing 100 times and you’ll get 100
slightly different measurements
• Frequently the distribution of measurement errors is • Frequently, the distribution of measurement errors is Gaussian (a.k.a. Normal)
http://commons.wikimedia.org/wiki/Image:Normal_distribution_pdf.png8
SCALE OF MEASUREMENTRatio Scale: e.g. the tape measure
• a / b = (x*a)/(x*b)• 20 inches / 10 inches = 200 inches / 100 inches20 inches / 10 inches 200 inches / 100 inches
Interval Scale: also, the tape measure• a - b = (x + a) - (x + b)• 20 inches - 10 inches = 220 inches – 210 inches• We can have an interval scale when we don’t have (don’t know)
(don’t use) true zero, e.g. Farenheit( ) , g• Multiplying ordinals is meaningless
Ordinal Scale• 1st, 2nd, 3rd place in a cooking contest• adding or dividing two ordinals is meaningless
Nominal ScaleNominal Scale• Joe, Susan, IBM, ranking or adding is meaningless
9
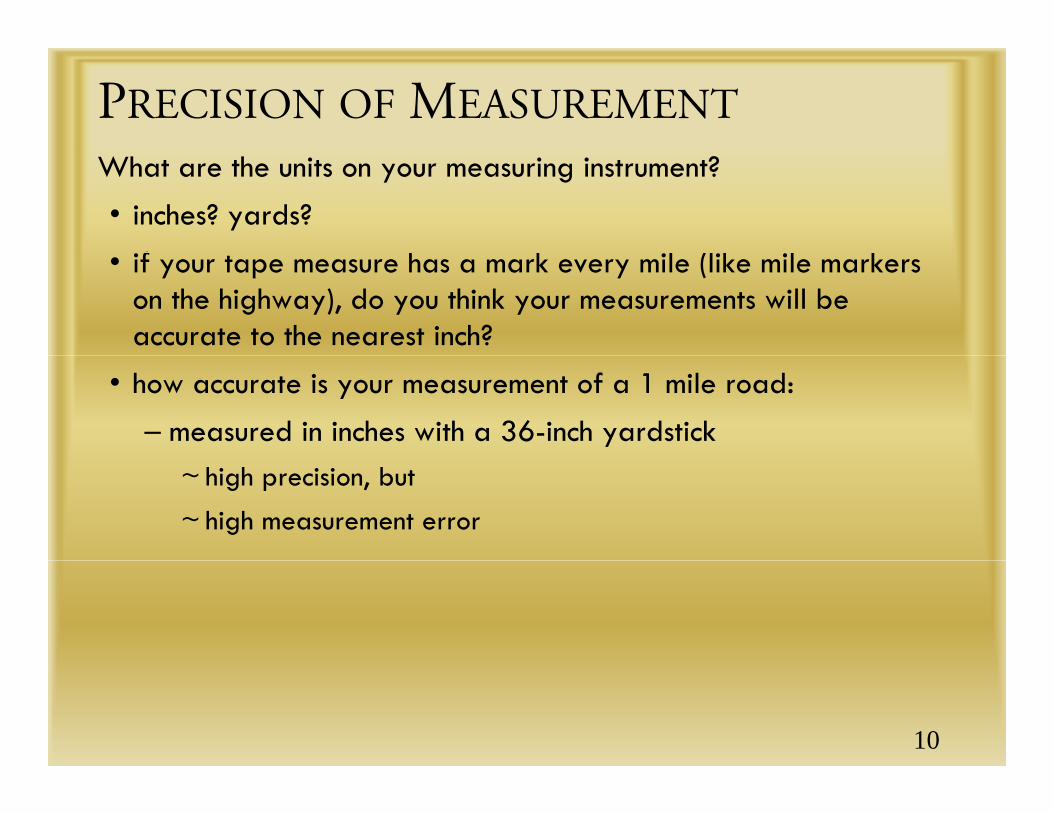
PRECISION OF MEASUREMENTWhat are the units on your measuring instrument?
• inches? yards?
f h k l (l k l k • if your tape measure has a mark every mile (like mile markers on the highway), do you think your measurements will be accurate to the nearest inch?
• how accurate is your measurement of a 1 mile road:
– measured in inches with a 36-inch yardstick~ high precision, but
~ high measurement error
10
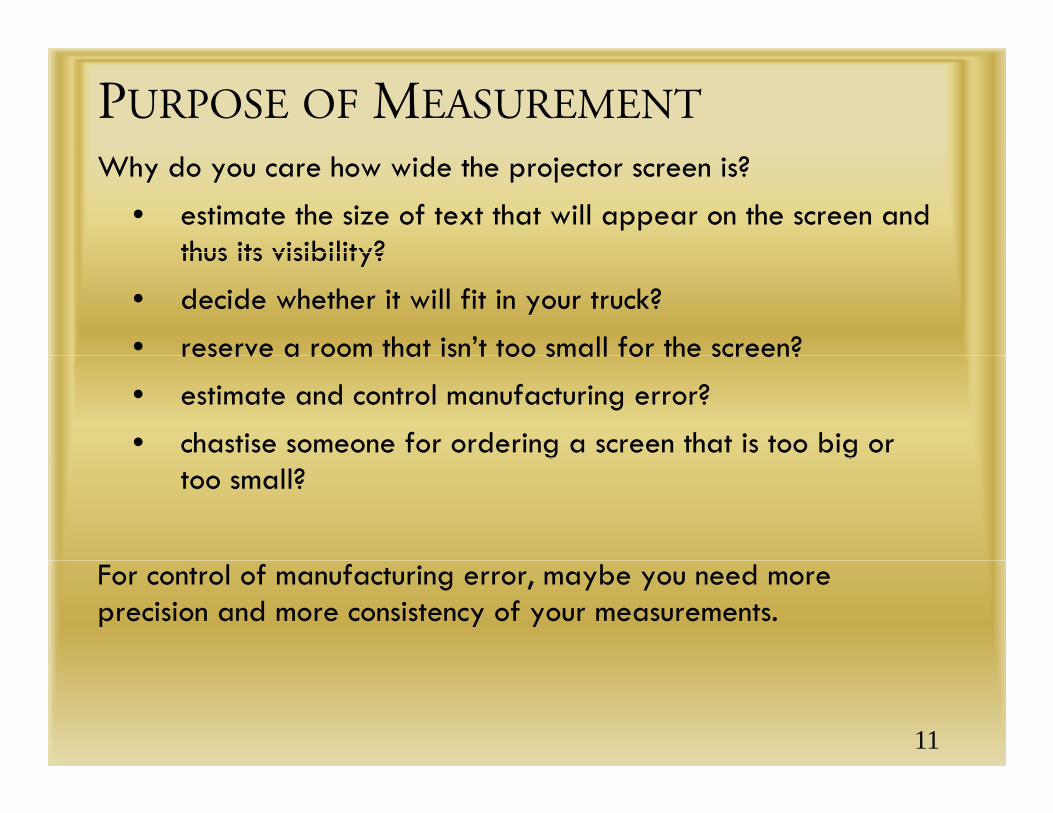
PURPOSE OF MEASUREMENTWhy do you care how wide the projector screen is?
• estimate the size of text that will appear on the screen and thus its visibility?thus its visibility?
• decide whether it will fit in your truck?
• reserve a room that isn’t too small for the screen?reserve a room that isn t too small for the screen?
• estimate and control manufacturing error?
• chastise someone for ordering a screen that is too big or g gtoo small?
For control of manufacturing error, maybe you need more precision and more consistency of your measurements.
11
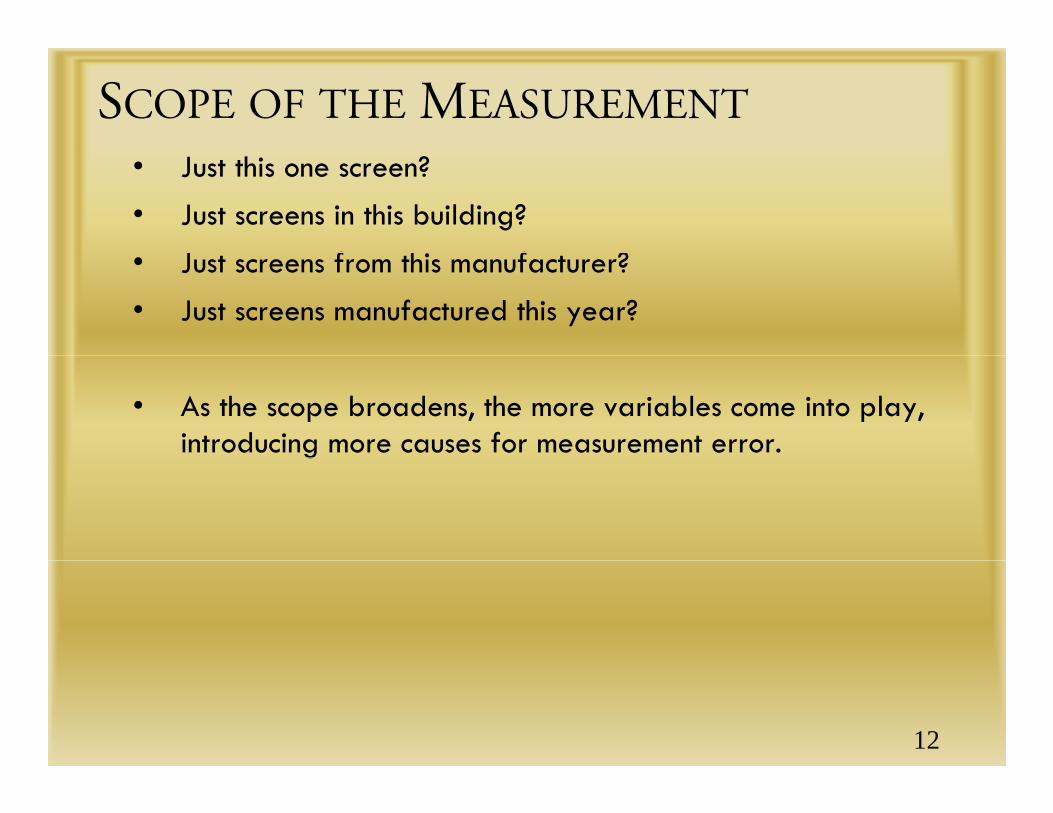
SCOPE OF THE MEASUREMENT• Just this one screen?
• Just screens in this building?
J f h f ?• Just screens from this manufacturer?
• Just screens manufactured this year?
• As the scope broadens, the more variables come into play, introducing more causes for measurement error.g
12
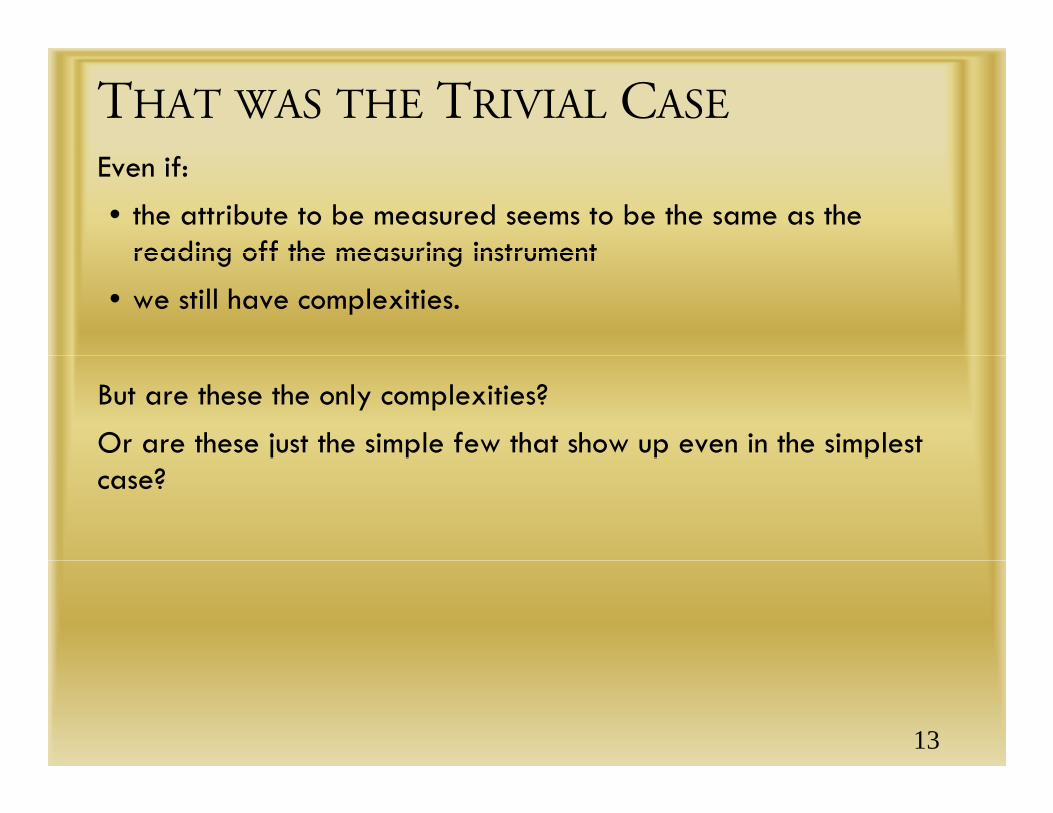
THAT WAS THE TRIVIAL CASEEven if:
• the attribute to be measured seems to be the same as the reading off the measuring instrumentreading off the measuring instrument
• we still have complexities.
But are these the only complexities?
Or are these just the simple few that show up even in the simplest j p p pcase?
13
MEASUREMENT?"Measurement is the assignment of numbers to objects or events according to rule. The rule of assignment can be any consistent rule. The only rule not allowed would be random yassignment, for randomness amounts in effect to a nonrule." [S.S. Stevens]
"M t i th b hi h b b l Measurement is the process by which numbers or symbols are assigned to attributes of entities in the real world in such a way as to characterize them according to clearly defined rules." [Fenton & Pfleeger]
Measurement is "the act or process of assigning a number or category to an entity to describe an attribute of that entity." category to an entity to describe an attribute of that entity. [IEEE Std 1061, p. 2]
14
MEASUREMENT?How I can grade my students …
G d 100 / ( d ’ d f l )Grade = 100 / (student’s seat: distance from my lectern)
• assigns a unique number
• reproducible assignment• reproducible assignment
• can be assigned with precision
• nonrandomnonrandom
But does it measure whatever it is that we might think grades g gmeasure?
What do grades measure?
15
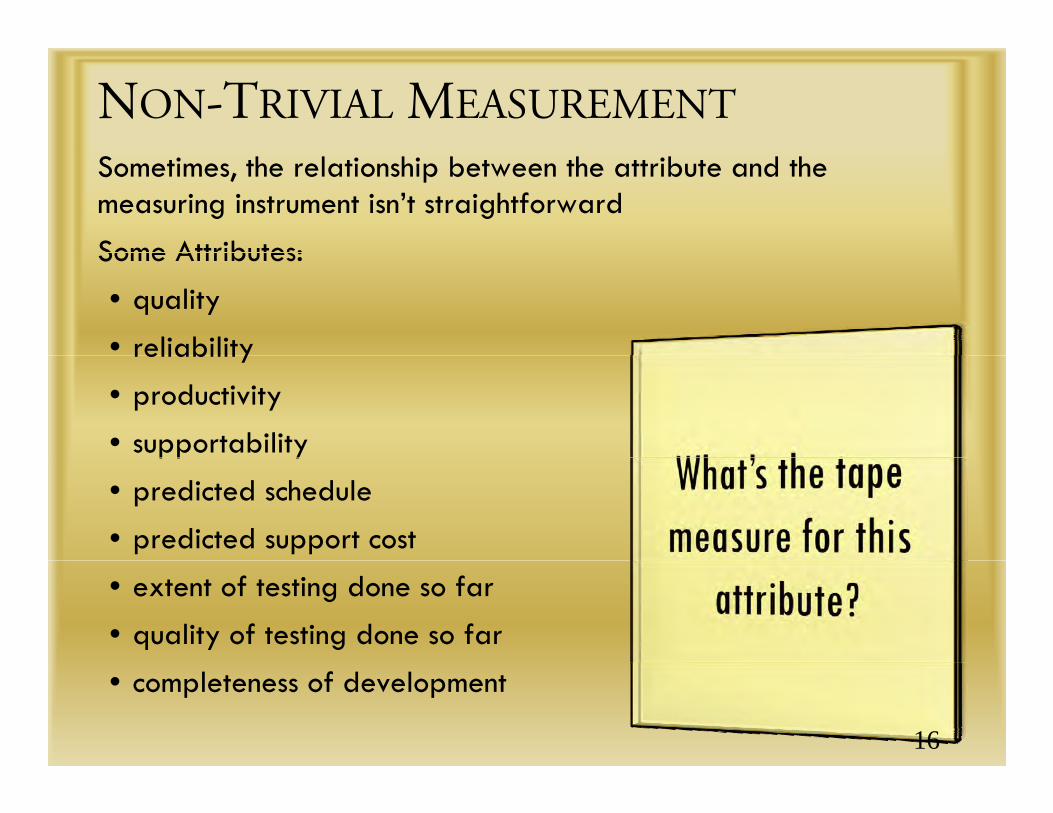
NON-TRIVIAL MEASUREMENTSometimes, the relationship between the attribute and the measuring instrument isn’t straightforward
Some Attributes:Some Attributes:
• quality
• reliabilityreliability
• productivity
• supportabilitypp y
• predicted schedule
• predicted support cost
• extent of testing done so far
• quality of testing done so far
• completeness of development
16
SURROGATE (OR PROXY) MEASURES
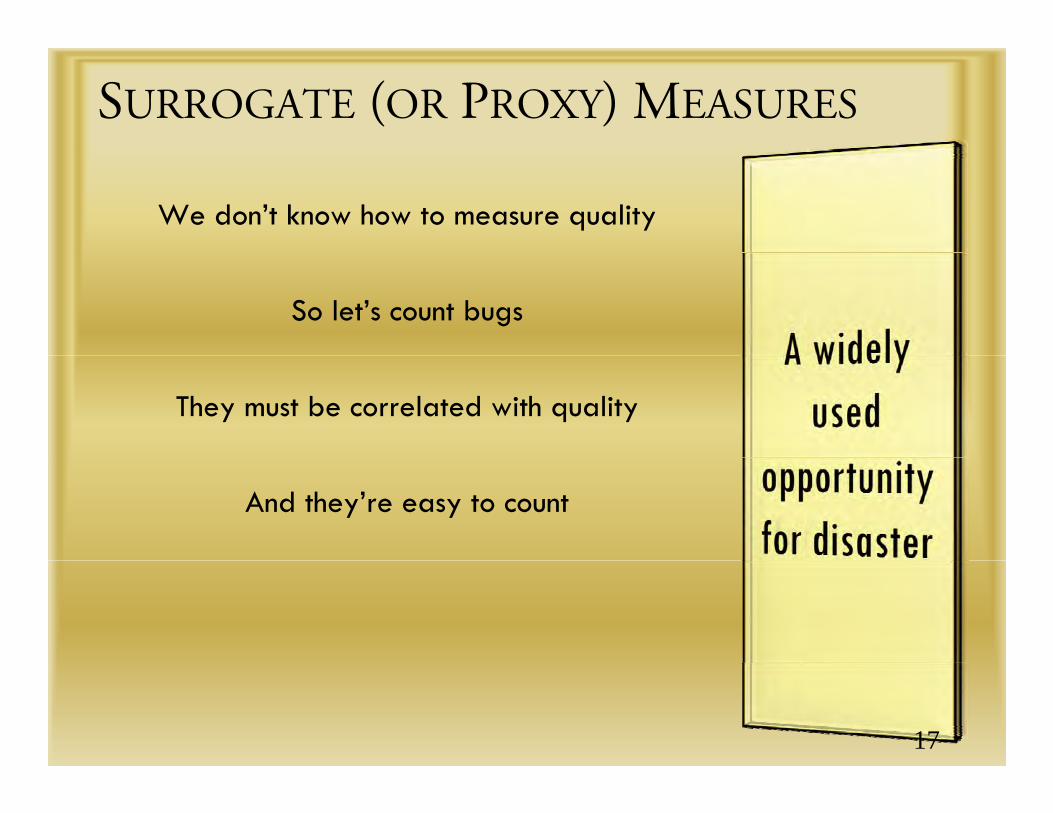
We don’t know how to measure quality
So let’s count bugs
They must be correlated with quality
And they’re easy to count
17
LET’S COUNT BUGSIf “quality” = few bugs found
• we just have to stop finding bugs
l ’ f – let’s fire some testers
– or have them write reports~ maybe we need a new process ~ maybe we need a new process
improvement plan
– or they could run tests that won’t find bugs~ like regression tests (a set of tests
that might have found a bug a long g g gtime ago, but the program usually passes them now)
18
ANOTHER EXAMPLE
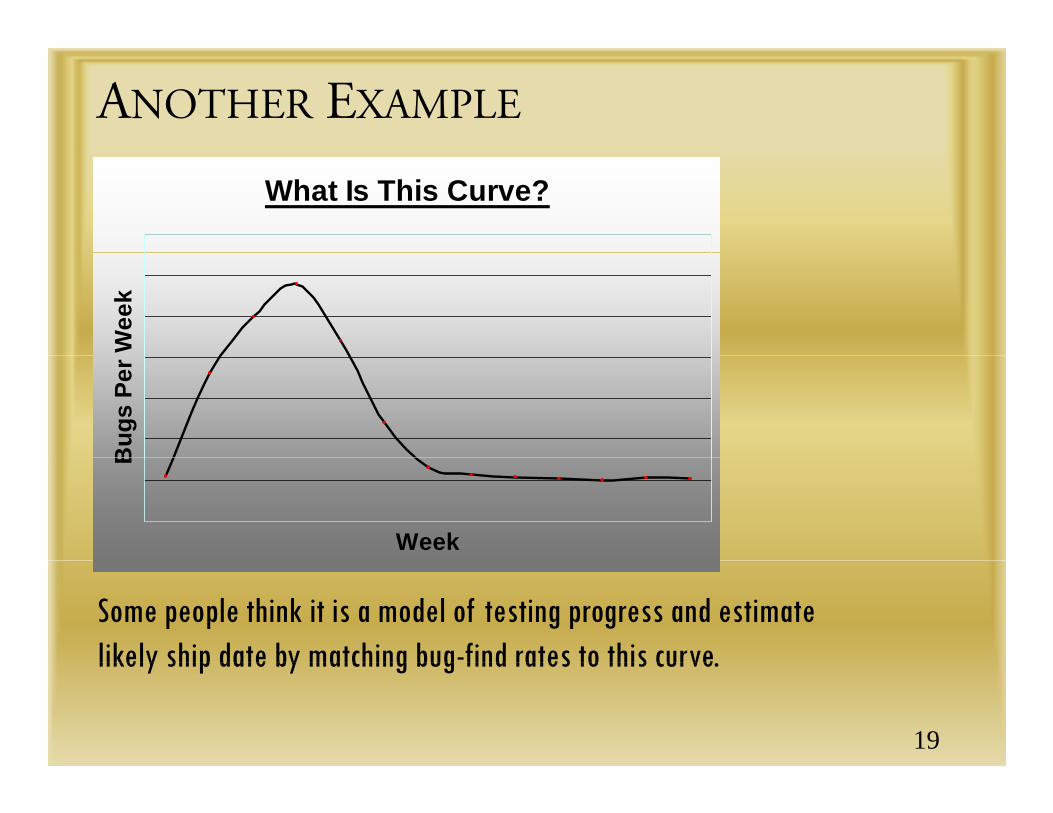
What Is This Curve?
Wee
kB
ugs
Per
Week
B
Some people think it is a model of testing progress and estimate likely ship date by matching bug-find rates to this curve.likely ship date by matching bug find rates to this curve.
19
WHAT IS THE PREDICTABLE MISCHIEF?Early testing:
• Run tests of features known to be broken or incompletebroken or incomplete.
• Run multiple related tests to find multiple related bugs.
• Look for easy bugs in high quantities rather than hard bugs.
L h f • Less emphasis on infrastructure, automation architecture, tools and more emphasis of bug finding. (Short term payoff but long term inefficiency.)
20
WHAT IS THE PREDICTABLE MISCHIEF?Later testing• Run lots of already-run regression tests• Don’t look as hard for new bugsg• Shift focus to status reporting• Classify unrelated bugs as duplicates• Close related bugs as duplicates hiding key data about • Close related bugs as duplicates, hiding key data about
the symptoms / causes of a problem.• Postpone bug reporting until after a measurement
checkpoint (milestone). (Some bugs are lost.)checkpoint (milestone). (Some bugs are lost.)• Programmers ignore the bugs they find until testers report
them• Testers report bugs informally keep them out of the Testers report bugs informally, keep them out of the
tracking system• Send testers to the movies before measurement
checkpoints.p• Bugs are taken personally.• More bugs are rejected. 21
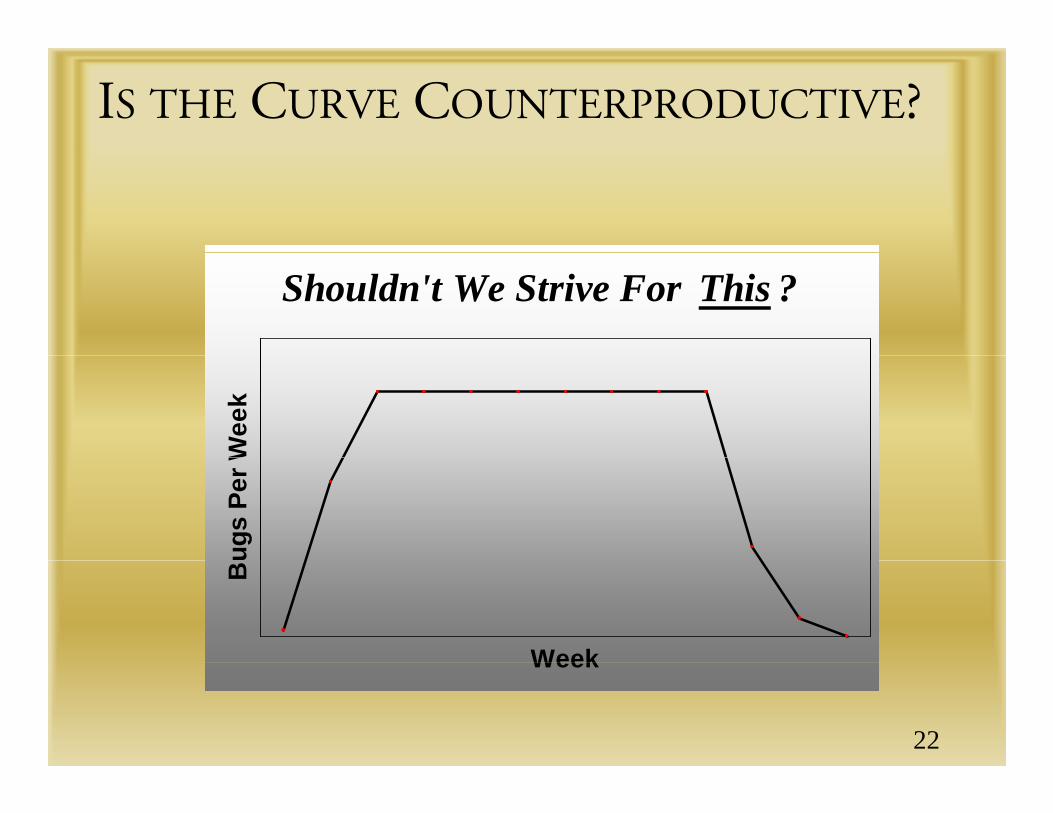
IS THE CURVE COUNTERPRODUCTIVE?
Shouldn't We Strive For This ?W
eek
ugs
Per W
Week
B
Week
22
MORE PROBLEMS?• Bug counts don't measure productivity, skill, or progress
• Hours at work don't measure productivity, skill, or dedicationp y, ,
• Certification doesn't measure productivity, skill, knowledge, competence, or professionalism
• Peer ratings can easily degenerate into popularity contests
• “Customer” ratings (e.g. ratings by programmers, etc.) can easily degenerate into popularity contests and foster easily degenerate into popularity contests and foster gutlessness.
23
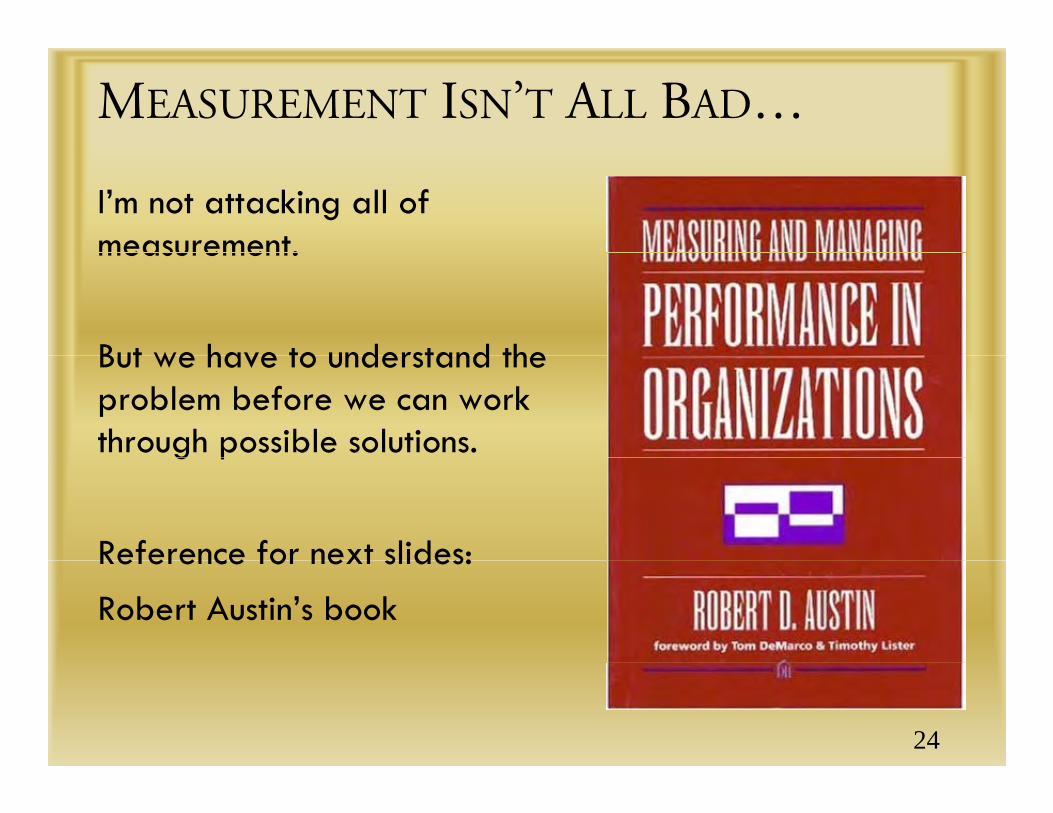
MEASUREMENT ISN’T ALL BAD…
I’m not attacking all of measurement.measurement.
But we have to understand the But we have to understand the problem before we can work through possible solutions.g p
Reference for next slides:Reference for next slides:
Robert Austin’s book
24
MEASUREMENT DYSFUNCTION• Schwab (US Steel) goes to the steel plant one day and marks
the number of ingots of steel
• Next day he comes back His chalked number is crossed out and • Next day he comes back. His chalked number is crossed out and replaced with a larger one (more steel today)
• Next day, even more steel (magic!)
• Classic moral of the story is that things improve when you measure them.
• Austin’s Questions
– How might these people have improved measured productivity?
Wh t id ff t i ht th h b f i i –What side effects might there have been of improving measured productivity?
25
MEASUREMENT DISTORTION ANDDYSFUNCTIONDYSFUNCTION• A measurement system yields distortion if it creates incentives
for the employee to allocate his time so as to make the measurements look better rather than to optimize for achieving the organization's actual goals for his work.
• Dysfunction involves fulfilling the letter of stated intentions but • Dysfunction involves fulfilling the letter of stated intentions but violating the spirit. A system is dysfunctional if optimizing for measurement so distorts the employee's behavior that he provides less value to the organization than he would have provided in the absence of measurement.
26
AUSTIN ON THE 2-PARTY MODELPrincipal (employer)
• The person who wants the result and who directly profits from the resultthe result.
• In the classic two-paty model, we assume that the employer is motivated by maximum return on investment
Agent (employee)
• In the classic two-party model, the employee wants to do the l k f h least work for the most money
27
SUPERVISORY ISSUES IN THE 2-PARTY MODEL
No supervision
• No work
P i l i iPartial supervision
• Work only on what is measured
Full supervisionFull supervision
• Work only on what is measured, but everything is measured, so work exactly how the employer wants the employee to work. y p y p y
• Even if this could be perfect work, it is impossible because full supervision (managing every detail of everything) is impossible
• Therefore, we always have no supervision or partial supervision.
28
SUPERVISORY ISSUES IN THE 2-PARTY MODEL
Partial supervision
• There is no risk of distortion or dysfunction in the two-party model because the employee won't do anything that isn't model because the employee won t do anything that isn t measured.
• More measurement yields more work and under this model, more work (no matter how inefficient) yields more results than less work.
29
AUSTIN'S 3-PARTY MODELCustomer
• Wants the most benefit for the lowest price
P i i l (E l )Principal (Employer)
• With respect to the employee, same as before: least pay for the most workmost work
• With respect to the customer, wants to increase customer satisfaction
Agent (Employee)
• With respect to employer, same as before: least work for the most paymost pay
• With respect to the customer, motivated by customer satisfaction
30
AUSTIN'S 3-PARTY MODELA key aspect of this model is that it builds in the notion of internal motivation.
• Under full supervision with forcing contracts perhaps internal • Under full supervision with forcing contracts, perhaps internal motivation is unnecessary.
• Under partial supervision and no supervision, internal motivation plays an important role in achieving customer satisfaction and in eliciting effort and results from the employee.p y
• This comes into play in Austin’s vision of delegatorymanagement:
– Sometimes, the employee will do better work if you trust her and leave her unmeasured than if you guide her work with metrics.
31
SUPERVISORY ISSUES IN THE 3-PARTY MODEL
If there is no supervision
• Employee optimizes the time that she spends working, so that she provides the most customer benefit that she can within the she provides the most customer benefit that she can, within the labor that he provides.
• Employee works to the extent that increasing customer satisfaction (or her perception of customer satisfaction) provides more “benefit” to the employee than it costs her to work.
If there could be full supervision
• The employee would do exactly what the employer believed should be done to increase customer satisfaction.
• But full supervision is impossible. We have no supervision, or partial supervisionpartial supervision.
32
SUPERVISORY ISSUES IN THE 3-PARTY MODEL
Effect of partial supervision
• Employee is motivated by
d f d b – increased customer satisfaction and by
– rewards for performing in ways that look good according to employer’s measurements.employer s measurements.
• To the extent that the agent works in ways that don’t maximize customer satisfaction at a given level of effort, we have di idistortion.
• To the extent that the agent works in ways that reduce customer satisfaction below the level that would be achieved customer satisfaction below the level that would be achieved without supervision, we have dysfunction.
33
2-PARTY VS 3-PARTY MODELS• The real world is closer to the 3-party model (except there are
even more parties)
• Most of the discussion in the software engineering literature and • Most of the discussion in the software engineering literature and in metrics training courses:
– assumes the 2-party model or
– accepts 3-party but assumes away the risk of measurement dysfunction
R l W h h• Result: We hear that:
– more measurement is better
surrogate measure (proxy measure) is OK– surrogate measure (proxy measure) is OK
– measurement risks are theoretical (unimportant): it’s always better to measure, even with bad measures
– you can’t manage what you don’t measure.34
BACK TO MEASUREMENT OVERVIEW• We want to measure the attribute
– It has a natural scale (is “quality” ratio-scaled?) and inherent variability (is your intelligence the same every day?)y ( y g y y )
• We use one or more instruments to collect measurement data
– the measurements have inherent variability and resolution ( i i )(precision)
• We need a theory of relationship between the metric and the attribute.
– If the measured number goes up 20%, what does that tell us about the attribute?
• We should carefully consider potential side effects• We should carefully consider potential side effects
• Scope and purpose of the measurement can have big impacts on the risk of dysfunction
35

THE BIGGEST WEAKNESSWe skip the question “WHAT IS THE ATTRIBUTE?” too often.
Construct validity:Construct validity:
• Does this measure what I think it measures?
• Most important type of validity
• Widely discussed in measurement theory
– except by computer scientists and software engineers
who almost never talk about it– who almost never talk about it
– search ACM’s Digital Library or IEEE portal yourselfp y
– appallingly rare discussion36
MEASURING EMPLOYEE PERFORMANCE• Start with the attribute.
• There is no one thing that is employee performance.
A b h l f k• A job has lots of tasks.
• Look at the most important ones, one by one.
• Evaluate each one in detail so that you can tell the difference • Evaluate each one in detail, so that you can tell the difference (at least on an ordinal scale) between good work and less good work.
37
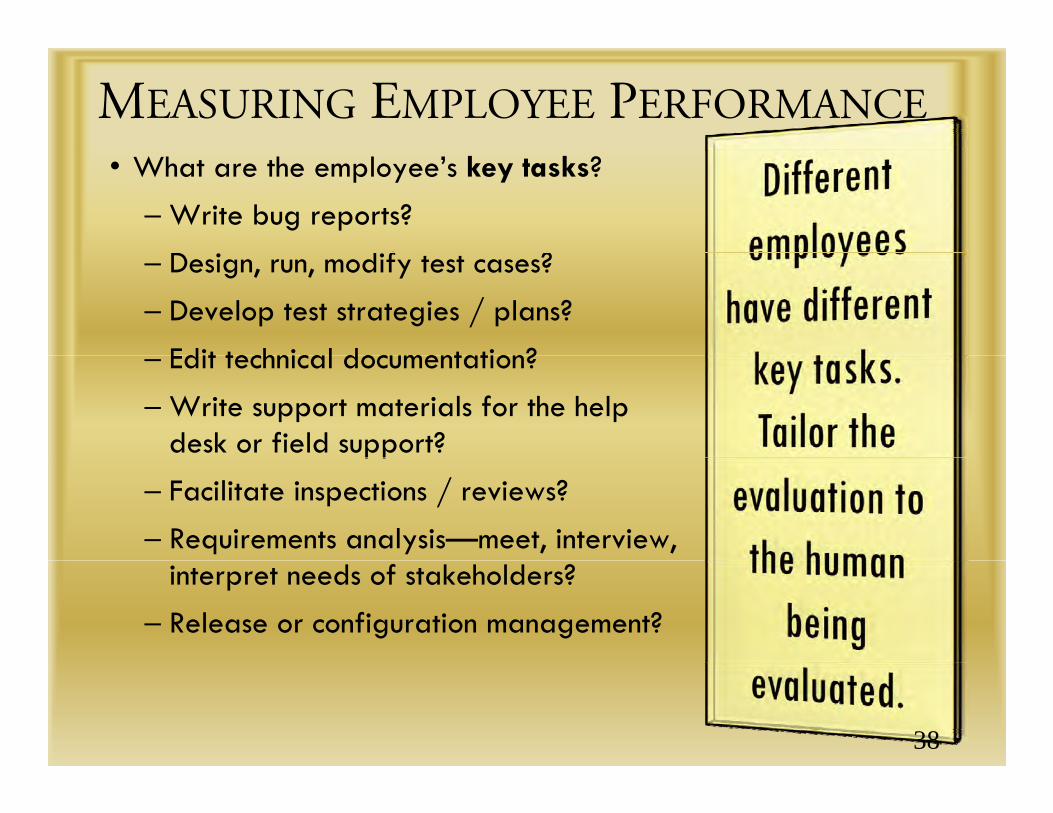
MEASURING EMPLOYEE PERFORMANCE• What are the employee’s key tasks?
–Write bug reports?
D d f ?– Design, run, modify test cases?
– Develop test strategies / plans?
Edit technical documentation?– Edit technical documentation?
–Write support materials for the help desk or field support?pp
– Facilitate inspections / reviews?
– Requirements analysis—meet, interview, interpret needs of stakeholders?
– Release or configuration management?
38
QUALITATIVE MEASUREMENTMy primary sources of information are not numeric.
• I don't count bugs or lines of code or hours at work.
T f h h k d h k• To gain an impression of her thinking and her work:
– I review specific artifacts of the tester
I discuss specific performances with the tester preferably – I discuss specific performances with the tester, preferably while she is performing them (rather than during Evaluation Week)
– I discuss the work of the tester with others
Examples:
• bug reports
• test cases and risk analysis
h d li• scheduling
39
EVALUATING BUG REPORTINGImagine taking a sample of an employee’s bug reports, perhaps 10 reports filed over a 6-month period.
How can you decide how good each report is?How can you decide how good each report is?
Here are some training guidelines that I developed (based on what colleagues and I have done) for appraising the quality of a bug report.
This list is not a checklist. You don’t want to answer every question—that would take too long question—that would take too long.
But as you review the report and the bug it describes, these suggestions will give you ideas of questions you might want to ask next.
40
START BY FORMING A FIRST IMPRESSION
Don’t try to replicate the bug yet. Just skim the report and think about your reaction. What have you learned form the report, and how hard was it to learn it?Is the summary short (about 50-70 characters) and descriptive?
Can you understand the report?
• As you read the description, do you understand what the reporter did?
C h h d d ? • Can you envision what the program did in response?
• Do you understand what the failure was?
Is it obvious where to start (what state to bring the program to) to Is it obvious where to start (what state to bring the program to) to replicate the bug?
Is it obvious what files to use (if any)? Is it obvious what you would ( y) ytype?
41
FIRST IMPRESSIONIs the replication sequence provided as a numbered set of steps, which tell you exactly what to do and, when useful, what you will see?
Does the report include unnecessary information, personal opinions or anecdotes that seem out of place?
Is the tone of the report insulting? Are any words in the report potentially insulting?
Does the report seem too long? Too short? Does it seem to have a Does the report seem too long? Too short? Does it seem to have a lot of unnecessary steps? (This is your first impression—you might be mistaken. After all, you haven’t replicated it yet. But does it LOOK lik th ’ l t f i th t?) LOOK like there’s a lot of excess in the report?)
Does the report seem overly general (“Insert a file and you will see” – what file? What kind of file? Is there an example, like p ,“Insert a file like blah.foo or blah2.fee”?)
42
REPLICATE THE REPORTNow, replicate the bug. How well was it actually described?Can you replicate the bug?
D d d dd l f ?Did you need additional information or steps?
Did you get lost or wonder whether you had done a step correctly? Would additional feedback (like, “the program will correctly? Would additional feedback (like, the program will respond like this...”) have helped?
Did you have to guess about what to do next?
Did you have to change your configuration or environment in any way that wasn’t specified in the report?
Did some steps appear unnecessary? Were they unnecessary?Did some steps appear unnecessary? Were they unnecessary?
43
REPLICATE THE REPORTDid the description accurately describe the failure?
Did the summary accurate describe the failure?What about statements that convey the tester’s judgment?What about statements that convey the tester’s judgment?• Does the description include non-factual information (such as the
tester’s guesses about the underlying fault) and if so, does this information seem credible and useful or not?
• Does the description include statements about why this bug would be important to the customer or to someone else?would be important to the customer or to someone else?
• The report need not include such information, but if it does, it should be credible, accurate, and useful.
44
FOLLOW-UP TESTS
Are there follow-up tests that you would run on this report if you had the time?
• I f ll t ti t t th t i ld d l th• In follow-up testing, we vary a test that yielded a less-than-spectacular failure. We vary the operation, data, or environment, asking whether the underlying fault in the code can yield a more serious failure or a failure under a broader range of circumstances.
• You will probably NOT have time to run many follow-up tests You will probably NOT have time to run many follow up tests yourself. For evaluation, my question is not what the results of these tests were. Rather it is, what follow-up tests should have been run—and then what tests were run?been run—and then, what tests were run?
What would you hope to learn from these tests?
How important would these tests be?How important would these tests be?
45
FOLLOW-UP TESTSAre some tests so obviously probative that you feel a competent reporter would definitely have run them and described the results? For example, p ,
• A report describes a corner case without apparently having checked non-extreme values.
• A report relies on specific values, with no indication about whether the program just fails on those or on anything in the same class (what is the class?) ( )
• A report is so general that you doubt that it is accurate (“Insert any file at this point” – really? Any file? Any type of file? Any i ? Did th t t l f t b li thi size? Did the tester supply reasons for you to believe this
generalization is credible? Or examples of files that actually yielded the failure?)
46
BASE ASSESSMENT ON MULTIPLE SAMPLESMeasurement error arises in qualitative analysis, at least as much as statistical process control
• Not just one project• Not just one project
• Not just bug reports for one programmer
• Not just one test planNot just one test plan
• Not just one style of testing
• Not just performance this monthj p
It's not enough to be fair (with evaluation spread over time). It is essential that you be perceived to be fair. Lack of perceived fairness drives your relationship with the employee back to the 2fairness drives your relationship with the employee back to the 2-party model baseline.
47
ANOTHER EXAMPLE: RISK ANALYSIS• Review an area (e.g. functional area) of the program under test
by this tester.
• Here are some questions that I might ask an employee to • Here are some questions that I might ask an employee to answer.
–What are the key risks?
– How do you know?
–What is your strategy for identifying and appraising risks?
– How are you testing against these risks?
– How are you optimizing your testing against these risks?
48
RISK ANALYSISGiri Vijayaraghavan wrote a M.Sc. thesis on risk-based testing and then did follow-up research at T.I.
• See his papers at http://www testingeducation org/articles• See his papers at http://www.testingeducation.org/articles
James Bach created the Heuristic Test Strategy Model for walking through the product, quality expectations for the product, and project management factors to identify potential areas of weakness.
• See his model at http://www satisfice com/tools/satisfice-tsm-• See his model at http://www.satisfice.com/tools/satisfice-tsm-4p.pdf
Both of these are examples of the broader category of techniques called Failure Mode & Effects Analysis.
49
RISK ANALYSISThere are other ways to imagine:
• how the program could fail or
h f h f f h • what tests are interesting from the point of view of the question, what could fail
For more examples, see my course slides and videos atFor more examples, see my course slides and videos at• www.testingeducation.org/BBST/BBSTRisk-BasedTesting.html
Ultimately, you are trying to figure out:
• what techniques this tester uses to identify risks and design tests related to them
H f th ti i ht k i t i t Here are some of the questions you might ask in trying to appraise whether the tester is doing this well.
50
RISK ANALYSIS: IDENTIFYING RISKS• Can the tester articulate her strategy for identifying risks?
• Based on the model you use for identifying risks, can you think of any risk areas that were missed?of any risk areas that were missed?
• Does the tester think in multidimensional terms (this might fail under these conditions, or these aspects of functionality might conflict when used together)?
• Are the risks appropriate to the business and technical domains? domains?
• Is the tester paying attention to the classes of risk that would count to the stakeholder or distributing her analytical effort arbitrarily?
• How far out of the box does the tester think?
51
RISK ANALYSIS: IDENTIFYING RISKS• Is the tester consulting sources of failure (e.g. help desk records)
to check whether there are classes of potential failures that the risk list doesn’t imagine?g
• Are other available sources consulted?
• Is the tester getting effective peer review of her lists?
• Given feedback on her risk list (and estimated significance of problems), does the tester actually use that feedback and change the risk list or risks database appropriately?change the risk list or risks database appropriately?
• Does the tester recognize when she doesn’t know how to imagine the details of some classes of risk and get help?
• Does the tester imagine risks associated with interaction with other products / platforms or is she stuck thinking inside the box that contains only this product?that contains only this product?
52
RISK ANALYSIS: SIGNIFICANCE AND CREDIBILITY
• Can / does the tester develop tests to gain insight into the likelihood of a particular failure or potential cost of it? Can he provide examples of these types of tests?p p yp
• Are any of the claimed risks implausible?
• Are the risks communicated effectively? For example, are they tied to business or stakeholder value?
• Would a stakeholder consider this risk analysis sufficiently relevant and comprehensive?relevant and comprehensive?
• How does the tester characterize or compute the magnitude of risk? Does he consider both the likelihood of failure in the field (where does he get relevant data?) and potential consequences?
53
RISK ANALYSIS: TEST DESIGNGiven a list of potential problems in the product:
• Are suitable tests designed for each problem (or each one of sufficient priority)?sufficient priority)?
– A suitable test is one that is well suited to exposing the problem if it is present in this product
• Is the test documented in a way that makes it traceable to the risk? (Assuming, which may be incorrect, that you want such documentation )documentation.)
• If tests are developed on the basis of risks, is the tester prioritizing test development wisely (highest priority to the worst risks)?
• Does the tester recognize when she doesn’t know how to test for a given risk and get help?for a given risk and get help?
• What is the tester’s stopping rule for this work?54
GATHERING INFORMATION FROM OTHERSYou are only one perceiverThe tester provides services to others• Evaluate the tester's performance by• Evaluate the tester s performance by– Examining the tester's work products for others– Interviewing the others, typically supported by a standard g , yp y pp y
questionnaire• Make sure you interview people with different interests
T h t d d t ti t j t d – Tech support and documentation, not just programmers and project managers
• Ask performance oriented questions, not just how “good” the tester is
• Look for patterns across people / groups. If there is no consistency in how people evaluate this person, why not?y p p p , y
55
QUALITATIVE MEASUREMENT: IMPACTThe essence of impact measurement is its effect on others. So, collect these data from other people.
• 360-Degree Reviews often suffer from lack of specificity. Here 360 Degree Reviews often suffer from lack of specificity. Here are a few illustrations of more specific, open-ended, behavioralquestions
Wh k did / f hi ?–What tasks did you expect / want from this person?
–What did they do?
– Please give examplesPlease give examples
– How pleased were you?
–What could they improve?y p
–What was left, after they did their thing, that you or someone else still needed to do?
H d bl h k ( l – How predictable was their work (time, coverage, quality, communication)?
56
GOAL-QUESTION-METRICS APPROACHTo decide what to measure, we should first know why we care about the answer. Given a goal for the measurement, we can work forward to collect information that can help us meet that pgoal.
Basic approach• Set the goal
• Identify questions that would give you information that you need in order to meet the goalg
• Determine whether there are (or whether you can create) metrics that can help you answer those questions.
• Vocabulary note: “metric” here is used the way I use “instrument” to this point.
57
GQM TEMPLATES FOR DEFINING A GOAL• Purpose:
– TO (characterize, evaluate, predict, motivate, etc.)
THE ( d d l ) – THE (process, product, model, metric, etc.)
– IN ORDER TO (understand, assess, manage, engineer, learn, improve, test, etc.)improve, test, etc.)
• Perspective:
– EXAMINE THE (cost, effectiveness, correctness, defects, (changes, product metrics, reliability, etc.)
– FROM THE POINT OF VIEW OF (the programmer, manager, customer corporate perspective etc )customer, corporate perspective, etc.)
• Environment: e.g. process factors, people factors, problem factors, methods, tools, constraints, etc.
» Adapted from Basili58
PRACTICE: EXAMPLE FROMROSENBERGOS N GTo PREDICT the SCHEDULE in order to MANAGE it.
• What are some relevant questions?
Wh h h b bl h ?• Which ones might be answerable with metrics?
• What assumptions or preconditions or challenges are associated with those questions or metrics?associated with those questions or metrics?
59
TO PREDICT THE SCHEDULE IN ORDER TO MANAGE IT.
• Predict?
– what do we mean, predict?
h d h k k d ?– what do we have to know to make a prediction?
• Schedule?
what are we scheduling?– what are we scheduling?
– what resources can we include?
• Manage?Manage?
– what are the degrees of freedom?
– what is the scope of the manager’s authority?p g y
60
TO PREDICT THE SCHEDULE IN ORDER TO MANAGE IT.
• Some questions lead to obvious research / numbers.
• Some questions are harder, more expensive, maybe unanswerable unanswerable.
– Maybe your goal cannot be achieved through measurement. ~ Measurement can give you information, but it can’t write your g y , y
code.
– Maybe measurement only takes you part of the way to your goalgoal
• Many people start with the metric they want to use (always use) (know how to collect) and work backward from that metric ) )to the question. That has little to do with GQM. Good GQM often leads to insights about the underlying problem, before you take any measures.you take any measures.
61
APPLY THE 10-FACTOR ANALYSIS TO THESE METRICS
1. Attribute
2. Inherent variation
3 N l l3. Natural scale
4. Instrument
5 Variation (measurement error)5. Variation (measurement error)
6. Scale
7 Model or mechanism: relate the attribute to the instrument7. Model or mechanism: relate the attribute to the instrument
8. Risks of side effects from managing this attribute via optimizing readings from the instrument
9. Purpose
10. Scope
On balance, some measurements aren’t worth taking.
62