Embed Size (px)
Citation preview
1
Page 1
© 2003 by Carnegie Mellon University page 1
Software Quality Attributes:Modifiability and Usability
Mario R. Barbacci
Software Engineering InstituteCarnegie Mellon UniversityPittsburgh PA 15213Sponsored by the U.S. Department of DefenseCopyright 2004 by Carnegie Mellon University
2
Page 2
© 2003 by Carnegie Mellon University page 2
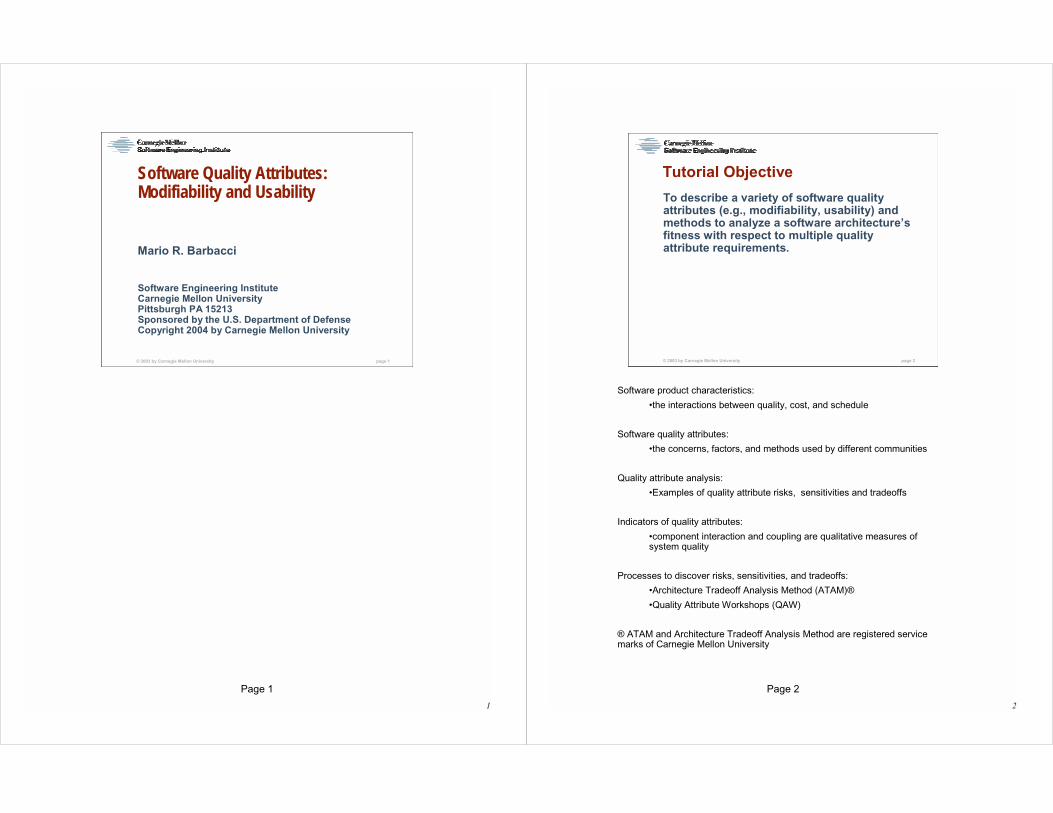
Tutorial Objective
To describe a variety of software quality attributes (e.g., modifiability, usability) and methods to analyze a software architecture’s fitness with respect to multiple quality attribute requirements.
Software product characteristics:
•the interactions between quality, cost, and schedule
Software quality attributes:
•the concerns, factors, and methods used by different communities
Quality attribute analysis:
•Examples of quality attribute risks, sensitivities and tradeoffs
Indicators of quality attributes:
•component interaction and coupling are qualitative measures of system quality
Processes to discover risks, sensitivities, and tradeoffs:
•Architecture Tradeoff Analysis Method (ATAM)®
•Quality Attribute Workshops (QAW)
® ATAM and Architecture Tradeoff Analysis Method are registered service marks of Carnegie Mellon University
3
Page 3
© 2003 by Carnegie Mellon University page 3
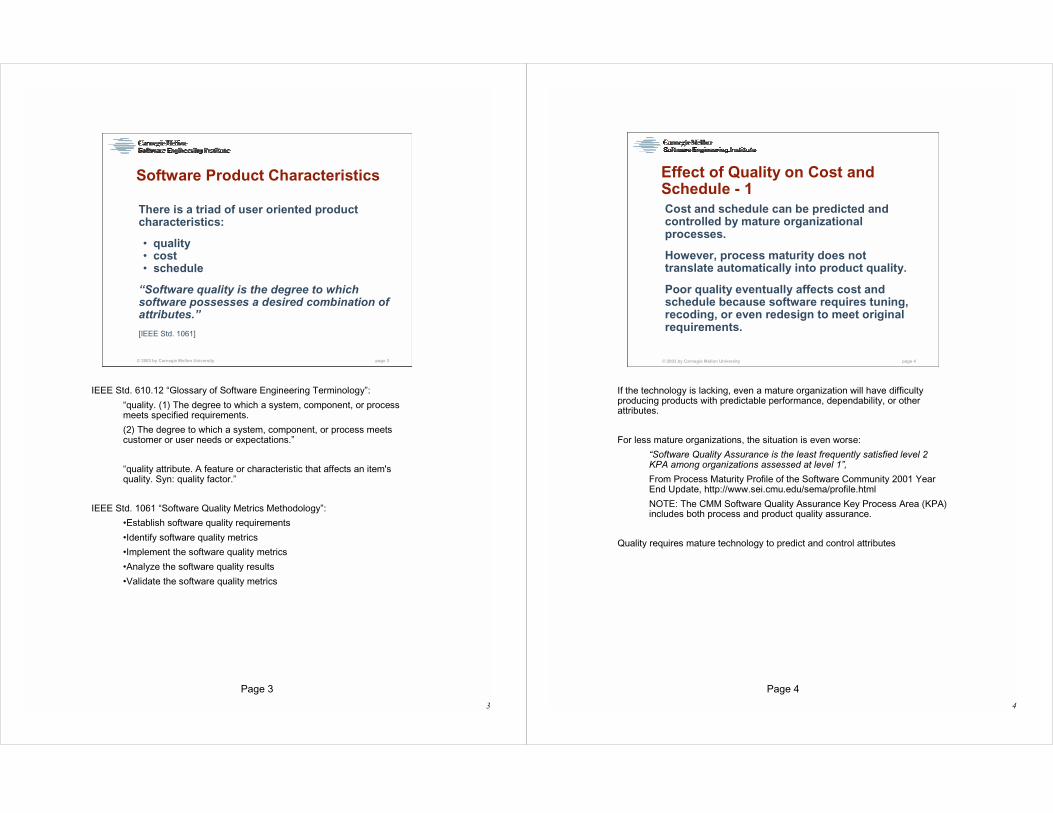
Software Product Characteristics
There is a triad of user oriented product characteristics:
• quality• cost• schedule
“Software quality is the degree to which software possesses a desired combination of attributes.”
[IEEE Std. 1061]
IEEE Std. 610.12 “Glossary of Software Engineering Terminology”:
“quality. (1) The degree to which a system, component, or process meets specified requirements.
(2) The degree to which a system, component, or process meets customer or user needs or expectations.”
“quality attribute. A feature or characteristic that affects an item's quality. Syn: quality factor.”
IEEE Std. 1061 “Software Quality Metrics Methodology”:
•Establish software quality requirements
•Identify software quality metrics
•Implement the software quality metrics
•Analyze the software quality results
•Validate the software quality metrics
4
Page 4
© 2003 by Carnegie Mellon University page 4
Effect of Quality on Cost and Schedule - 1Cost and schedule can be predicted and controlled by mature organizational processes.
However, process maturity does not translate automatically into product quality.
Poor quality eventually affects cost and schedule because software requires tuning, recoding, or even redesign to meet original requirements.
If the technology is lacking, even a mature organization will have difficulty producing products with predictable performance, dependability, or other attributes.
For less mature organizations, the situation is even worse:
“Software Quality Assurance is the least frequently satisfied level 2 KPA among organizations assessed at level 1”,
From Process Maturity Profile of the Software Community 2001 Year End Update, http://www.sei.cmu.edu/sema/profile.html
NOTE: The CMM Software Quality Assurance Key Process Area (KPA) includes both process and product quality assurance.
Quality requires mature technology to predict and control attributes
5
Page 5
© 2003 by Carnegie Mellon University page 5
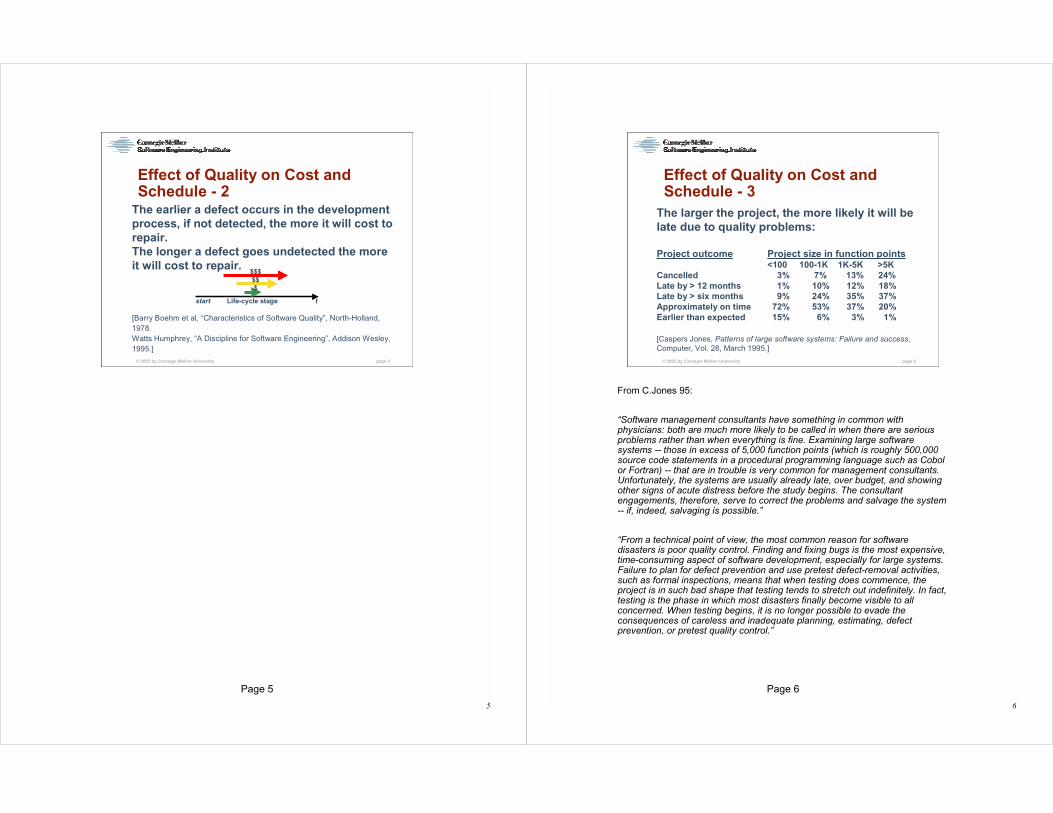
Effect of Quality on Cost and Schedule - 2
The earlier a defect occurs in the development process, if not detected, the more it will cost to repair.The longer a defect goes undetected the more it will cost to repair.
[Barry Boehm et al, “Characteristics of Software Quality”, North-Holland, 1978.Watts Humphrey, “A Discipline for Software Engineering”, Addison Wesley, 1995.]
start tLife-cycle stage
$$$$$$
6
Page 6
© 2003 by Carnegie Mellon University page 6
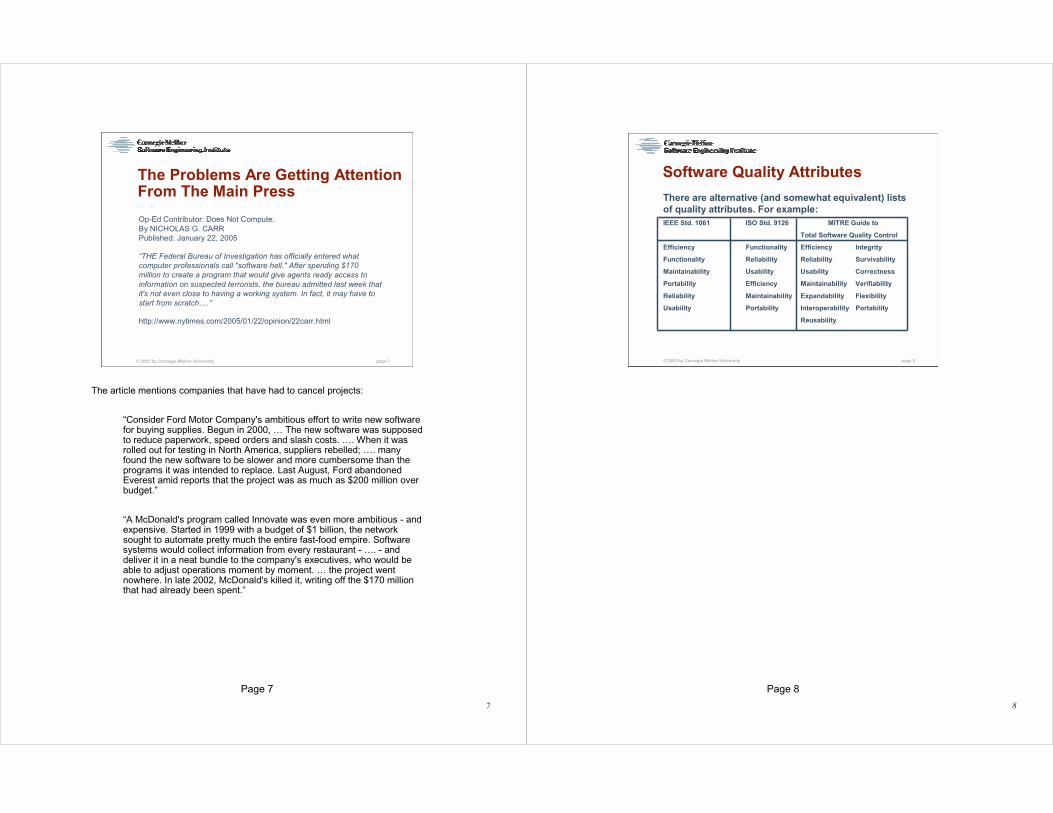
Effect of Quality on Cost and Schedule - 3
The larger the project, the more likely it will be late due to quality problems:
Project outcome Project size in function points<100 100-1K 1K-5K >5K
Cancelled 3% 7% 13% 24%Late by > 12 months 1% 10% 12% 18%Late by > six months 9% 24% 35% 37%Approximately on time 72% 53% 37% 20%Earlier than expected 15% 6% 3% 1%
[Caspers Jones, Patterns of large software systems: Failure and success, Computer, Vol. 28, March 1995.]
From C.Jones 95:
“Software management consultants have something in common with physicians: both are much more likely to be called in when there are serious problems rather than when everything is fine. Examining large software systems -- those in excess of 5,000 function points (which is roughly 500,000 source code statements in a procedural programming language such as Cobol or Fortran) -- that are in trouble is very common for management consultants. Unfortunately, the systems are usually already late, over budget, and showing other signs of acute distress before the study begins. The consultant engagements, therefore, serve to correct the problems and salvage the system -- if, indeed, salvaging is possible.”
“From a technical point of view, the most common reason for software disasters is poor quality control. Finding and fixing bugs is the most expensive, time-consuming aspect of software development, especially for large systems. Failure to plan for defect prevention and use pretest defect-removal activities, such as formal inspections, means that when testing does commence, the project is in such bad shape that testing tends to stretch out indefinitely. In fact, testing is the phase in which most disasters finally become visible to all concerned. When testing begins, it is no longer possible to evade the consequences of careless and inadequate planning, estimating, defect prevention, or pretest quality control.”
7
Page 7
© 2003 by Carnegie Mellon University page 7
The Problems Are Getting Attention From The Main Press
Op-Ed Contributor: Does Not Compute.By NICHOLAS G. CARRPublished: January 22, 2005
“THE Federal Bureau of Investigation has officially entered whatcomputer professionals call "software hell." After spending $170million to create a program that would give agents ready access to information on suspected terrorists, the bureau admitted last week that it's not even close to having a working system. In fact, it may have to start from scratch….”
http://www.nytimes.com/2005/01/22/opinion/22carr.html
The article mentions companies that have had to cancel projects:
“Consider Ford Motor Company's ambitious effort to write new software for buying supplies. Begun in 2000, … The new software was supposed to reduce paperwork, speed orders and slash costs. …. When it was rolled out for testing in North America, suppliers rebelled; …. many found the new software to be slower and more cumbersome than theprograms it was intended to replace. Last August, Ford abandonedEverest amid reports that the project was as much as $200 million over budget.”
“A McDonald's program called Innovate was even more ambitious - and expensive. Started in 1999 with a budget of $1 billion, the network sought to automate pretty much the entire fast-food empire. Software systems would collect information from every restaurant - …. - and deliver it in a neat bundle to the company's executives, who would be able to adjust operations moment by moment. … the project went nowhere. In late 2002, McDonald's killed it, writing off the $170 million that had already been spent.”
8
Page 8
© 2003 by Carnegie Mellon University page 8
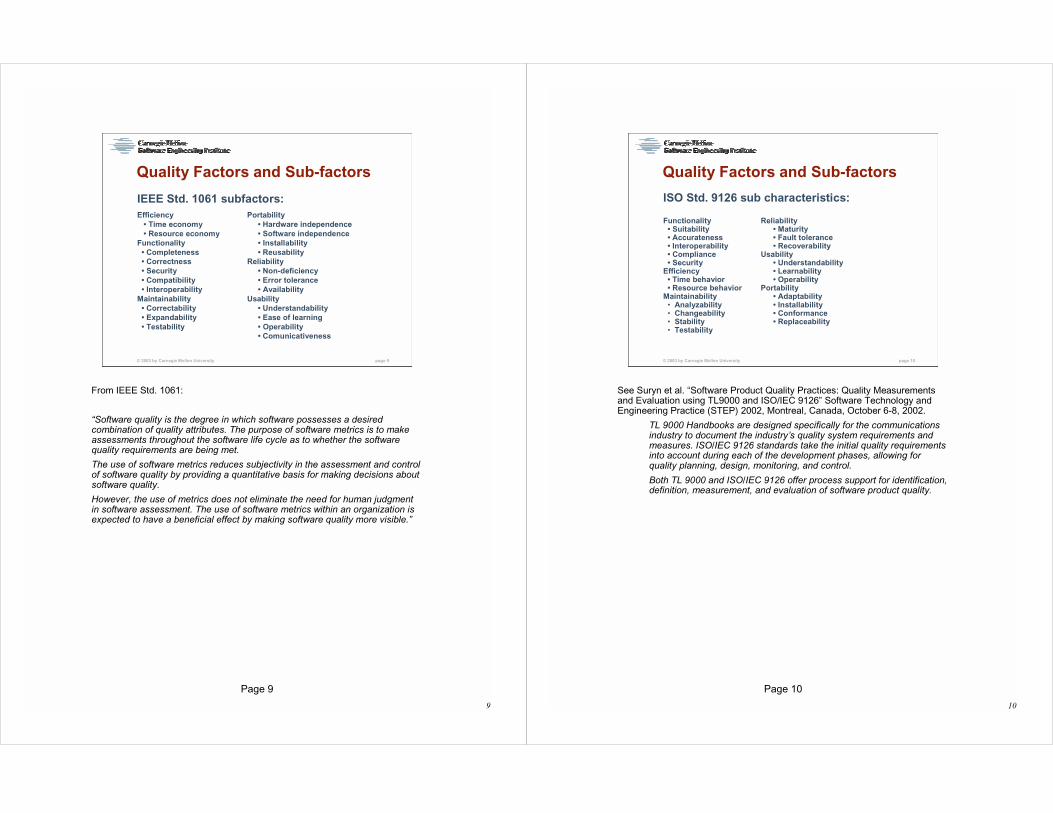
Software Quality Attributes
There are alternative (and somewhat equivalent) lists of quality attributes. For example:IEEE Std. 1061 ISO Std. 9126 MITRE Guide to
Total Software Quality Control
Efficiency Functionality Efficiency Integrity
Functionality Reliability Reliability Survivability
Maintainability Usability Usability Correctness
Portability Efficiency Maintainability Verifiability
Reliability Maintainability Expandability Flexibility
Usability Portability Interoperability Portability
Reusability
9
Page 9
© 2003 by Carnegie Mellon University page 9
Quality Factors and Sub-factors
IEEE Std. 1061 subfactors:Efficiency Portability
• Time economy • Hardware independence• Resource economy • Software independence
Functionality • Installability• Completeness • Reusability• Correctness Reliability• Security • Non-deficiency• Compatibility • Error tolerance• Interoperability • Availability
Maintainability Usability• Correctability • Understandability• Expandability • Ease of learning• Testability • Operability
• Comunicativeness
From IEEE Std. 1061:
“Software quality is the degree in which software possesses a desired combination of quality attributes. The purpose of software metrics is to make assessments throughout the software life cycle as to whether the software quality requirements are being met.
The use of software metrics reduces subjectivity in the assessment and control of software quality by providing a quantitative basis for making decisions about software quality.
However, the use of metrics does not eliminate the need for human judgment in software assessment. The use of software metrics within an organization is expected to have a beneficial effect by making software quality more visible.”
10
Page 10
© 2003 by Carnegie Mellon University page 10
Quality Factors and Sub-factors
ISO Std. 9126 sub characteristics:
Functionality Reliability• Suitability • Maturity• Accurateness • Fault tolerance• Interoperability • Recoverability• Compliance Usability• Security • Understandability
Efficiency • Learnability• Time behavior • Operability• Resource behavior Portability
Maintainability • Adaptability• Analyzability • Installability• Changeability • Conformance• Stability • Replaceability• Testability
See Suryn et al. “Software Product Quality Practices: Quality Measurements and Evaluation using TL9000 and ISO/IEC 9126” Software Technology and Engineering Practice (STEP) 2002, Montreal, Canada, October 6-8, 2002.
TL 9000 Handbooks are designed specifically for the communications industry to document the industry’s quality system requirements and measures. ISO/IEC 9126 standards take the initial quality requirements into account during each of the development phases, allowing forquality planning, design, monitoring, and control.
Both TL 9000 and ISO/IEC 9126 offer process support for identification, definition, measurement, and evaluation of software product quality.
11
Page 11
© 2003 by Carnegie Mellon University page 11
Values Are Context Dependent
Attributes values are not absolute e.g., a system is more or less secure depending on the threat.
Attribute evaluations must be performed within specific context:
• intended uses• operational environment
12
Page 12
© 2003 by Carnegie Mellon University page 12
Models Are Not Independent
Some attribute models are interdependent:
• there are parameters shared between different models
• shared parameters provide an opportunity to tradeoff between multiple attributes
• making tradeoffs might be necessary to satisfy system requirements
13
Page 13
© 2003 by Carnegie Mellon University page 13
Performance"Performance. The degree to which a system or component accomplishes its designated functions within given constraints, such as speed, accuracy, or memory usage.“ [IEEE Std. 610.12]
“Predictability, not speed, is the foremost goal in real-time-system design”
[J.A. Stankovic, “Misconceptions About Real-Time Computing: A Serious Problem for Next-Generation Systems,” IEEE Computer, Volume 21, Number 10, October 1988.]
A misnomer is that performance equates to speed; that is, to think that poor performance can be salvaged simply by using more powerful processors or communication links with higher bandwidth.
Faster might be better, but for many systems faster is not sufficient to achieve timeliness. This is particularly true of real-time systems
As noted in [Stankovic 88], the objective of “fast computing” is to minimize the average response time for some group of services, whereas the objective of real-time computing is to meet individual timing requirements of each service.
•Hardware mechanisms such as caching, pipelining and multithreading, which can reduce average response time, can make worst-case response times unpredictable.
•In general, performance engineering is concerned with predictable performance whether its worst-case or average-case performance. Execution speed is only one factor.
14
Page 14
© 2003 by Carnegie Mellon University page 14
Dependability
"Availability. The degree to which a system or component is operational and accessible when required for use.“
[IEEE Std. 610.12]
“Dependability is that property of a computer system such that reliance can justifiably be placed on the service it delivers”
[J.C. Laprie (ed.) “Dependability: Basic Concepts and Terminology”, Volume 5 of Dependable Computing and Fault-Tolerant Systems. Springer-Verlag, February 1992.].
15
Page 15
© 2003 by Carnegie Mellon University page 15
Security
“Secure systems are those that can be trusted to keep secrets and safeguard privacy.”
[J. Rushby, Critical System Properties: Survey and Taxonomy, SRI International, Technical Report CSL-93-01, May 1993]
16
Page 16
Extend security to include the ability to maintain some level of service in the presence of attacks.
Success is measured in terms of the success of mission rather than in the survival of any specific system or component.
© 2003 by Carnegie Mellon University page 16
From Security to SurvivabilityLarge-scale, distributed systems cannot be totally isolated from intruders - no amount of “hardening” can guarantee that systems will be invulnerable to attack.
We design buildings to deal with environment stress such earthquakes as well an intentional attacks such as a break-in.
We need to apply a similar approach to software where the faults are malicious attacks.
17
Page 17
© 2003 by Carnegie Mellon University page 17
Modifiability
Modifiability encompasses two aspects:
“Maintainability. (1) The ease with which a software system or component can be modified to correct faults, improve performance or other attributes, or adapt to a changed environment. (2) The ease with which a hardware system or component can be retained in, or restored to, a state in which it can perform its required functions.”
“Flexibility: The ease with which a system or component can be modified for use in applications or environments other than those for which is was specifically designed.”
[IEEE Std. 610.12]
18
Page 18
© 2003 by Carnegie Mellon University page 18
Modifiability Taxonomy
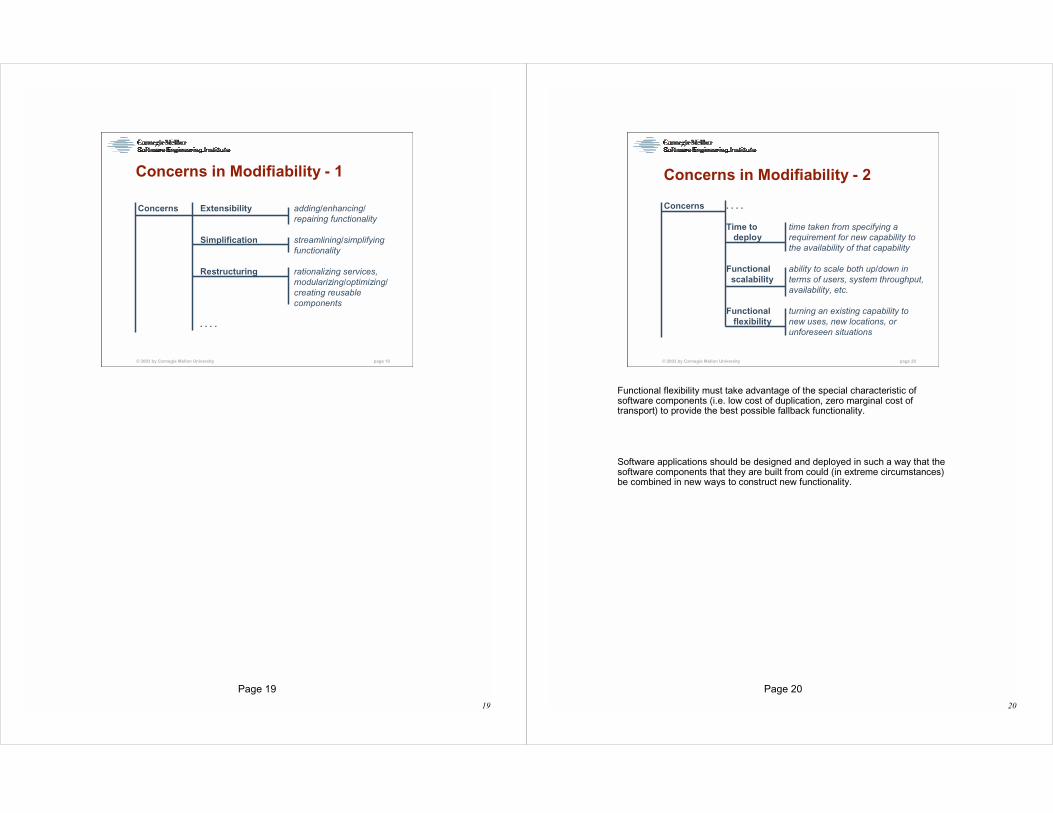
Modifiability Concerns ExtensibilitySimplificationRestructuringTime to deployFunctional scalabilityFunctional flexibility
Factors Component complexityComponent sizeScope of modification
Methods ModularityEncapsulationSoftware practice
Concerns• Extensibility - adding/enhancing/repairing functionality• Simplification - streamlining/simplifying functionality• Restructuring - rationalizing services, modularizing/optimizing/creating reusable components• Time to deploy - time taken from specifying a requirement for new capability to the availability of that capability• Functional scalability - ability to scale both up/down in terms of users, system throughput, availability, etc.• Functional flexibility - turning an existing capability to new uses, new locations, or unforeseen situations
Factors• Component complexity - in general the more complex the components, the more difficult they are to change• Component size - smaller components are generally easier to modify than large ones• Scope of modification - architecture level modifications are more difficult; may involve a complete redesign with different components and
interactions
Methods• Modularity - partition a system into distinct modules representing separate areas of functionality; a classical modifiability technique
19
Page 19
© 2003 by Carnegie Mellon University page 19
Concerns in Modifiability - 1
Concerns Extensibility adding/enhancing/repairing functionality
Simplification streamlining/simplifyingfunctionality
Restructuring rationalizing services, modularizing/optimizing/creating reusable components
. . . .
20
Page 20
© 2003 by Carnegie Mellon University page 20
Concerns in Modifiability - 2
Concerns . . . .
Time to time taken from specifying a deploy requirement for new capability to
the availability of that capability
Functional ability to scale both up/down inscalability terms of users, system throughput,
availability, etc.
Functional turning an existing capability toflexibility new uses, new locations, or
unforeseen situations
Functional flexibility must take advantage of the special characteristic of software components (i.e. low cost of duplication, zero marginal cost of transport) to provide the best possible fallback functionality.
Software applications should be designed and deployed in such a way that the software components that they are built from could (in extreme circumstances) be combined in new ways to construct new functionality.
21
Page 21
© 2003 by Carnegie Mellon University page 21
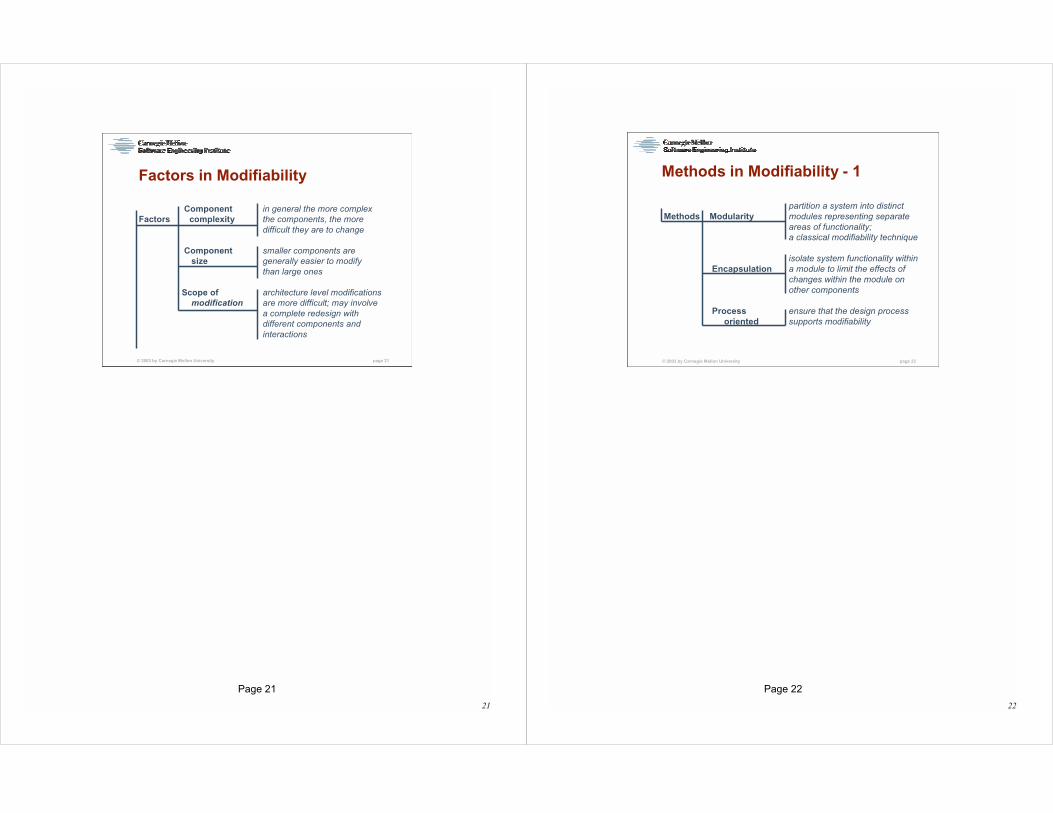
Factors in Modifiability
Component in general the more complex Factors complexity the components, the more
difficult they are to change
Component smaller components are size generally easier to modify
than large ones
Scope of architecture level modificationsmodification are more difficult; may involve
a complete redesign withdifferent components andinteractions
22
Page 22
© 2003 by Carnegie Mellon University page 22
Methods in Modifiability - 1
partition a system into distinctMethods Modularity modules representing separate
areas of functionality;a classical modifiability technique
isolate system functionality withinEncapsulation a module to limit the effects of
changes within the module on other components
Process ensure that the design processoriented supports modifiability
23
Page 23
© 2003 by Carnegie Mellon University page 23
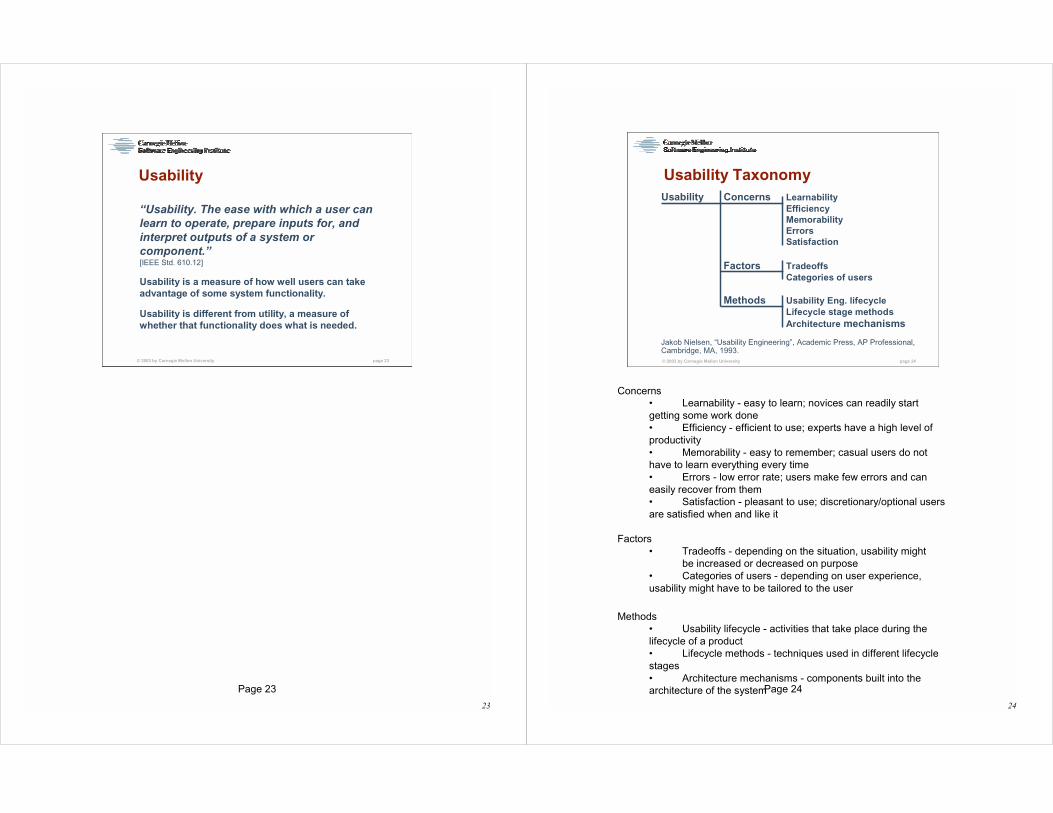
Usability
“Usability. The ease with which a user can learn to operate, prepare inputs for, and interpret outputs of a system or component.”[IEEE Std. 610.12]
Usability is a measure of how well users can take advantage of some system functionality.
Usability is different from utility, a measure of whether that functionality does what is needed.
24
Page 24
© 2003 by Carnegie Mellon University page 24
Usability TaxonomyUsability Concerns Learnability
EfficiencyMemorabilityErrorsSatisfaction
Factors TradeoffsCategories of users
Methods Usability Eng. lifecycleLifecycle stage methodsArchitecture mechanisms
Jakob Nielsen, “Usability Engineering”, Academic Press, AP Professional, Cambridge, MA, 1993.
Concerns• Learnability - easy to learn; novices can readily start getting some work done• Efficiency - efficient to use; experts have a high level of productivity• Memorability - easy to remember; casual users do not have to learn everything every time• Errors - low error rate; users make few errors and can easily recover from them• Satisfaction - pleasant to use; discretionary/optional users are satisfied when and like it
Factors• Tradeoffs - depending on the situation, usability might
be increased or decreased on purpose• Categories of users - depending on user experience, usability might have to be tailored to the user
Methods• Usability lifecycle - activities that take place during the lifecycle of a product• Lifecycle methods - techniques used in different lifecycle stages• Architecture mechanisms - components built into the architecture of the system
25
Page 25
© 2003 by Carnegie Mellon University page 25
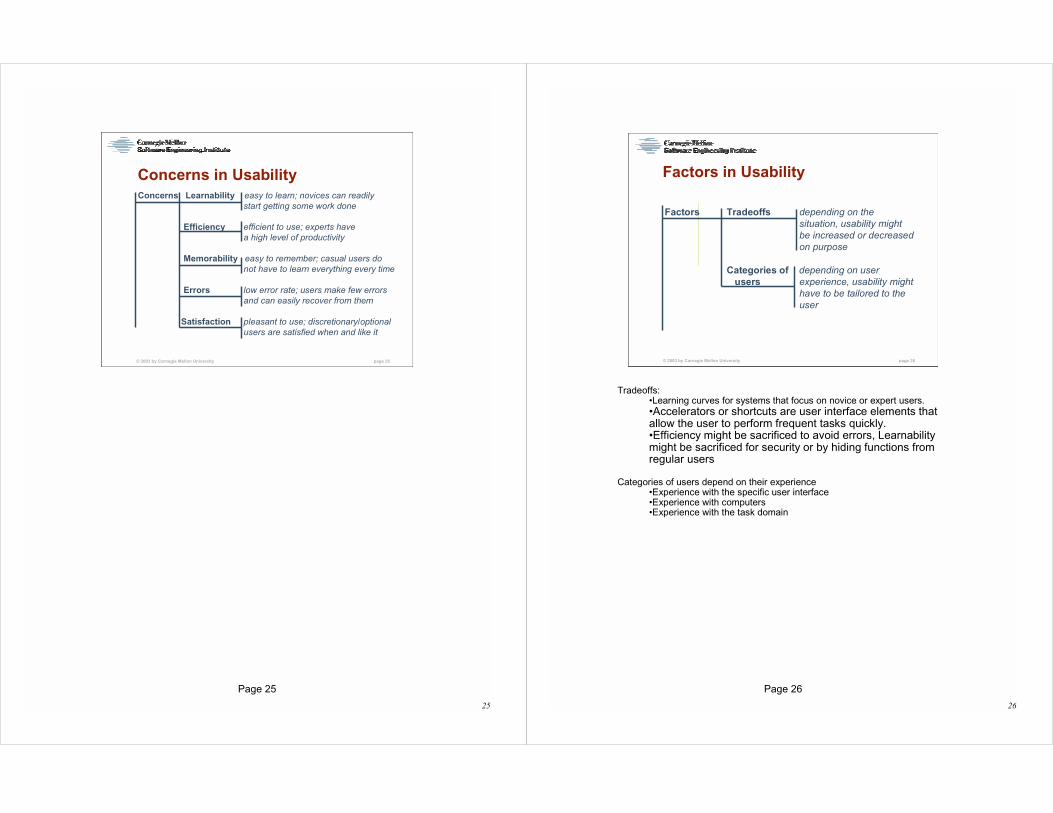
Concerns in UsabilityConcerns Learnability easy to learn; novices can readily
start getting some work done
Efficiency efficient to use; experts havea high level of productivity
Memorability easy to remember; casual users donot have to learn everything every time
Errors low error rate; users make few errorsand can easily recover from them
Satisfaction pleasant to use; discretionary/optionalusers are satisfied when and like it
26
Page 26
© 2003 by Carnegie Mellon University page 26
Factors in Usability
Factors Tradeoffs depending on the situation, usability mightbe increased or decreasedon purpose
Categories of depending on userusers experience, usability might
have to be tailored to theuser
Tradeoffs:•Learning curves for systems that focus on novice or expert users. •Accelerators or shortcuts are user interface elements that allow the user to perform frequent tasks quickly.•Efficiency might be sacrificed to avoid errors, Learnability might be sacrificed for security or by hiding functions from regular users
Categories of users depend on their experience•Experience with the specific user interface •Experience with computers •Experience with the task domain
27
Page 27
© 2003 by Carnegie Mellon University page 27
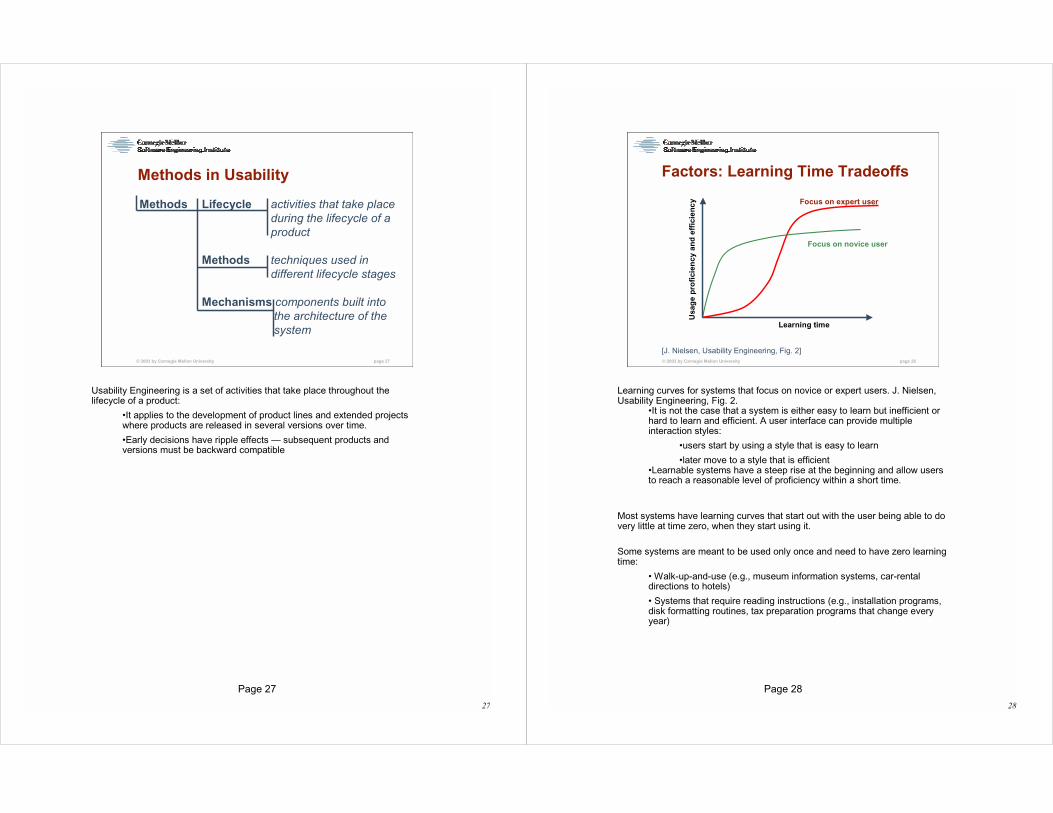
Methods in Usability
Methods Lifecycle activities that take place during the lifecycle of a product
Methods techniques used in different lifecycle stages
Mechanisms components built intothe architecture of thesystem
Usability Engineering is a set of activities that take place throughout the lifecycle of a product:
•It applies to the development of product lines and extended projects where products are released in several versions over time.
•Early decisions have ripple effects — subsequent products and versions must be backward compatible
28
Page 28
© 2003 by Carnegie Mellon University page 28
Factors: Learning Time Tradeoffs
Learning time
Focus on expert user
Focus on novice user
Usa
ge
pro
fici
ency
an
d e
ffic
ien
cy
[J. Nielsen, Usability Engineering, Fig. 2]
Learning curves for systems that focus on novice or expert users. J. Nielsen, Usability Engineering, Fig. 2.
•It is not the case that a system is either easy to learn but inefficient or hard to learn and efficient. A user interface can provide multiple interaction styles:
•users start by using a style that is easy to learn
•later move to a style that is efficient•Learnable systems have a steep rise at the beginning and allow users to reach a reasonable level of proficiency within a short time.
Most systems have learning curves that start out with the user being able to do very little at time zero, when they start using it.
Some systems are meant to be used only once and need to have zero learning time:
• Walk-up-and-use (e.g., museum information systems, car-rental directions to hotels)
• Systems that require reading instructions (e.g., installation programs, disk formatting routines, tax preparation programs that change every year)
29
Page 29
© 2003 by Carnegie Mellon University page 29
Factors: Accelerator Tradeoffs
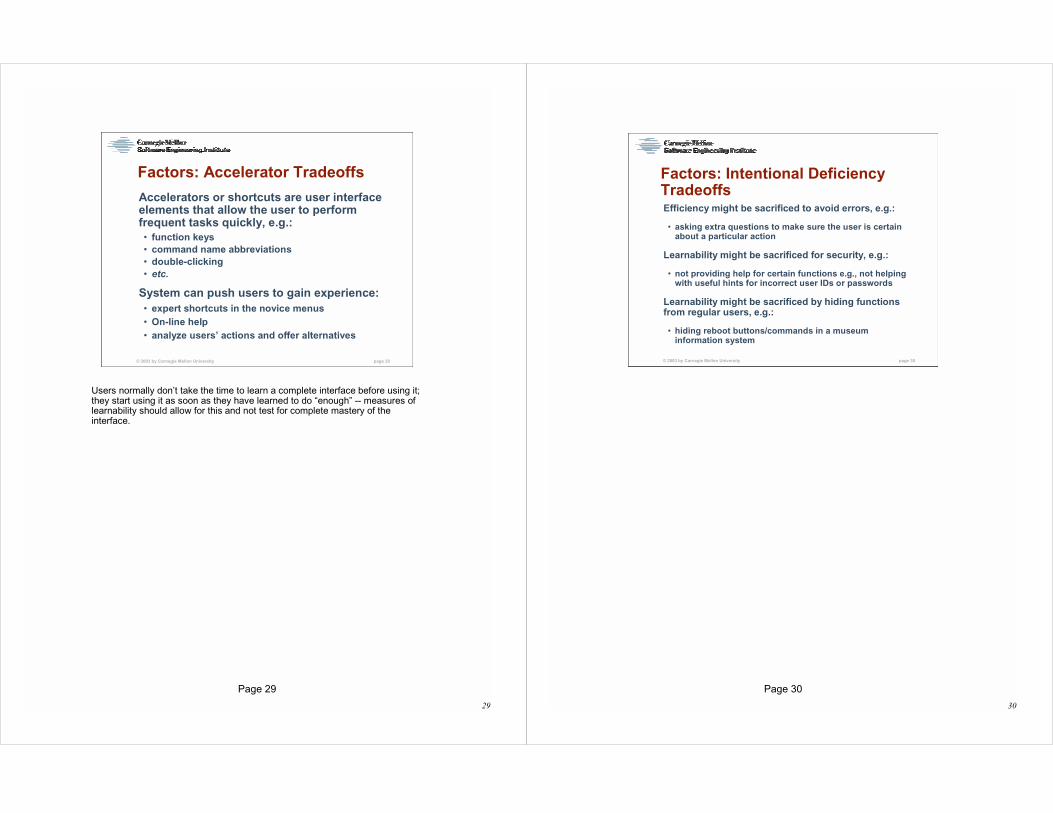
Accelerators or shortcuts are user interface elements that allow the user to perform frequent tasks quickly, e.g.:• function keys• command name abbreviations• double-clicking• etc.
System can push users to gain experience:• expert shortcuts in the novice menus• On-line help• analyze users’ actions and offer alternatives
Users normally don’t take the time to learn a complete interface before using it; they start using it as soon as they have learned to do “enough” -- measures of learnability should allow for this and not test for complete mastery of the interface.
30
Page 30
© 2003 by Carnegie Mellon University page 30
Factors: Intentional Deficiency TradeoffsEfficiency might be sacrificed to avoid errors, e.g.:
• asking extra questions to make sure the user is certain about a particular action
Learnability might be sacrificed for security, e.g.:
• not providing help for certain functions e.g., not helping with useful hints for incorrect user IDs or passwords
Learnability might be sacrificed by hiding functions from regular users, e.g.:
• hiding reboot buttons/commands in a museum information system
31
Page 31
© 2003 by Carnegie Mellon University page 31
Factors: Categories of Users
[J. Nielsen, Usability Engineering, Fig. 3]
Exp
erie
nce
with
com
pute
rs
Experience with system
Exper
ience
with
domain
minimal
extensive
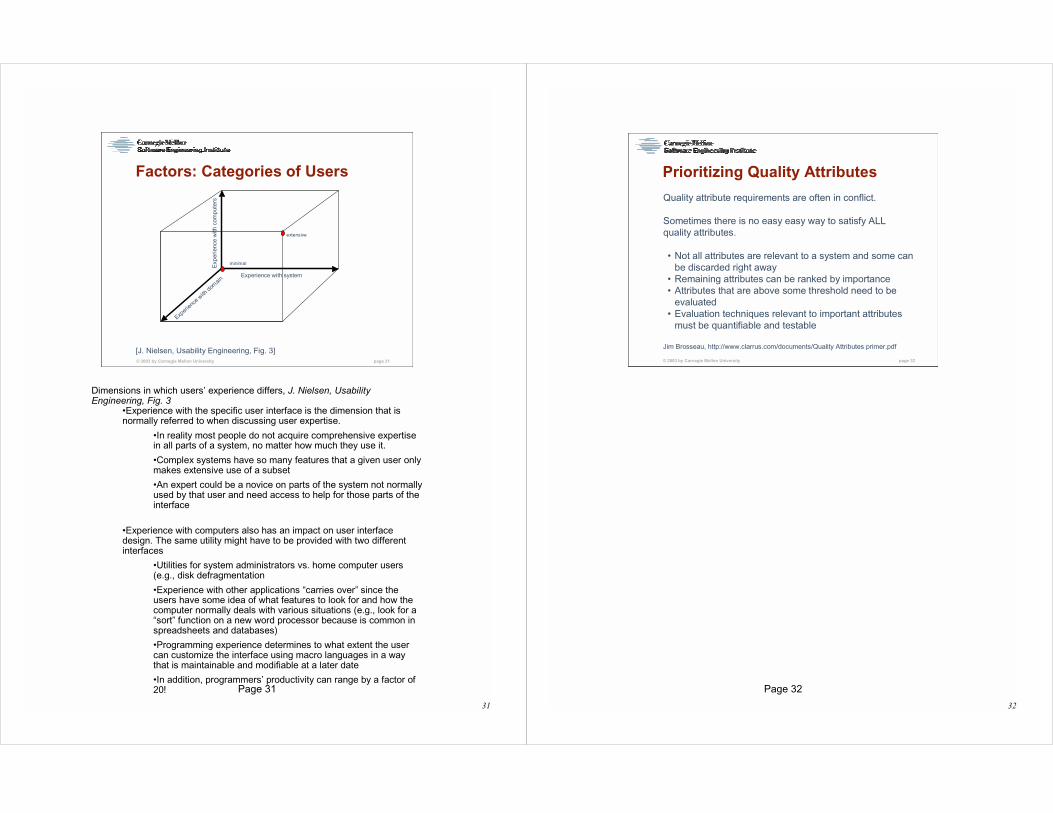
Dimensions in which users’ experience differs, J. Nielsen, Usability Engineering, Fig. 3
•Experience with the specific user interface is the dimension that is normally referred to when discussing user expertise.
•In reality most people do not acquire comprehensive expertise in all parts of a system, no matter how much they use it.
•Complex systems have so many features that a given user only makes extensive use of a subset
•An expert could be a novice on parts of the system not normally used by that user and need access to help for those parts of theinterface
•Experience with computers also has an impact on user interface design. The same utility might have to be provided with two different interfaces
•Utilities for system administrators vs. home computer users (e.g., disk defragmentation
•Experience with other applications “carries over” since the users have some idea of what features to look for and how the computer normally deals with various situations (e.g., look for a “sort” function on a new word processor because is common in spreadsheets and databases)
•Programming experience determines to what extent the user can customize the interface using macro languages in a way that is maintainable and modifiable at a later date
•In addition, programmers’ productivity can range by a factor of 20!
32
Page 32
© 2003 by Carnegie Mellon University page 32
Prioritizing Quality Attributes
Quality attribute requirements are often in conflict.
Sometimes there is no easy easy way to satisfy ALL quality attributes.
• Not all attributes are relevant to a system and some can be discarded right away
• Remaining attributes can be ranked by importance• Attributes that are above some threshold need to be
evaluated• Evaluation techniques relevant to important attributes
must be quantifiable and testable
Jim Brosseau, http://www.clarrus.com/documents/Quality Attributes primer.pdf
33
Page 33
© 2003 by Carnegie Mellon University page 33
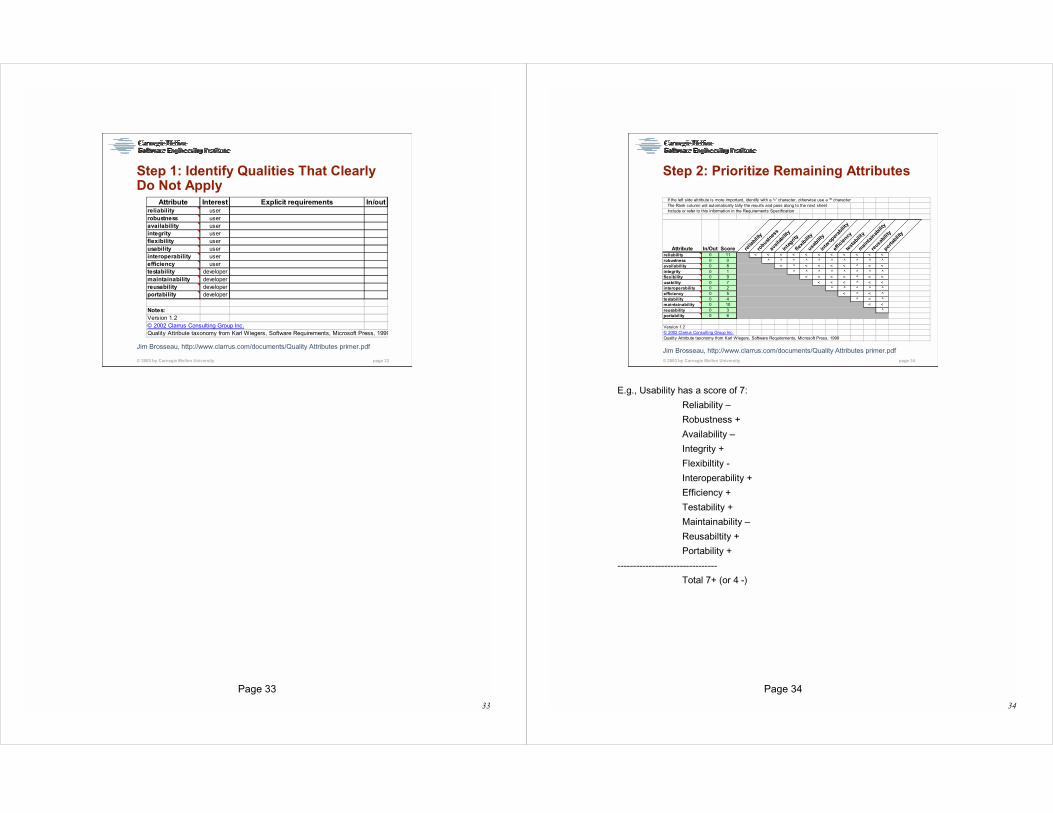
Step 1: Identify Qualities That Clearly Do Not Apply
Attribute Interest Explicit requirements In/outreliability userrobustness useravailability userintegrity userflexibility userusability userinteroperability userefficiency usertestability developermaintainability developerreusability developerportability developer
Notes:Version 1.2© 2002 Clarrus Consulting Group Inc.Quality Attribute taxonomy from Karl Wiegers, Software Requirements, Microsoft Press, 1999
Jim Brosseau, http://www.clarrus.com/documents/Quality Attributes primer.pdf
34
Page 34
© 2003 by Carnegie Mellon University page 34
Step 2: Prioritize Remaining Attributes
If the left side attribute is more important, identify with a '<' character, otherwise use a '̂ ' characterThe Rank column will automatically tally the results and pass along to the next sheetInclude or refer to this information in the Requirements Specification
Attribute In/Out Score relia
bility
robust
ness
avail
abilit
yin
tegrit
yfle
xibilit
yusa
bilit
yin
tero
perab
ility
effic
iency
test
abilit
ym
aint
ainab
ility
reusa
bilit
yporta
bility
reliability 0 11 < < < < < < < < < < <robustness 0 0 ^ ^ ^ ^ ^ ^ ^ ^ ^ ^availability 0 8 < ^ < < < < ^ < <integrity 0 1 ^ ^ ^ ^ ^ ^ ^ ^flexibility 0 9 < < < < ^ < <usability 0 7 < < < ^ < <interoperability 0 2 ^ ^ ^ ^ ^efficiency 0 5 < ^ < ^testability 0 4 ^ < ^maintainability 0 10 < <reusability 0 3 ^portability 0 6
Version 1.2© 2002 Clarrus Consulting Group Inc.Quality Attribute taxonomy from Karl Wiegers, Software Requirements, Microsoft Press, 1999
Jim Brosseau, http://www.clarrus.com/documents/Quality Attributes primer.pdf
E.g., Usability has a score of 7:
Reliability –
Robustness +
Availability –
Integrity +
Flexibiltity -
Interoperability +
Efficiency +
Testability +
Maintainability –
Reusabiltity +
Portability +
--------------------------------
Total 7+ (or 4 -)
35
Page 35
© 2003 by Carnegie Mellon University page 35
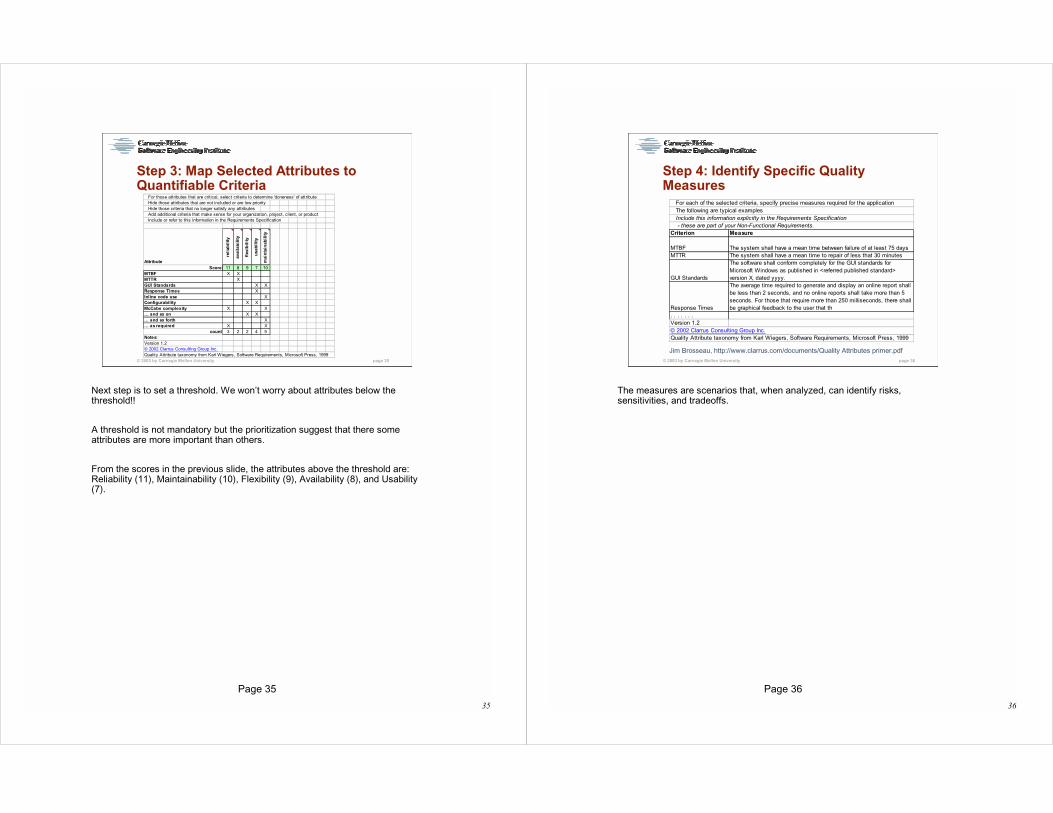
Step 3: Map Selected Attributes to Quantifiable Criteria
For those attributes that are critical, select criteria to determine 'doneness' of attributeHide those attributes that are not included or are low priorityHide those criteria that no longer satisfy any attributesAdd additional criteria that make sense for your organization, project, client, or productInclude or refer to this information in the Requirements Specification
Attribute
reli
abil
ity
avai
lab
ilit
y
flex
ibil
ity
usa
bil
ity
mai
nta
inab
ilit
yScore 11 8 9 7 10
MTBF X XMTTR XGUI Standards X XResponse Times XInline code use XConfigurability X XMcCabe complexity X X… and so on X X… and so forth X… as required X X
count 3 2 2 4 5Notes:Version 1.2© 2002 Clarrus Consulting Group Inc.Quality Attribute taxonomy from Karl Wiegers, Software Requirements, Microsoft Press, 1999
Next step is to set a threshold. We won’t worry about attributes below the threshold!!
A threshold is not mandatory but the prioritization suggest that there some attributes are more important than others.
From the scores in the previous slide, the attributes above the threshold are: Reliability (11), Maintainability (10), Flexibility (9), Availability (8), and Usability (7).
36
Page 36
© 2003 by Carnegie Mellon University page 36
Step 4: Identify Specific Quality Measures
For each of the selected criteria, specify precise measures required for the applicationThe following are typical examplesInclude this information explicitly in the Requirements Specification - these are part of your Non-Functional Requirements.
Criterion Measure
MTBF The system shall have a mean time between failure of at least 75 daysMTTR The system shall have a mean time to repair of less that 30 minutes
GUI Standards
The software shall conform completely for the GUI standards for Microsoft Windows as published in <referred published standard> version X, dated yyyy.
Response Times
The average time required to generate and display an online report shall be less than 2 seconds, and no online reports shall take more than 5 seconds. For those that require more than 250 milliseconds, there shall be graphical feedback to the user that th
. . . . . . .Version 1.2© 2002 Clarrus Consulting Group Inc.Quality Attribute taxonomy from Karl Wiegers, Software Requirements, Microsoft Press, 1999
Jim Brosseau, http://www.clarrus.com/documents/Quality Attributes primer.pdf
The measures are scenarios that, when analyzed, can identify risks, sensitivities, and tradeoffs.
37
Page 37
© 2003 by Carnegie Mellon University page 37
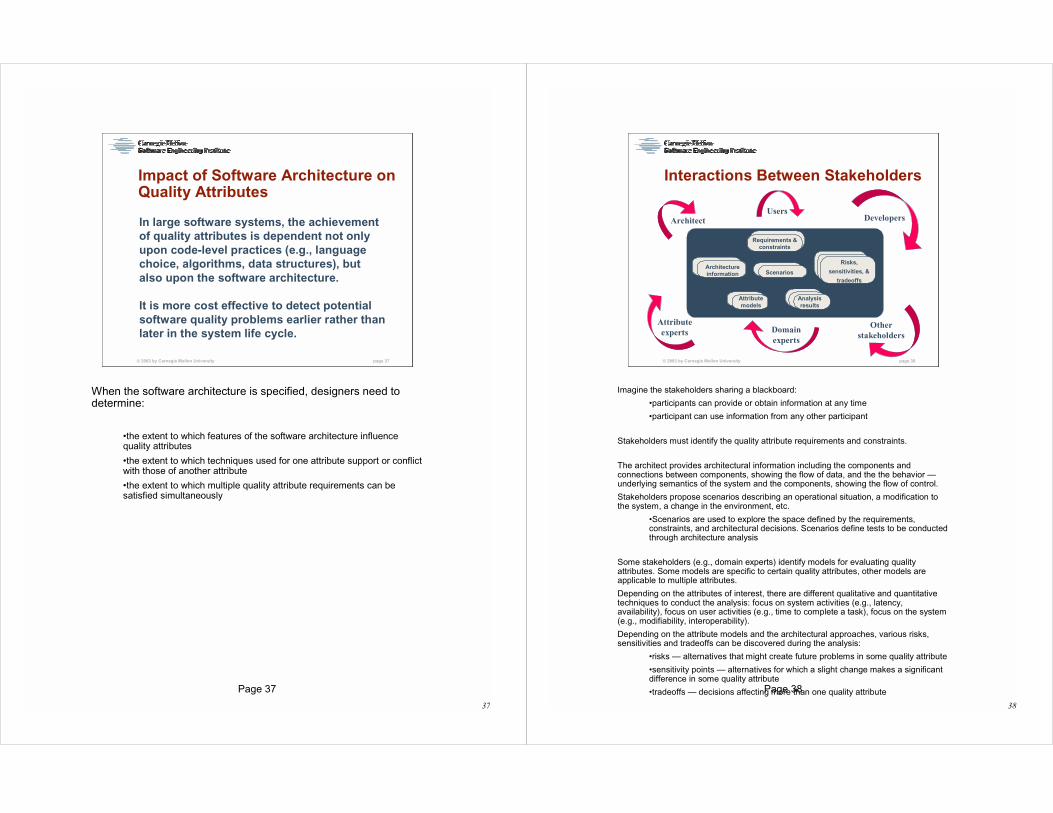
Impact of Software Architecture on Quality Attributes
In large software systems, the achievement of quality attributes is dependent not only upon code-level practices (e.g., language choice, algorithms, data structures), but also upon the software architecture.
It is more cost effective to detect potential software quality problems earlier rather than later in the system life cycle.
When the software architecture is specified, designers need to determine:
•the extent to which features of the software architecture influence quality attributes
•the extent to which techniques used for one attribute support or conflict with those of another attribute
•the extent to which multiple quality attribute requirements can be satisfied simultaneously
38
Page 38
© 2003 by Carnegie Mellon University page 38
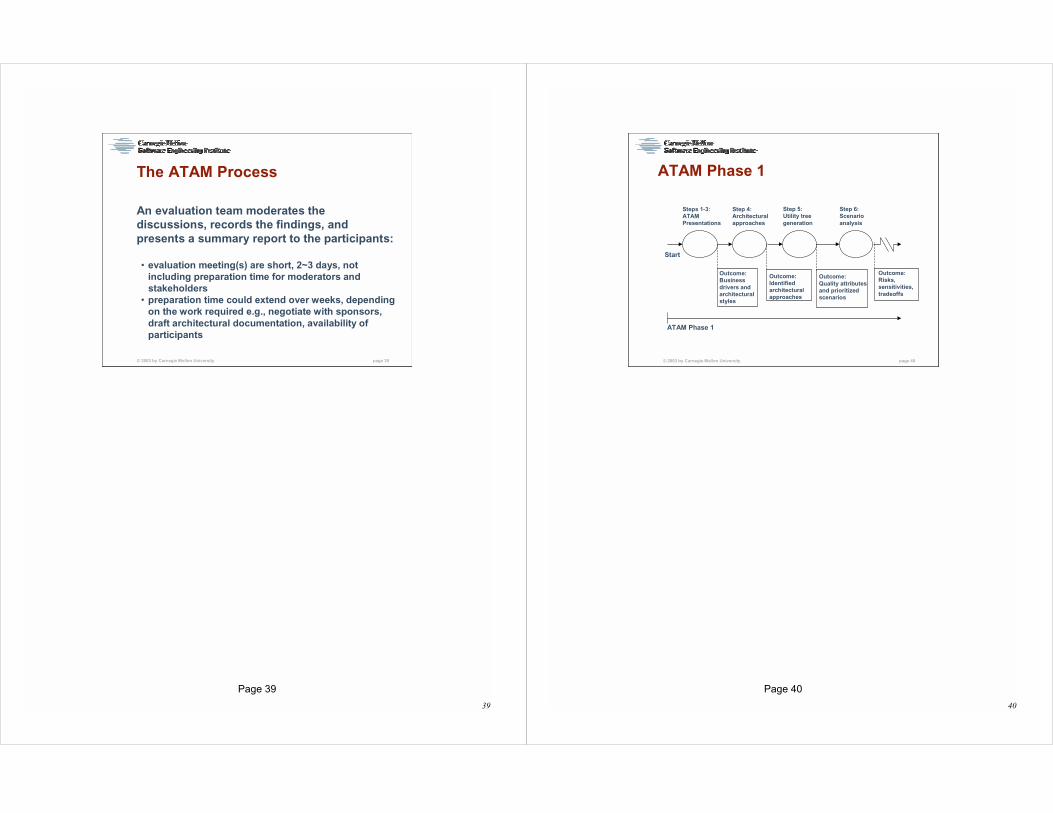
Interactions Between Stakeholders
ScenariosArchitectureinformation
Attributemodels
Analysisresults
Requirements &constraints
Attributeexperts
Risks,
sensitivities, &
tradeoffs
Users
Domainexperts
DevelopersArchitect
Otherstakeholders
Imagine the stakeholders sharing a blackboard:
•participants can provide or obtain information at any time
•participant can use information from any other participant
Stakeholders must identify the quality attribute requirements and constraints.
The architect provides architectural information including the components and connections between components, showing the flow of data, and the the behavior —underlying semantics of the system and the components, showing the flow of control.
Stakeholders propose scenarios describing an operational situation, a modification to the system, a change in the environment, etc.
•Scenarios are used to explore the space defined by the requirements, constraints, and architectural decisions. Scenarios define tests to be conducted through architecture analysis
Some stakeholders (e.g., domain experts) identify models for evaluating quality attributes. Some models are specific to certain quality attributes, other models are applicable to multiple attributes.
Depending on the attributes of interest, there are different qualitative and quantitative techniques to conduct the analysis: focus on system activities (e.g., latency, availability), focus on user activities (e.g., time to complete a task), focus on the system (e.g., modifiability, interoperability).
Depending on the attribute models and the architectural approaches, various risks, sensitivities and tradeoffs can be discovered during the analysis:
•risks — alternatives that might create future problems in some quality attribute
•sensitivity points — alternatives for which a slight change makes a significant difference in some quality attribute
•tradeoffs — decisions affecting more than one quality attribute
39
Page 39
© 2003 by Carnegie Mellon University page 39
The ATAM Process
An evaluation team moderates the discussions, records the findings, and presents a summary report to the participants:
• evaluation meeting(s) are short, 2~3 days, not including preparation time for moderators and stakeholders
• preparation time could extend over weeks, depending on the work required e.g., negotiate with sponsors, draft architectural documentation, availability of participants
40
Page 40
© 2003 by Carnegie Mellon University page 40
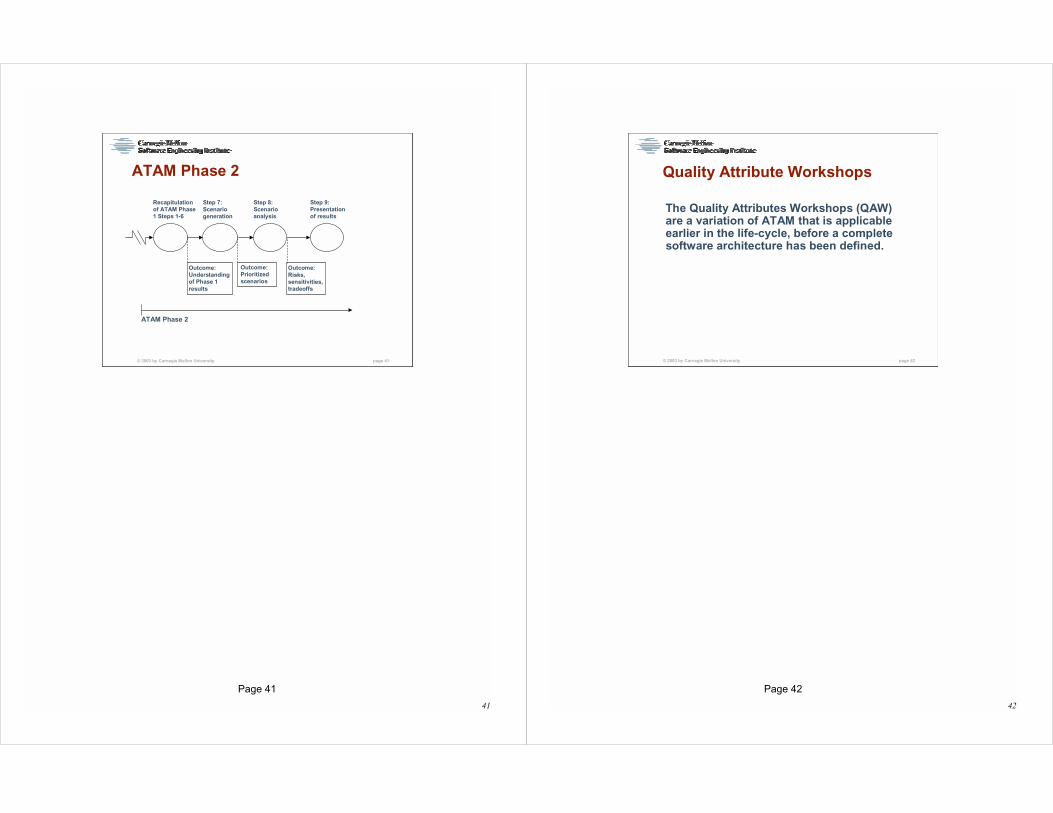
ATAM Phase 1
Start
Steps 1-3:ATAM Presentations
Step 4:Architectural approaches
Step 5: Utility tree generation
Outcome:Identified architectural approaches
Step 6:Scenario analysis
Outcome:Quality attributes and prioritized scenarios
Outcome:Risks, sensitivities, tradeoffs
ATAM Phase 1
Outcome:Business drivers and architectural styles
41
Page 41
© 2003 by Carnegie Mellon University page 41
ATAM Phase 2
Recapitulation of ATAM Phase 1 Steps 1-6
Step 7:Scenario generation
Step 8: Scenario analysis
Outcome:Prioritized scenarios
Step 9:Presentation of results
Outcome:Risks, sensitivities, tradeoffs
ATAM Phase 2
Outcome:Understanding of Phase 1 results
42
Page 42
© 2003 by Carnegie Mellon University page 42
Quality Attribute Workshops
The Quality Attributes Workshops (QAW) are a variation of ATAM that is applicable earlier in the life-cycle, before a complete software architecture has been defined.
43
Page 43
© 2003 by Carnegie Mellon University page 43
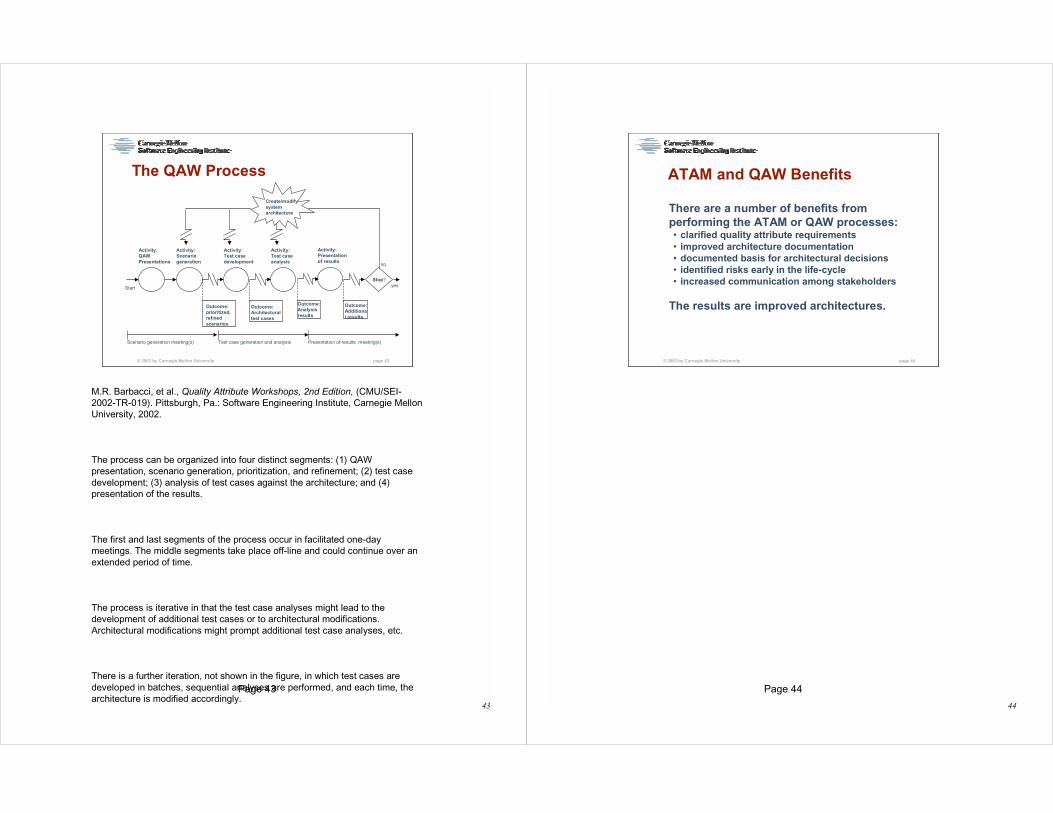
The QAW Process
Activity:Scenario generation
Start
Activity:QAW Presentations
Activity: Test case development
Outcome:prioritized,refinedscenarios
Activity:Test case analysis
Outcome:Architectural test cases
Activity:Presentation of results
Outcome:Analysis results
yes
no
Outcome:Additional results
Stop?
Presentation of results meeting(s)Test case generation and analysisScenario generation meeting(s)
Create/modify system architecture
M.R. Barbacci, et al., Quality Attribute Workshops, 2nd Edition, (CMU/SEI-2002-TR-019). Pittsburgh, Pa.: Software Engineering Institute, Carnegie Mellon University, 2002.
The process can be organized into four distinct segments: (1) QAW presentation, scenario generation, prioritization, and refinement; (2) test case development; (3) analysis of test cases against the architecture; and (4) presentation of the results.
The first and last segments of the process occur in facilitated one-day meetings. The middle segments take place off-line and could continue over an extended period of time.
The process is iterative in that the test case analyses might lead to the development of additional test cases or to architectural modifications. Architectural modifications might prompt additional test case analyses, etc.
There is a further iteration, not shown in the figure, in which test cases are developed in batches, sequential analyses are performed, and each time, the architecture is modified accordingly.
44
Page 44
© 2003 by Carnegie Mellon University page 44
ATAM and QAW Benefits
There are a number of benefits from performing the ATAM or QAW processes:• clarified quality attribute requirements• improved architecture documentation• documented basis for architectural decisions• identified risks early in the life-cycle• increased communication among stakeholders
The results are improved architectures.
45
Page 45
© 2003 by Carnegie Mellon University page 45
Requirements
Both methods rely critically on:• appropriate preparation by the customer• clearly-articulated quality attribute
requirements• active stakeholder participation• active participation by the architect• evaluator familiarity with architectural
styles and analytic models
46
Page 46
© 2003 by Carnegie Mellon University page 46
ATAM and QAW Status
We have experience in using the methods in a wide variety of application areas.
There is an ATAM handbook and a training course to make process repeatable and transitionable. Most of the material is relevant to the QAW process.
Additional information available:
http://www.sei.cmu.edu/activities/ata


![Hoptrees: Branching History Navigation for Hierarchies · navigation history, or a set of dynamic attributes [8]. The benefits of breadcrumbs have been studied within the web usability](https://img.pdfslide.us/doc/110x75/5f9accaa96e76b476e5f04f2/hoptrees-branching-history-navigation-for-hierarchies-navigation-history-or-a.jpg)