Embed Size (px)
Citation preview
Empirical Software Engineering, 8, 7–42, 2003.
# 2003 Kluwer Academic Publishers. Manufactured in The Netherlands.
Software Process Improvement Problems in Twelve
Software Companies: An Empirical Analysis
SARAH BEECHAM [email protected]
Department of Computer Science, University of Hertfordshire
TRACY HALL [email protected]
Department of Computer Science, University of Hertfordshire
AUSTEN RAINER [email protected]
Department of Computer Science, University of Hertfordshire
Editor: Marvin Zelkowitz
Abstract. In this paper we discuss our study of the problems 12 software companies experienced in
software development. In total we present qualitative data collected from 45 focus groups that involved
over 200 software staff. We look at how different practitioner groups respond to software process
improvement problems. We show our classification and analysis of this data using correspondence
analysis. Correspondence analysis is a graphical data representation method new to software development
research. The aim of the work we present is to develop a more holistic understanding of the problems
practitioners are experiencing in their attempts to improve their software processes.
Our main finding is that there is an association between a company’s capability maturity and patterns of
reported problems. Organizational problems are more associated with high maturity companies than with
low maturity companies. Low maturity companies are closely linked to problems relating directly to
projects such as documentation, timescales, tools and technology. Our findings also confirm differences in
practitioner group problems. Senior managers cite problems with goals, culture and politics. Project
managers are concerned with timescales, change management, budgets and estimates. Developers are
experiencing problems with requirements, testing, documentation, communication, tools and technology.
These associations are displayed graphically through correspondence analysis maps.
Keywords: Software process improvement, capability maturity model, practitioners, organization, project,
software lifecycle, empirical study, correspondence analysis.
1. Introduction
Identifying problems is an essential element in all software process improvement(SPI). Sommerville and Sawyer (1997), for example, state that the first question thata company should ask is: ‘‘What are the problems with our current processes?’’. ElEmam et al. (1996) believe ‘‘it is important to understand the enabling and theinhibiting factors involved in SPI, particularly those that management can control’’.
Many companies are using the software capability maturity model (CMM) as abasis for improving their software processes (Paulk et al., 1995). Numerous studiesreport positive and negative factors that impact SPI (Herbsleb and Goldenson, 1996;El Emam et al., 1998; Stelzer and Mellis, 1998; El Emam et al., 1999; Dyba, 2000),
but few if any relate problems occurring within the process to the company’s currentor targeted CMM level. Because identifying and resolving problems is essential, andbecause of the lack of previous research relating problems to CMM maturity levels,we have conducted a study to investigate whether companies at different levels ofmaturity report different kinds of problems.
We have also investigated whether different types of practitioners report differentkinds of problems. We suspect that different types of practitioners vary in theirperspective and experience of software development processes, and believe thateffective SPI should involve all types of staff. To produce workable SPI strategiesand gain a common understanding of company goals all staff should be involved, ifcompanies do not work together it is unlikely that their processes are being followed(Bach, 1999).
In order to represent the needs of key software development staff we present datacollected from three different groups of practitioners at 12 software developmentcompanies. The three types of practitioners are developers, project managers andsenior managers. We conducted 45 focus groups of between four and six people; thegroups were selected on the basis of practitioner type and company. In total, the 45focus groups involved over 200 members of staff. The companies range from CMMLevel 1 to CMM Level 4.
Previous studies recognize that further work is needed to investigate howcompanies can improve their processes (Herbsleb and Goldenson, 1996; Stelzer andMellis, 1998; El Emam et al., 1999). Within the CMM, strengths and weaknesses inthe current process are assessed according to key process areas (KPAs). Ourmaturity-based and practitioner-based analyses pinpoint where problems areoccurring. The ‘‘location’’ of these problems could be related to KPAs. Theidentification of where problems are occurring should help practitioners tounderstand both what to improve and how to improve. This, in turn, should helpcompanies to both improve their processes and reduce the time it takes to improvethese processes. Our findings should also help researchers in the field of SPI to betterunderstand how companies are approaching SPI.
The remainder of this paper is organized as follows. In Section 2 of the paper wediscuss how our study complements existing work in the field. We describe our studymethods and our case study companies in Section 3. We present our main findings inSection 4 and discuss the implications of these findings in Section 5. We draw someconclusions and summarize our findings in Section 6.
2. Background To SPI Problems
In this section we discuss the literature background and context in which SPIproblems have been analyzed.
8 BEECHAM, HALL AND RAINER
2.1. The Capability Maturity Model as a Model of SPI
The software capability maturity model (SW-CMM) is one of the many evolvingmaturity models created by the SEI. While we are aware of the other models such asthe People CMM we have focussed solely on the SW-CMM as this is the modelfollowed by the companies in our study. All references in this paper to CMM relateto the SW-CMM. The CMM focuses on the capability of software organizations toproduce high-quality products consistently and predictably. The software processmaturity level is ‘‘the extent to which a specific process is explicitly defined, managed,measured, controlled and effective’’ (Paulk et al., 1995). In practice, the level ofmaturity indicates how successful a company has been in their software processimprovement. Maturity and success is expressed in terms of meeting key process area(KPA) objectives. Although each maturity level has its own KPAs, similarities inLevel 2 and 3 companies are noted in a study of CMM-based process improvement(Hayes and Zubrow, 1995) where movement up from Level 2 to Level 3 is easier/faster than from 1 to 2. This study does not cover whether movement from 3 to 4 ismore difficult, but does show a great drop in the number of companies achievingLevel 4. We recognize these stages of development by identifying problems withinthe context of maturity levels.
Our first research question links companies to their CMM levels in order toexamine whether individual maturity levels are concerned with specific softwaredevelopment problems.
Research question 1: Are different software development problems associated withCMM maturity levels?We are interested in CMM levels as they are linked to process capability. In a similarstudy to our own, Herbsleb and Goldenson’s (1996) results show a correlationbetween higher maturity and meeting schedules, meeting budgets, improving quality,improving productivity, improving customer satisfaction, and improving staffmorale. El Emam and Birk’s (2000) more recent study confirms other desirablematurity features where high process capability is found to be associated with betterproject estimation and performance.
All companies in our study have formally or informally assessed their processcapabilities in accordance with the CMM (see company profiles in Appendix A).Although the CMM is one of many software process improvement models, it isincreasingly considered the de facto standard (El Emam and Madhavji, 1995). TheCMM follows an assessment methodology that provides a way for companies toidentify the areas for improvement in an organization’s software process. While highlevel companies report the benefits of successful process improvement programs(Curtis, 2000), our recent study reveals that not all companies derive a competitiveadvantage when attempting to apply this improvement model (Rainer and Hall,2002). Moitra (1998) comments that this can be attributed to
the failure of organizations to clearly understand the crucial role of softwareprocesses in their operations . . . ignoring the more important people processes.
SOFTWARE PROCESS IMPROVEMENT PROBLEMS 9
Paulk et al. (1995) acknowledge that although the CMM directly addresses thehuman dimension only in training, people issues are not
outside the scope of management responsibility or outside the scope oforganizational needs.
He adds that an effective process can empower people toworkmore effectively. Boehm(1981) found that it was only when a system was structured from both a human andtechnical perspective that a well-balanced system resulted satisfying all operationalgoals. Practitioners from all process capability levels should therefore be concernedwith problems relating to both their technical and people processes. Humphrey et al.(1989) believe that this balance is difficult to achieve as in low maturity organizationstechnical issues almost never appear at the top of key priority lists.
Although technical issues are important, it is the relationship between technicalefficiency and social considerations that is paramount to the success of any business.Achieving this balance appears to be a problem for companies undertaking SPI.Fordham (1999) advocates creating
a blend of technology, people and process to provide a balanced score card ofactivities that can address our goals more successfully – people overlooked ormisused is the most critical resource in the equation.
2.2. SPI Stakeholders
Improving software processes is not the province of any one particular practitionergroup. Although management commitment and support is needed from all levels ofthe company (Diaz and Sligo, 1997; Mellis, 1998; Willis et al., 1998; Ahuja, 1999;Pitterman, 2000), the buy-in of the technical community is also necessary (Herbslebet al., 1994; Herbsleb and Goldenson, 1996; Mellis, 1998; Dyba, 2000; Baddoo andHall, in press).
Previous work suggests that all people involved in software processes must beactively committed to their company’s improvement goals and must be included inthe practical implementation of process change (Diaz and Sligo, 1997; Krasner,1997). Stelzer and Mellis (1998) warn that unless companies openly involve staff atall stages during implementation of improvement programs, investment and bestefforts are wasted.
In our study the problems cited by three practitioner groups (senior managers,project managers and developers) are examined separately to gain a staff perspectiveof SPI issues. To achieve synergy necessitates actively looking for points ofdisagreement. Indeed, Horvat et al. (2000) suggest that the success of a SPI projectdepends on the acceptance of its goals and tasks by every single employee. Thereforehuman, social and cultural factors should be considered within SPI plans. It istherefore of practical use to highlight similarities and differences in problemspractitioners are experiencing in their software improvement programs. Developing
10 BEECHAM, HALL AND RAINER
an understanding of the problems associated with each role will help companiesachieve a more open approach to SPI.
Our second research question looks at whether the three practitioner groups havedifferent problems with SPI.
Research question 2: Do Developers, Project Managers and Senior Managers havedifferent problems with SPI?
3. Methodology
3.1. Focus Groups
We used focus groups as our main approach to collecting data. Focus groups are awell-documented technique in the social sciences (Morgan, 1997). They involveassembling small groups of peers to discuss particular topics. Discussion is largelyfree flowing, but is directed by a researcher allowing soft, or qualitative, issues to beexplored. Indeed focus groups have been described as ‘‘a way to better understandhow people feel and think about an issue’’ (Krueger and Casey, 2000). The focusgroup data elicited a rich set of staff perceptions that would not have been recordedif left to questionnaires or individual interviews. Focus groups also elicit data thatallows a better understanding of the differences between groups of people. Also,Morgan and Krueger say that ‘‘the comparisons participants make among eachother’s experiences and opinions are a valuable source of insight into complexbehaviors and motivations’’ (Morgan and Krueger, 1993). Focus groups are,therefore, an ideal vehicle for exploring the problems different CMM levelcompanies and different staff groups are experiencing with their SPI programs.
3.2. Implementing Focus Groups
From September 1999 to March 2000 we visited 13 software companies andconducted 49 focus groups. This study, however, uses data collected from 12 of thesecompanies. Appendix A provides an overview of the 12 companies in our study ofSPI problems. Participating companies were selected from a larger sample ofcompanies who responded to a detailed questionnaire giving broad informationabout their software development activities and company demographics. Thecompanies were chosen to provide our research project with a cross-section ofcompany maturity levels, software applications and company sizes.
Transcript data from company 12 was not used in this study as the focus groupsdid not comply with the classifications of the other 12 companies. Company 12served as a pilot study where senior managers, project managers and developers werenot separated into staff groups.
The remaining 12 participating companies represented in this paper comprise 45focus groups (see Table 1 for breakdown of practitioner groups). Each focus group
SOFTWARE PROCESS IMPROVEMENT PROBLEMS 11
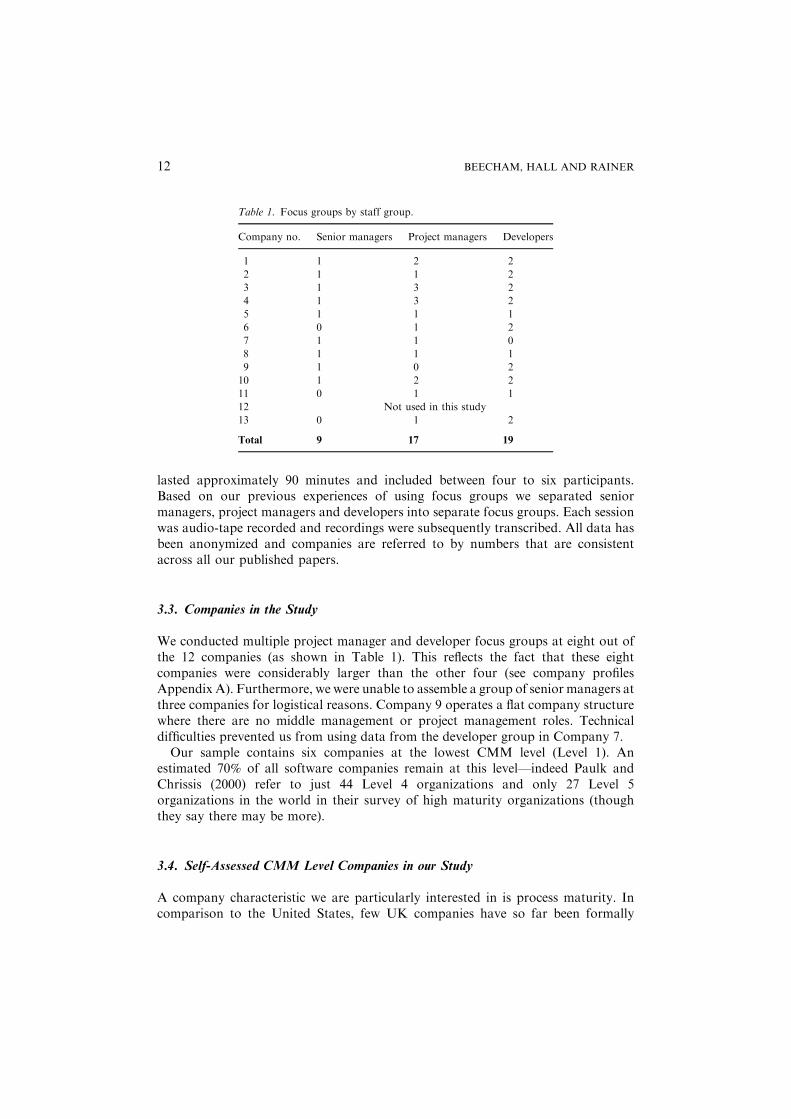
lasted approximately 90 minutes and included between four to six participants.Based on our previous experiences of using focus groups we separated seniormanagers, project managers and developers into separate focus groups. Each sessionwas audio-tape recorded and recordings were subsequently transcribed. All data hasbeen anonymized and companies are referred to by numbers that are consistentacross all our published papers.
3.3. Companies in the Study
We conducted multiple project manager and developer focus groups at eight out ofthe 12 companies (as shown in Table 1). This reflects the fact that these eightcompanies were considerably larger than the other four (see company profilesAppendix A). Furthermore, we were unable to assemble a group of senior managers atthree companies for logistical reasons. Company 9 operates a flat company structurewhere there are no middle management or project management roles. Technicaldifficulties prevented us from using data from the developer group in Company 7.
Our sample contains six companies at the lowest CMM level (Level 1). Anestimated 70% of all software companies remain at this level—indeed Paulk andChrissis (2000) refer to just 44 Level 4 organizations and only 27 Level 5organizations in the world in their survey of high maturity organizations (thoughthey say there may be more).
3.4. Self-Assessed CMM Level Companies in our Study
A company characteristic we are particularly interested in is process maturity. Incomparison to the United States, few UK companies have so far been formally
Table 1. Focus groups by staff group.
Company no. Senior managers Project managers Developers
1 1 2 2
2 1 1 2
3 1 3 2
4 1 3 2
5 1 1 1
6 0 1 2
7 1 1 0
8 1 1 1
9 1 0 2
10 1 2 2
11 0 1 1
12 Not used in this study
13 0 1 2
Total 9 17 19
12 BEECHAM, HALL AND RAINER
CMM assessed and so it is no surprise that only four of our companies have been(see company profiles Appendix A). To overcome this we emulated Herbsleb andGoldenson (1996) and asked the other eight companies to estimate their CMM levelthrough a detailed questionnaire and independent audit.
We are aware that self-rated companies can over-estimate their process maturityand therefore conducted our own independent study of these companies’ CMMLevels. Appendix G gives an overview of our methodology together with a detailedbreakdown of company practices.
3.5. Qualitative Data Analysis
In order to investigate problems companies were experiencing in their SPI programs,we asked each focus group:
. What are the problems and issues in software development in your company?
. What are the obstacles to SPI in your company?
We used the broad principles of content analysis of each focus group discussion todevelop problem categories by placing emphasis on the meaning, the interpretationand the intentions of the data, as offered by practitioners (Krippendorff, 1980).Clusters of software development problems were identified. We produced cleardefinitions of these problem groups (Appendix B), as in any data analysis thedefinition must be useful, simple and direct. By providing similar levels of granularityand clear detailed definitions we aim to ‘‘assemble trustworthy collections of softwaredata from different sources’’ (Kitchenham et al., 2001). We categorized each probleminto three main groups and 16 sub-categories as in the following scheme:
1. Organizational Issues: Change management; communication; culture; goals;people; politics
2. Project Issues: Budget and estimates; documentation; quality; timescales; toolsand technology
3. Software Development Life Cycle Issues: Requirements; design; coding; testing;maintenance
Appendix B provides definitions and examples of the above problem categories.
3.6. Analysis and Validation
We used a two-stage approach to analyze and validate the data. First we conducted aformal reliability test, using the results from two different researchers. Second, with
SOFTWARE PROCESS IMPROVEMENT PROBLEMS 13
confidence in our classification scheme, we drew up contingency tables based onreliable problem frequencies.
Stage 1A manual analysis was performed on practitioner responses to researcher questionson problems and obstacles to SPI. All problems cited by each practitioner group areidentified. This list of all the problems was then organized into problem groups (fordefinitions of the 16 problem groups see Appendix B). We conducted an inter-raterreliability test to increase confidence in this identification process:
Overview:. Two researchers were involved in the analysis. Researcher 1 developed the scale
and performed an initial analysis—identifying 16 problem groups and individualproblem frequencies. Researcher 2 validated the analysis through an objectiveanalysis.
Process:. Researcher 1 selected 82 quotes from the transcripts and gave them to researcher
2. Researcher 2 placed the quotes into given categories. Researcher 2 was given achoice of 3 categories and given full definitions of these categories. These 82 quotesrepresented a subset of the 16 problem areas covered in our study.
. To test for researcher bias and subjectivity a Cohen’s kappa inter-rater reliabilitytest was performed. Cohen’s kappa measure of agreement between the evaluationsof the two raters was positive: 82 valid cases gave a value of k 0.71 representing asubstantial strength of agreement (Dunn, 1989; Vogt, 1999).
Stage 2. A matrix was constructed, mapping all 16 problem-groups cited to each company,
CMM level and practitioner group. A total of 1251 problems were cited.Contingency tables are drawn up based on the frequencies of problems within eachgroup of interest.
3.7. Frequency Data Analysis
We are interested in whether there are significant associations between
a. Problems and CMM levels (Research Question 1).
b. Problems and staff groups (Research Question 2).
We have used correspondence analysis to graphically display the relationshipbetween the nominal variables in our contingency tables (Greenacre and Blasius,
14 BEECHAM, HALL AND RAINER
1994). This exploratory technique ‘‘describes’’ rather than ‘‘analyzes’’ the data. Itbuilds on the Pearson chi-squared independence test, revealing the dependencestructure of nominal variables by providing a ‘‘measure’’ of association. It describesthe relationships ‘‘within’’ variables (e.g. how practitioner groups relate to each otherin how they perceive problems), as well as the relationship ‘‘between’’ variables (e.g.how each practitioner group relates to each problem group). Plots on a maprepresent variables and their proximity to each other provides a measure ofassociation. The closer a variable lies to the origin ‘‘0’’, the more ‘‘normal’’ itsbehavior. A variable’s distance from this origin is explained through levels of‘‘inertia’’ (Appendix D). If all problems were given equal focus across groups theinertia would be small. Alternatively, if problems are polarized, the profile points aremore dispersed and the inertia values will increase accordingly.
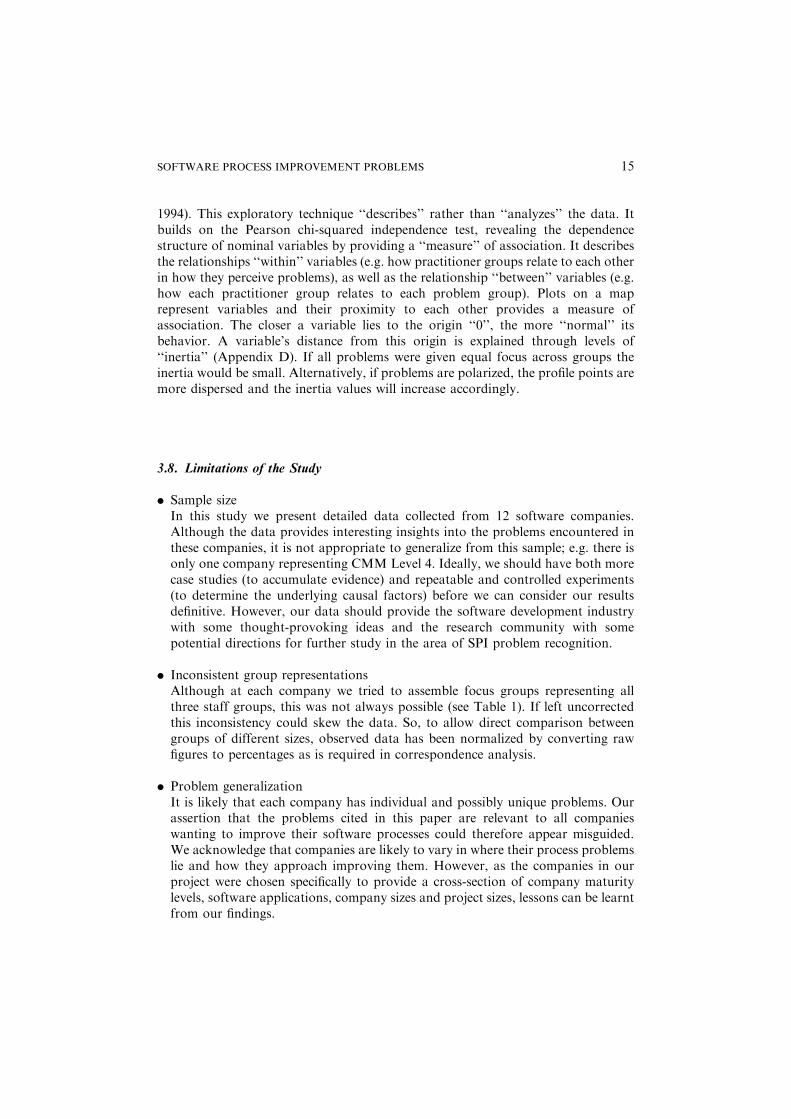
3.8. Limitations of the Study
. Sample sizeIn this study we present detailed data collected from 12 software companies.Although the data provides interesting insights into the problems encountered inthese companies, it is not appropriate to generalize from this sample; e.g. there isonly one company representing CMM Level 4. Ideally, we should have both morecase studies (to accumulate evidence) and repeatable and controlled experiments(to determine the underlying causal factors) before we can consider our resultsdefinitive. However, our data should provide the software development industrywith some thought-provoking ideas and the research community with somepotential directions for further study in the area of SPI problem recognition.
. Inconsistent group representationsAlthough at each company we tried to assemble focus groups representing allthree staff groups, this was not always possible (see Table 1). If left uncorrectedthis inconsistency could skew the data. So, to allow direct comparison betweengroups of different sizes, observed data has been normalized by converting rawfigures to percentages as is required in correspondence analysis.
. Problem generalizationIt is likely that each company has individual and possibly unique problems. Ourassertion that the problems cited in this paper are relevant to all companieswanting to improve their software processes could therefore appear misguided.We acknowledge that companies are likely to vary in where their process problemslie and how they approach improving them. However, as the companies in ourproject were chosen specifically to provide a cross-section of company maturitylevels, software applications, company sizes and project sizes, lessons can be learntfrom our findings.
SOFTWARE PROCESS IMPROVEMENT PROBLEMS 15

. Problem statusFinally, we make no comment on the importance of individual problems cited.For our analysis every SPI process problem mentioned in a focus group has equalimportance. Clearly in the commercial world some problems are more importantthan others.
4. Analysis of Results
4.1. CMM Level Problem Association
Research question 1: Are different software development problems associated withCMM maturity levels?Frequencies of all reported problems from the 45 focus groups have been convertedto percentages to allow comparison (Table 2). For a contingency table showingproblem frequencies of all 12 companies by CMM level see Table 5 in Appendix C.
The significance of the relationship between the CMM group and problem grouppercentages in Table 2 is confirmed by the chi-squared test of association X2 ¼ 32.9,df ¼ 6, p< 0.001. It can be concluded that it is highly unlikely that the relationshipbetween CMM levels and the three main problem groups appear by chance. Inparticular, the frequencies appear to show a strong relationship between the Level 4group and organizational issues (68%), and a gradual distancing from project issuesas companies mature.
The percentages in Table 2 have been used to create a correspondence analysismap showing relationships between ‘‘CMM levels’’ and ‘‘problem groups’’ (seeFigure 1).
See Appendix D for a guide to basic correspondence analysis (CA) concepts.The positions of the problem groups and the CMM groups in Figure 1, suggest the
following:
As companies mature their interest in project level problems weakens revealing achange in problem focus. Note in Figure 1 that:
. The CMM Level 1 group is located very close to the project group. This suggeststhat the CMM Level 1 group is particularly concerned with problems at theproject level.
Table 2. CMM levels and overall problem frequencies by row %.
CMM levels Organizational Project Lifecycle
1 38 40 22
2 34 40 26
3 41 37 22
4 68 27 5
16 BEECHAM, HALL AND RAINER
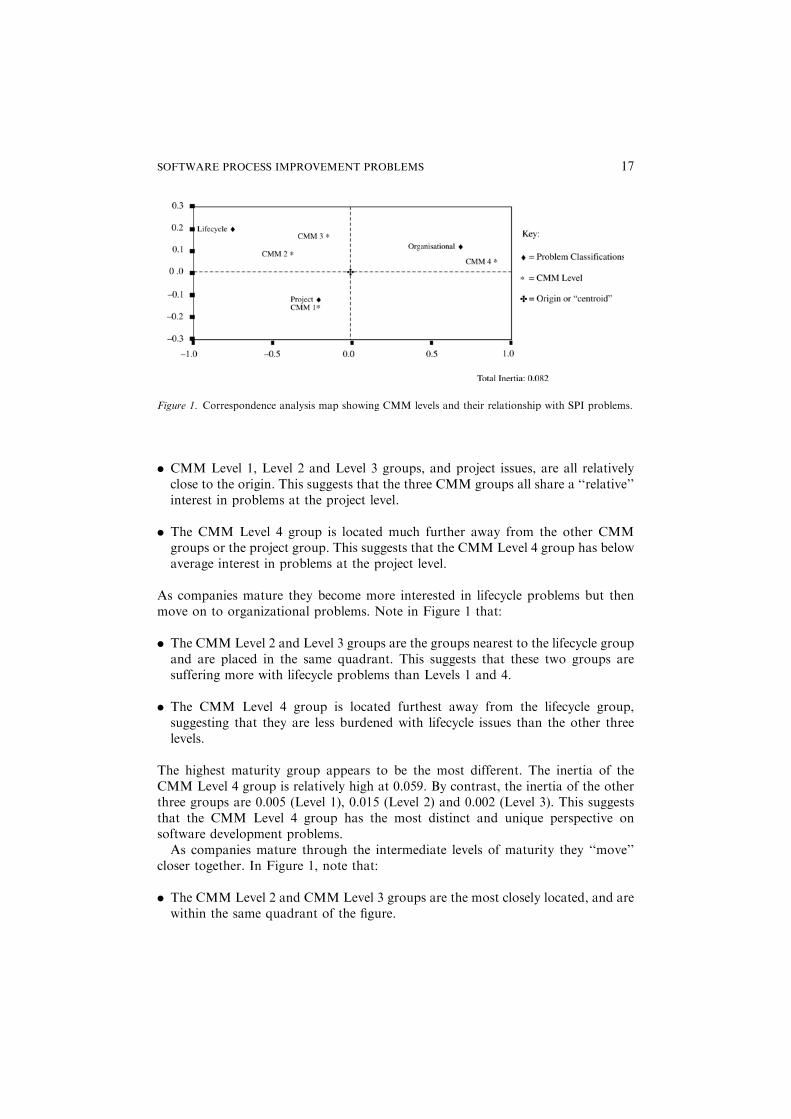
. CMM Level 1, Level 2 and Level 3 groups, and project issues, are all relativelyclose to the origin. This suggests that the three CMM groups all share a ‘‘relative’’interest in problems at the project level.
. The CMM Level 4 group is located much further away from the other CMMgroups or the project group. This suggests that the CMM Level 4 group has belowaverage interest in problems at the project level.
As companies mature they become more interested in lifecycle problems but thenmove on to organizational problems. Note in Figure 1 that:
. The CMM Level 2 and Level 3 groups are the groups nearest to the lifecycle groupand are placed in the same quadrant. This suggests that these two groups aresuffering more with lifecycle problems than Levels 1 and 4.
. The CMM Level 4 group is located furthest away from the lifecycle group,suggesting that they are less burdened with lifecycle issues than the other threelevels.
The highest maturity group appears to be the most different. The inertia of theCMM Level 4 group is relatively high at 0.059. By contrast, the inertia of the otherthree groups are 0.005 (Level 1), 0.015 (Level 2) and 0.002 (Level 3). This suggeststhat the CMM Level 4 group has the most distinct and unique perspective onsoftware development problems.
As companies mature through the intermediate levels of maturity they ‘‘move’’closer together. In Figure 1, note that:
. The CMM Level 2 and CMM Level 3 groups are the most closely located, and arewithin the same quadrant of the figure.
Figure 1. Correspondence analysis map showing CMM levels and their relationship with SPI problems.
SOFTWARE PROCESS IMPROVEMENT PROBLEMS 17

. By contrast, the CMM Level 1 and CMM Level 4 groups are further away fromthe Level 2 and Level 3 groups, and they are also in their own quadrants.
. This observation is consistent with Hayes and Zubrow’s finding that it seems to beeasier to mature from Level 2 to Level 3 than from Level 1 to Level 2. This may bebecause the two levels are closer in concept (Hayes and Zubrow, 1995).
Differences between contingency Table 2 percentages and CA map Figure 1:
. The correspondence analysis map provides a different perspective on problemassociation.
. Percentages in Table 2 show that CMM Level 1 and 2 companies share the sameconcerns with project issues (40%). This similarity is not shown in Figure 1 wherea measure of association is given taking account of all variables. As CMM Level 2companies have more concern with lifecycle issues than CMM Level 1 companies,they are pulled away from project issues and move nearer to the lifecycle issues.
. Table 2 indicates that Level 2 and Level 3 groups have different problem profiles.Level 2 is most concerned with project issues while the main problems for Level 3are connected to organizational issues. However, the correspondence analysisidentifies a similar differential between project and lifecycle problems and this isreflected by the proximity of Levels 2 and 3 on the CA map.
4.2. Practitioner Group Problem Association
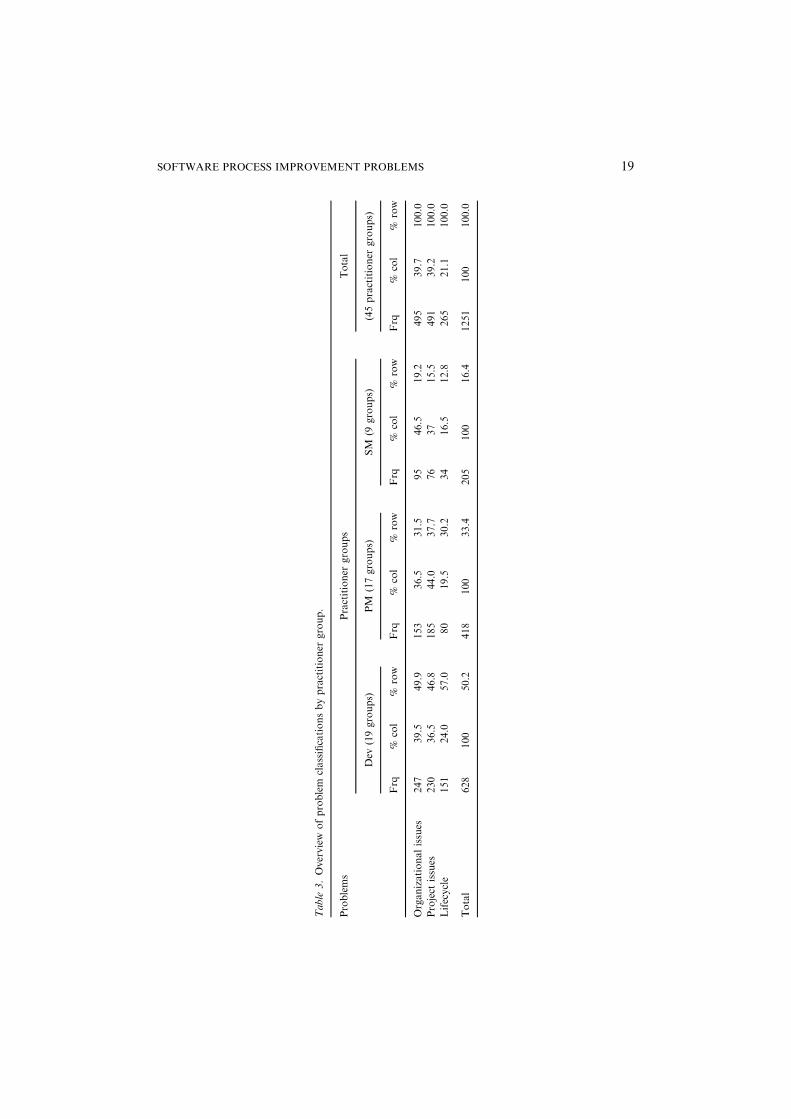
Research question 2: Do Developers, Project Managers and Senior Managers havedifferent problems with SPI?Table 3 is a high-level problem abstraction and provides the frequencies of problemspractitioners experience in three main problem categories. The differences betweenstaff groups and problems at this high level of abstraction are significant with a chi-squared test of association result (using observed frequencies), X2 ¼ 12.635, df ¼ 4,p ¼ 0.013 (using observed frequencies).
The main findings are:
. Project managers are most concerned with project issues. Developers and seniormanagers are most concerned with organizational issues.
. Developers claim 57% of cited problems in the lifecycle group.
In Figure 2, the CA map shows these associations very clearly.
18 BEECHAM, HALL AND RAINER
Table
3.O
ver
view
ofpro
blem
class
ifica
tionsby
pra
ctitio
ner
gro
up.
Pro
blem
sPra
ctitio
ner
gro
ups
Tota
l
Dev
(19
gro
ups)
PM
(17
gro
ups)
SM
(9gro
ups)
(45
pra
ctitio
ner
gro
ups)
Frq
%co
l%
row
Frq
%co
l%
row
Frq
%co
l%
row
Frq
%co
l%
row
Org
anizationalissu
es247
39.5
49.9
153
36.5
31.5
95
46.5
19.2
495
39.7
100.0
Pro
ject
issu
es230
36.5
46.8
185
44.0
37.7
76
37
15.5
491
39.2
100.0
Lifec
ycle
151
24.0
57.0
80
19.5
30.2
34
16.5
12.8
265
21.1
100.0
Tota
l628
100
50.2
418
100
33.4
205
100
16.4
1251
100
100.0
SOFTWARE PROCESS IMPROVEMENT PROBLEMS 19
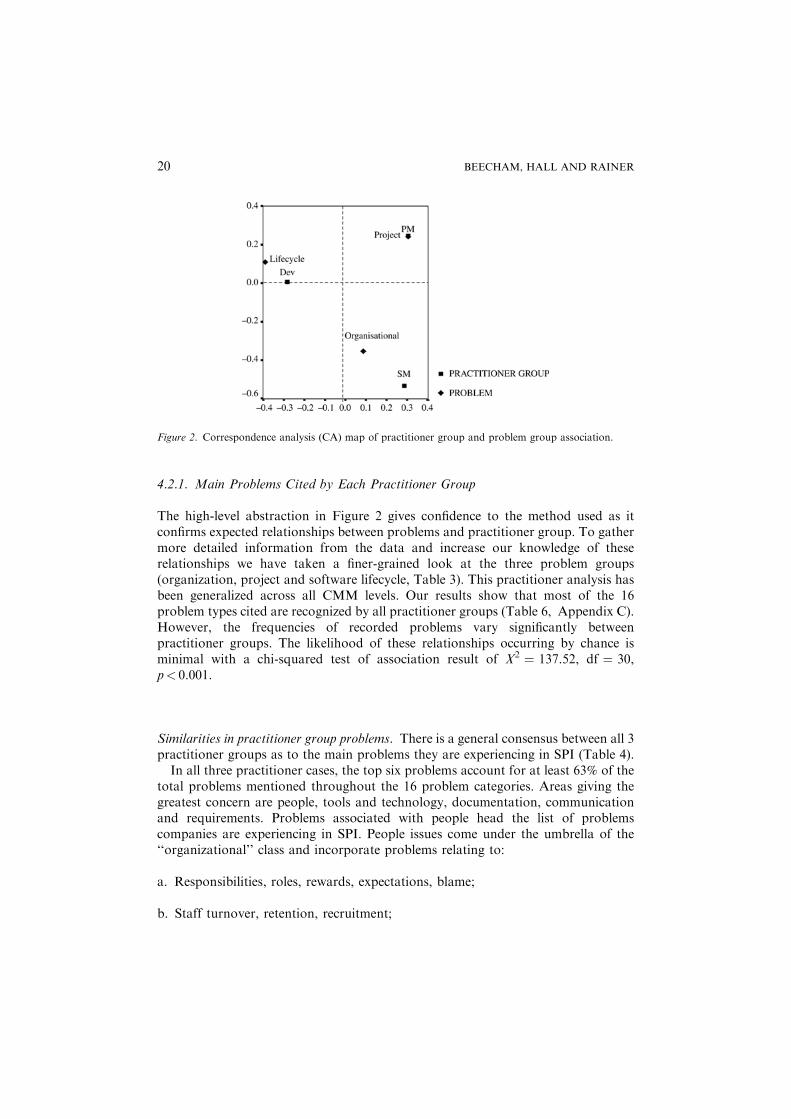
4.2.1. Main Problems Cited by Each Practitioner Group
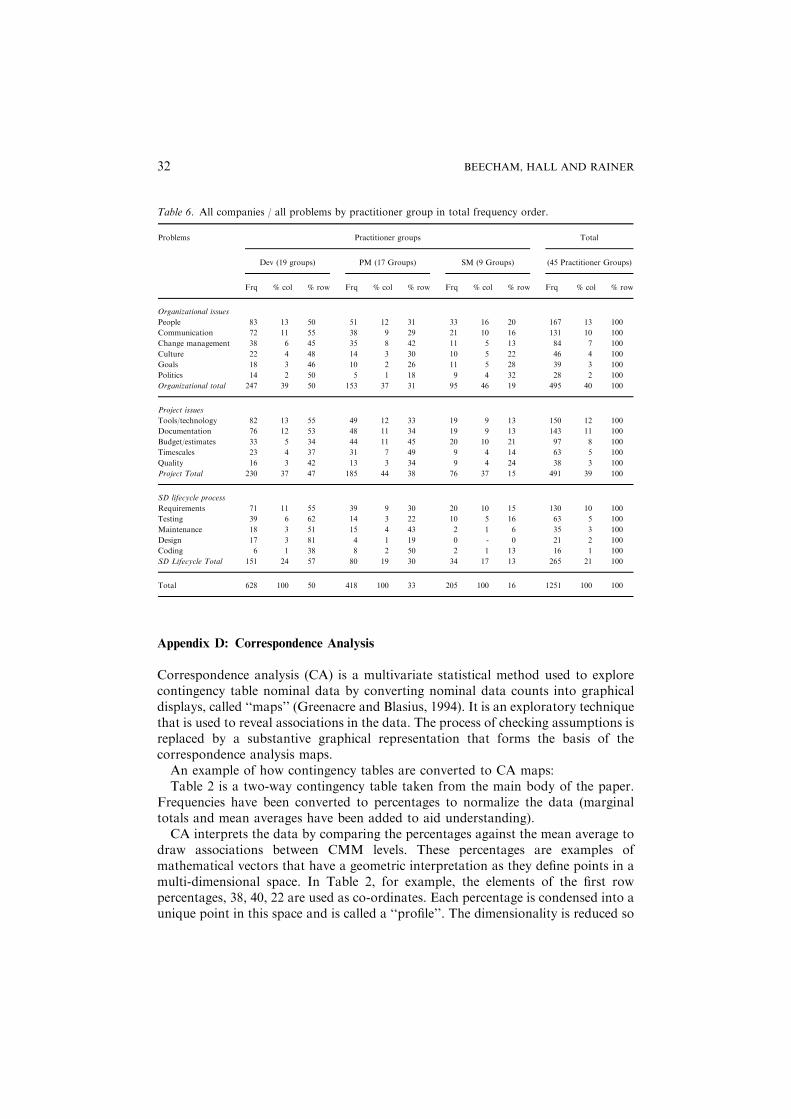
The high-level abstraction in Figure 2 gives confidence to the method used as itconfirms expected relationships between problems and practitioner group. To gathermore detailed information from the data and increase our knowledge of theserelationships we have taken a finer-grained look at the three problem groups(organization, project and software lifecycle, Table 3). This practitioner analysis hasbeen generalized across all CMM levels. Our results show that most of the 16problem types cited are recognized by all practitioner groups (Table 6, Appendix C).However, the frequencies of recorded problems vary significantly betweenpractitioner groups. The likelihood of these relationships occurring by chance isminimal with a chi-squared test of association result of X2 ¼ 137.52, df ¼ 30,p< 0.001.
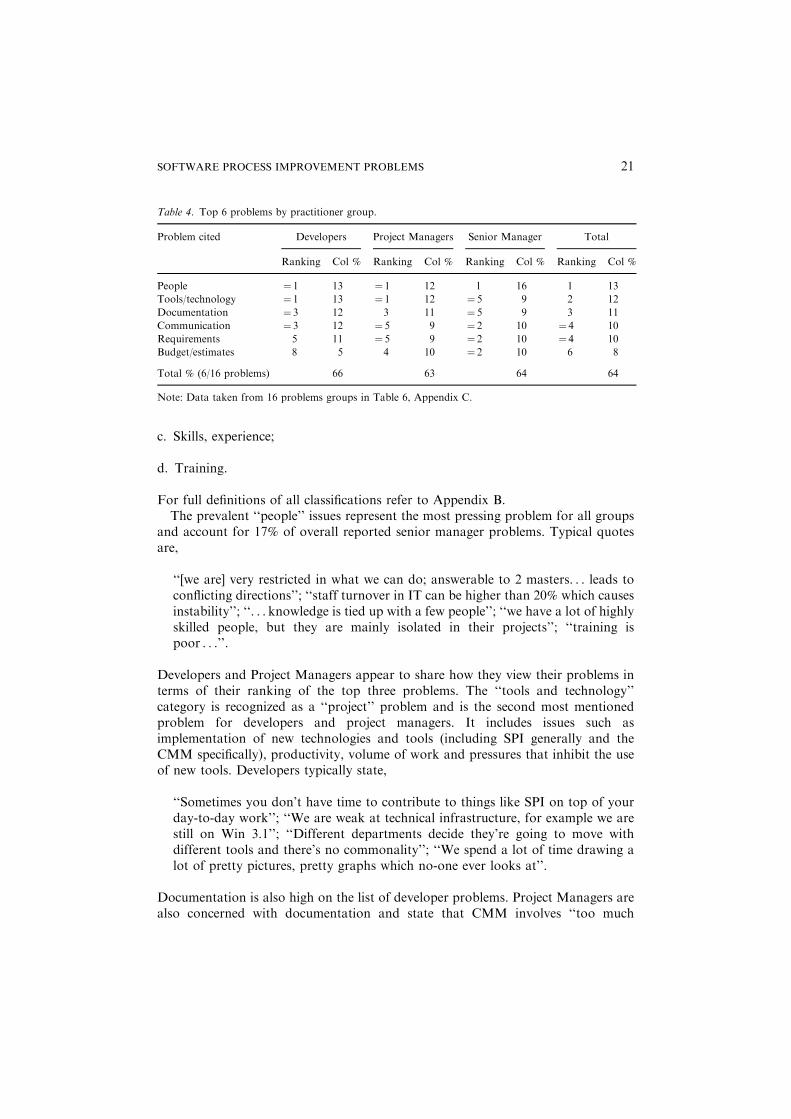
Similarities in practitioner group problems. There is a general consensus between all 3practitioner groups as to the main problems they are experiencing in SPI (Table 4).
In all three practitioner cases, the top six problems account for at least 63% of thetotal problems mentioned throughout the 16 problem categories. Areas giving thegreatest concern are people, tools and technology, documentation, communicationand requirements. Problems associated with people head the list of problemscompanies are experiencing in SPI. People issues come under the umbrella of the‘‘organizational’’ class and incorporate problems relating to:
a. Responsibilities, roles, rewards, expectations, blame;
b. Staff turnover, retention, recruitment;
Figure 2. Correspondence analysis (CA) map of practitioner group and problem group association.
20 BEECHAM, HALL AND RAINER
c. Skills, experience;
d. Training.
For full definitions of all classifications refer to Appendix B.The prevalent ‘‘people’’ issues represent the most pressing problem for all groups
and account for 17% of overall reported senior manager problems. Typical quotesare,
‘‘[we are] very restricted in what we can do; answerable to 2 masters. . . leads toconflicting directions’’; ‘‘staff turnover in IT can be higher than 20% which causesinstability’’; ‘‘. . . knowledge is tied up with a few people’’; ‘‘we have a lot of highlyskilled people, but they are mainly isolated in their projects’’; ‘‘training ispoor . . .’’.
Developers and Project Managers appear to share how they view their problems interms of their ranking of the top three problems. The ‘‘tools and technology’’category is recognized as a ‘‘project’’ problem and is the second most mentionedproblem for developers and project managers. It includes issues such asimplementation of new technologies and tools (including SPI generally and theCMM specifically), productivity, volume of work and pressures that inhibit the useof new tools. Developers typically state,
‘‘Sometimes you don’t have time to contribute to things like SPI on top of yourday-to-day work’’; ‘‘We are weak at technical infrastructure, for example we arestill on Win 3.1’’; ‘‘Different departments decide they’re going to move withdifferent tools and there’s no commonality’’; ‘‘We spend a lot of time drawing alot of pretty pictures, pretty graphs which no-one ever looks at’’.
Documentation is also high on the list of developer problems. Project Managers arealso concerned with documentation and state that CMM involves ‘‘too much
Table 4. Top 6 problems by practitioner group.
Problem cited Developers Project Managers Senior Manager Total
Ranking Col % Ranking Col % Ranking Col % Ranking Col %
People ¼ 1 13 ¼ 1 12 1 16 1 13
Tools/technology ¼ 1 13 ¼ 1 12 ¼ 5 9 2 12
Documentation ¼ 3 12 3 11 ¼ 5 9 3 11
Communication ¼ 3 12 ¼ 5 9 ¼ 2 10 ¼ 4 10
Requirements 5 11 ¼ 5 9 ¼ 2 10 ¼ 4 10
Budget/estimates 8 5 4 10 ¼ 2 10 6 8
Total % (6/16 problems) 66 63 64 64
Note: Data taken from 16 problems groups in Table 6, Appendix C.
SOFTWARE PROCESS IMPROVEMENT PROBLEMS 21
paperwork. It is not as automated as it should be’’ (Project Manager, CMM Level 1company).
Differences in practitioner group problems. Senior managers have below averageconcern for project issues such as documentation and tools and technology issues, asthey concentrate on problems relating to people and communication. They haveabove average concern for requirements issues in terms of problem ranking (equal2nd), but an average concern in terms of percentage of problems. Indeed, furtherexamination of Table 2 reveals that developers devote a higher percentage of overallproblems to requirements than senior managers do with 11% and 10% respectively.
Requirements issues, generally, are causing the greatest lifecycle problems. Ourprevious empirical study of requirements problems found that 48% of all lifecycleproblems are due to this initial stage of development (Hall et al., 2002).
Developers do not share the high concern for ‘‘budgets and estimates’’ with SeniorManagers and to a lesser extent with project managers.
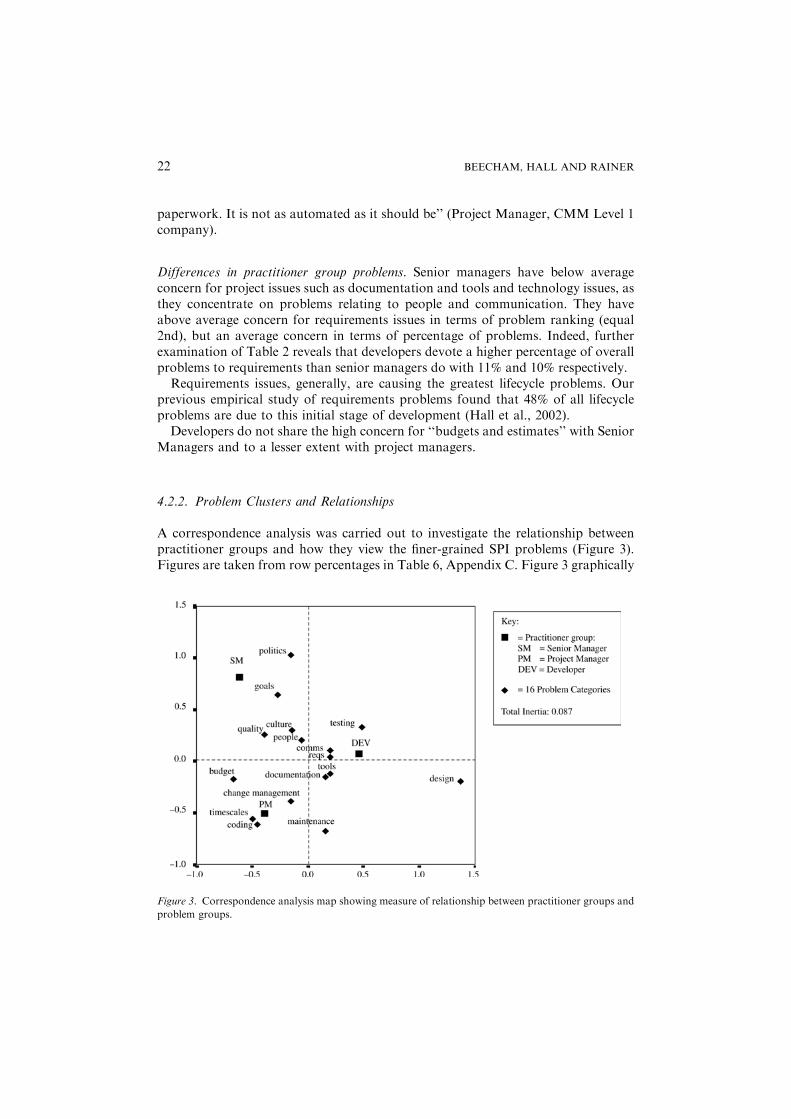
4.2.2. Problem Clusters and Relationships
A correspondence analysis was carried out to investigate the relationship betweenpractitioner groups and how they view the finer-grained SPI problems (Figure 3).Figures are taken from row percentages in Table 6, Appendix C. Figure 3 graphically
Figure 3. Correspondence analysis map showing measure of relationship between practitioner groups and
problem groups.
22 BEECHAM, HALL AND RAINER

displays problem clusters around staff groups and shows how staff groups inter-relate. The map places a new perspective on how problems and practitioners relate.This analysis also releases the problem categories from the higher-level classificationscheme that could be viewed as too general to be useful (i.e., organizational, projectand lifecycle in Figure 2). Points of interest are:
. The total inertia of the CA map (Figure 3) is 0.087, which indicates that there is adifference in how each practitioner group views some problems; if all practitionersexpressed the same problem concerns the inertia would be 0.00. Extreme differencebetween groups in every area would result in a high inertia of approximately 0.99(see Appendix D).
. The three practitioner groups are equidistant from each other and exist in differingquadrants, suggesting that each practitioner group is independent of the other twoin how they cite SPI problems.
. Developers show most concern for requirements, communication, tools andtechnology, documentation and testing. Developers’ inertia is relatively low(0.022) suggesting that their problems are near to the average.
. Project managers are concerned with budgets and estimates, timescales andchange management and coding as they are all in the same quadrant. Projectmanagers’ inertia is relatively low (0.026) suggesting that their problems are nearto the average.
. Senior managers’ inertia is relatively high (0.039), signaling that some of theirareas of concern differ from the norm.
. The proximity of senior managers to goals and politics and their positioning onthe periphery of the map suggest problem polarization.
. People, documentation, tools and technology, requirements and communicationare closest to the centroid and represent the most common problems.
. There is a distancing from documentation, tools and technology, requirementsand communication with developers being the closest, project managers furtheraway, and senior management furthest away.
4.2.3. A Shift in Problem Focus
Problems relating to tools and technology are giving developers concern. Theemphasis placed on this problem area shifts with changing practitioner roles. Toolsand technology problems are closest to the developers on the CA map and project
SOFTWARE PROCESS IMPROVEMENT PROBLEMS 23
managers appear more distant while senior managers are furthest away from allproblems placed around the center of the map, i.e., are least concerned with the mostpersistent problems.
Documentation issues are also preoccupying developers. This category includesco-ordination and management of documents, feedback, post-mortems and datacollection methods. There seems to be a subtle distancing from this problem in thecompany staff hierarchy. Developers report,
‘‘There is no ownership of document production’’; ‘‘There is no formaldocumentation’’; ‘‘Documentation, we don’t have enough, from a support pointof view’’.
The same pattern of distancing from problems occurs in the case of requirements.Indeed, this is consistent with our previous analysis where developers were found tohave a better understanding of requirement process problems than project managersand senior managers (Hall et al., 2002).
Developers involved in SPI report that requirements, testing, tools andtechnology, and documentation problems are disrupting software development.There is little evidence that management is giving these areas the same focus.
5. Discussion
Research question 1: Are different software development problems associated withCMM maturity levels?Our results suggest that there is an association between reported problems andCMM maturity levels. Low maturity companies suffer from project and technicalproblems while high maturity companies are more burdened with organizationalproblems.
There appears to be a tension between the advice given by the literature on the onehand, and the guidelines offered by the CMM and our findings on the other hand.The literature states that organizational issues (especially the human element) are ofprime importance to the success of SPI initiatives while the CMM focuses on projectissues before looking at organizational issues. For example, Moitra (1998) suggeststhat organizational issues are important to successfully introduce, deploy andinstitute recommended software engineering and management practices. Ourfindings show that low level companies are project focussed which indicates aconvergence with the CMM. Humphrey (1989), a pioneer of SPI, suggests thatmanagement must consider the technical or project issues rather than theirorganizational needs when embarking on SPI. This is consistent with the CMM,where it is not until CMM Level 3 that organizational issues become a KPA. Ourfindings indicate that low maturity companies are not in a position to concernthemselves primarily with organizational issues as they tend to have more urgenttechnical and project problems.
24 BEECHAM, HALL AND RAINER
Our high maturity company results suggest that such companies have solved mostof their low level technical problems and are in a position to focus on organizationalproblems. Furthermore, our findings also indicate that high maturity companiesrecognize the importance of people within software development (people issues forma major part of our organizational category). Because many of the people issuesreported in our results are outside the scope of the CMM, companies may not bereceiving enough support and guidance on the human issues in SPI when followingthis model exclusively.
Moving from CMM Level 1 to CMM Level 2 is known to be a difficultadvancement. Our findings indicate those companies at Levels 2 and 3 share similarprocess problems (also confirmed by swifter movement between these levels). Thissuggests that there is a similarity in company behavior at these two levels.
Furthermore, it may mean that once a company has moved beyond Level 1, it isbetter prepared for the next process improvement stage.
Research question 2: Do Developers, Project Managers and Senior Managers havedifferent problems with SPI?Our results show that developers, project managers and senior managers reportsimilar problems with their SPI initiatives. They all share a key concern for peopleissues that, with the exception of training, are outside the scope of the CMM.However, practitioners’ problem priorities differ to reflect their varied experiencesand roles. There is little evidence to suggest that any staff group identify stronglywith another staff group in how they experience SPI problems. Although thisdifference is to be expected, it could be argued that a problem for any individual staffgroup is a problem for the company as a whole.
Our findings indicate that senior management is isolated from the other two staffgroups, with its problems focused around goals and political influences. Althoughsenior managers share a common concern for people issues such as skills shortages,they are not necessarily aware of the issues directly affecting developers and projectmanagers such as documentation and tools and technology. This lack ofunderstanding is likely to have a detrimental impact on the ability of seniormanagement to design effective SPI implementation strategies.
6. Conclusion
The content analysis approach to data gathering helped to group problems intological categories. These categories allowed us to explore the relationships betweenproblem and CMM level, and problem and staff group. We have shown the relativeimportance of these problems and the relevance of the most pressing problems. Wehave made a distinction between problem groups through clear definitions andcomparisons. We have shown the problems SPI companies are experiencing in theirorganizational, project and software development lifecycle processes. Concreteexamples are given of typical problems occurring in software development
SOFTWARE PROCESS IMPROVEMENT PROBLEMS 25
companies. We developed this theme to highlight areas where problems areconcentrated.
Companies in our study are suffering mainly from organizational problems.Within this problem group, there is a concentration of people and communicationissues. These problems are common to all CMM levels and all practitioner groups. Itis the high-level maturity companies who are most aware of organizationalproblems, along with Senior Managers and Project Managers. This is likely to bebecause companies with mature processes do not have so many problems at theproject level, and Developers do not involve themselves with organizational matters.Managers embarking on a SPI effort, therefore, need to be aware of the omnipresentorganizational issues, while making sure the project and lifecycle issues are given theappropriate focus, especially the recurring problems developers are having withrequirements, tools, technology and documentation.
Managers in low maturity companies need to consider lifecycle problems, inparticular they should make resources available to manage requirements so thatcompanies can progress to the desirable position of the more mature companieswhere lifecycle issues are no longer a priority problem area. Our results endorse theCMM by indicating that the higher maturity companies are indeed producingsoftware that is more reliable and predictable. Managers therefore need to conquertheir lower-level process problems in order to achieve the benefits associated with thehigher-level maturity companies.
Management involved in quality assessments can gain by looking at how eachstaff group is approaching SPI and recognizing that despite having similar companygoals their problems are likely to be different. These individual needs should beaddressed if managers are going to achieve a universal ‘‘buy-in’’ to SPI as there mustbe something in the improvement effort for everyone. Practitioners are unlikely tofocus on high maturity issues before they have addressed the lower level processneeds, or at least until they are ready.
This study gives some insight into how the CMM improvement model is beingused in the field. The model to date has undergone little empirical testing and it istherefore reassuring to find that the problems companies are experiencing appear tobe linked to their CMM level. This suggests that the model is well constructed and asa result managers should have more confidence in using the improvement model andaddressing problems voiced by practitioners.
7. Future Work
Identify strategies that complement the recognized improvement models that addressthe people issues identified in this report. Suggest ways to incorporate the SEI’sPeople-CMM to assist companies with their people problems that are outside thescope of the SW-CMM.
Design, coding, culture, goals and political issues are very low on the list ofproblems reported by practitioners in the focus groups. It would be useful to knowwhether software development companies undertaking SPI initiatives are simply not
26 BEECHAM, HALL AND RAINER
recognizing these problems or whether companies are not suffering from theseproblems.
Acknowledgments
We are sincerely grateful to all the companies and practitioners (who, for reasons ofconfidentiality, must remain anonymous) for their participation in the ‘‘Managingpractitioner impact on processes and products’’ (PPP) project. The PPP project isfunded by the United Kingdom Engineering and Physical Science Research Council,under grant number EPSRC GRL91962. We are also grateful to Dr. NathanBaddoo, Dr. Carol Britton and Dr. Michaela Cottee for their helpful commentsrelating to the content and statistics of this paper.
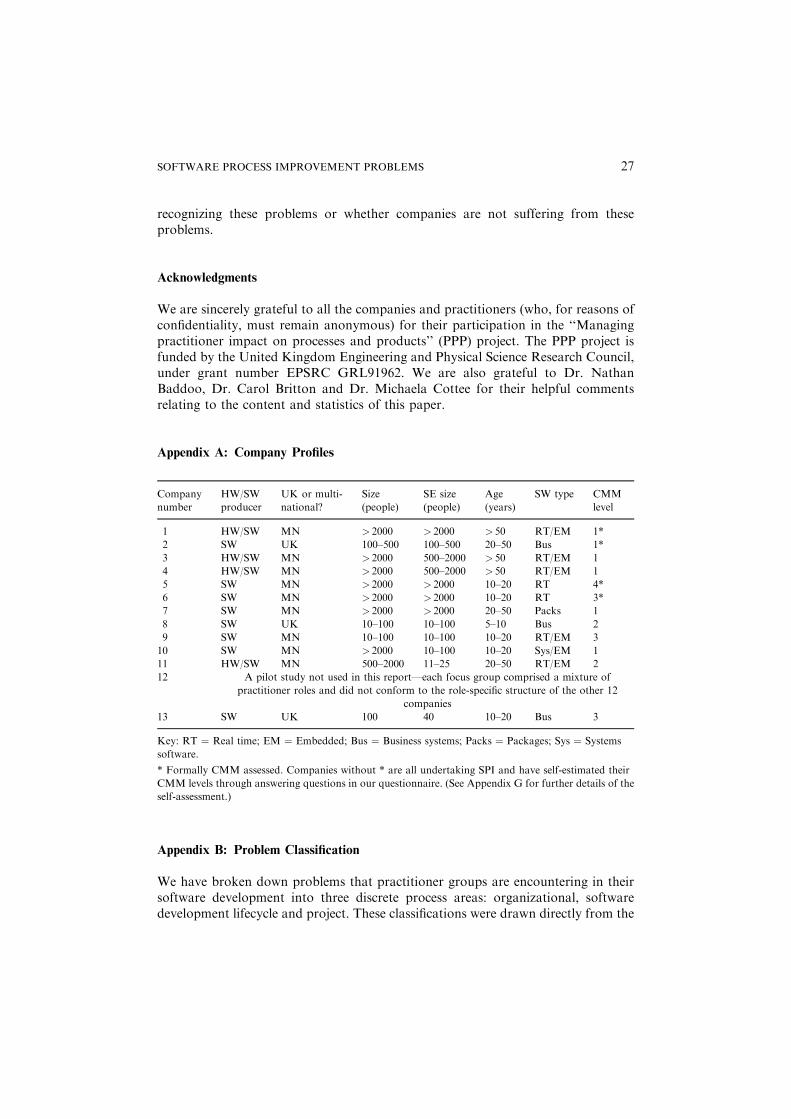
Appendix A: Company Profiles
Company
number
HW/SW
producer
UK or multi-
national?
Size
(people)
SE size
(people)
Age
(years)
SW type CMM
level
1 HW/SW MN > 2000 > 2000 > 50 RT/EM 1*
2 SW UK 100–500 100–500 20–50 Bus 1*
3 HW/SW MN > 2000 500–2000 > 50 RT/EM 1
4 HW/SW MN > 2000 500–2000 > 50 RT/EM 1
5 SW MN > 2000 > 2000 10–20 RT 4*
6 SW MN > 2000 > 2000 10–20 RT 3*
7 SW MN > 2000 > 2000 20–50 Packs 1
8 SW UK 10–100 10–100 5–10 Bus 2
9 SW MN 10–100 10–100 10–20 RT/EM 3
10 SW MN > 2000 10–100 10–20 Sys/EM 1
11 HW/SW MN 500–2000 11–25 20–50 RT/EM 2
12 A pilot study not used in this report—each focus group comprised a mixture of
practitioner roles and did not conform to the role-specific structure of the other 12
companies
13 SW UK 100 40 10–20 Bus 3
Key: RT ¼ Real time; EM ¼ Embedded; Bus ¼ Business systems; Packs ¼ Packages; Sys ¼ Systems
software.
* Formally CMM assessed. Companies without * are all undertaking SPI and have self-estimated their
CMM levels through answering questions in our questionnaire. (See Appendix G for further details of the
self-assessment.)
Appendix B: Problem Classification
We have broken down problems that practitioner groups are encountering in theirsoftware development into three discrete process areas: organizational, softwaredevelopment lifecycle and project. These classifications were drawn directly from the
SOFTWARE PROCESS IMPROVEMENT PROBLEMS 27
focus group transcripts—all problems were given equal focus. They were not chosento link directly to key process areas in the CMM and as a result there are some areasthat are outside the scope of the SW-CMM.
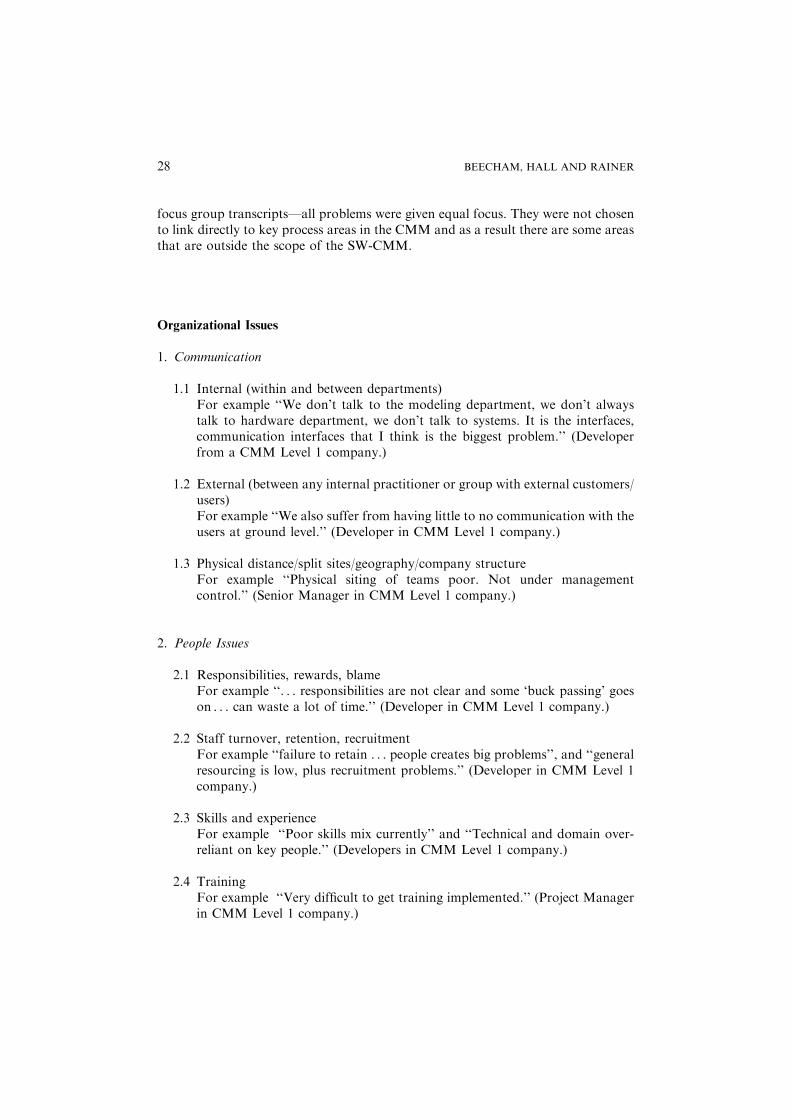
Organizational Issues
1. Communication
1.1 Internal (within and between departments)For example ‘‘We don’t talk to the modeling department, we don’t alwaystalk to hardware department, we don’t talk to systems. It is the interfaces,communication interfaces that I think is the biggest problem.’’ (Developerfrom a CMM Level 1 company.)
1.2 External (between any internal practitioner or group with external customers/users)For example ‘‘We also suffer from having little to no communication with theusers at ground level.’’ (Developer in CMM Level 1 company.)
1.3 Physical distance/split sites/geography/company structureFor example ‘‘Physical siting of teams poor. Not under managementcontrol.’’ (Senior Manager in CMM Level 1 company.)
2. People Issues
2.1 Responsibilities, rewards, blameFor example ‘‘. . . responsibilities are not clear and some ‘buck passing’ goeson . . . can waste a lot of time.’’ (Developer in CMM Level 1 company.)
2.2 Staff turnover, retention, recruitmentFor example ‘‘failure to retain . . . people creates big problems’’, and ‘‘generalresourcing is low, plus recruitment problems.’’ (Developer in CMM Level 1company.)
2.3 Skills and experienceFor example ‘‘Poor skills mix currently’’ and ‘‘Technical and domain over-reliant on key people.’’ (Developers in CMM Level 1 company.)
2.4 TrainingFor example ‘‘Very difficult to get training implemented.’’ (Project Managerin CMM Level 1 company.)
28 BEECHAM, HALL AND RAINER

3. PoliticsWhen a practitioner cites a ‘‘political’’ or external problems. For example ‘‘Issuesare driven by outside and finance senior managers. Especially because of financialmarket changes.’’ (Developer, level 1.) ‘‘Since the take-over, cost and benefitissues move to the forefront.’’ (Senior Manager, CMM Level 1.) ‘‘SoftwareManagers are now having to deal with political, commercial issues externally.’’(Senior Manager, CMM Level 4 company.)
4. CultureIngrained behavior, way of thinking or habit specific to a group or company.Includes trying to cultivate a desirable company culture and identifying a problemwith the existing culture. For example, ‘‘There are very big cultural differencesbetween here and other [sites] and we are very much driven by USA culture.Sometimes you see things come in that might be good for the particular country itcame from but it may not necessarily work here.’’ (Developer, CMM Level 4company.)
5. GoalsCompany goals and objectives. This includes setting, keeping, attaining,identifying, and communicating ‘‘goals’’. For example, ‘‘It suddenly became apoint that you had to do something in [the department] as one of your goals forthe year and if you didn’t you were a naughty person, with the result that peopleresented being forced into something.’’ (Developer, CMM Level 4 company.)
6. Change ManagementHow companies are coping with change and reorganization at any CMM level.For example ‘‘It is very difficult to show the benefits of change to people.’’(Developer in Level 1 company.) ‘‘Middle management tend to be a difficult areato adopt change, they tend to moan a lot about a need for change. But at a seniorlevel you have a strong desire to improve the process but in between there seemsto be more resistance to implement change.’’ (Senior Manager in CMM Level 1company.)
Software Development Lifecycle Issues
Companies vary in their use of software lifecycles. Whichever form is used (e.g.,waterfall, spiral, single prototype), the processes in our classification scheme arelikely to appear:
SOFTWARE PROCESS IMPROVEMENT PROBLEMS 29

1. RequirementsElicitation, specification/modeling, verification. Requirements problems areidentified as complex; vague/undefined; subject to growth/creep; poor userunderstanding; incomplete; lacking in traceability.
2. Design—correct, understandable, flexible, methods
3. Coding—consistent, documented/comments, traceable; reusable
4. Testing—scalable; measurable; reliable
5. Maintenance—patches, updates, bugs; defects; regression; release; reuse; faultfixing.
Project Issues
We have identified project-related issues as:
1. Budget and estimatesInvestment and resources, lack of funding for projects. We look at direct causes ofproblems; e.g. ‘‘we don’t have enough money to invest in new systems’’ comesunder budget, as it is a problem with investment. We cannot tell that a new systemwould help, all we know is that they cannot even test the possibility due to a lackof funding. Resources can cover finance, personnel and equipment.
2. DocumentationIncludes measurement data; written procedures; and problems of
a. co-ordination and management of documentation
b. feedback and post-mortems on documentation
c. data collection methods
3. QualityIncludes control problems and the tension between producing high qualityproducts within given timescales and how quality impacts other areas of softwaredevelopment. High quality requirements can take resources from other areas, e.g.SPI.
4. TimescalesCommitment to complete project within a certain time places pressure ondevelopers and project managers. Problems with timescales in projects impact SPI
30 BEECHAM, HALL AND RAINER
and quality. Inaccurate estimates for project timescales can place pressure ondevelopers. Tension between sales and developers.
5. Tools and technologyIncludes implementation of tools and new initiatives. SPI is seen as a tool forimproving software. For example, ‘‘A SPI initiative started in a company sometime ago got shot down in flames’’, is seen as a tools and technology problem. Thecategory includes productivity/volume of work/pressures that inhibit the use ofnew tools, e.g. ‘‘we have a problem keeping up to date with the generation oflanguages’’ (we cannot tell whether this is an investment or a training issue—allwe know is that they are having a problem with technology).
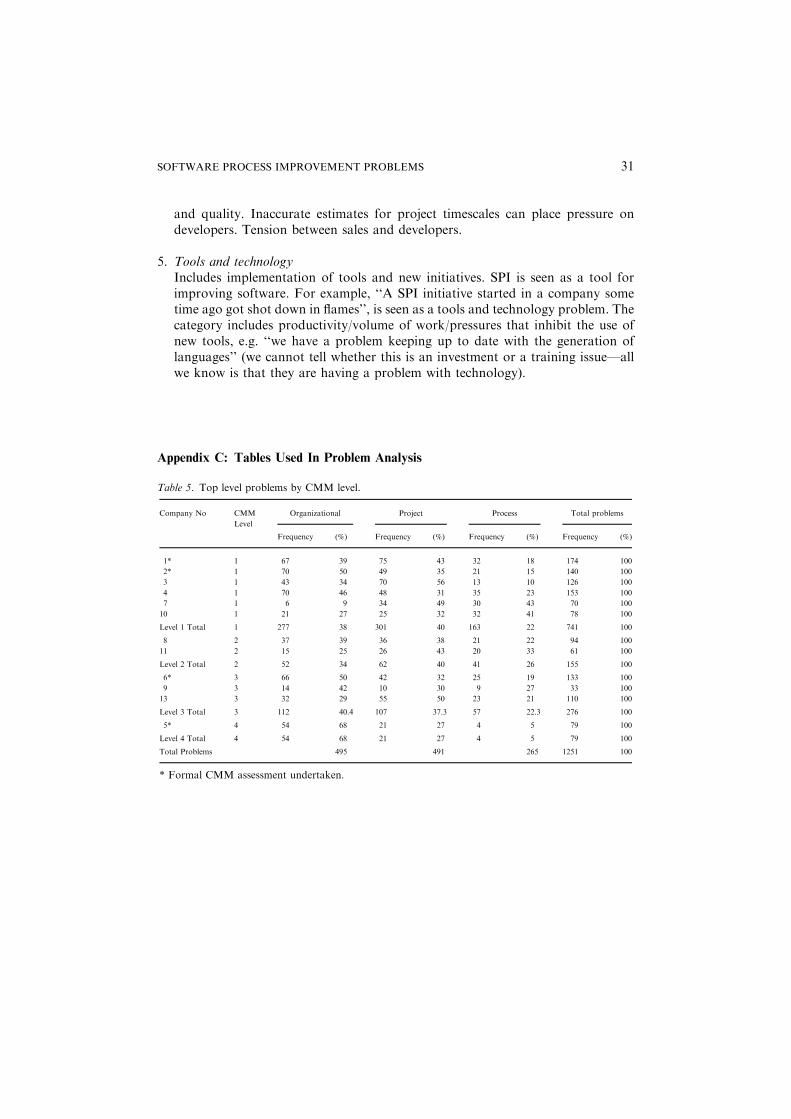
Appendix C: Tables Used In Problem Analysis
Table 5. Top level problems by CMM level.
Company No CMM
Level
Organizational Project Process Total problems
Frequency (%) Frequency (%) Frequency (%) Frequency (%)
1* 1 67 39 75 43 32 18 174 100
2* 1 70 50 49 35 21 15 140 100
3 1 43 34 70 56 13 10 126 100
4 1 70 46 48 31 35 23 153 100
7 1 6 9 34 49 30 43 70 100
10 1 21 27 25 32 32 41 78 100
Level 1 Total 1 277 38 301 40 163 22 741 100
8 2 37 39 36 38 21 22 94 100
11 2 15 25 26 43 20 33 61 100
Level 2 Total 2 52 34 62 40 41 26 155 100
6* 3 66 50 42 32 25 19 133 100
9 3 14 42 10 30 9 27 33 100
13 3 32 29 55 50 23 21 110 100
Level 3 Total 3 112 40.4 107 37.3 57 22.3 276 100
5* 4 54 68 21 27 4 5 79 100
Level 4 Total 4 54 68 21 27 4 5 79 100
Total Problems 495 491 265 1251 100
* Formal CMM assessment undertaken.
SOFTWARE PROCESS IMPROVEMENT PROBLEMS 31
Appendix D: Correspondence Analysis
Correspondence analysis (CA) is a multivariate statistical method used to explorecontingency table nominal data by converting nominal data counts into graphicaldisplays, called ‘‘maps’’ (Greenacre and Blasius, 1994). It is an exploratory techniquethat is used to reveal associations in the data. The process of checking assumptions isreplaced by a substantive graphical representation that forms the basis of thecorrespondence analysis maps.
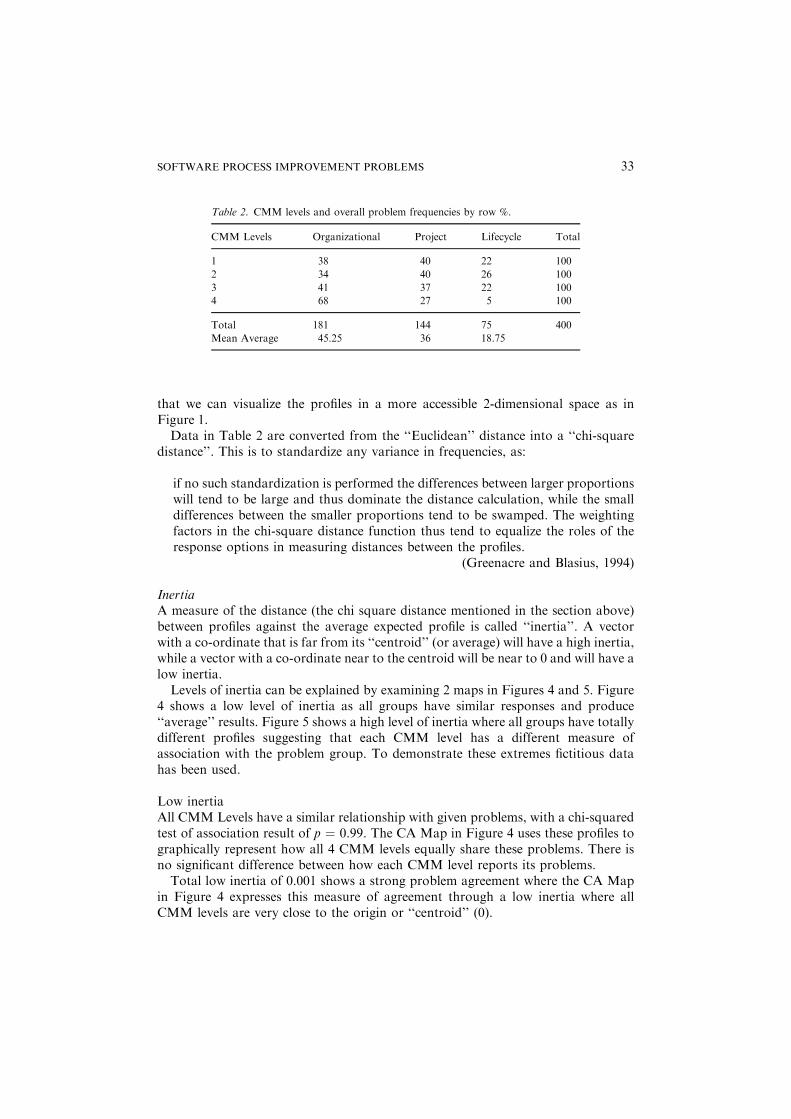
An example of how contingency tables are converted to CA maps:Table 2 is a two-way contingency table taken from the main body of the paper.
Frequencies have been converted to percentages to normalize the data (marginaltotals and mean averages have been added to aid understanding).
CA interprets the data by comparing the percentages against the mean average todraw associations between CMM levels. These percentages are examples ofmathematical vectors that have a geometric interpretation as they define points in amulti-dimensional space. In Table 2, for example, the elements of the first rowpercentages, 38, 40, 22 are used as co-ordinates. Each percentage is condensed into aunique point in this space and is called a ‘‘profile’’. The dimensionality is reduced so
Table 6. All companies / all problems by practitioner group in total frequency order.
Problems Practitioner groups Total
Dev (19 groups) PM (17 Groups) SM (9 Groups) (45 Practitioner Groups)
Frq % col % row Frq % col % row Frq % col % row Frq % col % row
Organizational issues
People 83 13 50 51 12 31 33 16 20 167 13 100
Communication 72 11 55 38 9 29 21 10 16 131 10 100
Change management 38 6 45 35 8 42 11 5 13 84 7 100
Culture 22 4 48 14 3 30 10 5 22 46 4 100
Goals 18 3 46 10 2 26 11 5 28 39 3 100
Politics 14 2 50 5 1 18 9 4 32 28 2 100
Organizational total 247 39 50 153 37 31 95 46 19 495 40 100
Project issues
Tools/technology 82 13 55 49 12 33 19 9 13 150 12 100
Documentation 76 12 53 48 11 34 19 9 13 143 11 100
Budget/estimates 33 5 34 44 11 45 20 10 21 97 8 100
Timescales 23 4 37 31 7 49 9 4 14 63 5 100
Quality 16 3 42 13 3 34 9 4 24 38 3 100
Project Total 230 37 47 185 44 38 76 37 15 491 39 100
SD lifecycle process
Requirements 71 11 55 39 9 30 20 10 15 130 10 100
Testing 39 6 62 14 3 22 10 5 16 63 5 100
Maintenance 18 3 51 15 4 43 2 1 6 35 3 100
Design 17 3 81 4 1 19 0 - 0 21 2 100
Coding 6 1 38 8 2 50 2 1 13 16 1 100
SD Lifecycle Total 151 24 57 80 19 30 34 17 13 265 21 100
Total 628 100 50 418 100 33 205 100 16 1251 100 100
32 BEECHAM, HALL AND RAINER
that we can visualize the profiles in a more accessible 2-dimensional space as inFigure 1.
Data in Table 2 are converted from the ‘‘Euclidean’’ distance into a ‘‘chi-squaredistance’’. This is to standardize any variance in frequencies, as:
if no such standardization is performed the differences between larger proportionswill tend to be large and thus dominate the distance calculation, while the smalldifferences between the smaller proportions tend to be swamped. The weightingfactors in the chi-square distance function thus tend to equalize the roles of theresponse options in measuring distances between the profiles.
(Greenacre and Blasius, 1994)
InertiaA measure of the distance (the chi square distance mentioned in the section above)between profiles against the average expected profile is called ‘‘inertia’’. A vectorwith a co-ordinate that is far from its ‘‘centroid’’ (or average) will have a high inertia,while a vector with a co-ordinate near to the centroid will be near to 0 and will have alow inertia.
Levels of inertia can be explained by examining 2 maps in Figures 4 and 5. Figure4 shows a low level of inertia as all groups have similar responses and produce‘‘average’’ results. Figure 5 shows a high level of inertia where all groups have totallydifferent profiles suggesting that each CMM level has a different measure ofassociation with the problem group. To demonstrate these extremes fictitious datahas been used.
Low inertiaAll CMM Levels have a similar relationship with given problems, with a chi-squaredtest of association result of p ¼ 0.99. The CA Map in Figure 4 uses these profiles tographically represent how all 4 CMM levels equally share these problems. There isno significant difference between how each CMM level reports its problems.
Total low inertia of 0.001 shows a strong problem agreement where the CA Mapin Figure 4 expresses this measure of agreement through a low inertia where allCMM levels are very close to the origin or ‘‘centroid’’ (0).
Table 2. CMM levels and overall problem frequencies by row %.
CMM Levels Organizational Project Lifecycle Total
1 38 40 22 100
2 34 40 26 100
3 41 37 22 100
4 68 27 5 100
Total 181 144 75 400
Mean Average 45.25 36 18.75
SOFTWARE PROCESS IMPROVEMENT PROBLEMS 33

High inertiaThe fictitious row percentages presented in Table 8 show that CMM Levels 1, 2, 3and 4 place different importance on each given problem. Figure 5 graphicallydisplays this extreme polarization of profiles with a total inertia close to itsmaximum. Each CMM Level has a very strong relationship with one particular
Figure 4. Low inertia: CMM level vectors graphically display agreement.
Figure 5. High inertia: CMM level vectors graphically display polarization.
34 BEECHAM, HALL AND RAINER
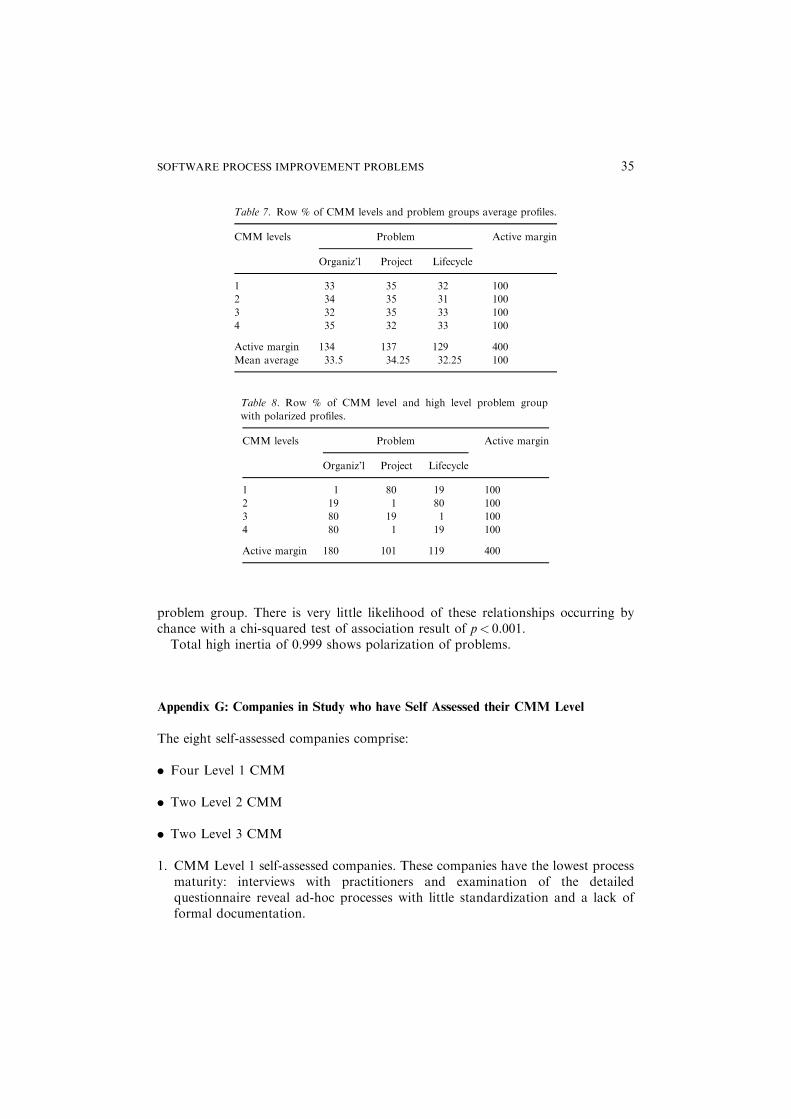
problem group. There is very little likelihood of these relationships occurring bychance with a chi-squared test of association result of p< 0.001.
Total high inertia of 0.999 shows polarization of problems.
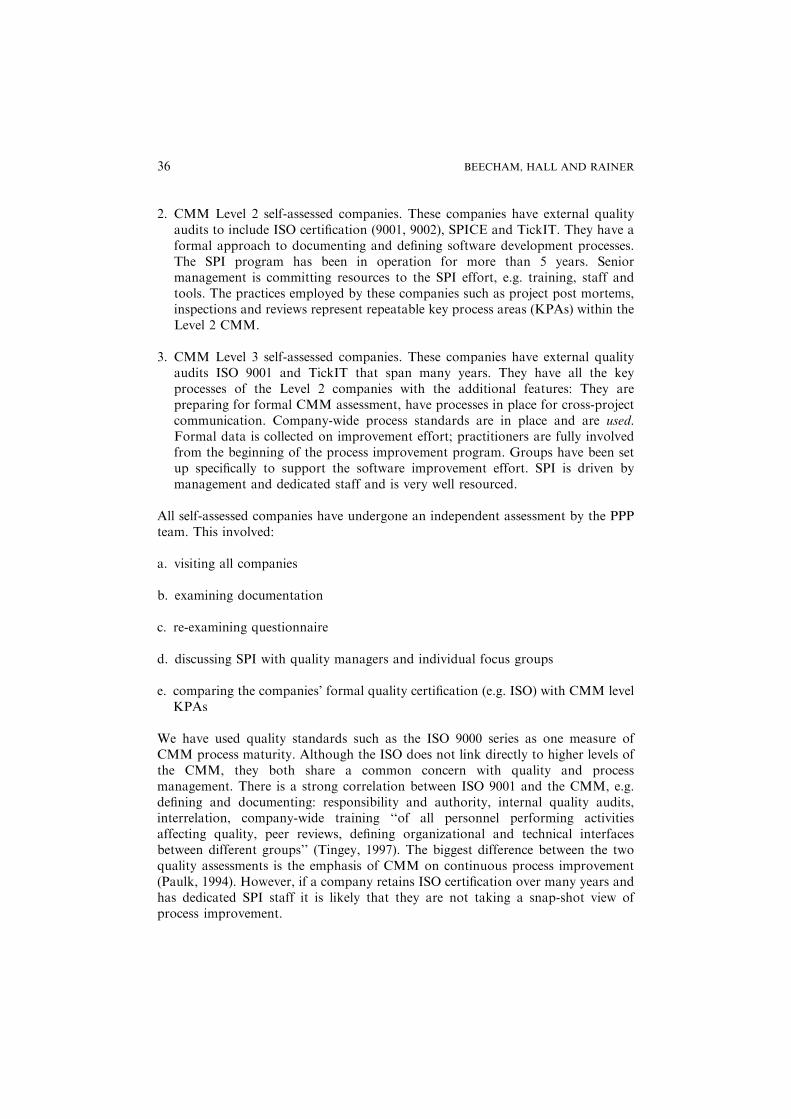
Appendix G: Companies in Study who have Self Assessed their CMM Level
The eight self-assessed companies comprise:
. Four Level 1 CMM
. Two Level 2 CMM
. Two Level 3 CMM
1. CMM Level 1 self-assessed companies. These companies have the lowest processmaturity: interviews with practitioners and examination of the detailedquestionnaire reveal ad-hoc processes with little standardization and a lack offormal documentation.
Table 7. Row % of CMM levels and problem groups average profiles.
CMM levels Problem Active margin
Organiz’l Project Lifecycle
1 33 35 32 100
2 34 35 31 100
3 32 35 33 100
4 35 32 33 100
Active margin 134 137 129 400
Mean average 33.5 34.25 32.25 100
Table 8. Row % of CMM level and high level problem group
with polarized profiles.
CMM levels Problem Active margin
Organiz’l Project Lifecycle
1 1 80 19 100
2 19 1 80 100
3 80 19 1 100
4 80 1 19 100
Active margin 180 101 119 400
SOFTWARE PROCESS IMPROVEMENT PROBLEMS 35
2. CMM Level 2 self-assessed companies. These companies have external qualityaudits to include ISO certification (9001, 9002), SPICE and TickIT. They have aformal approach to documenting and defining software development processes.The SPI program has been in operation for more than 5 years. Seniormanagement is committing resources to the SPI effort, e.g. training, staff andtools. The practices employed by these companies such as project post mortems,inspections and reviews represent repeatable key process areas (KPAs) within theLevel 2 CMM.
3. CMM Level 3 self-assessed companies. These companies have external qualityaudits ISO 9001 and TickIT that span many years. They have all the keyprocesses of the Level 2 companies with the additional features: They arepreparing for formal CMM assessment, have processes in place for cross-projectcommunication. Company-wide process standards are in place and are used.Formal data is collected on improvement effort; practitioners are fully involvedfrom the beginning of the process improvement program. Groups have been setup specifically to support the software improvement effort. SPI is driven bymanagement and dedicated staff and is very well resourced.
All self-assessed companies have undergone an independent assessment by the PPPteam. This involved:
a. visiting all companies
b. examining documentation
c. re-examining questionnaire
d. discussing SPI with quality managers and individual focus groups
e. comparing the companies’ formal quality certification (e.g. ISO) with CMM levelKPAs
We have used quality standards such as the ISO 9000 series as one measure ofCMM process maturity. Although the ISO does not link directly to higher levels ofthe CMM, they both share a common concern with quality and processmanagement. There is a strong correlation between ISO 9001 and the CMM, e.g.defining and documenting: responsibility and authority, internal quality audits,interrelation, company-wide training ‘‘of all personnel performing activitiesaffecting quality, peer reviews, defining organizational and technical interfacesbetween different groups’’ (Tingey, 1997). The biggest difference between the twoquality assessments is the emphasis of CMM on continuous process improvement(Paulk, 1994). However, if a company retains ISO certification over many years andhas dedicated SPI staff it is likely that they are not taking a snap-shot view ofprocess improvement.
36 BEECHAM, HALL AND RAINER
An organization that is ISO 9001 compliant has significant process strengths atLevel 2 and noticeable strengths at Level 3. There is also a suggestion that if acompany retains ISO certification over a period of time its processes become morepredictable as they mature. If an organization is following ‘‘the spirit of ISO 9001’’ itseems probable the organization would be near or above Level 2 (Paulk, 1994).
While it is difficult to prove that a company is following ‘‘the spirit’’ of ISO 9001,our mix of quantitative and qualitative data gathering supports the levels attributedto the companies. Company profiles are given to show formal certification andpractices of the four companies who have self-assessed their process maturity to beabove the ad-hoc CMM Level 1:
Level 2 Self-Estimated Company Profiles
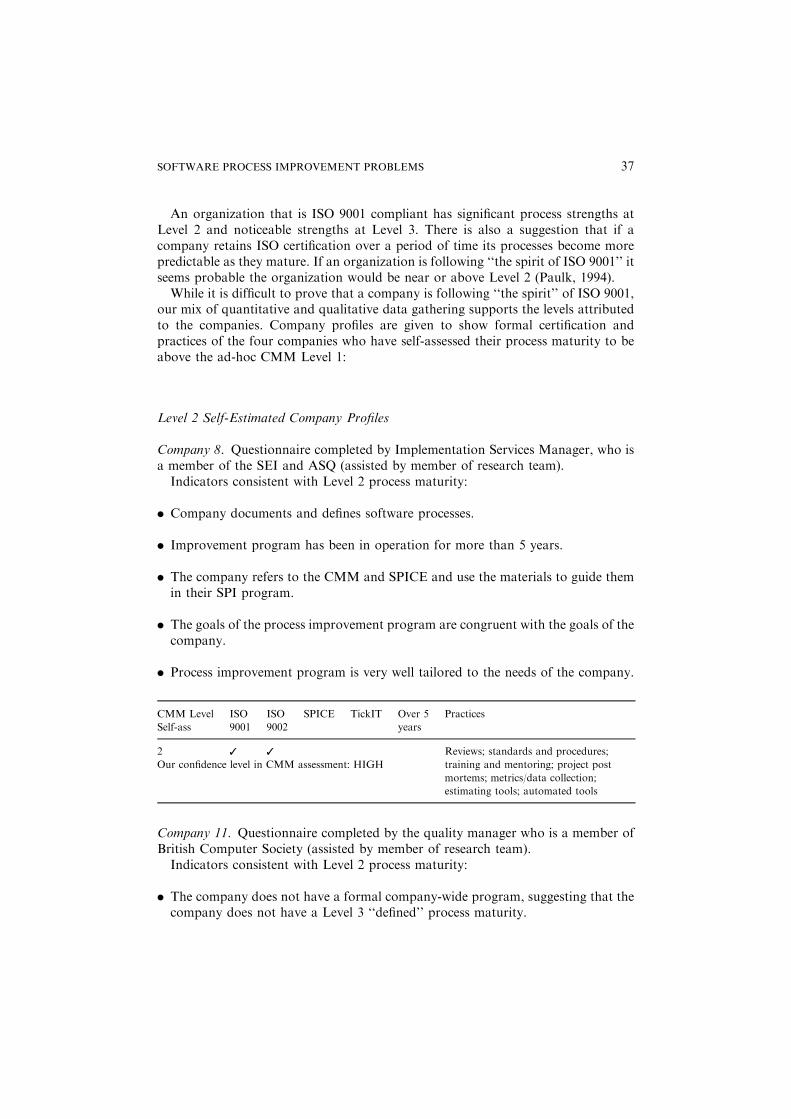
Company 8. Questionnaire completed by Implementation Services Manager, who isa member of the SEI and ASQ (assisted by member of research team).
Indicators consistent with Level 2 process maturity:
. Company documents and defines software processes.
. Improvement program has been in operation for more than 5 years.
. The company refers to the CMM and SPICE and use the materials to guide themin their SPI program.
. The goals of the process improvement program are congruent with the goals of thecompany.
. Process improvement program is very well tailored to the needs of the company.
CMM Level
Self-ass
ISO
9001
ISO
9002
SPICE TickIT Over 5
years
Practices
2 [ [ Reviews; standards and procedures;
training and mentoring; project post
mortems; metrics/data collection;
estimating tools; automated tools
Our confidence level in CMM assessment: HIGH
Company 11. Questionnaire completed by the quality manager who is a member ofBritish Computer Society (assisted by member of research team).
Indicators consistent with Level 2 process maturity:
. The company does not have a formal company-wide program, suggesting that thecompany does not have a Level 3 ‘‘defined’’ process maturity.
SOFTWARE PROCESS IMPROVEMENT PROBLEMS 37
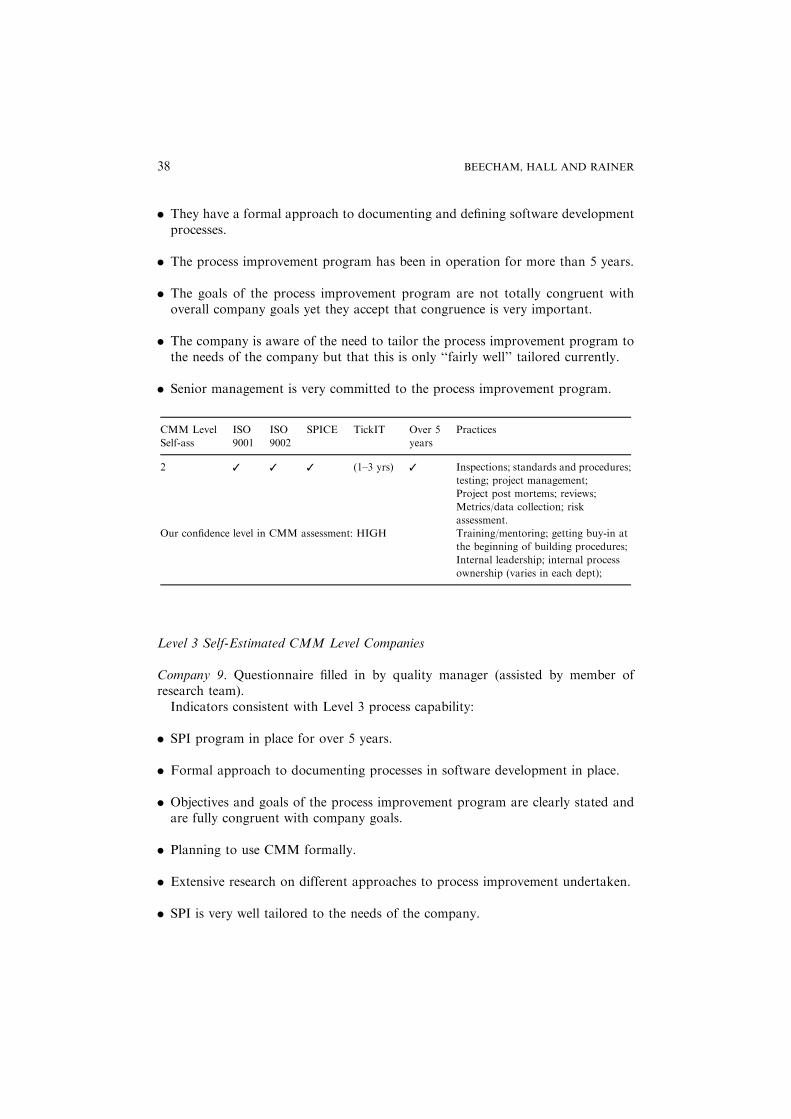
. They have a formal approach to documenting and defining software developmentprocesses.
. The process improvement program has been in operation for more than 5 years.
. The goals of the process improvement program are not totally congruent withoverall company goals yet they accept that congruence is very important.
. The company is aware of the need to tailor the process improvement program tothe needs of the company but that this is only ‘‘fairly well’’ tailored currently.
. Senior management is very committed to the process improvement program.
CMM Level
Self-ass
ISO
9001
ISO
9002
SPICE TickIT Over 5
years
Practices
2 [ [ [ (1–3 yrs) [ Inspections; standards and procedures;
testing; project management;
Project post mortems; reviews;
Metrics/data collection; risk
assessment.
Our confidence level in CMM assessment: HIGH Training/mentoring; getting buy-in at
the beginning of building procedures;
Internal leadership; internal process
ownership (varies in each dept);
Level 3 Self-Estimated CMM Level Companies
Company 9. Questionnaire filled in by quality manager (assisted by member ofresearch team).
Indicators consistent with Level 3 process capability:
. SPI program in place for over 5 years.
. Formal approach to documenting processes in software development in place.
. Objectives and goals of the process improvement program are clearly stated andare fully congruent with company goals.
. Planning to use CMM formally.
. Extensive research on different approaches to process improvement undertaken.
. SPI is very well tailored to the needs of the company.
38 BEECHAM, HALL AND RAINER
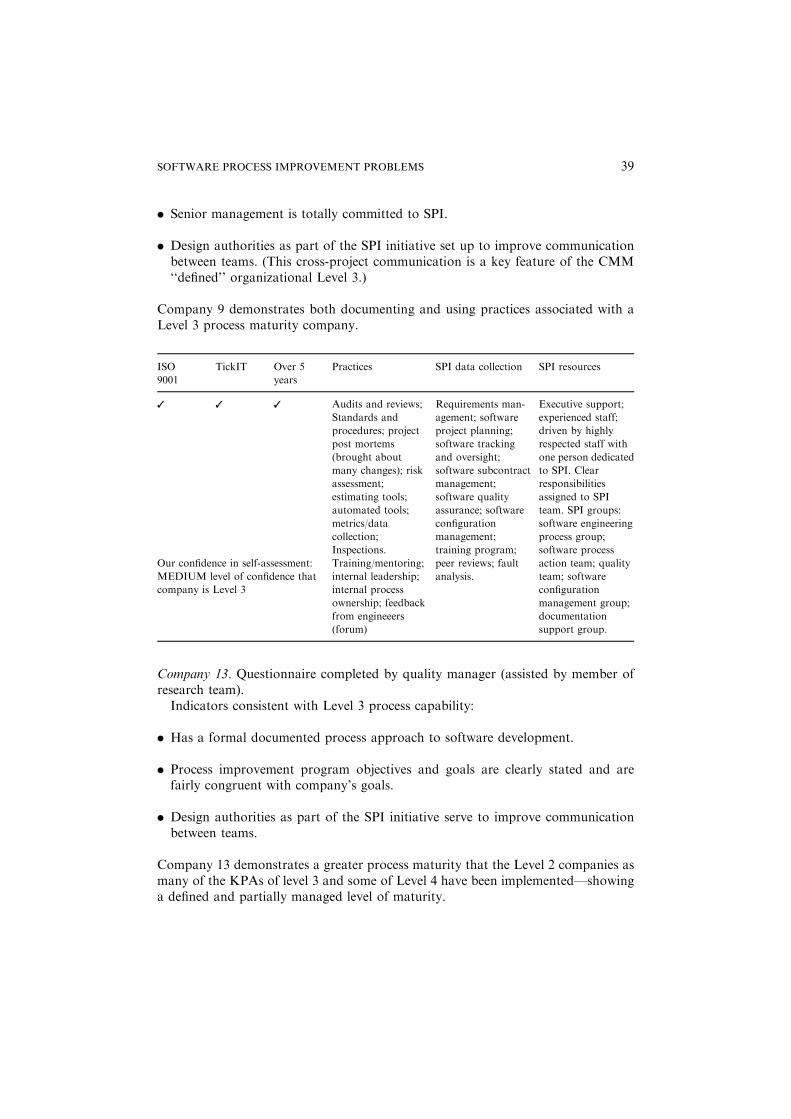
. Senior management is totally committed to SPI.
. Design authorities as part of the SPI initiative set up to improve communicationbetween teams. (This cross-project communication is a key feature of the CMM‘‘defined’’ organizational Level 3.)
Company 9 demonstrates both documenting and using practices associated with aLevel 3 process maturity company.
ISO
9001
TickIT Over 5
years
Practices SPI data collection SPI resources
[ [ [ Audits and reviews;
Standards and
procedures; project
post mortems
(brought about
many changes); risk
assessment;
estimating tools;
automated tools;
metrics/data
collection;
Inspections.
Requirements man-
agement; software
project planning;
software tracking
and oversight;
software subcontract
management;
software quality
assurance; software
configuration
management;
training program;
peer reviews; fault
analysis.
Executive support;
experienced staff;
driven by highly
respected staff with
one person dedicated
to SPI. Clear
responsibilities
assigned to SPI
team. SPI groups:
software engineering
process group;
software process
action team; quality
team; software
configuration
management group;
documentation
support group.
Our confidence in self-assessment: Training/mentoring;
internal leadership;
internal process
ownership; feedback
from engineeers
(forum)
MEDIUM level of confidence that
company is Level 3
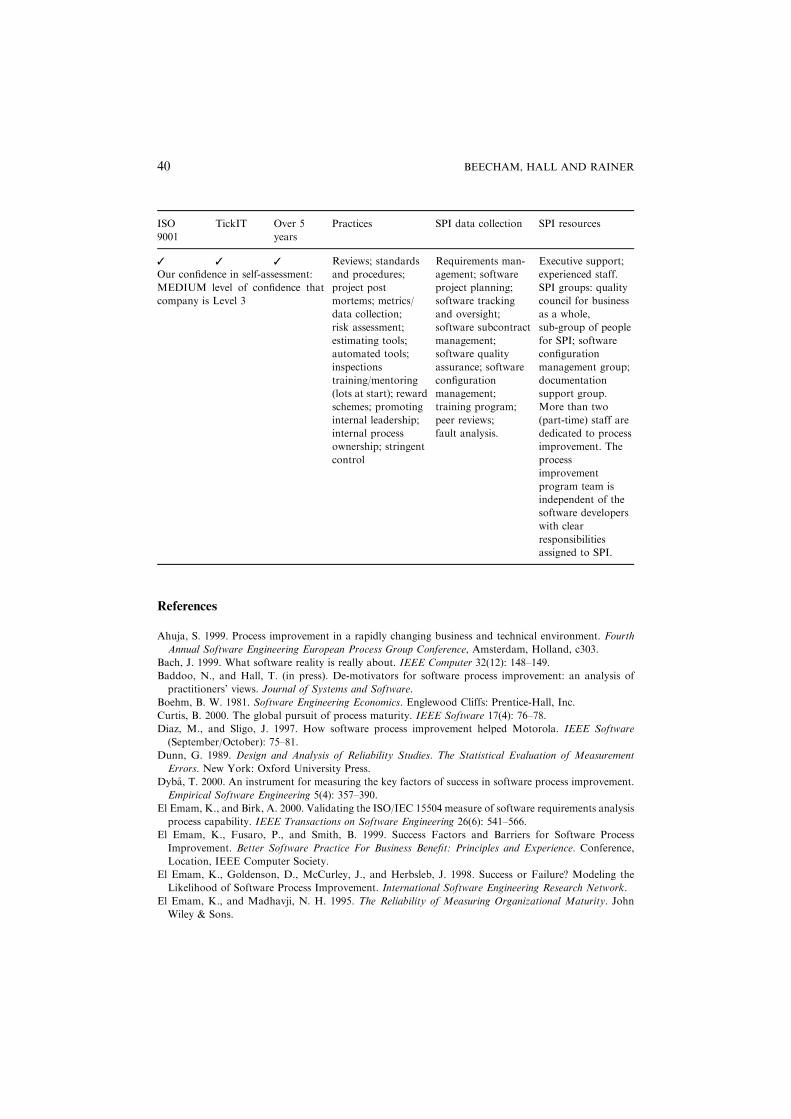
Company 13. Questionnaire completed by quality manager (assisted by member ofresearch team).
Indicators consistent with Level 3 process capability:
. Has a formal documented process approach to software development.
. Process improvement program objectives and goals are clearly stated and arefairly congruent with company’s goals.
. Design authorities as part of the SPI initiative serve to improve communicationbetween teams.
Company 13 demonstrates a greater process maturity that the Level 2 companies asmany of the KPAs of level 3 and some of Level 4 have been implemented—showinga defined and partially managed level of maturity.
SOFTWARE PROCESS IMPROVEMENT PROBLEMS 39
ISO
9001
TickIT Over 5
years
Practices SPI data collection SPI resources
[ [ [ Reviews; standards
and procedures;
project post
mortems; metrics/
data collection;
risk assessment;
estimating tools;
automated tools;
inspections
training/mentoring
(lots at start); reward
schemes; promoting
internal leadership;
internal process
ownership; stringent
control
Requirements man-
agement; software
project planning;
software tracking
and oversight;
software subcontract
management;
software quality
assurance; software
configuration
management;
training program;
peer reviews;
fault analysis.
Executive support;
experienced staff.
SPI groups: quality
council for business
as a whole,
sub-group of people
for SPI; software
configuration
management group;
documentation
support group.
More than two
(part-time) staff are
dedicated to process
improvement. The
process
improvement
program team is
independent of the
software developers
with clear
responsibilities
assigned to SPI.
Our confidence in self-assessment:
MEDIUM level of confidence that
company is Level 3
References
Ahuja, S. 1999. Process improvement in a rapidly changing business and technical environment. Fourth
Annual Software Engineering European Process Group Conference, Amsterdam, Holland, c303.
Bach, J. 1999. What software reality is really about. IEEE Computer 32(12): 148–149.
Baddoo, N., and Hall, T. (in press). De-motivators for software process improvement: an analysis of
practitioners’ views. Journal of Systems and Software.
Boehm, B. W. 1981. Software Engineering Economics. Englewood Cliffs: Prentice-Hall, Inc.
Curtis, B. 2000. The global pursuit of process maturity. IEEE Software 17(4): 76–78.
Diaz, M., and Sligo, J. 1997. How software process improvement helped Motorola. IEEE Software
(September/October): 75–81.
Dunn, G. 1989. Design and Analysis of Reliability Studies. The Statistical Evaluation of Measurement
Errors. New York: Oxford University Press.
Dyba, T. 2000. An instrument for measuring the key factors of success in software process improvement.
Empirical Software Engineering 5(4): 357–390.
El Emam, K., and Birk, A. 2000. Validating the ISO/IEC 15504 measure of software requirements analysis
process capability. IEEE Transactions on Software Engineering 26(6): 541–566.
El Emam, K., Fusaro, P., and Smith, B. 1999. Success Factors and Barriers for Software Process
Improvement. Better Software Practice For Business Benefit: Principles and Experience. Conference,
Location, IEEE Computer Society.
El Emam, K., Goldenson, D., McCurley, J., and Herbsleb, J. 1998. Success or Failure? Modeling the
Likelihood of Software Process Improvement. International Software Engineering Research Network.
El Emam, K., and Madhavji, N. H. 1995. The Reliability of Measuring Organizational Maturity. John
Wiley & Sons.
40 BEECHAM, HALL AND RAINER
El Emam, K., and Briand, L. 1999. Costs and benefits of software process improvement. In: R. Messnarz
and C. Tully (eds): Better Software Practice for Business Benefits: Principles and Experience, Los
Alamitos, IEEE CS Press, Chapter 16.
Fordham, R. G. 1999. Software Process Maturity: Is level five enough? 21st International Conference on
Software Engineering, May, Los Angeles, California.
Greenacre, M., and Blasius, B. 1994. Correspondence Analysis in the Social Sciences. Recent Developments
and Applications. London: Academic Press Ltd.
Hall, T., Beecham, S., and Rainer, A. 2002. Requirements Problems in Twelve Companies: An Empirical
Analysis. IEE Proceedings for Software, October, 149(5): 153–160.
Hayes, W., and Zubrow, D. 1995. Moving on Up: Data and Experience Doing CMM-Based Process
Improvement. Carnegie Mellon University, Pittsburgh. CMU/SEI-95-TR-008.
Herbsleb, J. D., Carleton, A., Rozum, J., Siegel, J., and Zubrow, D. 1994. Benefits Of CMM-Based
Software Process Improvement: Initial Results. SEI Technical Report, CMU/SEI-94-TR-013.
Herbsleb, J. D., and Goldenson, D. R. 1996. A systematic survey of CMM experience and results. 18th
International Conference on Software Engineering, Berlin, Germany, March, pp. 323–330.
Horvat, R. V., Rozman, I., and Gyorkos, J. 2000. Managing the complexity of SPI in small companies.
Software Process: Improvement and Practice 5(1): 45–54.
Humphrey, W. S. 1989. Managing the Software Process. Reading, MA, USA: Addison-Wesley Publishing
Company, Inc.
Humphrey, W. S., Kitson, D. H., and Kasse, C. 1989. The State of Software Engineering Practice: A
Preliminary Report. 11th International Conference on Software Engineering, Pittsburg, PA, pp. 277–288.
Kitchenham, B. A., Hughes, R. T., and Linkman, S. G. 2001. Modeling software measurement data. IEEE
Transactions on Software Engineering 27(9): 788–804.
Krasner, H. 1997. Accumulating the Body of Evidence for the Payoff of Software Process Improvement.
In http://www.utexas.edu/coe/sqi/archive/krasner/spi.pdf—May 1999.
Krippendorff, K. 1980. Content Analysis: An Introduction to Its Methodology. Beverly Hills: Sage
Publications.
Krueger, R. A., and Casey, M. A. 2000. Focus Groups: A Practical Guide For Applied Research. Sage
Publications.
Mellis, W. 1998. Software quality managment in turbulent times—are there alternatives to process
oriented software quality management? Software Quality Journal 7(3/4): 277–295.
Moitra, D. 1998. Managing change for software process improvement initiatives: a practical experience-
based approach. Software Process—Improvement and Practice 4(4): 199–207.
Morgan, D. L. 1997. Focus Groups as Qualitative Research (2nd ed.): Sage Publications.
Morgan, D. L., and Krueger, R. A. 1993. When to use focus groups and why. In D. L. Morgan (ed.),
Successful Focus Groups: Advancing the State of the Art. Newbury Park, CA: Sage.
Paulk, M. C. 1994. A Comparison of ISO 9001 and the Capability Maturity Model for Software. Carnegie
Mellon University, CMU/SEI-94-TR-12.
Paulk, M. C., and Chrissis, M. B. 2000. The November 1999 High Maturity Workshop. Software
Engineering Institute,
Paulk, M. C., Weber, C. V., Curtis, B., and Chrissis, M. B. 1995. The Capability Maturity Model:
Guidelines for Improving the Software Process. Reading, MA: Addison Wesley Longman, Inc.
Pitterman, B. 2000. Telcordia technologies: The journey to high maturity. IEEE Software 17(4): 89–96.
Rainer, A., and Hall, T. 2002. A quantitative and qualitative analysis of factors affecting SPI. Journal of
Systems and Software.
Sommerville, I., and Sawyer, P. 1997. Requirements Engineering A good practice guide. Chichester: John
Wiley & Sons Ltd.
Stelzer, D., and Mellis, W. 1998. Success factors of organizational change in software process
improvement. Software Process—Improvement and Practice 4(4): 227–250.
Tingey, M. O. 1997. Comparing ISO 9000, Malcolm Baldrige and the SEI CMM for Software. A reference
and section guide. Upper Saddle River: Prentice Hall PTR.
Vogt, W. P. 1999. Dictionary of Statistics and Methodology (2nd ed.): Sage Publications.
SOFTWARE PROCESS IMPROVEMENT PROBLEMS 41
Willis, R. R., Rova, R. M., Scott, M. D., Johnson, M. I., Ryskowski, J. F., Moon, J. A., Shumate, K. C.,
and Winfield, T. O. 1998. Hughes Aircraft’s Widespread Deployment of a Continuously Improving
Software Process. Software Engineering Institute, Carnegie Mellon University, Technical Report CMU/
SEI-98-TR-006. URL www.sei.cmu.edu/pub/documents/98.reports/pdf/98tr006.pdf, accessed October
2002.
Sarah Beecham is a researcher and part-time lecturer in the Department of Computer Science at the
University of Hertfordshire. She joined the EPSRC funded PPP project in October 2000 when she began
her doctoral program under the supervision of Dr. Tracy Hall at the University of Hertfordshire. She
received a first class honours degree in Business Information Systems from Anglia Polytechnic University
in 1996. Her PhD is based on an analysis of software process improvement and examining how the SEI’s
CMM supports the requirements process. She is planning to submit her thesis during 2003. Work
experience includes a management and marketing role at the University of East Anglia, and editorial work
for the British Film Institute. Current research interests are in the general areas of software quality and
software process improvement. Her particular research interests are in empirical methods in software
engineering and requirements engineering. Findings from her doctoral research have contributed to a
number of journal publications and conference proceedings.
Tracy Hall is currently Principal Lecturer in the Department of Computer Science at the University of
Hertfordshire. Previously she was Head of the Centre for Systems and Software Engineering at South
Bank University. She has published widely in the area of software quality and measurement. Following
BA and MSc degrees she was awarded her PhD from City University.
Austen Rainer is currently a lecturer in the Department of Computer Science at the University of
Hertfordshire. He received a BSc (Hons) in Applied Psychology and Computing from Bournemouth
University and, subsequently, a PhD in Software Engineering Management in collaboration with IBM
Hursley Park. He has previously worked in the software industry.
42 BEECHAM, HALL AND RAINER