Embed Size (px)
Citation preview
Software Process Improvement Problems in Twelve Software Companies:
An Empirical Analysis
Sarah Beecham, Tracy Hall & Austen Rainer
Department of Computer Science, University of Hertfordshire
<s.beecham, t.hall, a.w.rainer>@herts.ac.uk
Abstract In this paper we discuss our study of the problems 12 software companies experienced in software development. In total we present qualitative data collected from 45 focus groups that involved over 200 software staff. We look at how different practitioner groups respond to software process improvement problems. We show our classification and analysis of this data using a graphical data representation method new to software development research. The aim of the work we present is to develop a more holistic understanding of the problems practitioners are experiencing in their attempts to improve their software processes. Our main finding is that there is an association between companies’ maturity and patterns of reported problems. Organisational problems are more associated with high maturity companies than with low maturity companies. Low maturity companies are closely linked to problems relating directly to projects such as quality, timescales, tools and technology. Senior managers cite problems with goals, culture and politics. Project managers are concerned with timescales, change management, budgets and estimates. Developers are experiencing problems with requirements, testing, documentation, communication, tools and technology. These associations are graphically displayed through the use of correspondence analysis maps. Keywords: software process improvement, Capability Maturity Model, practitioners, organisation, project, software lifecycle, empirical study 1. Introduction Identifying problems is an essential element in all software process improvement. Sommerville and Sawyer [1], for example, state that the first question that a company should ask is: “What are the problems with our current processes?” El Emam et al believe ”it is important to understand the enabling and the inhibiting factors involved in SPI, particularly those that management can control” [5]. Many companies are using the Capability Maturity Model (CMM) as a basis for improving their software processes [2]. Numerous studies report on the positive and negative factors that impact Software Process Improvement (SPI) (e.g. [3-7]), but few if any of these studies relate problems occurring within the process to the company’s current or targeted CMM Level. Because identifying and resolving problems is essential, and because of the lack of previous research relating problems to CMM maturity levels, we have conducted a study to investigate whether companies at different levels of maturity report different kinds of problems. We also believe that different types of practitioners have different perspectives on the process, and that effective SPI should involve all types of staff [8]. Dyba, for example, says that management “must integrate the crucial people processes with the overall strategy” [9]. To produce workable SPI strategies and gain a common understanding of company goals all staff should be involved [8]. Bach emphasises the importance of this unified approach, “whatever your defined processes, if you don't know how to work together your processes are not being followed” [10].Therefore, we have also investigated whether different types of practitioners report different kinds of problems. We present data collected from three types of practitioners at 12 software development companies. The three types of practitioners are developers, project managers and senior managers. The companies range from CMM Level 1 to CMM Level 4. In total, we conducted 45 focus groups with these three types of practitioners, with each focus group consisting of between 4 and 6 practitioners. In total, the 45 focus groups involved over 200 members of staff.
SCB/Problem Paper 21/11/01 1/21
Previous studies recognise that further work is needed to investigate how companies can improve their processes [4-6]. Within the CMM, strengths and weaknesses in the current process are assessed according to Key Process Areas (KPAs). Our maturity-based and practitioner-based analysis pinpoint where problems are occurring. The ‘location’ of these problems could be related to Key Process Areas. The identification of where problems are occurring should help practitioners to better understand both what to improve and how to improve. This, in turn, should help companies to both improve their processes and reduce the time it takes to improve these processes. The remainder of this paper is organised as follows. In Section 2 of the paper we discuss how our study complements existing work in the field. We describe our study methods and our case study companies in Section 3. We present our main findings in Section 4 and discuss the implications of these findings in Section Five. We draw some conclusions and summarise our findings in Section 6. 2. Background to SPI problems In this section we discuss the literature background and context in which SPI problems have been analysed. 2.1 The Capability Maturity Model as a model of SPI We are interested in CMM levels as they are linked to process capability. In a similar study to our own, El Emam et al's results show a correlation between higher maturity and meeting schedules, meeting budgets, improving quality, improving productivity; improving customer satisfaction; improving staff morale [5]. El Emam et al's more recent study confirms other desirable maturity features where high process capability is found to be associated with better project estimation and performance [11]. All companies in our study have formally or informally assessed their process capabilities in accordance with the CMM (see company profiles in Appendix A). Although the CMM is one of many software process improvement models [12], it is increasingly considered the de facto standard [13]. The CMM follows an assessment methodology that provides a way for companies to identify the areas for improvement in an organization’s software process [14]. While high level companies report the benefits of successful process improvement programs [15], our recent study reveals that not all companies derive a competitive advantage when attempting to apply this improvement model [16]. Moitra comments that this can be attributed to,
“the failure of organisations to clearly understand the crucial role of software processes in their operations. ..[Organisations tend to focus on the software process alone] "ignoring the more important people processes [9]
Paulk acknowledges that although the CMM directly addresses the human dimension only in training, it is not, “outside the scope of management responsibility or outside the scope of organizational needs” [2]. He adds that an effective process can empower people to work more effectively. Boehm found that it was only when a system was structured from both a human and technical perspective that a well programmed system resulted satisfying all operational goals” [17]. Technical areas may be overlooked as, "in low maturity organisations, technical issues almost never appear at the top of key priority issue lists. These problems take time to rectify as so many management problems must be handled first" [18]. It is not that technical issues are unimportant as relationships between technical efficiency and social considerations are paramount to the success of any business [19]. According to Humphrey the technical or ‘project’ issues in low maturity companies are being subsumed by the organisational needs identified by management. In our recent study of SPI de-motivators across staff groups, a suggestion is made that senior managers lack awareness of developer and project manager de-motivators [20]. We suggest that this weakness has financial implications as
"poor management can increase software costs more rapidly than any other factor" [17] The CMM focuses on the capability of software organizations to produce high-quality products consistently and predictably. The software process maturity level is ‘the extent to which a specific process is explicitly defined, managed, measured, controlled and effective’ [2, p.9]. In practice, the level of maturity indicates how successful a company has been in their software process improvement. Maturity is expressed in terms of meeting KPA objectives. Although each maturity level has its own KPAs, similarities in level 2 and 3 companies are noted in a study of CMM-based process improvement [21] where movement up from level 2
SCB/Problem Paper 21/11/01 2/21
to level 3 is easier/faster than from 1 to 2, or 3 to 4. [MUST LOOK AT ‘moving up’ PAPER TO FIND OUT WHETHER MOVING FROM 3 to 4 is the most difficult – this is what the CA is suggesting later in discussion]. We recognise these stages of development by identifying problems within the context of maturity levels. Our research question 1 links companies to their CMM levels in order to examine whether individual maturity levels are concerned with specific software development problems. Research question 1: Are different software development problems associated with CMM maturity levels? 2.2 SPI Stakeholders Improving software processes is not the province of any one particular practitioner group. Although management commitment and support is needed from all levels of the company [22-26], the buy-in of the technical community is also necessary [5, 7, 23, 27]. As Sommerville and Sawyer recognise,
“Effective process improvement cannot be achieved by management instruction” [1].
Previous work suggests that all people involved in software processes must be actively committed to their company’s improvement goals and must be included in the practical implementation of process change [22, 28]. Stelzer and Mellis [8] warn that unless companies openly involve staff at all stages during implementation of improvement programmes, investment and best efforts are wasted. In our study the problems cited by three practitioner groups (senior managers, project managers and developers) are examined separately to gain a staff perspective of SPI issues [29]. To achieve synergy necessitates actively looking for points of disagreement [30]. Indeed, Horvat et al suggest that “the success of SPI projects depends on the acceptance of its goals and tasks by every single employee, therefore human, social and cultural factors should be considered within SPI plans” [31]. It is therefore of practical use to highlight similarities and differences in problems practitioners are experiencing in their software improvement programmes. For example a previous SPI study highlights a problem employees are having with documentation:
“Documentation of the process and project documentation improve the quality of the process and of the developed products, but at the same time they represent a significant burden on the employees” [31].
Developing an understanding of the problems associated with each role will help companies achieve a more open approach to SPI. Our research question 2 looks at whether the three practitioner groups in our study have different problems with SPI. Research question 2: Do developers, project managers and senior managers have different problems with SPI?
3. Methodology 3.1 Focus groups We used focus groups as our main approach to collecting data. Focus groups are a well-documented technique in the social sciences [32]. They involve assembling small groups of peers to discuss particular topics. Discussion is largely free flowing, but is directed by a researcher allowing soft, or qualitative, issues to be explored. Indeed focus groups have been described as "a way to better understand how people feel and think about an issue" [33]. The focus group data elicited a rich set of staff perceptions that would not have been recorded if left to questionnaires or individual interviews. Focus groups also elicit data that allows a better understanding of the differences between groups of people [33]. Also, Morgan and Krueger say that ‘the comparisons participants make among each other’s experiences and opinions are a valuable source of insight into complex behaviours and motivations” [34]. Focus groups are, therefore, an ideal vehicle for exploring the problems different CMM level companies and different staff groups are experiencing with their SPI programmes.
SCB/Problem Paper 21/11/01 3/21
Table 1 Focus groups by staff group Company Senior
Managers Project Managers
Developers
1 1 2 2 2 1 1 2 3 1 3 2 4 1 3 2 5 1 1 1 6 0 1 2 7 1 1 0 8 1 1 1 9 1 0 2
10 1 2 2 11 0 1 1 12 Data not used as groups do not conform 13 0 1 2
Total 9 17 19 We conducted multiple project manager and developer focus groups at 8 out of the 12 companies (Table 1). This reflects the fact that these 8 companies were considerably larger than the other 4 (see company profiles Appendix A). Furthermore, Table 1 shows that for logistical reasons we were unable to assemble a group of senior managers at 3 companies. Company 9 operates a flat company structure where there are no middle management or project management roles. Technical difficulties prevented us from using data from the developer group in Company 7. (Company 12 data has been omitted as the focus groups did not adhere to specific staff groups used in this study, it is also a level 1 company and therefore well represented.) 3.2 Implementing focus groups From September 1999 to March 2000 we visited 13 software companies and conducted 49 focus groups. This study, however, uses data collected from 12 of these companies. Appendix A provides an overview of the 12 companies in our study of SPI problems. Participating companies were selected from a larger sample of companies who responded to a detailed questionnaire giving broad information about their software development activities and company demographics. The 13 companies were chosen to provide our research project with a cross-section of company maturity levels, software applications and company sizes. Each focus group lasted approximately 90 minutes and included between 4 to 6 participants. Based on our previous experiences of using focus groups [29] we separated senior managers, project managers and developers into separate focus groups. The 12 participating companies represented in this paper comprise 45 focus groups: • 19 developer focus groups • 17 project manager focus groups • 9 senior manager focus groups Participants were guaranteed anonymity and all data has been anonymised. Each session was audio-tape recorded and recordings were subsequently transcribed. 3.3 Companies in the study A company characteristic we are particularly interested in is process maturity. In comparison to the US, few UK companies have so far been formally CMM assessed and so it is no surprise that only 4 of our companies have been. To overcome this we emulated Herbsleb and Goldenson [5] and asked the other 8 companies to estimate their CMM level via a questionnaire. Our sample contains 6 companies at the lowest CMM level (level 1). An estimated 70% of all software companies remain at this level – indeed Paulk and Chrissis refer to 44 level 4 organisations and 27 level 5 organisations in the world in their survey of high maturity organisations (though say there may be more) [35].
SCB/Problem Paper 21/11/01 4/21
3.4 Qualitative Data Analysis In order to investigate problems companies were experiencing in their SPI programmes, we asked each focus group, What are the problems and issues in software development in your company? What are the obstacles to SPI in your company? We used the broad principles of content analysis [36] in each focus group discussion to develop problem categories by placing emphasis on the meaning, the interpretation and the intentions of the data, as offered by practitioners [36]. Clusters of software development problems were identified. We categorised each problem according to the following scheme: • Organizational issues (e.g. skills, culture, goals, communication, staff retention). • Project issues (e.g. documentation, measurement, quality, timescales, tools). • Software Development Lifecycle issues (e.g. requirements, testing). Appendix B provides definitions and examples of the 3 categories. 3.5 Protocol Analysis and validation Below is a fuller explanation of the analysis procedure. We used a 2-stage approach to analyze and validate the data. First we conducted a formal reliability test, using the results from 2 different researchers. Second, with confidence in our classification scheme, we drew up contingency tables based on reliable problem frequencies. Stage 1 A manual protocol analysis was performed on practitioner responses to researcher questions on problems and obstacles to SPI. All problems cited by each practitioner group are identified. This list of all the problems was then organised into problem groups (Appendix B). We produced clear definitions of these problem groups (Appendix B), as in any data analysis the definition must be ‘useful, simple and direct’ [37]. By providing similar levels of granularity and clear detailed definitions we aim to “assemble trustworthy collections of software data from different sources” [37]. We conducted an inter-rater reliability test to increase confidence in this identification process: - 2 researchers are involved in the analysis. Researcher 1 develops the scale and performs an initial
analysis – identifying problem groups and problem frequencies. Researcher 2 validates the analysis through an objective analysis.
- Researcher 1 selects a subset of quotes from the transcripts and gives them to researcher 2.
Researcher 2 places the quotes into given categories. These 82 quotes represent a subset of the 16 problem areas covered in our study.
- To test for researcher bias and subjectivity [38] a Cohen’s kappa inter-rater reliability test is
performed. Cohen’s kappa measure of agreement between the evaluations of the 2 raters is positive: 82 valid cases gives a significance of k 0.71 [39, 40].
Stage 2 - A matrix is constructed, mapping all 16 problem-groups cited to each company, CMM level and
practitioner group. A total of 1253 problems are cited. Contingency tables are drawn up based on the frequencies of problems within each group of interest.
3.6 Frequency Data Analysis We are interested in whether there are significant associations between a) problems and CMM Levels (Research Question 1) b) problems and Staff Groups (Research Question 2)
SCB/Problem Paper 21/11/01 5/21
We have used correspondence analysis to graphically display the relationship between the nominal variables in our contingency tables [41]. This exploratory technique ‘describes’ rather than ‘analyses’ the data. It builds on the Pearson chi square independence test, revealing the dependence structure of nominal variables by providing a ‘measure’ of association. It describes the relationships ‘within’ each variable (e.g. how practitioner groups relate to each other in how they perceive problems), as well as the relationship ‘between’ the variables (e.g. how each practitioner group relates to each problem group). Plots on a map represent variables and their proximity to each other provides a measure of association. The closer a variable lies to the origin ‘0’, the more ‘normal’ its behaviour. A variable’s distance from this origin is explained through levels of ‘inertia’ (Appendix D). If all problems were given equal focus across groups the inertia would be small. Alternatively, if problems are polarised, the profile points are more dispersed and the inertia values will increase accordingly [41]. 3.7 Limitations of the study • Sample size
In this study we present detailed data collected from 12 software companies. Although the data provides interesting insights into the problems encountered in these companies, it is not appropriate to generalise from this sample; e.g. there is only one company representing CMM level 4. Ideally, we should have both more case studies (to accumulate evidence) and repeatable and controlled experiments (to determine the underlying causal factors) before we can consider our results definitive. However our data should provide the SD industry with some thought-provoking ideas and the research community with some potential start-points for further study in the area of SPI problem recognition.
• Inconsistent group sizes Although at each company we tried to assemble focus groups representing all 3 staff groups, at 3 companies we were unable to gain access to a group of senior managers. The ‘flat’ organisational structure of company 9 did not provide a project management tier and data from the developer group in company 7 has not been transcribed due to technical problems. These omissions together with conducting multiple developer and project manager focus groups at 8 of the 12 companies could, if left uncorrected, skew the data. So, to allow direct comparison between groups of different sizes, data has been normalised and converted to percentages [41].
• Problem generalisation It is likely that each company has individual and possibly unique problems. Our assertion that the problems cited in this paper are relevant to all companies wanting to improve their software processes could therefore appear misguided. We acknowledge that companies are likely to vary in where their process problems lie and how they approach improving them. However, as the companies in our project were chosen specifically to provide a cross-section of company maturity levels, software applications, company sizes and project sizes, lessons can be learnt from our findings.
• Problem status
Finally, we make no comment on the importance of individual problems cited. For our analysis every SPI process problem mentioned in a focus group has equal importance. Clearly in the commercial world some problems are more important than others.
4. Analysis of results 4.1 CMM Level Problem Association Research question 1: Are different software development problems associated with CMM maturity levels? Frequencies of all reported problems representing 45 focus groups have been converted to percentages to allow comparison (Table 2). These percentages have been used to create a correspondence analysis map showing relationships between CMM levels 1 – 4, and problem groups ‘Organisational’, ‘Project’ and ‘Software Development Lifecycle’ (see Figure 1). For contingency table showing problem frequencies of all 12 companies by CMM level see table 5 in Appendix C.
SCB/Problem Paper 21/11/01 6/21
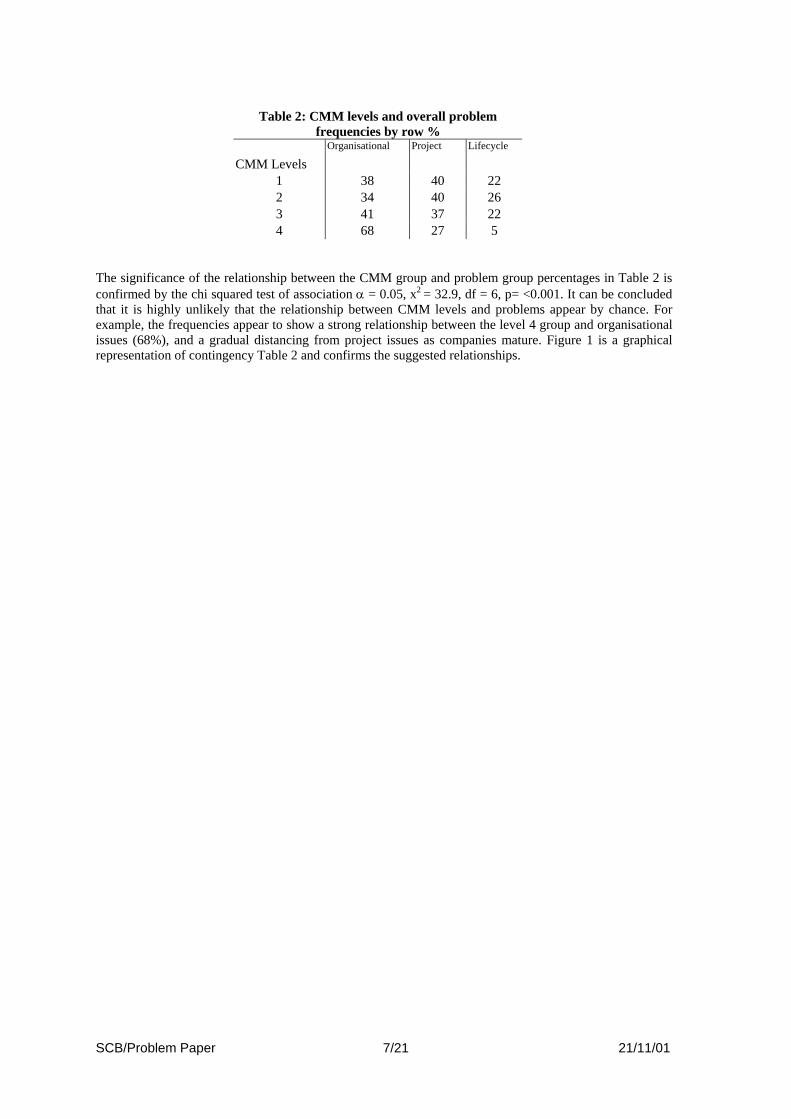
Table 2: CMM levels and overall problem frequencies by row %
Organisational Project Lifecycle
CMM Levels 1 38 40 22 2 34 40 26 3 41 37 22 4 68 27 5
The significance of the relationship between the CMM group and problem group percentages in Table 2 is confirmed by the chi squared test of association α = 0.05, x2 = 32.9, df = 6, p= <0.001. It can be concluded that it is highly unlikely that the relationship between CMM levels and problems appear by chance. For example, the frequencies appear to show a strong relationship between the level 4 group and organisational issues (68%), and a gradual distancing from project issues as companies mature. Figure 1 is a graphical representation of contingency Table 2 and confirms the suggested relationships.
SCB/Problem Paper 21/11/01 7/21
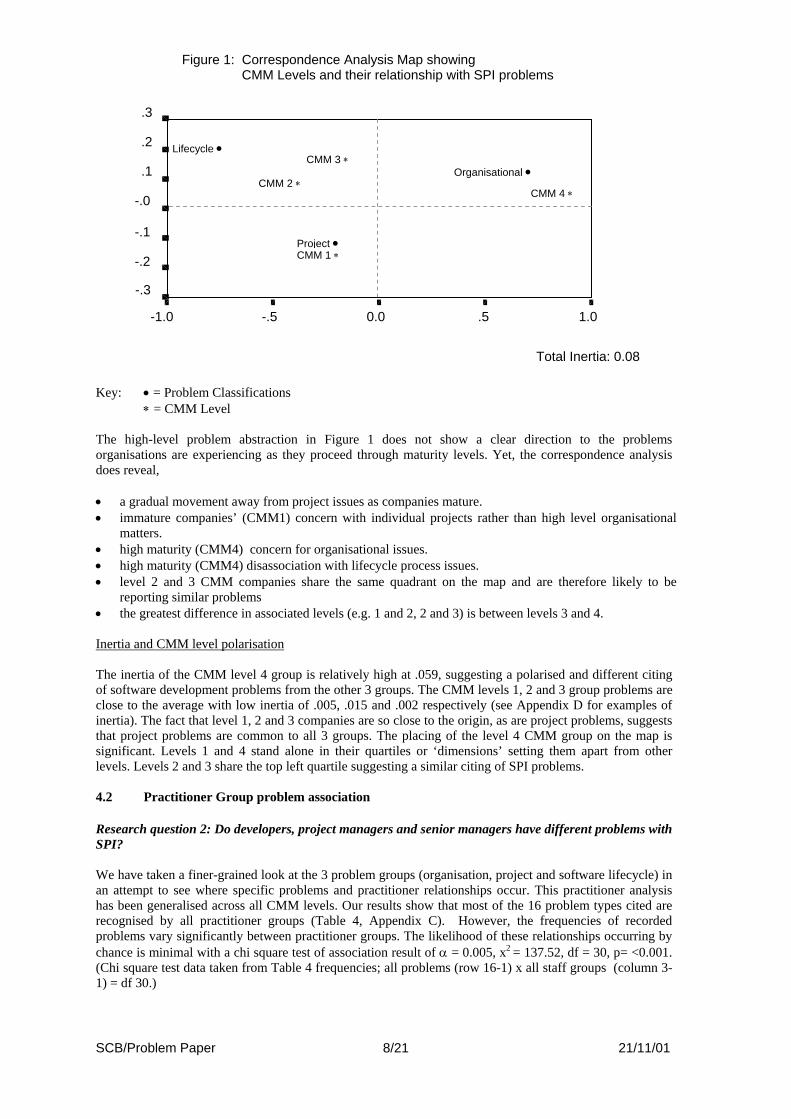
Figure 1: Correspondence Analysis Map showing CMM Levels and their relationship with SPI problems
.3 Lifecycle •
Project •
Organisational •
CMM 4 ∗
CMM 3 ∗
CMM 1 ∗
CMM 2 ∗
.2
.1
-.0
-.1 -.2
-.3 -1.0 -.5 0.0 .5 1.0
Total Inertia: 0.08 Key: • = Problem Classifications ∗ = CMM Level The high-level problem abstraction in Figure 1 does not show a clear direction to the problems organisations are experiencing as they proceed through maturity levels. Yet, the correspondence analysis does reveal, • a gradual movement away from project issues as companies mature. • immature companies’ (CMM1) concern with individual projects rather than high level organisational
matters. • high maturity (CMM4) concern for organisational issues. • high maturity (CMM4) disassociation with lifecycle process issues. • level 2 and 3 CMM companies share the same quadrant on the map and are therefore likely to be
reporting similar problems • the greatest difference in associated levels (e.g. 1 and 2, 2 and 3) is between levels 3 and 4. Inertia and CMM level polarisation The inertia of the CMM level 4 group is relatively high at .059, suggesting a polarised and different citing of software development problems from the other 3 groups. The CMM levels 1, 2 and 3 group problems are close to the average with low inertia of .005, .015 and .002 respectively (see Appendix D for examples of inertia). The fact that level 1, 2 and 3 companies are so close to the origin, as are project problems, suggests that project problems are common to all 3 groups. The placing of the level 4 CMM group on the map is significant. Levels 1 and 4 stand alone in their quartiles or ‘dimensions’ setting them apart from other levels. Levels 2 and 3 share the top left quartile suggesting a similar citing of SPI problems. 4.2 Practitioner Group problem association Research question 2: Do developers, project managers and senior managers have different problems with SPI? We have taken a finer-grained look at the 3 problem groups (organisation, project and software lifecycle) in an attempt to see where specific problems and practitioner relationships occur. This practitioner analysis has been generalised across all CMM levels. Our results show that most of the 16 problem types cited are recognised by all practitioner groups (Table 4, Appendix C). However, the frequencies of recorded problems vary significantly between practitioner groups. The likelihood of these relationships occurring by chance is minimal with a chi square test of association result of α = 0.005, x2 = 137.52, df = 30, p= <0.001. (Chi square test data taken from Table 4 frequencies; all problems (row 16-1) x all staff groups (column 3-1) = df 30.)
SCB/Problem Paper 21/11/01 8/21
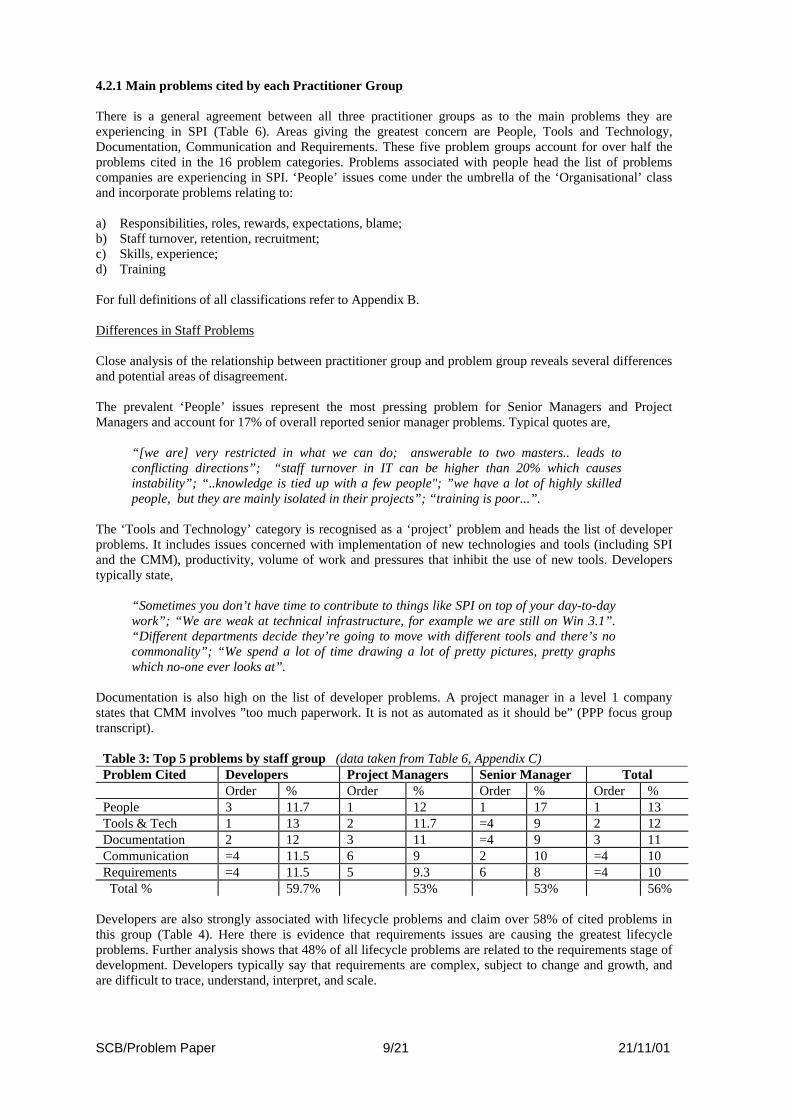
4.2.1 Main problems cited by each Practitioner Group There is a general agreement between all three practitioner groups as to the main problems they are experiencing in SPI (Table 6). Areas giving the greatest concern are People, Tools and Technology, Documentation, Communication and Requirements. These five problem groups account for over half the problems cited in the 16 problem categories. Problems associated with people head the list of problems companies are experiencing in SPI. ‘People’ issues come under the umbrella of the ‘Organisational’ class and incorporate problems relating to: a) Responsibilities, roles, rewards, expectations, blame; b) Staff turnover, retention, recruitment; c) Skills, experience; d) Training For full definitions of all classifications refer to Appendix B. Differences in Staff Problems Close analysis of the relationship between practitioner group and problem group reveals several differences and potential areas of disagreement. The prevalent ‘People’ issues represent the most pressing problem for Senior Managers and Project Managers and account for 17% of overall reported senior manager problems. Typical quotes are,
“[we are] very restricted in what we can do; answerable to two masters.. leads to conflicting directions”; “staff turnover in IT can be higher than 20% which causes instability”; “..knowledge is tied up with a few people"; ”we have a lot of highly skilled people, but they are mainly isolated in their projects”; “training is poor...”.
The ‘Tools and Technology’ category is recognised as a ‘project’ problem and heads the list of developer problems. It includes issues concerned with implementation of new technologies and tools (including SPI and the CMM), productivity, volume of work and pressures that inhibit the use of new tools. Developers typically state,
“Sometimes you don’t have time to contribute to things like SPI on top of your day-to-day work”; “We are weak at technical infrastructure, for example we are still on Win 3.1”. “Different departments decide they’re going to move with different tools and there’s no commonality”; “We spend a lot of time drawing a lot of pretty pictures, pretty graphs which no-one ever looks at”.
Documentation is also high on the list of developer problems. A project manager in a level 1 company states that CMM involves ”too much paperwork. It is not as automated as it should be” (PPP focus group transcript).
Table 3: Top 5 problems by staff group (data taken from Table 6, Appendix C) Problem Cited Developers Project Managers Senior Manager Total Order % Order % Order % Order % People 3 11.7 1 12 1 17 1 13 Tools & Tech 1 13 2 11.7 =4 9 2 12 Documentation 2 12 3 11 =4 9 3 11 Communication =4 11.5 6 9 2 10 =4 10 Requirements =4 11.5 5 9.3 6 8 =4 10 Total % 59.7% 53% 53% 56%
Developers are also strongly associated with lifecycle problems and claim over 58% of cited problems in this group (Table 4). Here there is evidence that requirements issues are causing the greatest lifecycle problems. Further analysis shows that 48% of all lifecycle problems are related to the requirements stage of development. Developers typically say that requirements are complex, subject to change and growth, and are difficult to trace, understand, interpret, and scale.
SCB/Problem Paper 21/11/01 9/21
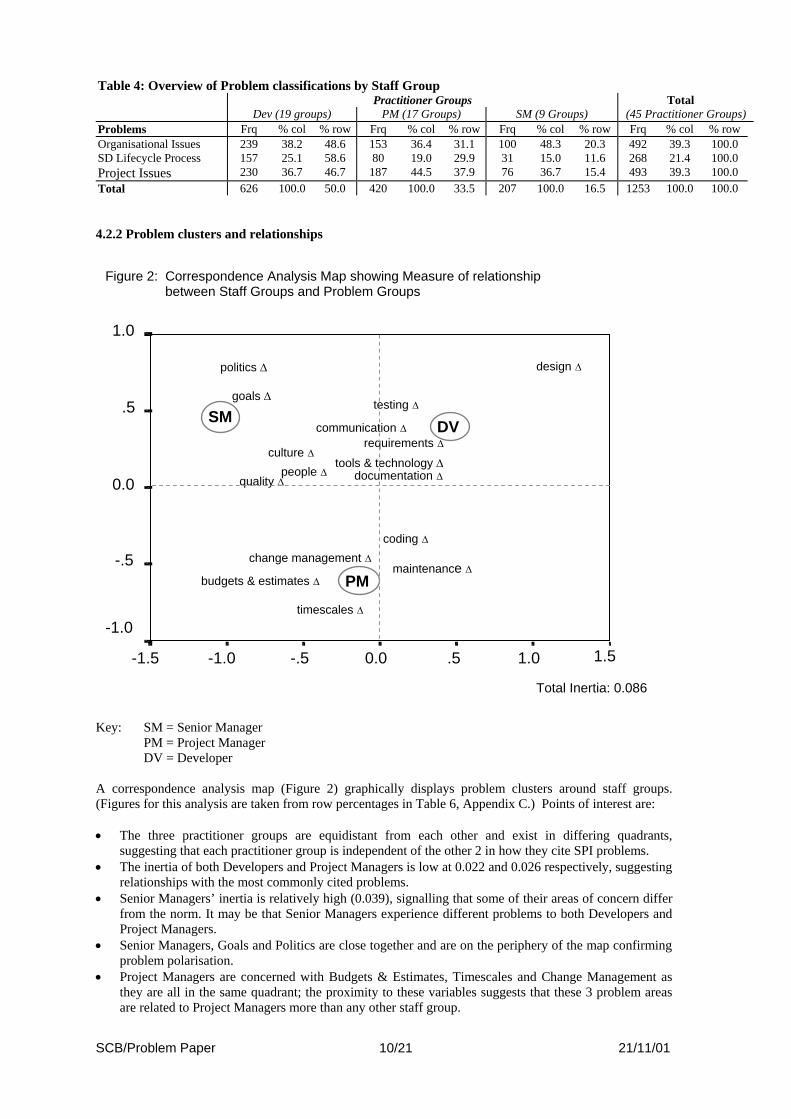
Table 4: Overview of Problem classifications by Staff Group Practitioner Groups Total Dev (19 groups) PM (17 Groups) SM (9 Groups) (45 Practitioner Groups) Problems Frq % col % row Frq % col % row Frq % col % row Frq % col % row Organisational Issues 239 38.2 48.6 153 36.4 31.1 100 48.3 20.3 492 39.3 100.0 SD Lifecycle Process 157 25.1 58.6 80 19.0 29.9 31 15.0 11.6 268 21.4 100.0 Project Issues 230 36.7 46.7 187 44.5 37.9 76 36.7 15.4 493 39.3 100.0 Total 626 100.0 50.0 420 100.0 33.5 207 100.0 16.5 1253 100.0 100.0 4.2.2 Problem clusters and relationships
Figure 2: Correspondence Analysis Map showing Measure of relationship between Staff Groups and Problem Groups
1.0
SM
PM
DV
design ∆
coding ∆
politics ∆
maintenance ∆
quality ∆
goals ∆
culture ∆
testing ∆
timescales ∆
change management ∆
budgets & estimates ∆
requirements ∆communication ∆
documentation ∆tools & technology ∆
people ∆
.5
0.0
-.5
-1.0
1.5 -1.5 -1.0 -.5 0.0 .5 1.0
Total Inertia: 0.086
Key: SM = Senior Manager PM = Project Manager DV = Developer A correspondence analysis map (Figure 2) graphically displays problem clusters around staff groups. (Figures for this analysis are taken from row percentages in Table 6, Appendix C.) Points of interest are: • The three practitioner groups are equidistant from each other and exist in differing quadrants,
suggesting that each practitioner group is independent of the other 2 in how they cite SPI problems. • The inertia of both Developers and Project Managers is low at 0.022 and 0.026 respectively, suggesting
relationships with the most commonly cited problems. • Senior Managers’ inertia is relatively high (0.039), signalling that some of their areas of concern differ
from the norm. It may be that Senior Managers experience different problems to both Developers and Project Managers.
• Senior Managers, Goals and Politics are close together and are on the periphery of the map confirming problem polarisation.
• Project Managers are concerned with Budgets & Estimates, Timescales and Change Management as they are all in the same quadrant; the proximity to these variables suggests that these 3 problem areas are related to Project Managers more than any other staff group.
SCB/Problem Paper 21/11/01 10/21
• Developers show most concern for Requirements, Communication, Tools and Technology,
Documentation and Testing. They are the only staff group showing any concern for design issues. 4.2.3 A shift in problem focus Documentation issues are preoccupying developers. This category includes co-ordination and management of documents, feedback and post mortems, and data collection methods. It is third on the list of project managers’ problems and fourth on the list of senior managers’ problems. There seems to be a subtle distancing from this problem in the company staff hierarchy. Developers report,
“There is no ownership of document production”; “There is no formal documentation”; “Documentation, we don’t have enough, from a support point of view”.
The same pattern of distancing from problems occurs in the case of requirements. Indeed, developers seem to have a better understanding of requirement process problems than project managers and senior managers. Developers involved in SPI report that requirements, tools and technology, and documentation problems are disrupting software development. There is little evidence that management is giving these areas the same focus. 5. Discussion Research question 1: Are different software development problems associated with CMM maturity levels? Our results suggest that there is an association between reported problems and CMM maturity. Low maturity companies focus on project and technical problems with high maturity companies focusing on organisational problems. Our findings on low maturity companies support the CMM's approach to SPI which guides such companies to focus on project issues and controls. It is not until CMM level 3 that organisational issues become a KPA. On the other hand, Dyba suggests that organisational issues are important to successfully introduce, deploy and institute recommended software engineering and management practices [9]. Our findings suggest that low maturity companies are not in a position to concern themselves with organisational issues. Probably because organisational issues are difficult to deal with and low maturity companies have more urgent technical and project problems. Our results related to high maturity companies probably means that such companies have solved most of their low level technical problems and are in a position to focus on organisational problems. Furthermore, our findings also suggest that high maturity companies recognise the importance of people within software development (people issues form a major part of our organisational category). However, many of the people issues reported in our results are outside the scope of the CMM. This may mean that companies are not getting enough support and guidance on the human issues in SPI. Moving from CMM level 1 to CMM level 2 is known to be the most difficult advancement. Our findings show that companies at levels 2 and 3 share similar process problems. This suggests that there is similarity in companies at these two levels. Furthermore, it may mean that once a company has moved beyond level 1, it is better prepared for the next process improvement stage. Research question 2: Do developers, project managers and senior managers have different problems with SPI? Our results show that developers, project managers and senior managers report different problems reflecting their varied experiences and roles. There is little evidence to suggest that any staff group identifies strongly with another staff group in how they experience SPI problems. Although this difference is to be expected, it could be argued that a problem for any individual staff group is a problem for the company as a whole.
SCB/Problem Paper 21/11/01 11/21
Our results suggest that senior management are isolated from the other two staff groups, with their problems focused around ‘goals’ and political influences. Although senior managers and project managers share a common concern for ‘people’ issues such as skills shortages, senior management are not necessarily aware of the issues directly affecting developers such as documentation, tools and technology, and requirements. Our findings suggest that senior management do not have a good understanding of the problems experienced by developers. This lack of understanding is likely to have a detrimental impact on senior managers' ability to design effective SPI implementation strategies. Our results also indicate that ‘tools and technology’ is the most pressing problem group for developers. This suggests that developers are very aware of the low level implementation issues associated with new initiatives. Again, it is important that managers understand developers' problems and experiences if successful SPI strategies are to be implemented. 6. Conclusion Our results will help people involved in SPI to better understand the importance of problem recognition. The content analysis approach to data gathering helped to group problems into logical categories. These categories allowed us to explore the relationships between problem and staff group, and problem and CMM level. We have shown the relative importance of these problems and the relevance of the most pressing problems. We have made a distinction between problem groups through clear definitions and comparisons. We have shown the problems companies are experiencing in their organisational, project and software development lifecycle processes. Concrete examples are given of typical problems occurring in software development companies. We develop this theme to highlight areas where problems are concentrated. Organisational issues are causing SPI companies the greatest problems. Within this group, there is a concentration of people and communication issues. It is the high-level maturity companies who are most aware of these problems, along with Senior Managers and Project Managers. Project issues are closely associated with low maturity companies. Developers have identified this area as problematic, they are struggling with documentation and tools and technology issues. Lifecycle problems are not evenly spread. High level companies do not consider this area of development to be a problem, but developers generally report lifecycle problems that relate to requirements closely followed by testing [42]. Senior managers and project managers do not share in this concern. Coding and design receive very little focus from practitioners in our study. We have highlighted areas that are perhaps overlooked in practice. Low CMM companies can possibly learn from the experiences of high-level maturity companies. All 3 problem-areas covered in this paper should be considered in SPI programmes as “organisational issues are at least as important as development processes”[43]. It could be that keeping a focus on organisational issues, helps ease problems in the other areas as shown by our level 4 CMM group. This high-maturity group are more focussed on organisational problems than on software lifecycle processes. The project and software development areas are likely to be dependent on the organisational framework of a company. All companies should therefore consider working towards creating
“a blend of technology, people and process to provide a balanced score card of activities that can address our goals more successfully – people overlooked or mis-used is the most critical resource in the equation” [43].
In order to achieve this ‘balance’ companies may need to examine where their problems are in organisational, project and lifecycle areas of development. We have shown that there is inter-dependence between these software development areas. It could be that individual project and lifecycle problems need to be controlled to allow companies to recognize and deal with organisational issues. When all staff groups share in a common understanding and recognition of software development problems they can start looking at how to improve them, and in turn, improve their software processes.
Acknowledgements
We are sincerely grateful to all the companies and practitioners (who, for reasons of confidentiality, must remain anonymous) for their participation in the PPP project. The PPP project is funded by the UK’s Engineering and Physical Science Research Council, under grant number EPSRC GRL91962. We are also grateful to Nathan Baddoo for his suggestions during the initial stages of analysing the data.
SCB/Problem Paper 21/11/01 12/21

SCB/Problem Paper 21/11/01 13/21
Bibliography 1. Sommerville, I. and P. Sawyer, Requirements Engineering A good practice guide. 1997,
Chichester: John Wiley & Sons Ltd. 2. Paulk, M.C., C.V. Weber, B. Curtis and M.B. Chrissis, The Capability Maturity Model: Guidelines
for Improving the Software Process. The SEI Series in Software Engineering, ed. C.M.U.S.E. Institute. 1995, Reading, Massachusetts: Addison Wesley Longman, Inc.
3. ami, H., A Quantitative Approach to Software Management, in application of metrics in industry. 1992, Univ of the Southbank: London.
4. Bach, J., What Software Reality is Really About. IEEE Computer, 1999(December): pp. 148-149.
5. El Emam, K., D.R. Goldenson, J. McCurley and J. Herbsleb, Success Or Failure? Modeling the Likelihood Of Software Process Improvement. International Software Engineering Research Network, 1998
6. El Emam, K., P. Fusaro, and B. Smith. Success Factors and Barriers for Software Process Improvement. in Better Software Practice For Business Benefit: Principles and Experience. 1999: IEEE Computer Society.
7. Herbsleb, J.D. and D.R. Goldenson. A systematic survey of CMM experience and results. in ICSE. 1996. Berlin.
8. Stelzer, D. and W. Mellis, Success Factors of Organizational Change in Software Process Improvement. Software Process - Improvement and Practice, 1998. 4(4): p. 227-250.
9. Dybå, T., An Instrument For Measuring The Key Factors Of Success in Software Process Improvement. Empirical Software Engineering, 2000(5): p. 357-390.
10. Hayes, W. and D. Zubrow, Moving on Up: Data and Experience Doing CMM-Based Process Improvement. 1995, Carnegie Mellon University: Pittsburgh.
11. El Emam, K. and N.H. Madhavji, The Reliability of Measuring Organizational Maturity. Software Process Improvement and Practice. Vol. 1. 1995: John Wiley & Sons. 3-25.
12. El Emam, K., D. R. Goldenson, J. McCurley, J. Herbsleb, Modelling the Likelihood of Software Process Improvement: An Exploratory Study. Empirical Software Engineering, 2001(6): p. 207-229.
13. Thomson, H.E. and P. Mayhew, Approaches to Software Process Improvement. Software Process - Improvement and Practice, 1997. 3: p. 3-17.
14. Humphrey, W.S., Managing the Software Process. The SEI Series in Software Engineering, ed. S.E. Institute. 1989, Reading, Massachusetts, USA: Addison-Wesley Publishing Company, Inc. 494.
15. Curtis, B., The Global Pursuit of Process Maturity. IEEE Software, 2000. 17(4): p. 76-78. 16. Rainer, A. and T. Hall, A quantitative and qualitative analysis of factors affecting SPI. awaiting
publication, 2001. 17. Moitra, D., Managing Change for Software Process Improvement Initiatives: A Practical
Experience-based Approach. Software Process - Improvement and Practice, 1998(4): p. 199-207. 18. Diaz, M. and J. Sligo, How Software Process Improvement Helped Motorola. IEEE Software,
1997(September/October): p. 75-81. 19. Herbsleb, J.D., A. Carleton, J. Rozum, J. Siegel, D. Zubrow,. Benefits Of CMM-Based Software
Process Improvement: Initial Results. 1994, SEI Technical Report. 20. Krasner, H., Accumulating The Body Of Evidence For The Payoff Of Software Process
Improvement. in: http://www.utexas.edu/coe/sqi/archive/krasner/spi.pdf -May 1999, 1997. 21. Hall, T. and D. Wilson, Views Of Software Quality: A Field Report. IEE Procs On Software
Engineering, 1997. 2(114): p. 111-118. 22. Huczynski, A.A. and D.A. Buchanan, Organizational Behaviour: An Introductory Text. Second
Edition, ed. D. Pugh. 1991, London: Prentice Hall. 23. Morgan, D.L., Focus Groups As Qualitative Research (2nd ed.). 1997: Sage Publications. 24. Krueger, R.A. and M.A. Casey, Focus Groups: A Practical Guide For Applied Research. 2000:
Sage Publications. 25. Morgan, D.L. and R.A. Krueger, When To Use Focus Groups And Why, in D. L. Morgan (Ed)
Successful Focus Groups: Advancing The State Of The Art. 1993, Newbury Park, Ca: Sage. 3-19. 26. Paulk, M.C. and M.B. Chrissis, The November 1999 High Maturity Workshop, in Carnegie Mellon
Uni. 2000, Software Engineering Institute. 27. Krippendorff, K., Content Analysis An Introduction to Its Methodology. Sage CommText Series,
ed. F.G. Kline. Vol. 5. 1980, Beverly Hills: Sage Publications.
SCB/Problem Paper 21/11/01 14/21
28. Kitchenham, B.A., R.T. Hughes, and S.G. Linkman, Modeling Software Measurement Data. IEEE
Transactions on Software Engineering, 2001. 27(9): p. 788-804. 29. Burnard, P., A method of analysing interview transcripts in qualitative research. Nurse Education
Today, 1991(11): p. 461-466. 30. Vogt, W.P., Dictionary of Statistics and Methodology. 2nd Edition. 1999: Sage publications. 31. Greenacre, M. and B. Blasius, Correspondence Analysis in the Social Sciences
Recent Developments and Applications, ed. M. Greenacre. 1994, London: Academic Press Ltd. 367.
32. Hall, T., S. Beecham, and A. Rainer, Requirements Problems in Twelve Companies: An Empirical Analysis. Requirements Engineering Journal (in review), 2001.
33. El Emam, K. and A. Birk, Validating the ISO/IEC 15504 Measure of Software Requirements Analysis Process Capability. IEEE Transactions on Software Engineering, 2000. 26(6).
34. Boehm, B.W., Software Engineering Economics. advances in computing science and technology series, ed. Prentice-Hall. 1981, Englewood Cliffs: Prentice-Hall, Inc.
35. Humphrey, W.S., D.H. Kitson, and C. Kasse, The State of Software Engineering in Practice: A Preliminary Report. 1989, CMU/SEI-89-TR-1, SEI,CMU.
36. Trist, E.L.e.a., Organizational Choice. 1963: Tavistock Publications. 37. Horvat, R.V., I. Rozman, and J. Gyorkos, Managing the Complexity of SPI in Small Companies.
Software Proces: Improvement Practice, 2000(5): p. 45-54. 38. Baddoo, N. and T. Hall, De-motivators for Software Process Improvement: An analysis of
practitioners' views. in press, 2001. 39. Mellis, W., Software Quality Managment In Turbulent Times - Are There Alternatives To Process
Oriented Software Quality Management? Software Quality Journal, 1998(7): p. 277-295. 40. Ahuja, S. Process Improvement In A Rapidly Changing Business And Technical Environment. in
Fourth Annual European Process Group Conference. 1999. Amsterdam, Holland. c303. 41. Pitterman, B., Telcordia Technologies: The Journey To High Maturity. IEEE Software, 2000. (4):
p. 89-96. 42. Willis, R.R., R.M. Rova, M.D. Scott, M.I. Johnson, J.F Ryskowski, J.A. Moon, K.C. Shumate,
K.C. and T.O. Winfield, Hughes Aircraft's Widespread Deployment Of A Continuously Improving Software Process. 1998, Software Engineering |nstitute,Canergie Mellon University.
43. Fordham, R.G. Software Process Maturity: Is level five enough? in ICSE99. 1999. 44. Glaser, B.G. and A.L. Strauss, The Discovery Of Grounded Theory: Strategies For Qualitative
Research. 1967: Aldine de Gruyter. 45. Webb, C., Analysing qualitative data: computerized and other approaches. Journal of advanced
Nursing, 1999. 29(2): p. 323-330. 46. Sommerville, I., Software Engineering sixth edition. International Computer Science Series, ed. L.
University. 2001, Wokingham: Addison-Wesley Publishing Company.
SCB/Problem Paper 21/11/01 15/21
SCB/Problem Paper 21/11/01 16/21
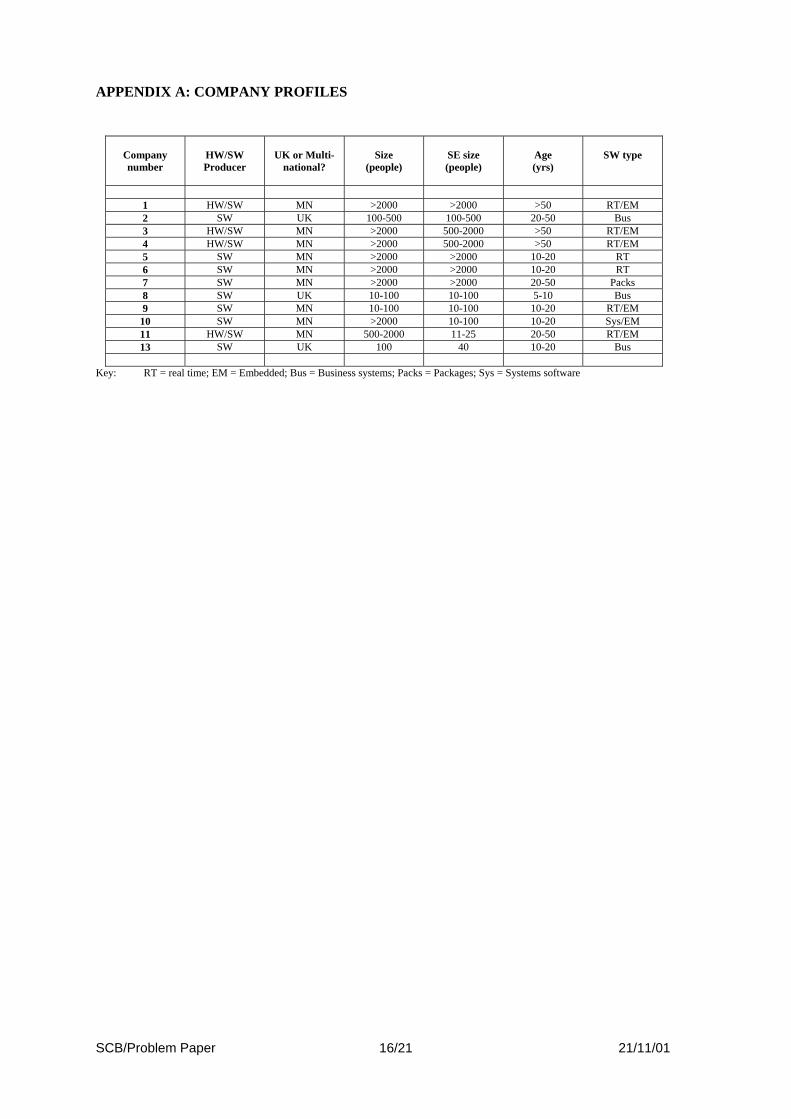
APPENDIX A: COMPANY PROFILES
Company number
HW/SW Producer
UK or Multi-
national?
Size
(people)
SE size (people)
Age (yrs)
SW type
1 HW/SW MN >2000 >2000 >50 RT/EM 2 SW UK 100-500 100-500 20-50 Bus 3 HW/SW MN >2000 500-2000 >50 RT/EM 4 HW/SW MN >2000 500-2000 >50 RT/EM 5 SW MN >2000 >2000 10-20 RT 6 SW MN >2000 >2000 10-20 RT 7 SW MN >2000 >2000 20-50 Packs 8 SW UK 10-100 10-100 5-10 Bus 9 SW MN 10-100 10-100 10-20 RT/EM
10 SW MN >2000 10-100 10-20 Sys/EM 11 HW/SW MN 500-2000 11-25 20-50 RT/EM 13 SW UK 100 40 10-20 Bus
Key: RT = real time; EM = Embedded; Bus = Business systems; Packs = Packages; Sys = Systems software
SCB/Problem Paper 17/21 8/11/2001
APPENDIX B: Problem Classification Our classification scheme came from a content analysis and grounded theory approach to the data [36, 44]. The subjective classification of discussion points made by participants during focus group sessions was manually selected using the transcripts of focus groups. Webb says that this manual approach to describing the data helps “gain an insight into the intuitive aspects of analysis which is the essential basis of any method of analysis [45]. The categories in our classification scheme are given detailed definitions and context to create data that is trustworthy [37]. We have broken down problems that practitioner groups are encountering in their software development into 3 discrete process areas: ‘Organisational’, ‘Software Development Lifecycle’ and ‘Project’. Organisational Issues 1. Communication
1.1 Internal (within and between departments) e.g. “We don’t talk to the modelling department, we don’t always talk to hardware department, we don’t talk to systems. It is the interfaces, communication interfaces that I think is the biggest problem” (A developer from a CMM level 1 company)
1.2 External (between any internal practitioner or group with external customers/users) e.g. “We also suffer from having little to no communication with the users at ground level” (Developer in CMM level 1 company)
1.3 Physical distance/split sites/geography/company structure E.g. “Physical siting of teams poor. Not under management control” (Senior Manager in CMM level 1 company)
2. People Issues 2.1 Responsibilities, rewards, blame
e.g. “.. responsibilities are not clear and some ‘buck passing’ goes on.. can waste a lot of time” (Dev in CMM level 1 company)
2.2 Staff Turnover, retention, recruitment e.g. “failure to retain … people creates big problems”, and general resourcing is low, plus recruitment problems”. (Dev in CMM level 1 company)
2.3 Skills and experience e.g. “Poor skills mix currently” and “Technical and domain over-reliant on key people” (Developers in level 1 company)
2.4 Training e.g. “Very difficult to get training implemented” (Project manager in CMM level 1 company).
3. Politics When a practitioner cites a ‘political’ or external problem, e.g., “Issues are driven by outside and finance senior managers. Especially because of financial market changes” (Developer, level 1). “Since the takeover, cost and benefit issues move to the forefront”. (Senior Manager, level 1). “Software Managers are now having to deal with political, commercial issues externally” (Senior Manager, CMM level 4).
4. Culture Ingrained behaviour, way of thinking or habit specific to a group or company. Includes trying to cultivate a desirable company culture and identifying a problem with the existing culture. e.g. “There are very big cultural differences between here and other {sites} and we are very much driven by USA culture. Sometimes you see things come in that might be good for the particular country it came from but it may not necessarily work here”. (Developer, Level 4 company).
SCB/Problem Paper 18/21 8/11/2001
Organisational Issues cont’d/… 5. Goals
Company goals and objectives. This includes setting, keeping, attaining, identifying, communicating 'goals'. E.g., “It suddenly became a point that you had to do something in [the department] as one of your goals for the year and if you didn’t you were a naughty person, with the result that people resented being forced into something”, (Developer level 4 company).
6. Change Management How companies are coping with change and reorganisation at any level, e.g., “It is very difficult to show the benefits of change to people”, (Developer in level 1 company). “Middle management tend to be a difficult area to adopt change, they tend to moan a lot about a need for change. But at a senior level you have a strong desire to improve the process but in between there seems to be more resistance to implement change”, (SPI manager in level 1 company).
Software Development Life Cycle Issues Companies vary in their use of software lifecycles. Whichever form is used (e.g. waterfall, spiral, single prototype[46]), the processes in our classification scheme are likely to appear: 1: Requirements – elicitation, specification/modelling, verification. Requirements problems are identified as: complex; vague/undefined; subject to growth/creep; poor user understanding; incomplete; lacking in traceability) 2: Design - correct, understandable, flexible, methods 3: Coding – consistent, documented/comments, traceable; reusable 4: Testing – scalable; measurable; reliable 5: Maintenance – patches, updates, bugs; defects; regression; release; reuse; fault fixing. Project Issues We have identified project related issues as: 1. Budget and estimates: Investment and resources, lack of funding for projects. We look at direct
causes of problems, e.g. “we don’t have enough money to invest in new systems” comes under budget as it is a problem with investment. We can’t tell that a new system would help, all we know is that they cannot even test the possibility due to a lack of funding. Resources can cover finance; personnel and equipment.
2. Documentation: Includes measurement data; written procedures; and problems of a) co-ordination and management of documentation b) feedback and postmortems on documentation c) data collection methods
3. Quality: Control problems; High quality products take resources from other areas e.g. SPI. 4. Time-scales: Pressure. E.g. Problems with timescale in projects impact SPI and quality. 5. Tools and technology: Includes implementation of tools and new initiatives. SPI is seen as a tool for
improving software. E.g. “A SPI initiative started in a company some time ago got shot down in flames”, is seen as a tools and technology problem. The category includes productivity/volume of work/pressure, e.g. “we have a problem keeping up to date with the generation of languages” (we cannot tell whether this is an investment or a training issue – all we know is that they are having a problem with technology).
SCB/Problem Paper 19/21 8/11/2001
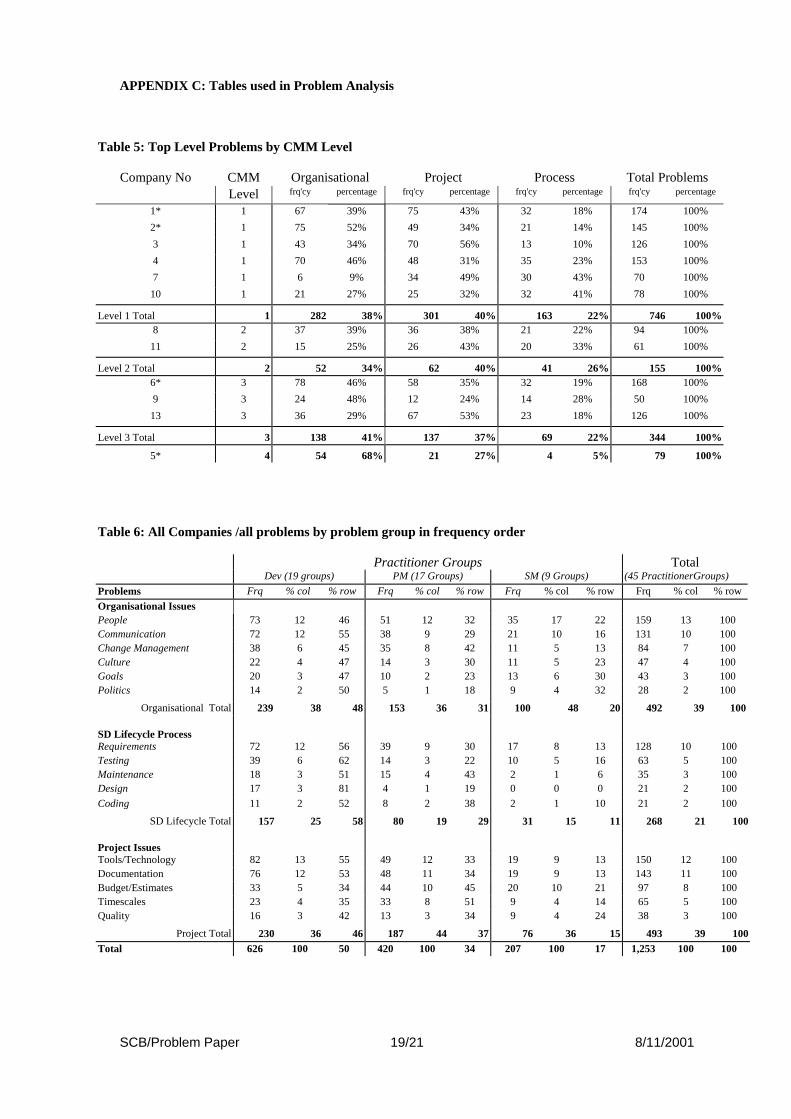
APPENDIX C: Tables used in Problem Analysis
Table 5: Top Level Problems by CMM Level
Company No CMM Organisational Project Process Total Problems Level frq'cy percentage frq'cy percentage frq'cy percentage frq'cy percentage
1* 1 67 39% 75 43% 32 18% 174 100% 2* 1 75 52% 49 34% 21 14% 145 100% 3 1 43 34% 70 56% 13 10% 126 100% 4 1 70 46% 48 31% 35 23% 153 100% 7 1 6 9% 34 49% 30 43% 70 100% 10 1 21 27% 25 32% 32 41% 78 100%
Level 1 Total 1 282 38% 301 40% 163 22% 746 100%8 2 37 39% 36 38% 21 22% 94 100% 11 2 15 25% 26 43% 20 33% 61 100%
Level 2 Total 2 52 34% 62 40% 41 26% 155 100%6* 3 78 46% 58 35% 32 19% 168 100% 9 3 24 48% 12 24% 14 28% 50 100% 13 3 36 29% 67 53% 23 18% 126 100%
Level 3 Total 3 138 41% 137 37% 69 22% 344 100%
5* 4 54 68% 21 27% 4 5% 79 100%
Table 6: All Companies /all problems by problem group in frequency order Practitioner Groups Total Dev (19 groups) PM (17 Groups) SM (9 Groups) (45 PractitionerGroups) Problems Frq % col % row Frq % col % row Frq % col % row Frq % col % row Organisational Issues People 73 12 46 51 12 32 35 17 22 159 13 100 Communication 72 12 55 38 9 29 21 10 16 131 10 100 Change Management 38 6 45 35 8 42 11 5 13 84 7 100 Culture 22 4 47 14 3 30 11 5 23 47 4 100 Goals 20 3 47 10 2 23 13 6 30 43 3 100 Politics 14 2 50 5 1 18 9 4 32 28 2 100
Organisational Total 239 38 48 153 36 31 100 48 20 492 39 100 SD Lifecycle Process
Requirements 72 12 56 39 9 30 17 8 13 128 10 100 Testing 39 6 62 14 3 22 10 5 16 63 5 100 Maintenance 18 3 51 15 4 43 2 1 6 35 3 100 Design 17 3 81 4 1 19 0 0 0 21 2 100 Coding 11 2 52 8 2 38 2 1 10 21 2 100
SD Lifecycle Total 157 25 58 80 19 29 31 15 11 268 21 100 Project Issues
Tools/Technology 82 13 55 49 12 33 19 9 13 150 12 100 Documentation 76 12 53 48 11 34 19 9 13 143 11 100 Budget/Estimates 33 5 34 44 10 45 20 10 21 97 8 100 Timescales 23 4 35 33 8 51 9 4 14 65 5 100 Quality 16 3 42 13 3 34 9 4 24 38 3 100
Project Total 230 36 46 187 44 37 76 36 15 493 39 100Total 626 100 50 420 100 34 207 100 17 1,253 100 100
SCB/Problem Paper 20/21 8/11/2001
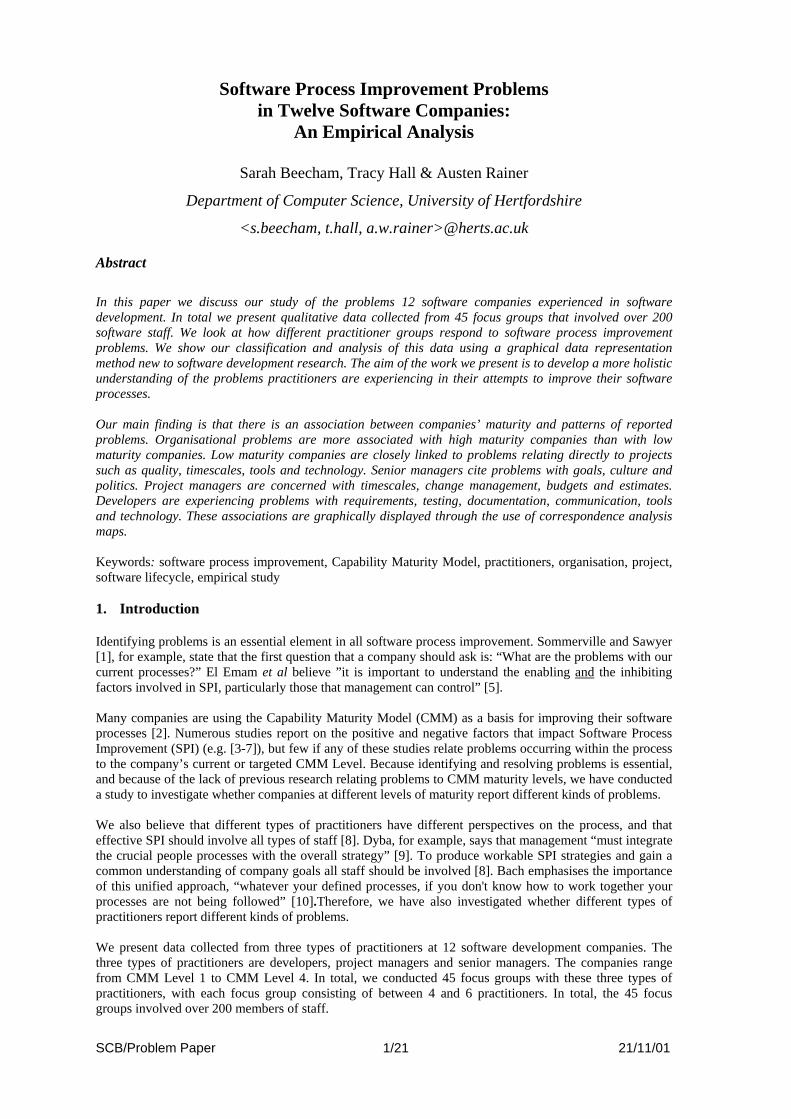
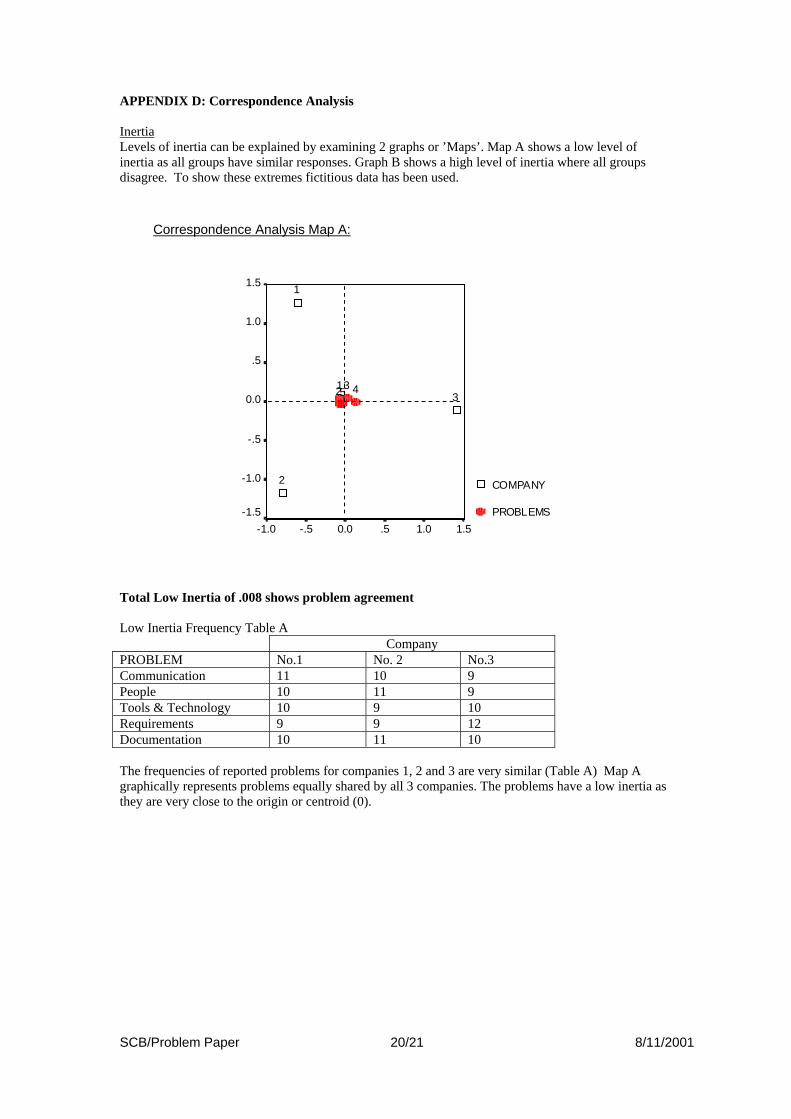
APPENDIX D: Correspondence Analysis Inertia Levels of inertia can be explained by examining 2 graphs or ’Maps’. Map A shows a low level of inertia as all groups have similar responses. Graph B shows a high level of inertia where all groups disagree. To show these extremes fictitious data has been used.
1.51.0.50.0-.5-1.0
1.5
1.0
.5
0.0
-.5
-1.0
-1.5
COMPANY
PROBLEMS
3
2
1
5 4321
Correspondence Analysis Map A:
Total Low Inertia of .008 shows problem agreement Low Inertia Frequency Table A Company PROBLEM No.1 No. 2 No.3 Communication 11 10 9 People 10 11 9 Tools & Technology 10 9 10 Requirements 9 9 12 Documentation 10 11 10
The frequencies of reported problems for companies 1, 2 and 3 are very similar (Table A) Map A graphically represents problems equally shared by all 3 companies. The problems have a low inertia as they are very close to the origin or centroid (0).
SCB/Problem Paper 21/21 8/11/2001
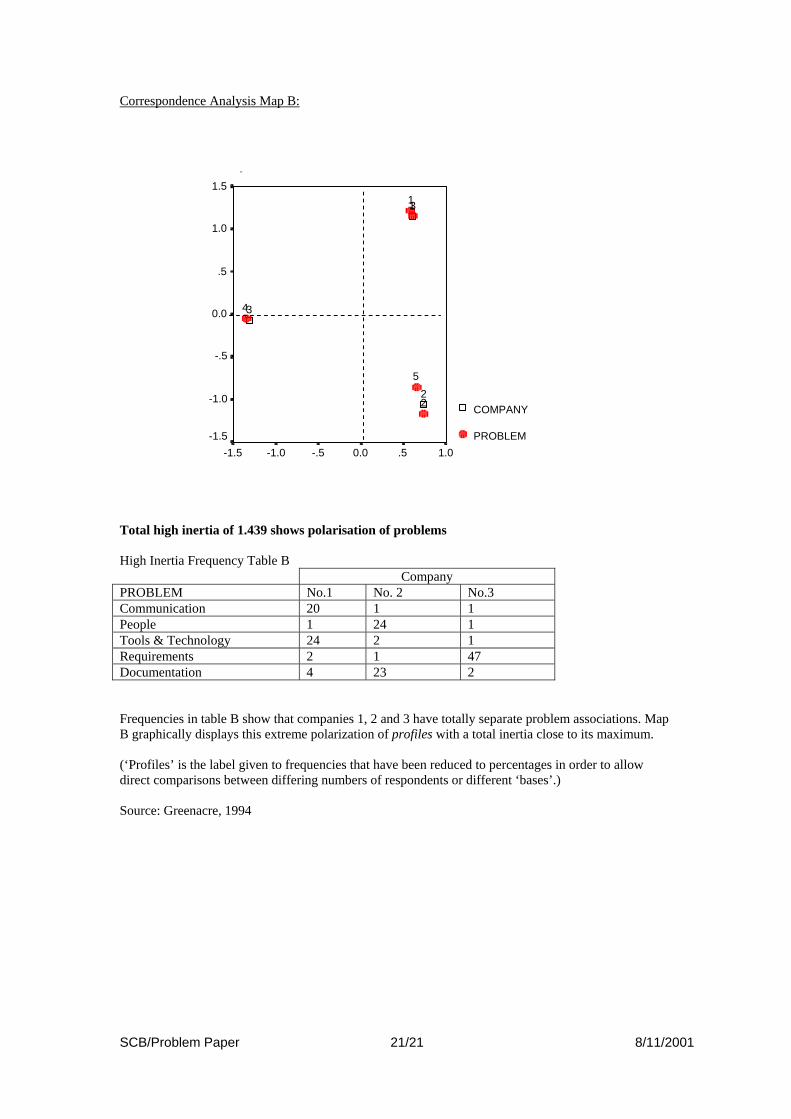
Correspondence Analysis Map B:
Row and Column Points
Symmetrical Normalization
Dimension 1
1.0.50.0-.5-1.0-1.5
Dimension 2
1.5
1.0
.5
0.0
-.5
-1.0
-1.5
COMPANY
PROBLEM
3
2
1
5
4
3
2
1
Total high inertia of 1.439 shows polarisation of problems High Inertia Frequency Table B Company PROBLEM No.1 No. 2 No.3 Communication 20 1 1 People 1 24 1 Tools & Technology 24 2 1 Requirements 2 1 47 Documentation 4 23 2 Frequencies in table B show that companies 1, 2 and 3 have totally separate problem associations. Map B graphically displays this extreme polarization of profiles with a total inertia close to its maximum. (‘Profiles’ is the label given to frequencies that have been reduced to percentages in order to allow direct comparisons between differing numbers of respondents or different ‘bases’.) Source: Greenacre, 1994