Embed Size (px)
Citation preview
Electronic copy available at: http://ssrn.com/abstract=1547276
101
Software Patents, Inventors and Mobility*
Roy Shalem† and Manuel Trajtenberg‡
First version: August, 2006 This version: September, 2009
Abstract
This paper is an exploratory empirical study of the mobility of software inventors, which uniquely
utilizes patent data for that purpose. Mobility of inventors is often associated with knowledge
spillovers. Consequently, there is a potentially significant bi-directional link between mobility of
inventors and property rights protection. The study of the mobility of inventors is, therefore, of
particular interest in the software industry, in which there has been a significant and controversial
shift towards patent protection. Thus, this study analyzes the trends in the software industry; then
characterizes the factors that influence the mobility of software inventors, and shows how this
mobility, in turn, affects the quality of their patents.
JEL Classification: J6, O31, O34.
Keywords: Software Patents, Inventors, Mobility.
* We would like to thank Mark Schankerman for his significant help in earlier versions of this paper; Bronwyn H. Hall, Megan MacGarvie, James Bessen and Robert M. Hunt for sharing their data on software patents with us; and Ran Melamed for his help in some of the data processing. We are also grateful for the useful and scholarly comments made by Anne Layne-Farrar, Shlomi Parizat, participants of the Software Patent Research Meeting, which took place in July 2005, at Harvard University, and the participants of the seminar which took place at Tel-Aviv University on March 2007. This study has been supported by a grant from the Microsoft Corporation. † Berglas School of Economics, Tel-Aviv University; email: [email protected]. ‡ Berglas School of Economics - Tel-Aviv University, NBER and CEPR; email: [email protected].
Electronic copy available at: http://ssrn.com/abstract=1547276
102
1 Introduction
The conjecture of classic economic theory, that the "invisible hand" of the free
market is likely to attain economic efficiency, relies heavily on the premise that various
factors of production can easily be reallocated, so as to enable movement from one
equilibrium to the next. Labor mobility has, thus, become an important field of study, for
several reasons: Basically, labor mobility is the reallocation of one of the most prominent
factors of production. Secondly, since workers and firms are heterogeneous, various
matches may result in different production frontiers, where mobility of labor may be
regarded as the process of improving these matches. Finally, mobility may affect the
incentives of the firms to invest in the human capital of their workers. For all these reasons,
factors which either hinder or improve labor mobility may have a significant impact on
production efficiencies.
Mobility of inventors is of particular interest, due to the rise in the importance of
knowledge and skilled labor in production and the recognition that R&D is one of the main
engines of economic growth. Since mobility of inventors is often associated with the
spillovers of knowledge, it can have important implications for the incentives of firms to
innovate. This factor combined with the self interest of the inventor, form a non-trivial bi-
directional link between the mobility of inventors and the potential quality of the R&D
endeavor.
In this paper we have chosen to concentrate on the mobility of software inventors
for two main reasons. The first reason lies in the fact that the software industry has
undergone a significant and controversial shift towards patent protection. The potential bi-
directional influence between mobility of inventors and intellectual property rights (IPR),
therefore, implies that the study of software inventors is particularly intriguing. The second
reason is that software is probably the most prominent “General Purpose Technology” of
our era; hence, software inventors’ skills may be implemented in many fields - a fact which
further intensifies their potential spillovers and mobility. Indeed, as shall be seen, software
inventors are characterized by various unique features, including more mobility, which
distinguish them from other types of inventors.
103
The uniqueness of this paper lies in the fact that it studies the mobility of inventors
by utilizing patent data. In recent years, patent data has become widely spread in the
empirical literature. This is primarily due to the completion of the comprehensive data file
on patents and citations, comprising all three million US patents granted during 1963-1999,
as well as all patent citations made during 1975-1999 (about 16 million citations), as
presented by Hall, Jaffe and Trajtenberg (2001)§. Although data on the inventors is
available in each patent record, it has been mostly unusable thus far, because of the "Who is
Who" problem**. However, Trajtenberg, Shiff and Melamed (2006) have paved the way to
utilizing this unique database, for the purpose of answering research questions regarding the
mobility of inventors. Their dataset covers all inventors listed on over two million patents
granted in the U.S. in the years 1975-1999.
In an attempt to study the mobility of inventors in the semiconductors industry,
Song, Almeida and Wu (2003) have adopted an approach which is closest to ours.
However, unlike us, they have done so by precisely matching the names of the inventors,
and then checking that there are no contradicting patterns in the rest of the data.
The research questions this paper will address are as follows. First, we will try to
specify the characteristics which distinguish software inventors from other inventors. We
will then attempt to explore the ways in which trends in the software industry have been
affected by the changes in the patentability of software. Next, we will attempt to find
support in the data for some of the possible incentives for mobility, namely whether
mobility is a matching process between the inventors and the firms, and the extent to which
mobility is affected by the quality of the invention. Subsequently, we will show how
mobility and other factors affect the patenting decisions of the firm. Finally, we will try to
reveal the factors that influence the productivity of software inventors and the quality of
their patents; in particular, in regard to mobility.
Some of our main findings are as follows. Subsequent to the United States Patent
Office (USPTO) policy change to allow software to be patented, there has been a shift of
software inventors and software patenting towards smaller, more specialized software § The complete dataset is available in the NBER site at http://www.nber.org/patents/, and in a CD included in
Jaffe and Trajtenberg (2002). ** Each record of the patent data includes just the name of the inventors and the cities where they live, with no
unique identification numbers, so that if two similar inventor names appear on two patents it is difficult to determine whether it is the same person or two distinct inventors.
104
firms. We find no evidence that supports matching as an important incentive for mobility;
whereas asymmetric information between the inventor and her employee, regarding the
importance of the invention, is found to be significant in that sense. Teamwork is found to
be positively correlated with mobility - both in the short and long run. Mobility is found to
be associated with a bent in the inventor’s line of research. Some evidence further indicates
that mobility creates incentives to speed up patenting an invention, especially in small
firms, and wherever there are a lot of co-inventors. Finally, small firms are found to have,
on average, more important innovations.
The paper is organized as follows: Section 2 provides background on innovations in
software and discusses the software patents controversy. Section 3 provides background on
job mobility and presents our hypotheses on the mobility of software inventors. Section 4
discusses the unique dataset we use. Section 5 presents the stylized facts and finding.
Section 6 concludes.
2 Software Innovations - Background
2.1 What is Software?
Software is generally defined as a set of encoded instructions executed by electronic
devices, including computers, for performing operations and functions. However, software
is not one thing - the general term "software" refers to a variety of different products and
activities. For instance, the following division of software into three rough categories
appears in Jackson (2001):
"Software is characterized by three types: pre-packaged, custom-design and own-account. Pre-
packaged software is of the sort that can be purchased ‘off-the-shelf’ and is typically mass-produced and sold
or licensed in standardized form. It is intended for generalized uses common to the every-day operations of
businesses and governments. Custom-design software, by contrast, is intended for specialized uses. It is
typically developed for and tailored to a specific organization’s needs by some third party software developer
under contract. Customized software has limited application beyond the particular ‘business problem’ it is
designed to solve. Like custom-design, own-account software is specialized to a specific organization’s needs,
and distinguished only insofar as its development is undertaken ‘in-house’ by employees within the
organization rather than being contracted out."
105
These distinctions emphasize, among other things, the fact that not only software
firms are involved in the production of software. Even so, according to Graham and
Mowery (2003), the most notable massive growth in the modern computer software
industry has been in the markets for pre-packaged software.
Another noteworthy segment, which is entirely left out in the analysis of this paper,
is the open-source software. Open-source software exists in all software categories. In
recent years it has shown a rapid growth and diffusion, owing partly to the rise of the
internet.
It is important to note that software never functions on its own, but rather always
designed for some kind of hardware. Quoting Layne-Farrar (2005), "software can be
viewed as an input rather than an end product. (Some) software cannot function on its own,
but instead interacts with many other technologies". One can, therefore, classify software
by the type of hardware it is intended for, whether computers or any other kind of electronic
device. This interdependence between the hardware and the software industry has over the
years yielded conspicuously significant mutual influence. Graham and Mowery (2003)
describe how the trends in the development of hardware have affected the development of
software. Moreover, they show that copyright protection for software-related intellectual
property in the U.S. has been supplemented by patent protection, as the boundaries of both
forms of intellectual property protection have been substantially extended.
2.2 On the Patentability of Software
The claim that software should be patentable is anything but obvious. The U.S. view
on the patentability of software has evolved throughout many years of court rulings, until
finally in 1995, the USPTO proposed new guidelines for software patentability††. This
extremely controversial change has since been topic of debate by many scholars.
Why, then, should software be different from any other invention, in that sense? The
criticism over the patentability of software, found in Irlam and Williams (1994), Hall and
†† These guidelines were proposed on May 12, 1995, and published on March 29, 1996.
106
MacGarvie (2006) and Wheeler (2006)‡‡, is henceforth reviewed. These argument are
presented so as to provide background on the software patents controversy, to help better
understand the real nature of software patents, by shedding light on the uniqueness of
software itself §§.
The main goal of the patent system is to encourage innovation. As innovation is
typically costly, patents compensate the inventor for these costs, by providing her with
limited time, exclusive rights, over her innovation, in return to its disclosure. The efficiency
of such mechanism, in the context of the software industry, is not that clear. Firstly, since
this industry constitutes an extreme case of cumulative knowledge, the existence of
licensing costs may discourage innovation. Secondly, software patent does not facilitate
disclosure, on account of the fact that the code is not being disclosed when the patent is
issued. Finally, as software technology evolves very quickly, granting a patent for many
years, is as if it was granted for generations, in software terms. This implies that the social
costs of a software patent, which are the temporary monopoly power given to the inventor,
are extremely high.
Moreover, for any innovation to be patented, it must pass the tests of novelty, non-
obviousness, and utility. Determining whether a certain innovation should pass the novelty
criteria becomes even more difficult when it gets to software innovations, for the following
reasons. The fact that software development had taken place long before software became
patentable hinders the ability of the PTO to conduct adequate novelty analyses. The result
of lack of access to adequate prior art was that many poor quality software patents were
issued; the kind that do not correspond to the statutory definition of a patentable invention.
Prior art might be particularly difficult to determine, taking into account the existence of
open-source***. This is exacerbated by the complexity of software, having grown to the
current state where a single large computer program cannot be completely understood by
‡‡ The paper by Irlam and Williams (1994) was published on behalf of "The League for Programming
Freedom", a group which strongly apposes software patents. Wheeler (2006), another opposer to software patents, lists "the most important software innovations". He claims that almost none of them were ever covered by patents. Moreover, he claims that in general, software patents have essentially no relationship to software innovation.
§§ It should be noted that some of the following criticism on software patentability represent the personal views of the authors of the above mentioned papers, and are not necessarily based on hard evidence.
*** See for example the following article: http://technocrat.net/d/2006/6/30/5032.
107
any one single person†††. Finally, the abstract nature of software makes prior art harder to
recognize, due to the difficulty in classifying software technologies.
Another special feature that characterizes software is its cost structure. In software,
as opposed to other industries, the ideas, namely the innovations, are usually pretty easy to
come up with. Most of the costs in the software industry are in the development phase,
rather than in research or production. Furthermore, the social cost of patents is proportional
to the development cost, owing to the fact that it is the amount of ideas that are put in the
product that determines how many different patents may be involved. Thus, the patent
system results in an enormous cost to the industry in the development stage, in order to
incentivize the research stage which is not very costly‡‡‡. Finally, standards constitute a key
element in the software industry. Patents, in many cases, represent the opposite of
standards, and thus might hinder the progress of the industry.
This line of literature is filled with anecdotal evidence of so called "bad" software
patents; the kind which do not correspond to novelty, non-obviousness, and utility.
Examples can be found in Irlam and Williams (1994) and in Wheeler (2006)§§§. Bessen and
Hunt (2004) are somewhat exceptional in that they provide empirical evidence opposing
software patents: "For the 1990s… all else equal, increases in software patent share were
associated with decreases in research intensity. This suggests that in the 1990s, software
patents substituted for R&D".
As opposed to the strong arguments criticizing software patents, claims in favor of
software patents are much more hesitant. The strongest ones are based on the fact that
almost at the same time as software was becoming generally patentable, the software
industry was entering an unprecedented time of prosperity, as the internet revolution was at
††† Complexity also means that any program is dependent on a very large number of software technologies,
and thus is more vulnerable to patent infringements. ‡‡‡ One can ask oneself, like Schacht (2006) has, why patents are so important in industries such as the
biomedical industry. One of the reasons is the extremely low costs of imitation, by means of reverse engineering, relative to the costs of innovation. In the software industry, however, these costs are much more similar, hence patent protection is less imperative in that industry.
§§§ Amongst the well known examples of controversial patents are Amazon's "one-click" patent (US patent #5,960,411), IBM's "restroom reservation patent" (#6,329,919) and its patent which covers the use of different colors to distinguish the nesting level of nested expressions (#4,965,765). It is also worth mentioning the extremely controversial Microsoft's "IsNot" patent application (http://homepages.cwi.nl/~paulk/patents/isnot.pdf).
108
its prime. This prosperity stands in contrast with the gloomy conjectures, presented by those
who oppose the patentability of software.
Evans and Layne-Farrar (2004) criticize the fact that most opposers to software
patents base their claims on anecdotal evidence, and not on strong empirical evidence. They
claim that the empirical evidence linking patents and innovation is still inconclusive for all
fields, let alone software. Moreover, reforms in the USPTO might be helpful in dealing with
some of the flaws highlighted by the software patents opposers.
Graham and Mowery (2005) conclude their empirical research as follows: "Little
evidence suggests that increased patenting has been associated with higher levels of
innovation in the U.S. software industry, and equally little evidence suggests that increased
patenting has proven harmful to innovation in this important sector of the “post-industrial”
economy." Noel and Schankerman (2006) have also found no evidence that the shadow
price of R&D has changed as a result of the change in patent regime.
Schacht (2006) and Mann and Sager (2006) discuss the fact that intellectual
property is important to some investors but not to others, and that it is considered a
significant factor when a company is involved in acquisition negotiations or in an IPO.
Hall and MacGarvie (2006) propose that before a welfare analysis of software
patents could take place, a preliminary step must be taken in order to establish the existence
of a positive private value to firms holding software patents. Indeed, not only have they
found that software patents are highly valued by the market, but that following 1994
software patents seem to be even more highly valued by the market than ordinary patents.
Regardless of the wisdom of applying the patent system to the software industry,
nowadays patents constitute an integral feature of the industry. Our paper will further try to
shed light on the effect that the tightening of the IPR protection has had on the software
industry.
109
2.3 Size of Software Firms
It seems reasonable to hypothesize that the more important and radical patented
innovations of the software industry are likely to be done by the small firms****. There have
been discussions regarding this phenomenon, in different industries and contexts, at least as
far back as Nelson's (1959) review paper: "[E]stablished firms, even progressive established
firms, are usually backward about radically new inventions and … the birth of a new firm is
often necessary to introduce an invention to the market". Prusa and Schmitz (1994) have
also found evidence, based on sales data of the PC software industry, which supports the
claim that firms lose their innovative thrust as they grow.
If, indeed, such a relation between the firm size and the importance of its inventions
can be established, it will be important to check how the increase in patent protection of
software has affected small firms. Irlam and Williams (1994), for example, have speculated
that the introduction of patents into the software industry would trigger evolutionary
pressures which could be devastating for small software firms, and would eventually bring
the industry to a point where it would be dominated by more diverse, not pure-software,
firms. Their argument was that large software cooperation with many patents would be able
to survive the change, owing to their large patent portfolio, which could serve as
ammunition to fight back any company threatening them with infringement. By contrast,
for many small companies, the prospect of being sued over a patent infringement, even if
the case was ungrounded and ultimately was to fail, would still be so terrifying, that they
rather give all patents they know about a wide berth, than risk the possibility of any kind of
patent challenge.
While very small firms generally tend to be fully specialized in a niche, larger
corporations tend to have a larger scope of activities††††. When Irlam and Williams (1994)
presented their vision of the software industry, in the presence of patents, they mentioned
IBM, Hitachi, and AT&T as models of companies which could survive the “patent
**** Opposers to software patents might say that the most important software innovations are usually never
patented (see for instance Wheeler (2006)). However, unpatented innovations are left beyond the scope of this paper.
†††† A distinct exception to that claim is Microsoft, which is a very large corporation, yet almost fully specialized in software. However, even Microsoft has slowly introduced more and more hardware into its product line.
110
revolution”. They have also claimed that the desirable trait embodied in those companies is
“an ability to produce software patents without producing software products”.
This paper shall hence check whether the empirical evidence supports the claim that
the firm size is negatively correlated with the importance of the inventions. In addition, we
shall see whether the conjectures made by Irlam and Williams regarding the trends of the
software industry do, in fact, hold in the patent era.
3 Mobility - Background and Hypotheses
3.1 Background - Mobility and Knowledge Spillovers
Labor market mobility is a channel for spillovers and information flows; as such it
may affect R&D and patenting decisions made by the firms. On the opposite direction, IPR
protection is likely to affect mobility. Hence, there is a potential bi-directional link between
mobility on the one side, and R&D decisions and IPR on the other side. However, this link
is not straightforward, since the labor market contracts and the legal environment might
both alter or even reverse some of these effects. The following paragraphs survey some of
the literature related to these subjects.
There is an ever-growing body of empirical work investigating the extent of the
mobility of scientists and engineers, and the implications of their mobility on innovation. In
a recent paper, Kim and Marschke (2005) have studied this issue, using information on
industry-level turnover of scientists and engineers merged with R&D and patenting data, for
publicly traded, mostly large firms, in a number of different industries. Their findings show
that greater mobility of scientists is associated with lower R&D, yet more patenting by
firms. This finding is interpreted as indicating that firms patent in order to protect their
intellectual property (IP) against leakage that could occur through labor mobility. One
interesting implication is that if small firms experience a higher turnover rate of scientists
and engineers than large firms, then patenting may become a particularly attractive option
for them. In that case, restricting the patentability of innovations, as has often been
suggested in software, could seriously reduce the ability of small firms to appropriate
innovation rents, thereby damaging R&D incentives for such firms. It is, therefore,
111
important to understand various factors, such as the firm size, that could affect the mobility
of inventors.
Other papers have studied the link between mobility and spillovers using patent data
on citations. Almeida and Kogut (1999) show that in the semiconductor industry the degree
to which patent citations are localized is related positively to intra-regional migration, yet
negatively to inter-regional migration of patenting inventors. Interestingly, Song, Almeida
and Wu (2003), who have studied the mobility of inventors in the semiconductors industry,
have found that learning from mobile engineers is more likely when the hiring firms are less
path dependent, since such firms are more likely to be open to new knowledge‡‡‡‡. Learning
from a mobile engineer is also more likely when the engineer possesses technological
expertise distant from that of the new hiring firm.
However, flows of information do not necessarily constitute genuine information
spillovers for firms; rather, it depends on who is paying for them. For example, in Pakes
and Nitzan (1983) framework, if the target firm of a moving scientist has to pay her a wage
premium for the information she brings - while the original firm employing her is to
discount her wage for the expected loss of information due to her mobility - then there will
be no spillover. In short, it matters a great deal how well the labor market works in
internalizing the flows of spillovers. Indeed, Møen (2000) shows that technical workers, at
R&D intensive firms, take a wage discount early on in their career, but earn a premium
later, which indicates human capital investment in such firms. This suggests that at least
part of the potential spillovers from mobility is indeed internalized in the labor market.
The legal environment strongly influences mobility and, thereby, potential
information leakage. Gilson (1999) reviews the greater success of Silicon Valley, as
compared to Route 128 in Boston, in indicators such as total employment, total amount of
exported electronic products and gains from export sales. He argues that this greater success
is due to the fact that while both California and Massachusetts respect the Uniform
Trademark Act which protects the loss of trade secrets through mobility, California
prohibits post-employment restrictive covenants, whereas Massachusetts enforces them.
‡‡‡‡ The measure for path-dependence was built as the ratio of the number of self-citations to the number of
total citations made by the hiring firm in each patent technology class (to which a hiring firm patent belongs).
112
In conclusion, the close relation between the mobility of inventors and knowledge
spillovers is a convention in the literature. Spillovers are not only the result of mobility, but
also an important part of the incentives for mobility. However, neither the direction of these
effects is straightforward, nor their extent, since wage, labor contracts, as well as the legal
environment can alter their effect. Evidently, IPR protection in the software industry has
undergone a revolution in recent years; therefore, we aim at studying the effect it had on the
mobility of inventors, so as to better understand the impact these changes have had on
R&D and patenting, in this industry.
3.2 Mobility of Software Inventors
As mentioned in the previous section, software is in fact multifarious, hence can be
implemented in various means. In many ways, software is a "General Purpose Technology",
in the sense that it constitutes a component in various different industries and products.
Hence, a software developer typically possesses very flexible and broad set of skills§§§§.
These abilities, in turn, give rise to a diverse set of job opportunities for software inventors.
The study of mobility is, therefore, of particular interest for this labor segment. Thus, we
hypothesize:
"General Purpose Skills": Diversification and cumulative knowledge are features which
characterize not only software, but also the software inventors themselves, whose ability to
apply their skills in different fields results in more frequent, diverse and flexible job
mobility, as compared to other inventors.
The very fact that software skills are required in various industries leads to a variety
of job opportunities for software inventors. This, in turn, might result in more job mobility
for many of the software inventors, as compared with other types of inventors. For other
software inventors, this diversification might manifest itself in merely working in different
fields throughout their career. Therefore, we hypothesize that a large portion of software
inventors are not likely to work solely on pure-software inventions, throughout their career.
§§§§ As the rapid and progressing evolution in this field is still ongoing, software inventors are constantly faced
with the professional need to actively invest in their skills, so as to enable them to keep up with these quick changes. Once obtained, however, these skills can be applied to any number of problems.
113
However, having many job opportunities, per se, does not necessarily lead to job
mobility, since skilled employees who are well paid and receive compensating incentives
from their employers may remain immobile. Mobility is often triggered by a disagreement
between the employer and her employee regarding the level of competence of the employee
and the value of her work. Thus, we hypothesize:
"Asymmetric Information": An inventor often has better insights regarding the value of her
inventions, than her employer. Hence, an invention of high "quality", yet little ex-ante
observed quality measures, might trigger the inventor's job mobility. What drives many of
these moves is the inventor's desire to gain more control over her present and future
inventions, as well as the profits associated with them.
Having analyzed the whole population of inventors, Trajtenberg (2005) has
observed that those who were more likely to move were inventors whose patents received
more citations and were more general, whereas the patents of those who were less likely to
move were more original and had more claims. Trajtenberg (2005) argues that this
phenomenon has to do with asymmetric information, between the inventor and her
employee, regarding the importance of the invention. Whenever there are many observed
signals related to the importance of an invention, the firm is able to preempt the movement
of the inventor and stop her from leaving. Conversely, in cases in which the quality signals
of an invention are unobserved to the firm, the firm might not be able to preempt the
mobility of a high quality inventor. Note that this hypothesis relies on the assumption that
subsequent to her move, the inventor is able to repeat her success, hence producing well
cited and general patents.
3.3 Mobility and the Quality of the Invention
Hoisl (2007) has studied mobility of inventors by using data retrieved from
questionnaires filled by German inventors. She found that there exists a simultaneous
relationship between inventor mobility and inventor productivity. Mobility was found to
have a positive influence on the productivity of inventors, as multiple movers turned out
holding more important patents. Furthermore, inventors were able to increase their grant
rate after a move, and their patents received more citations. On the other hand, inventors
with higher productivity were found to be less likely to move.
114
Labor economics literature is abundant with various motivations for job mobility.
One which is particularly interesting, and can be tested with our data is the following:
"Matching": Mobility is the result of a search for a better match between the inventor and
the firm. Hence, if such a process was effective, then, on average, the quality of the
inventor's patents would increase following a move.
It is reasonable to assume that there are many factors affecting the productivity of an
inventor. While some of these factors are assumed to be unobserved by the researcher,
others may reveal themselves to the inventor and her potential employer during the job
search process. Hence, a move should often be associated with an increase in the quality of
the match.
By contrast, Arrow (1962) seems to have thought that the matching between the
inventor and the firm is not so crucial so as to become a determining factor affecting the
productivity of the inventor. In the last paragraph of his classic 1962 paper Arrow claims:
“There is really no need for the firm to be the fundamental unit of organization in invention;
there is plenty of reason to suppose that the individual talents count for a good deal more
than the firm as an organization”. If indeed he is right, then we might not find empirical
evidence of a direct strong link between mobility and the quality of the inventor’s work.
Moreover, there is no doubt that there are also short term costs associated with
mobility, which limit the number of moves throughout the career of a typical inventor. On
the one hand, then, from the inventor's point of view mobility may result in a better match,
and expose her to new ideas. On the other hand it may also entail various costs, especially
in the short-run; some of which are borne personally by the inventor, while others might be
reflected in her work. Therefore, we hypothesize the following link between the firm’s size
and the extent of these costs:
"Productivity, Mobility and the Firm's Size": A move to a small company is usually more
risky. This kind of move is commonly associated with higher short-run costs, yet potentially
larger benefits.
This hypothesis ties the short and long term considerations of mobility with the size
of the firm. As mentioned in the previous section, we hypothesize that the more important
115
software inventions are done by smaller firms; however, the higher potential benefits that
could be attained by working in a small firm are surely, at least partly, offset by the higher
short term costs. This is due to the fact that, on average, large firms typically have better
infrastructure and experience than smaller ones, thus enabling them to diminish some of the
costs associated with the move.
Finally, we hypothesize the following effects of teamwork on mobility and patent
quality:
"Teamwork": Working in teams has three main effects on software inventors and their
patents:
a. Working as part of a diverse team of inventors contributes to the skills of software
inventors and expands their professional networks. These factors improve their job
market positions, which might later be rendered into more job mobility of the team
members.
b. When a large team of inventors is involved in an invention, pressures might be applied
by the employer to patent the invention prematurely. Successful patenting might help to
preempt mobility.
c. When a large team of inventors patent an invention, it becomes more likely for
successive innovations and ramifications to follow in the future.
We hypothesize that teamwork is likely to be especially prevalent amongst software
inventors. This is due to the fact that software is often a component in an invention; thus,
the development of the entire invention often requires the participation of inventors from
various other fields as well. Indeed, the "Occupational Outlook Handbook", of the U.S.
Bureau of Labor Statistics (2006), describes the work of a typical computer software
engineer as follows: "Computer software engineers often work as part of a team that
designs new hardware, software, and systems. A core team may comprise engineering,
marketing, manufacturing, and design people, who work together until the product is
released."
We further hypothesize that inventors experienced in working in such teams are
likely to have more employment options, resulting in more mobility. This correlation
116
between working in a diverse team and mobility may not be causal, but rather reflect the
sample selection of that sub-group of software inventors. By contrast, another plausible
theoretical hypothesis could state that prolonging the work of an effective team might be a
factor contributing to the decision of an inventor to stay with her current employer. This
paper will empirically test which of the effects prevails in the data.
Empirical evidence indicates that firms patent in order to protect their IP against
leakage through labor mobility. When a large team of inventors is involved in an invention,
the combination of the potential mobility of the inventors and the difficulty in keeping the
invention secret might result in pressures to prematurely patent inventions.
Clearly, it is most likely that the inventor himself would be the one to pursue the
line of research stemming from her former inventions. This is especially true in the software
industry, in which when an invention is patented, disclosure is often very partial.
Consequently, when a large team of inventors jointly work on an invention, each might be
inclined to follow the line of research of the particular invention in the future, thus
increasing the chance of successive innovations, as well as their possible ramifications.
4 Data
This section elaborates on the unique dataset we have utilized for the purpose of this
study. We first discuss briefly the difficulties in isolating software patents. We then explain
what our definition of software inventors is, and how we identify them in the data. Finally
we elaborate on how exactly our dataset has been constructed and present the limitations of
the data.
4.1 Software Patents
In this paper we want to limit our study of mobility to that of software inventors.
The first step in doing so requires isolating software patents from other patents. However,
there is no clear-cut definition in the literature as to what should be classified as a software
patent. Layne-Farrar (2005) reviews various methods that have been used in the literature
for the purpose of isolating software patents. One such method is to restrict the data to
117
either the relevant International Patent Classifications (IPCs) or to the relevant USPTO
classes. Another way is by means of using an algorithm that performs a keyword search.
Bessen and Hunt (2006) are a good example of scholars who have taken the latter approach.
Having compared the various methods, Layne-Farrar (2005) summarizes that “The cleanest
route to a solid software patent dataset therefore seems to lie in the middle of these two
approaches: a combination of classifications with a judicious use of keywords may lead to a
relatively pure software patent dataset”.
Hall and MacGarvie (2006) have followed this advice, and intersected the Bessen
and Hunt (2006) dataset with a list of patents which correspond to a relevant IPC or USPTO
class. Random sample tests that have been made by Hall and MacGarvie (2006) and by
Layne-Farrar (2005), indicate that this method should result in a dataset with relatively little
amount of type I and type II errors in recognizing software patents, as opposed to other
types of patents. We have thus adopted this approach and have been using the Hall and
MacGarvie database in this paper for the purpose of isolating software data*****. The
database consists of 58,668 patents, which were granted between the years 1976-2002.
4.2 Software Inventors
The NBER Hall-Jaffe-Trajtenberg Patent Data File is a panel dataset which contains
information on approximately two million patents. On average, there are roughly two
inventors per patent; thus, the inventor file is comprised of over four million inventors.
However, tracing mobility from the patent data is far from trivial; in fact, so far researchers
have been unable to use these data because of the “Who is Who?” problem, i.e. the inability
to know whether an inventor’s name appearing on different patents actually belongs to the
same person. Trajtenberg, Shiff and Melamed (2006) have introduced an algorithm which
uses a scoring method, in order to construct a unique list of inventors. This algorithm is
aimed at maximizing the probability of identifying whenever any two entries of inventors’
names related to different patents, belong to the same person or not.
One limitation in the Trajtenberg-Shiff-Melamed database is that it is updated up to
the year 1999. We were, therefore, forced to truncate the Hall and MacGarvie (2006)
***** We would like to thank both Hall & MacGarvie and Bessen & Hunt for sharing their list of software
patents with us.
118
database accordingly, and were left with 37,655 software patents, which were granted
between the years 1976-1999.
In this paper, we define a software inventor as any inventor who has at least one
software patent. Using this methodology, we have identified 52,746 unique inventors.
However, since a software inventor might also have patents in other fields, we need to keep
the records of all her patents, not only those in software, in order to trace her mobility.
4.3 Compiling the Data
A brief description of the work process hereby follows. We started first with a list of
software patents, which was adopted from Hall and MacGarvie (2006), and truncated to the
year 1999. Then, we used the inventor identification database of Trajtenberg-Shiff-
Melamed, in order to identify the list of 52,746 software inventors. Next, we took that list,
and using the Trajtenberg-Shiff-Melamed database, generated a list of all the patents - not
only software - of the software inventors. This process has generated a set of 128,678
patents, out of which 37,655 are software patents. Each record was defined as a match
between one software inventor and one patent, and so we were finally left with a panel
database consisting of 221,546 records.
After having compiled this dataset of patents, we constructed several variables, in
order to enrich the NBER Hall-Jaffe-Trajtenberg Patent Data for our purposes†††††. The
appendix elaborates on all the variables used in this paper - both the original NBER
variables and the ones constructed specifically for this paper.
4.4 The Limitations of the Data
The very fact that our empirical study of mobility is based solely on granted patents
seems to be the most significant limitation of the data. How much, and to what extent
would the results change, given a different definition, are questions that remain open.
††††† See Hall, Jaffe and Trajtenberg (2001) for detailed information on the NBER data file. We have used the
updated file for patents which were granted between 1963 and 2002, which is downloadable from Bronwyn H. Hall's website: http://elsa.berkeley.edu/~bhhall/bhdata.html.
119
One should also take into consideration the unavailability of a clear-cut definition of
software patent, and the possible inaccuracies in identifying the unique inventors using the
Trajtenberg-Shiff-Melamed method. The use of the Trajtenberg-Shiff-Melamed database
has posed yet another limitation in that we could only deal with patents which were granted
up to the year 1999. This restriction is potentially very influential, taking into account the
fact that over 35% of Hall and MacGarvie (2006) patents were granted after that year.
The use of certain variables from the NBER patent file, for our needs, might also
present some statistical difficulties, as described in Hall, Jaffe and Trajtenberg (2001). One
such very important variable is the number of citations received for each patent. It is quite a
common practice in the empirical literature on patents, to use this variable as a proxy for
measuring the importance of a patent. Still, this variable entails two main statistical
problems, which are its truncation and non-stationarity (there have been periods with more
or less citations, which did not necessarily correspond with the importance of the patents of
these periods). Hence, these problems raise the question of how to compare 100 citations of
a 1999 patent with 500 citations of a 1975 patent. Moreover, the measure of "generality"
too is affected by the number of citations which might also prove to be problematic.
However, in this paper we only partially address these statistical problems.
A final limitation, which should be noted, has to do with our proxy for the size of
the firm. Standard proxies in the literature include sales and the number of employees.
Unfortunately, many of the firms in our sample are not publicly held, and so these measures
are unavailable. We were therefore forced to use a proxy which is constructed from the
NBER Hall-Jaffe-Trajtenberg Patent Data File. Each patent is assigned to a certain firm or
organization (“assignee”). If the inventor is not affiliated to any, the patent is said to be
assigned to an individual inventor (“garage”). For our measure of size, we have counted for
each assignee the total number of patents it possesses. Though this measure is certainly
positively correlated with other measures of size, it has its obvious limitation in the
interpretation of our results.
120
5 Stylized Facts and Findings
5.1 Software Patents
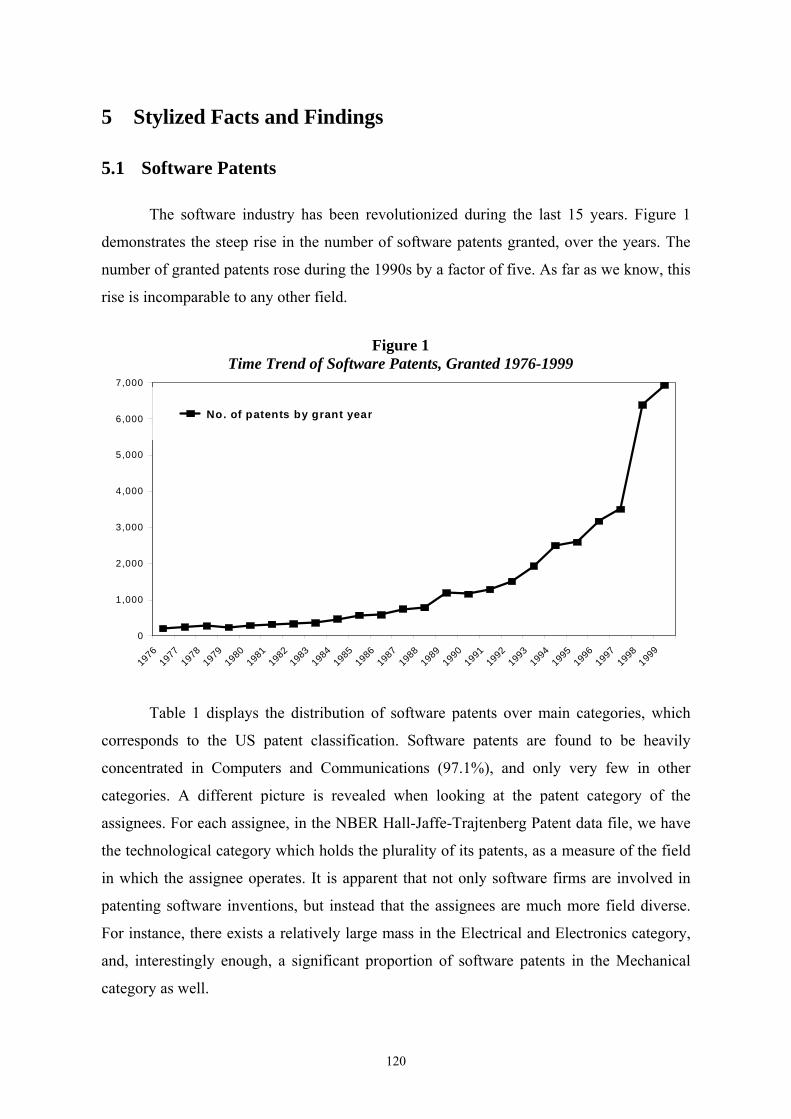
The software industry has been revolutionized during the last 15 years. Figure 1
demonstrates the steep rise in the number of software patents granted, over the years. The
number of granted patents rose during the 1990s by a factor of five. As far as we know, this
rise is incomparable to any other field.
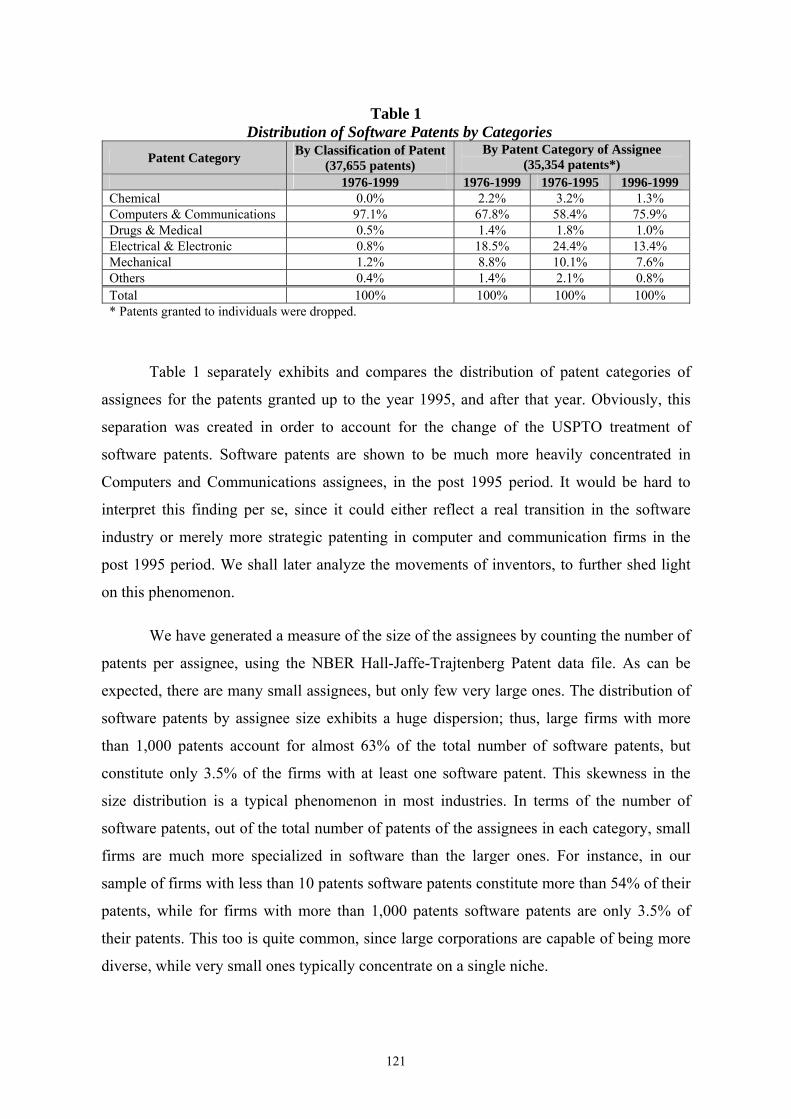
Table 1 displays the distribution of software patents over main categories, which
corresponds to the US patent classification. Software patents are found to be heavily
concentrated in Computers and Communications (97.1%), and only very few in other
categories. A different picture is revealed when looking at the patent category of the
assignees. For each assignee, in the NBER Hall-Jaffe-Trajtenberg Patent data file, we have
the technological category which holds the plurality of its patents, as a measure of the field
in which the assignee operates. It is apparent that not only software firms are involved in
patenting software inventions, but instead that the assignees are much more field diverse.
For instance, there exists a relatively large mass in the Electrical and Electronics category,
and, interestingly enough, a significant proportion of software patents in the Mechanical
category as well.
Figure 1 Time Trend of Software Patents, Granted 1976-1999
0
1,000
2,000
3,000
4,000
5,000
6,000
7,000
19761977
19781979
19801981
19821983
19841985
19861987
19881989
19901991
19921993
19941995
19961997
19981999
No. of patents by grant year
121
Table 1 Distribution of Software Patents by Categories
Patent Category By Classification of Patent (37,655 patents)
By Patent Category of Assignee (35,354 patents*)
1976-1999 1976-1999 1976-1995 1996-1999 Chemical 0.0% 2.2% 3.2% 1.3% Computers & Communications 97.1% 67.8% 58.4% 75.9% Drugs & Medical 0.5% 1.4% 1.8% 1.0% Electrical & Electronic 0.8% 18.5% 24.4% 13.4% Mechanical 1.2% 8.8% 10.1% 7.6% Others 0.4% 1.4% 2.1% 0.8% Total 100% 100% 100% 100% * Patents granted to individuals were dropped.
Table 1 separately exhibits and compares the distribution of patent categories of
assignees for the patents granted up to the year 1995, and after that year. Obviously, this
separation was created in order to account for the change of the USPTO treatment of
software patents. Software patents are shown to be much more heavily concentrated in
Computers and Communications assignees, in the post 1995 period. It would be hard to
interpret this finding per se, since it could either reflect a real transition in the software
industry or merely more strategic patenting in computer and communication firms in the
post 1995 period. We shall later analyze the movements of inventors, to further shed light
on this phenomenon.
We have generated a measure of the size of the assignees by counting the number of
patents per assignee, using the NBER Hall-Jaffe-Trajtenberg Patent data file. As can be
expected, there are many small assignees, but only few very large ones. The distribution of
software patents by assignee size exhibits a huge dispersion; thus, large firms with more
than 1,000 patents account for almost 63% of the total number of software patents, but
constitute only 3.5% of the firms with at least one software patent. This skewness in the
size distribution is a typical phenomenon in most industries. In terms of the number of
software patents, out of the total number of patents of the assignees in each category, small
firms are much more specialized in software than the larger ones. For instance, in our
sample of firms with less than 10 patents software patents constitute more than 54% of their
patents, while for firms with more than 1,000 patents software patents are only 3.5% of
their patents. This too is quite common, since large corporations are capable of being more
diverse, while very small ones typically concentrate on a single niche.
122
Knowledge in the software industry is more cumulative in nature than in other
industries, as stated, for instance, by Layne-Farrar (2005) and Schacht (2006). This
characteristic is reflected in our data, as, non-software patents applied for between 1990 and
1995 are found to have received, on average, 6.8 citations by the year 2002, whereas
software patents applied for during that same period have received 14.5 citations, on
average. Similar results have been obtained while comparing other periods as well.
5.2 Software Inventors and their Patents
Though the trends and specifications of software patents, as have just been
presented might be known, knowledge of the profile of a software inventor seems to be
much more limited. This section attempts to shed some light on this issue.
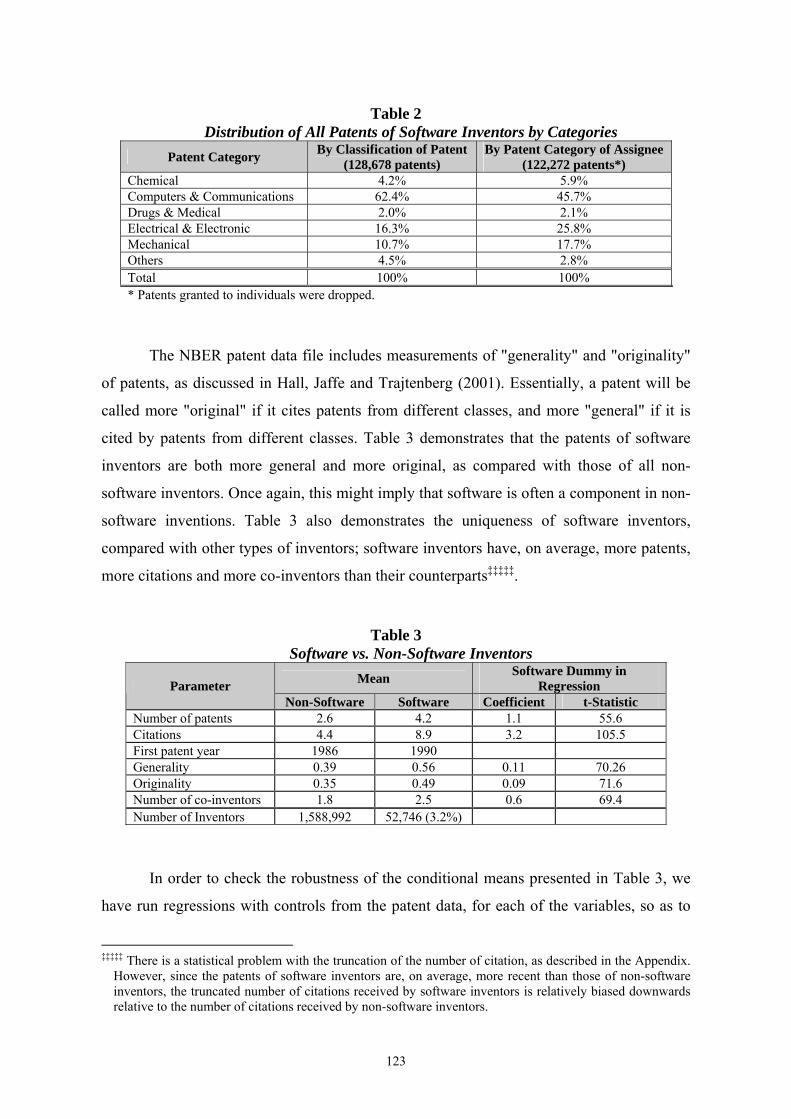
Table 2 shows the distribution, over the six categories, of all the patents - software
and non-software - of software inventors. As opposed to the results shown in Table 1, the
patents are no longer concentrated in a single category. As can be seen, software inventors
do not typically patent solely in Computers and Communications. One plausible
interpretation to this phenomenon may be that software inventors are not confined in their
skills to just pure-software innovations, and instead they show versatility by inventing also
in various other fields, where software may be an important component of the innovation.
Additional evidence supporting the paradigm that software inventors are well integrated not
only in pure software firms, can be found by examining the distribution of the patents
created by software inventors over the patent categories of the assignees. Thus it becomes
apparent that a very large mass of the distribution is to be found not in Computers and
Communications, but rather in categories such as Electrical and Electronics, Mechanics and
others.
123
Table 2 Distribution of All Patents of Software Inventors by Categories
Patent Category By Classification of Patent (128,678 patents)
By Patent Category of Assignee (122,272 patents*)
Chemical 4.2% 5.9% Computers & Communications 62.4% 45.7% Drugs & Medical 2.0% 2.1% Electrical & Electronic 16.3% 25.8% Mechanical 10.7% 17.7% Others 4.5% 2.8% Total 100% 100% * Patents granted to individuals were dropped.
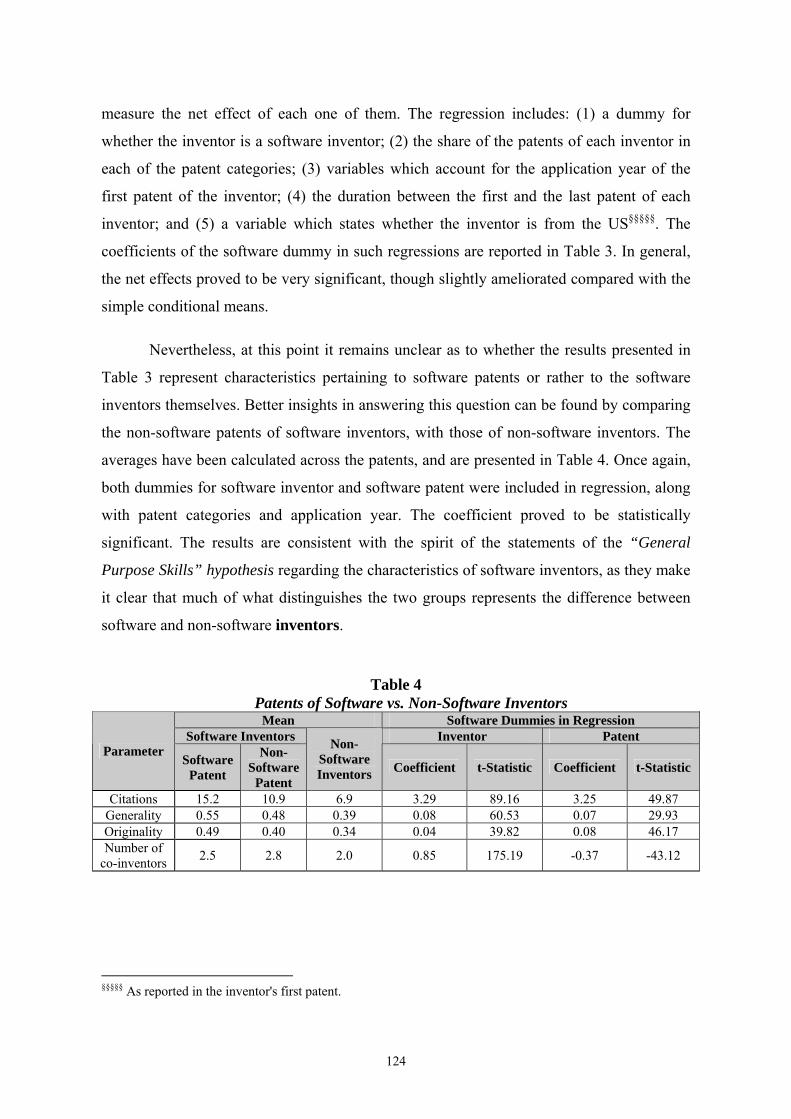
The NBER patent data file includes measurements of "generality" and "originality"
of patents, as discussed in Hall, Jaffe and Trajtenberg (2001). Essentially, a patent will be
called more "original" if it cites patents from different classes, and more "general" if it is
cited by patents from different classes. Table 3 demonstrates that the patents of software
inventors are both more general and more original, as compared with those of all non-
software inventors. Once again, this might imply that software is often a component in non-
software inventions. Table 3 also demonstrates the uniqueness of software inventors,
compared with other types of inventors; software inventors have, on average, more patents,
more citations and more co-inventors than their counterparts‡‡‡‡‡.
Table 3 Software vs. Non-Software Inventors
Mean Software Dummy in Regression Parameter
Non-Software Software Coefficient t-Statistic Number of patents 2.6 4.2 1.1 55.6 Citations 4.4 8.9 3.2 105.5 First patent year 1986 1990 Generality 0.39 0.56 0.11 70.26 Originality 0.35 0.49 0.09 71.6 Number of co-inventors 1.8 2.5 0.6 69.4 Number of Inventors 1,588,992 52,746 (3.2%)
In order to check the robustness of the conditional means presented in Table 3, we
have run regressions with controls from the patent data, for each of the variables, so as to
‡‡‡‡‡ There is a statistical problem with the truncation of the number of citation, as described in the Appendix.
However, since the patents of software inventors are, on average, more recent than those of non-software inventors, the truncated number of citations received by software inventors is relatively biased downwards relative to the number of citations received by non-software inventors.
124
measure the net effect of each one of them. The regression includes: (1) a dummy for
whether the inventor is a software inventor; (2) the share of the patents of each inventor in
each of the patent categories; (3) variables which account for the application year of the
first patent of the inventor; (4) the duration between the first and the last patent of each
inventor; and (5) a variable which states whether the inventor is from the US§§§§§. The
coefficients of the software dummy in such regressions are reported in Table 3. In general,
the net effects proved to be very significant, though slightly ameliorated compared with the
simple conditional means.
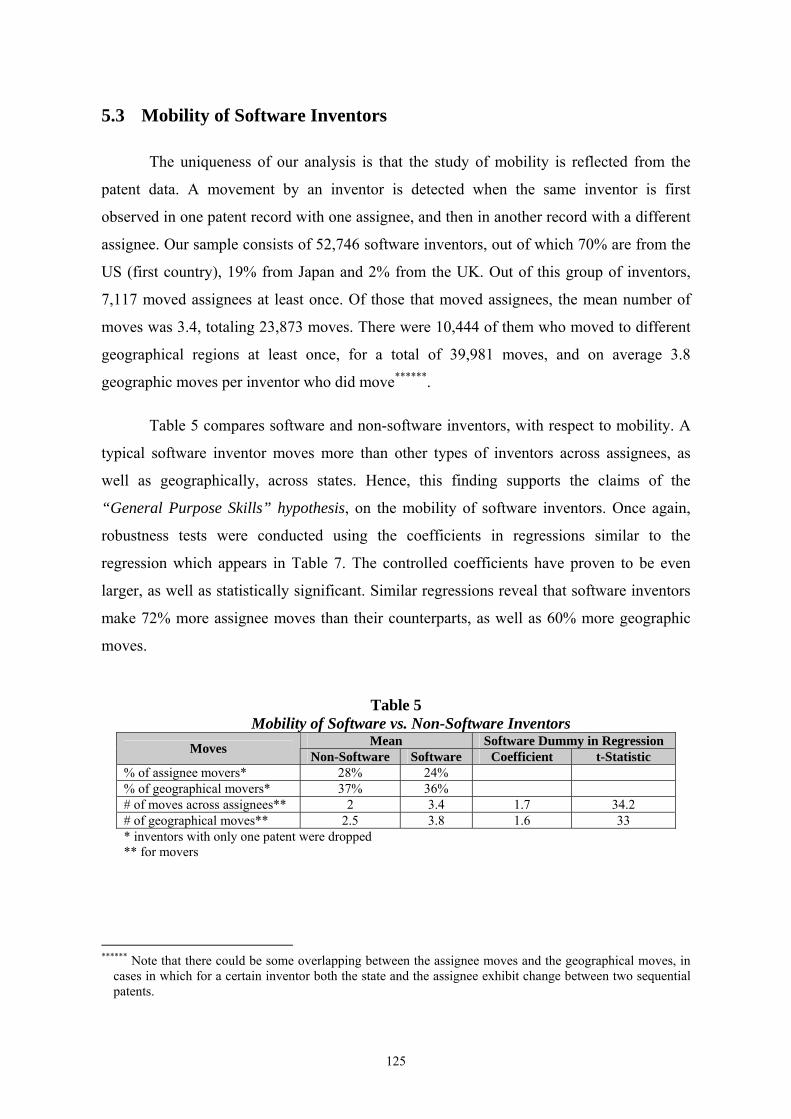
Nevertheless, at this point it remains unclear as to whether the results presented in
Table 3 represent characteristics pertaining to software patents or rather to the software
inventors themselves. Better insights in answering this question can be found by comparing
the non-software patents of software inventors, with those of non-software inventors. The
averages have been calculated across the patents, and are presented in Table 4. Once again,
both dummies for software inventor and software patent were included in regression, along
with patent categories and application year. The coefficient proved to be statistically
significant. The results are consistent with the spirit of the statements of the “General
Purpose Skills” hypothesis regarding the characteristics of software inventors, as they make
it clear that much of what distinguishes the two groups represents the difference between
software and non-software inventors.
Table 4 Patents of Software vs. Non-Software Inventors
Mean Software Dummies in Regression Software Inventors Inventor Patent
Parameter Software Patent
Non-Software
Patent
Non-Software Inventors Coefficient t-Statistic Coefficient t-Statistic
Citations 15.2 10.9 6.9 3.29 89.16 3.25 49.87 Generality 0.55 0.48 0.39 0.08 60.53 0.07 29.93 Originality 0.49 0.40 0.34 0.04 39.82 0.08 46.17 Number of
co-inventors 2.5 2.8 2.0 0.85 175.19 -0.37 -43.12
§§§§§ As reported in the inventor's first patent.
125
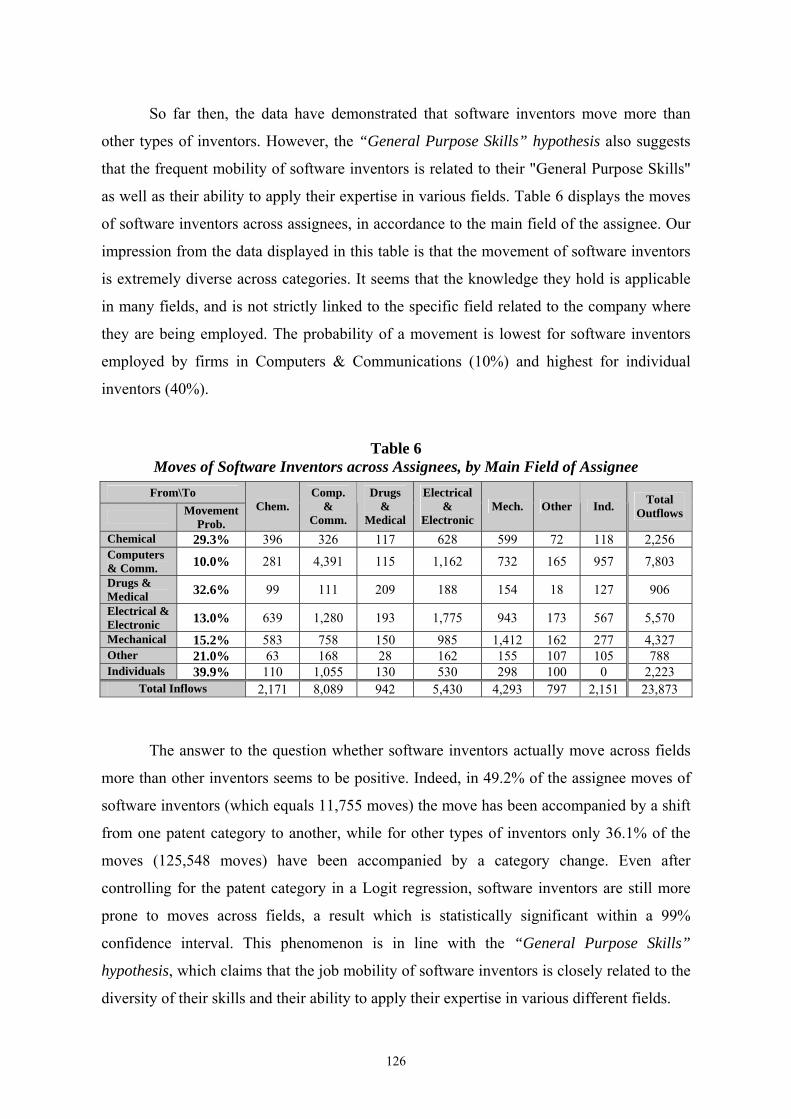
5.3 Mobility of Software Inventors
The uniqueness of our analysis is that the study of mobility is reflected from the
patent data. A movement by an inventor is detected when the same inventor is first
observed in one patent record with one assignee, and then in another record with a different
assignee. Our sample consists of 52,746 software inventors, out of which 70% are from the
US (first country), 19% from Japan and 2% from the UK. Out of this group of inventors,
7,117 moved assignees at least once. Of those that moved assignees, the mean number of
moves was 3.4, totaling 23,873 moves. There were 10,444 of them who moved to different
geographical regions at least once, for a total of 39,981 moves, and on average 3.8
geographic moves per inventor who did move******.
Table 5 compares software and non-software inventors, with respect to mobility. A
typical software inventor moves more than other types of inventors across assignees, as
well as geographically, across states. Hence, this finding supports the claims of the
“General Purpose Skills” hypothesis, on the mobility of software inventors. Once again,
robustness tests were conducted using the coefficients in regressions similar to the
regression which appears in Table 7. The controlled coefficients have proven to be even
larger, as well as statistically significant. Similar regressions reveal that software inventors
make 72% more assignee moves than their counterparts, as well as 60% more geographic
moves.
Table 5 Mobility of Software vs. Non-Software Inventors
Mean Software Dummy in Regression Moves Non-Software Software Coefficient t-Statistic % of assignee movers* 28% 24% % of geographical movers* 37% 36% # of moves across assignees** 2 3.4 1.7 34.2 # of geographical moves** 2.5 3.8 1.6 33 * inventors with only one patent were dropped ** for movers
****** Note that there could be some overlapping between the assignee moves and the geographical moves, in
cases in which for a certain inventor both the state and the assignee exhibit change between two sequential patents.
126
So far then, the data have demonstrated that software inventors move more than
other types of inventors. However, the “General Purpose Skills” hypothesis also suggests
that the frequent mobility of software inventors is related to their "General Purpose Skills"
as well as their ability to apply their expertise in various fields. Table 6 displays the moves
of software inventors across assignees, in accordance to the main field of the assignee. Our
impression from the data displayed in this table is that the movement of software inventors
is extremely diverse across categories. It seems that the knowledge they hold is applicable
in many fields, and is not strictly linked to the specific field related to the company where
they are being employed. The probability of a movement is lowest for software inventors
employed by firms in Computers & Communications (10%) and highest for individual
inventors (40%).
Table 6 Moves of Software Inventors across Assignees, by Main Field of Assignee
From\To
Movement Prob.
Chem. Comp.
& Comm.
Drugs &
Medical
Electrical &
Electronic Mech. Other Ind. Total
Outflows
Chemical 29.3% 396 326 117 628 599 72 118 2,256 Computers & Comm. 10.0% 281 4,391 115 1,162 732 165 957 7,803 Drugs & Medical 32.6% 99 111 209 188 154 18 127 906 Electrical & Electronic 13.0% 639 1,280 193 1,775 943 173 567 5,570 Mechanical 15.2% 583 758 150 985 1,412 162 277 4,327 Other 21.0% 63 168 28 162 155 107 105 788 Individuals 39.9% 110 1,055 130 530 298 100 0 2,223
Total Inflows 2,171 8,089 942 5,430 4,293 797 2,151 23,873
The answer to the question whether software inventors actually move across fields
more than other inventors seems to be positive. Indeed, in 49.2% of the assignee moves of
software inventors (which equals 11,755 moves) the move has been accompanied by a shift
from one patent category to another, while for other types of inventors only 36.1% of the
moves (125,548 moves) have been accompanied by a category change. Even after
controlling for the patent category in a Logit regression, software inventors are still more
prone to moves across fields, a result which is statistically significant within a 99%
confidence interval. This phenomenon is in line with the “General Purpose Skills”
hypothesis, which claims that the job mobility of software inventors is closely related to the
diversity of their skills and their ability to apply their expertise in various different fields.
127
Taking this analysis a step further might provide some insights on whether mobility
is related to matching or to recombination between the inventor and the firm. Implicitly, a
matching mechanism would imply that inventors are likely to move to a firm where the
technological focus is more closely related to their own expertise. By contrast, a
recombination mechanism would imply that some degree of diversity is required for
successful match between the inventor and the firm to occur. In order to test which one of
these two competing hypotheses is supported by our data, we needed to construct some
measure of technological closeness, and used one similar to that introduced by Jaffe (1986).
The variable we constructed, DIFF_W_ASSIG, measures how technologically different is
the patenting history of the inventor, from that of the assignee she is currently working
for††††††. By construction, it is a decreasing function of the similarity of their histories. We
then took the sample of assignee moves, excluding the moves which involve being an
individual inventor ("garage"). In this sample of 19,499 moves, the average value of the
DIFF_W_ASSIG measure is 0.249 for the firms the inventors move from, and 0.293 for the
firms the inventors move to. Since this difference is statistically significant within a 99%
confidence interval, we conclude that the results of our analysis are more supportive of the
recombination story, in which inventors move to firms involved in various areas much
different from the focus of their past research.
Table 6 also shows that the categories which experience positive net flows of
software inventors are Computers and Communications (286 inventors) and, interestingly
enough, also the Drugs and Medical category (36 inventors). This analysis supplies
evidence that the identity of the firms engaged in software invention has been changing
over time. The large negative net flow from Electrical and Electronics, presumably suggests
that the semiconductors firms have lost software inventors to firms which are more
specialized in software. These findings, combined with the trends in software patents,
shown in Table 1, can now be jointly interpreted as reflecting a true transition of software
inventions towards pure-software firms‡‡‡‡‡‡. It is interesting to note that these findings are
†††††† See the appendix for exact information on how this variable is constructed. ‡‡‡‡‡‡ It is important to emphasize that by our definition a software firm is a firm for which most of its patents
are in software. Bessen and Hunt (2004) use Compustat definitions and find that most software patents do not come from the software industry: "Manufacturers of machinery, electronics, and instruments employed only 6% of all computer programmers and yet they obtained 2 out of 3 software patents. Firms outside the manufacturing sector employed 9 out of 10 computer programmers; but together they accounted for only 1 out of 4 software patents". On the other hand, Farrar (2005) has found that their sample may include many non-software patents as well. These statistics could be exaggerated due to that fact.
128
in a complete contrast to the conjectures of Irlam and Williams (1994), who have forecasted
that the introduction of software patents would be devastating for small software firms.
However, it is still unclear whether this phenomenon is a result of the policy changes of the
USPTO, or rather reflects a more fundamental and exogenous process in the software
industry, namely, the gradual transition towards more and more generic software
inventions. On the one hand, Graham and Mowery (2003) have stated that the U.S. and
global computer software industries have been transformed during the past 20 years, such
that the revenues of leading firms are no longer dominated by sales of products that
incorporate high levels of user-specific customization. Instead, the dominant firms in the
U.S. software industry rely on sales of standard products to mass markets. On the other
hand, Hall and MacGarvie (2006) have claimed that the change in the USPTO policy
regarding software patents has resulted in a higher patent value for upstream firms than to
downstream firm. They have also found that after 1994, an increase in the software patent
yield per R&D dollar has been associated with a larger increase in market value for a
software firm. These findings suggest that the policy change per se might have stirred the
change in the industry. Still, it remains unclear whether this effect is actually due to the
policy change or to the "internet bubble", which took place in the second half of the 1990s.
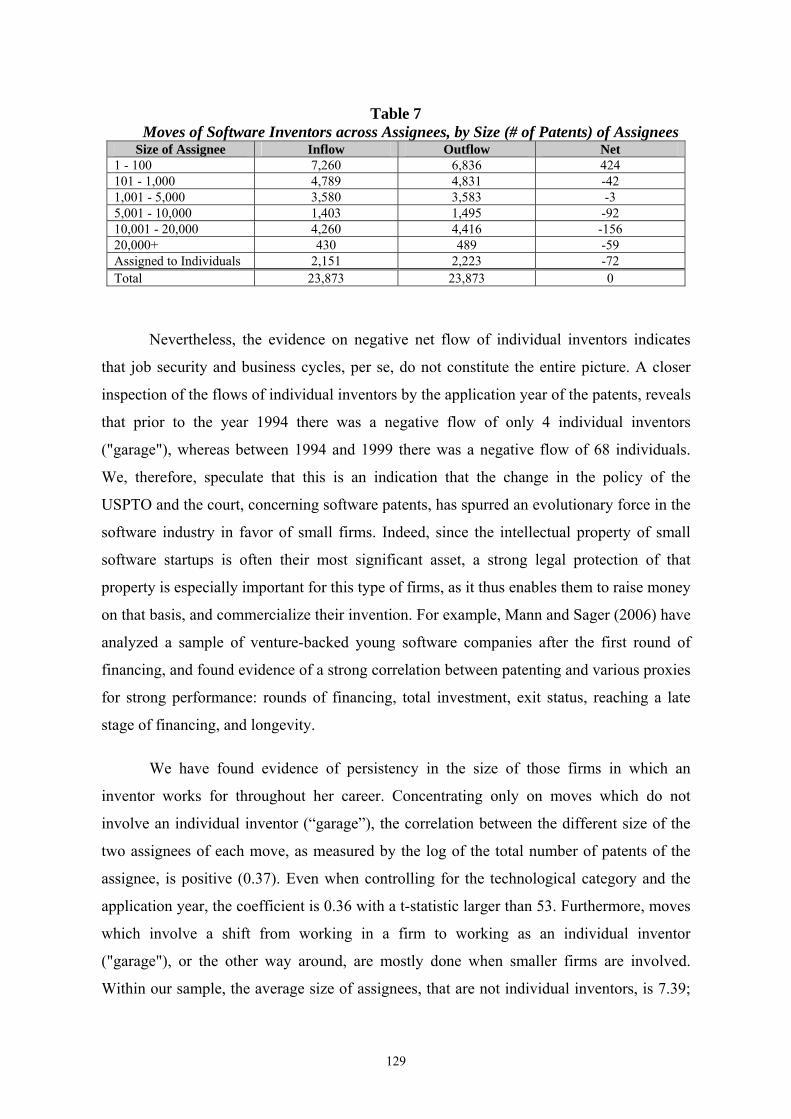
Table 7 shows the net flows of moves by software inventors across assignees,
depending on the size of assignee. The proxy for size is calculated as the total number of
patents of each assignee. The most striking result is that there is a net inflow into the very
small firms. Combined with our previous findings, we are now inclined to say that the
evidence suggests a movement of software inventors towards small software firms. Once
again, the data reveal trends which are exactly the opposite of the ones predicted by Irlam
and Williams (1994). It is important to note, however, that the last years of our sample
represent a period of "boom" in the business cycle of the software industry. Furthermore,
since job security is usually better in large firms than in smaller ones§§§§§§, the movement of
inventors towards the smaller companies might be due to the fact that during “boom”
periods, employees are more inclined to take occupational risks than in times of recession.
§§§§§§ See for example Topel and Ward (1992).
129
Table 7 Moves of Software Inventors across Assignees, by Size (# of Patents) of Assignees
Size of Assignee Inflow Outflow Net 1 - 100 7,260 6,836 424 101 - 1,000 4,789 4,831 -42 1,001 - 5,000 3,580 3,583 -3 5,001 - 10,000 1,403 1,495 -92 10,001 - 20,000 4,260 4,416 -156 20,000+ 430 489 -59 Assigned to Individuals 2,151 2,223 -72 Total 23,873 23,873 0
Nevertheless, the evidence on negative net flow of individual inventors indicates
that job security and business cycles, per se, do not constitute the entire picture. A closer
inspection of the flows of individual inventors by the application year of the patents, reveals
that prior to the year 1994 there was a negative flow of only 4 individual inventors
("garage"), whereas between 1994 and 1999 there was a negative flow of 68 individuals.
We, therefore, speculate that this is an indication that the change in the policy of the
USPTO and the court, concerning software patents, has spurred an evolutionary force in the
software industry in favor of small firms. Indeed, since the intellectual property of small
software startups is often their most significant asset, a strong legal protection of that
property is especially important for this type of firms, as it thus enables them to raise money
on that basis, and commercialize their invention. For example, Mann and Sager (2006) have
analyzed a sample of venture-backed young software companies after the first round of
financing, and found evidence of a strong correlation between patenting and various proxies
for strong performance: rounds of financing, total investment, exit status, reaching a late
stage of financing, and longevity.
We have found evidence of persistency in the size of those firms in which an
inventor works for throughout her career. Concentrating only on moves which do not
involve an individual inventor (“garage”), the correlation between the different size of the
two assignees of each move, as measured by the log of the total number of patents of the
assignee, is positive (0.37). Even when controlling for the technological category and the
application year, the coefficient is 0.36 with a t-statistic larger than 53. Furthermore, moves
which involve a shift from working in a firm to working as an individual inventor
("garage"), or the other way around, are mostly done when smaller firms are involved.
Within our sample, the average size of assignees, that are not individual inventors, is 7.39;
130
whereas the average size of such firms, to which an individual inventor moved into is 5.19;
and finally the average size of such firms, from which an inventor moves from into being an
individual inventor is 5.43.
Having established these insights regarding trends in the movement of software
inventors, we then constructed a Logit regression, which appears in Table 8, in order to
more rigorously analyze the factors which affect the likelihood of a software inventor to
move assignees for each of her patents. The work process was as follows. Each inventor
corresponded to a sequence of patents. The first patent was dropped, since it is impossible
to identify any movement from the first patent. As for the rest of the patents, we have built
the dependent variable to be a dummy for whether the inventor has moved assignees
between her current patent and her previous one. Elaborated explanations on the variables
used in this regression are presented in the Appendix. The Logit regression incorporated
weights, proportional to the time span between the current patent and the previous
one*******. The results of the analysis are described hereinafter, in the following paragraphs.
******* Note that since all the data are conditional on patenting, one must find a way to incorporate calendar
time into the analysis. To illustrate this point consider two inventors, one patents every year, and the other every 5 years. Suppose that they both switched assignee every 5 years. For the first, the dataset would include 4 records without mobility for every one with mobility, while for the second all of the records would show mobility. This example demonstrates that when the time span between two patents is very short, the data of whether the inventor moved or not is less informative.
131
Table 8 Mobility of Inventors
Dependent Variable: MOVE_ASSIG Method: ML - Binary Logit; 6 iterations; QML (Huber/White) standard errors; Sample: 1 221546 IF PAT_SEQ>1
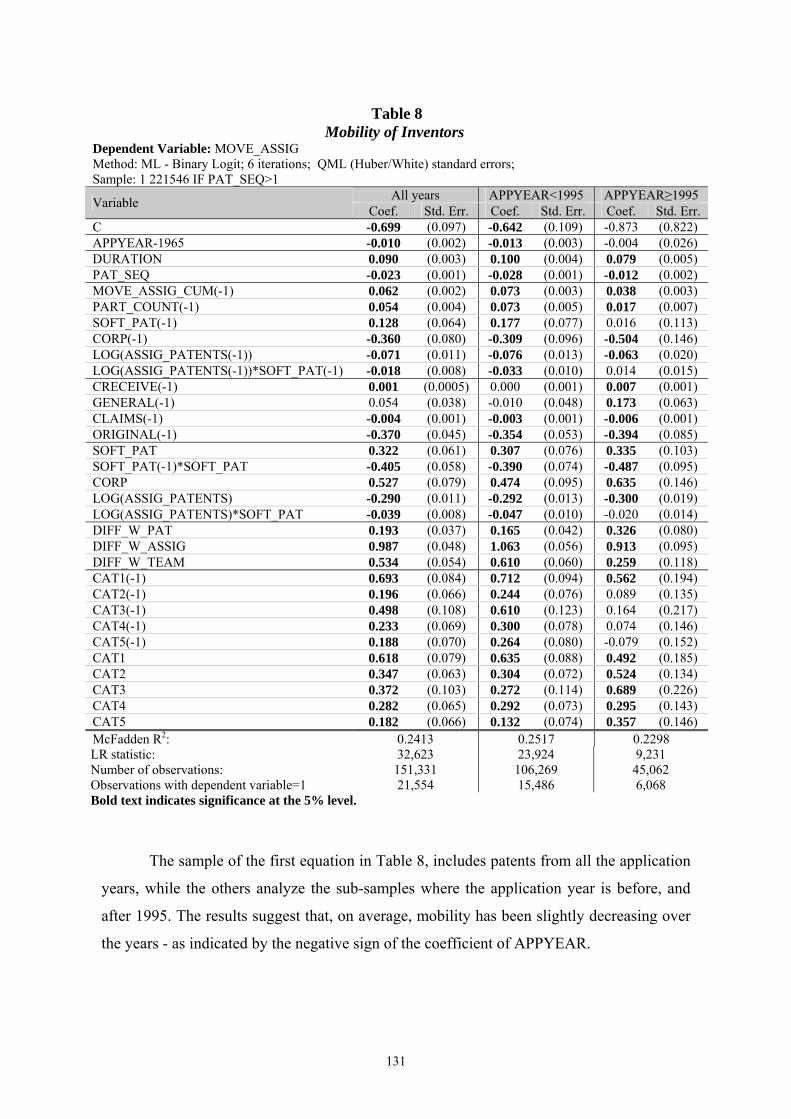
All years APPYEAR<1995 APPYEAR≥1995 Variable Coef. Std. Err. Coef. Std. Err. Coef. Std. Err. C -0.699 (0.097) -0.642 (0.109) -0.873 (0.822) APPYEAR-1965 -0.010 (0.002) -0.013 (0.003) -0.004 (0.026) DURATION 0.090 (0.003) 0.100 (0.004) 0.079 (0.005) PAT_SEQ -0.023 (0.001) -0.028 (0.001) -0.012 (0.002) MOVE_ASSIG_CUM(-1) 0.062 (0.002) 0.073 (0.003) 0.038 (0.003) PART_COUNT(-1) 0.054 (0.004) 0.073 (0.005) 0.017 (0.007) SOFT_PAT(-1) 0.128 (0.064) 0.177 (0.077) 0.016 (0.113) CORP(-1) -0.360 (0.080) -0.309 (0.096) -0.504 (0.146) LOG(ASSIG_PATENTS(-1)) -0.071 (0.011) -0.076 (0.013) -0.063 (0.020) LOG(ASSIG_PATENTS(-1))*SOFT_PAT(-1) -0.018 (0.008) -0.033 (0.010) 0.014 (0.015) CRECEIVE(-1) 0.001 (0.0005) 0.000 (0.001) 0.007 (0.001) GENERAL(-1) 0.054 (0.038) -0.010 (0.048) 0.173 (0.063) CLAIMS(-1) -0.004 (0.001) -0.003 (0.001) -0.006 (0.001) ORIGINAL(-1) -0.370 (0.045) -0.354 (0.053) -0.394 (0.085) SOFT_PAT 0.322 (0.061) 0.307 (0.076) 0.335 (0.103) SOFT_PAT(-1)*SOFT_PAT -0.405 (0.058) -0.390 (0.074) -0.487 (0.095) CORP 0.527 (0.079) 0.474 (0.095) 0.635 (0.146) LOG(ASSIG_PATENTS) -0.290 (0.011) -0.292 (0.013) -0.300 (0.019) LOG(ASSIG_PATENTS)*SOFT_PAT -0.039 (0.008) -0.047 (0.010) -0.020 (0.014) DIFF_W_PAT 0.193 (0.037) 0.165 (0.042) 0.326 (0.080) DIFF_W_ASSIG 0.987 (0.048) 1.063 (0.056) 0.913 (0.095) DIFF_W_TEAM 0.534 (0.054) 0.610 (0.060) 0.259 (0.118) CAT1(-1) 0.693 (0.084) 0.712 (0.094) 0.562 (0.194) CAT2(-1) 0.196 (0.066) 0.244 (0.076) 0.089 (0.135) CAT3(-1) 0.498 (0.108) 0.610 (0.123) 0.164 (0.217) CAT4(-1) 0.233 (0.069) 0.300 (0.078) 0.074 (0.146) CAT5(-1) 0.188 (0.070) 0.264 (0.080) -0.079 (0.152) CAT1 0.618 (0.079) 0.635 (0.088) 0.492 (0.185) CAT2 0.347 (0.063) 0.304 (0.072) 0.524 (0.134) CAT3 0.372 (0.103) 0.272 (0.114) 0.689 (0.226) CAT4 0.282 (0.065) 0.292 (0.073) 0.295 (0.143) CAT5 0.182 (0.066) 0.132 (0.074) 0.357 (0.146) McFadden R2: 0.2413 0.2517 0.2298 LR statistic: 32,623 23,924 9,231 Number of observations: 151,331 106,269 45,062 Observations with dependent variable=1 21,554 15,486 6,068 Bold text indicates significance at the 5% level.
The sample of the first equation in Table 8, includes patents from all the application
years, while the others analyze the sub-samples where the application year is before, and
after 1995. The results suggest that, on average, mobility has been slightly decreasing over
the years - as indicated by the negative sign of the coefficient of APPYEAR.
132
The signs of the coefficients of DURATION and PAT_SEQ should be interpreted
together. Thus, inventors who are very productive have a decreasing probability to move
assignees, as their careers progress. Conversely, less productive inventors are characterized
by a higher probability of moving in later periods of their career. This finding is consistent
with the aforementioned finding by Hoisl (2007), that inventors with higher productivity are
less likely to move.
Moreover, inventors who have already moved in the past are more inclined to move
again. Inventors who work in a corporation are less likely to move, and even more so in the
post-1995 sample. Inventors are also less likely to move when working for an assignee with
a large number of patents; however, if they do move, the move is more likely to be to
assignees with a small amount of patents†††††††. This phenomenon is stronger for inventors
who patent software.
As we found evidence that software inventors are more likely to switch patent
category while moving from one assignee to another, we then wanted to further check this
phenomena after controlling for the various other variables we have in Table 8. For that
purpose, we have introduced the three variables DIFF_W_ASSIG, DIFF_W_PAT and
DIFF_W_TEAM, into the Logit regression. These variables measure how different is the
patenting history of the inventor from (a) the patenting history of the assignee; (b) the
patent category of the current patent; and (c) the patenting history of the team-member with
whom the inventor is currently working with. The results suggest that all three variables
have positive correlation with mobility. These findings support our previous analysis and
confirm the "General Purpose Skills" Hypothesis, indicating that mobility of software
inventors is often associated with their ability to apply their skills in inventions, teams and
firms which are different from their patenting history. Job mobility may also be their way of
breaking their career path and divert their research focus into new trajectories. An
alternative way of interpreting these findings is by taking the standpoint of the firms. The
results correspond in a very interesting manner to those found by Song, Almeida and Wu
(2003) for the semiconductors industry, who have found evidence that learning from a
††††††† We have also tried to build measures of age by taking the application year of the patent minus the first
application year of that assignee. Similarly, the results suggest that inventors are less likely to move when the assignee is “old”, yet are more likely to move to a “young” firm.
133
mobile engineer is more likely when the engineer possesses technological expertise distant
from that of the new hiring firm.
The "Asymmetric Information" Hypothesis predicts that asymmetric information
may play an important role in affecting the inclination of the inventor to move assignee.
Indeed, the ex-ante observable variables, CLAIMS and ORIGINAL, are found to decrease
the probability of a move, indicating on preemption, while the ex-ante unobserved
variables, CRECEIVE and GENERAL, are found to have a positive effect on movement,
after 1995‡‡‡‡‡‡‡.
However, this is merely an indication that the "Asymmetric Information" Hypothesis
is correct. An alternative story, yet similar in spirit, which is also consistent which such
findings is that the employer might not be able to capitalize on more general inventions, in
case in which the company is narrowly focused. Hence, the employer would be willing to
compensate the employee only in relation to her lower private value, rather than the higher
value of the patent for more general applications. Thus, a better statistical indication
supporting the "Asymmetric Information" Hypothesis would show the interaction between
these variables. Explicitly, asymmetric information is likely to play a role when both the ex-
ante observed variables are low and the ex-ante unobserved variables are high, i.e. mobility
should prove to be higher in cases when both the observed variables are low and the
unobserved are high. Therefore, we have constructed the ASYMMETIRC variable (see
appendix), which is largest when there is an interaction of both larger unobserved quality
measures, and small observed quality measures.
We first wanted to check that asymmetric information has indeed a positive effect
on the inclination of inventors to move assignees. Table 9 is similar to Table 8, yet only
variables which are known in the previous patent are included in it, and the asymmetric
information variable is included. The first regression validates the hypothesis that this
variable has a positive and statistically significant effect on mobility.
‡‡‡‡‡‡‡ It still remains unclear to us why these coefficients are not robust in the pre-1995 sample. Perhaps it has
to so with the fact that these two variables suffer from truncation. The post-1995 sample is more homogeneous, and thus this problem might prove to be less severe in this sample.
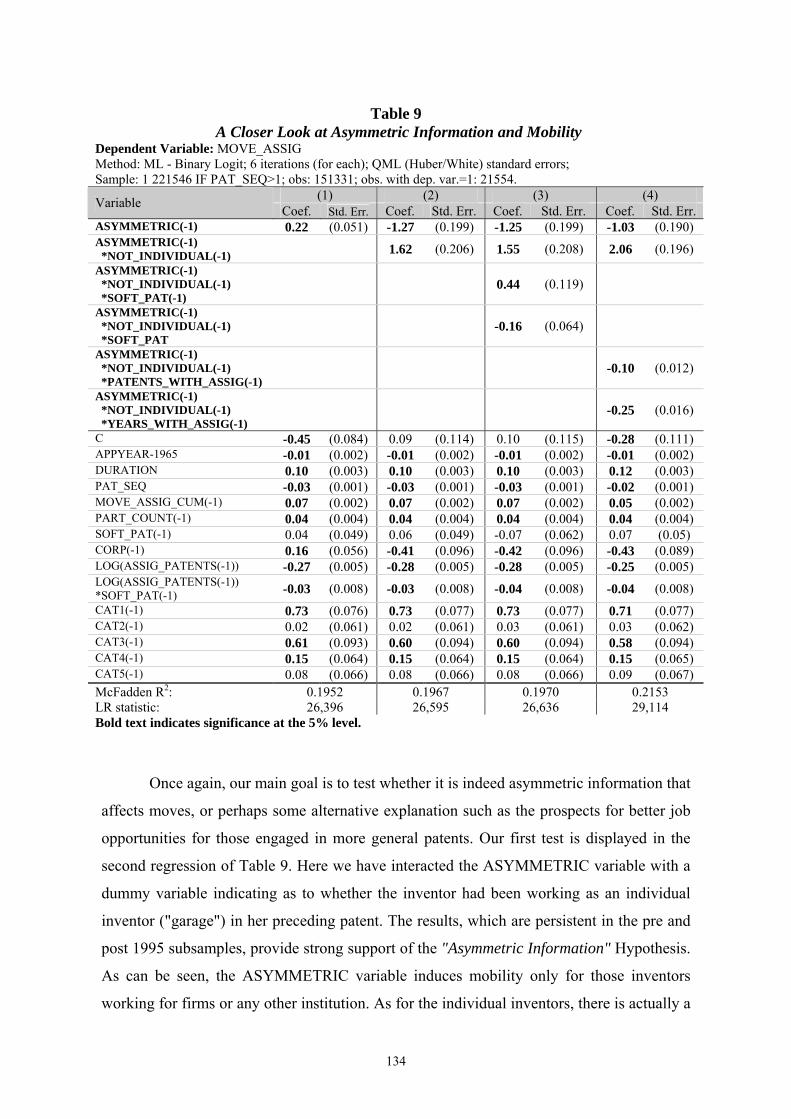
134
Table 9 A Closer Look at Asymmetric Information and Mobility
Dependent Variable: MOVE_ASSIG Method: ML - Binary Logit; 6 iterations (for each); QML (Huber/White) standard errors; Sample: 1 221546 IF PAT_SEQ>1; obs: 151331; obs. with dep. var.=1: 21554.
(1) (2) (3) (4) Variable Coef. Std. Err. Coef. Std. Err. Coef. Std. Err. Coef. Std. Err. ASYMMETRIC(-1) 0.22 (0.051) -1.27 (0.199) -1.25 (0.199) -1.03 (0.190) ASYMMETRIC(-1) *NOT_INDIVIDUAL(-1) 1.62 (0.206) 1.55 (0.208) 2.06 (0.196) ASYMMETRIC(-1) *NOT_INDIVIDUAL(-1) *SOFT_PAT(-1)
0.44 (0.119)
ASYMMETRIC(-1) *NOT_INDIVIDUAL(-1) *SOFT_PAT
-0.16 (0.064)
ASYMMETRIC(-1) *NOT_INDIVIDUAL(-1) *PATENTS_WITH_ASSIG(-1)
-0.10 (0.012)
ASYMMETRIC(-1) *NOT_INDIVIDUAL(-1) *YEARS_WITH_ASSIG(-1)
-0.25 (0.016)
C -0.45 (0.084) 0.09 (0.114) 0.10 (0.115) -0.28 (0.111) APPYEAR-1965 -0.01 (0.002) -0.01 (0.002) -0.01 (0.002) -0.01 (0.002) DURATION 0.10 (0.003) 0.10 (0.003) 0.10 (0.003) 0.12 (0.003) PAT_SEQ -0.03 (0.001) -0.03 (0.001) -0.03 (0.001) -0.02 (0.001) MOVE_ASSIG_CUM(-1) 0.07 (0.002) 0.07 (0.002) 0.07 (0.002) 0.05 (0.002) PART_COUNT(-1) 0.04 (0.004) 0.04 (0.004) 0.04 (0.004) 0.04 (0.004) SOFT_PAT(-1) 0.04 (0.049) 0.06 (0.049) -0.07 (0.062) 0.07 (0.05) CORP(-1) 0.16 (0.056) -0.41 (0.096) -0.42 (0.096) -0.43 (0.089) LOG(ASSIG_PATENTS(-1)) -0.27 (0.005) -0.28 (0.005) -0.28 (0.005) -0.25 (0.005) LOG(ASSIG_PATENTS(-1)) *SOFT_PAT(-1) -0.03 (0.008) -0.03 (0.008) -0.04 (0.008) -0.04 (0.008) CAT1(-1) 0.73 (0.076) 0.73 (0.077) 0.73 (0.077) 0.71 (0.077) CAT2(-1) 0.02 (0.061) 0.02 (0.061) 0.03 (0.061) 0.03 (0.062) CAT3(-1) 0.61 (0.093) 0.60 (0.094) 0.60 (0.094) 0.58 (0.094) CAT4(-1) 0.15 (0.064) 0.15 (0.064) 0.15 (0.064) 0.15 (0.065) CAT5(-1) 0.08 (0.066) 0.08 (0.066) 0.08 (0.066) 0.09 (0.067) McFadden R2: 0.1952 0.1967 0.1970 0.2153 LR statistic: 26,396 26,595 26,636 29,114 Bold text indicates significance at the 5% level.
Once again, our main goal is to test whether it is indeed asymmetric information that
affects moves, or perhaps some alternative explanation such as the prospects for better job
opportunities for those engaged in more general patents. Our first test is displayed in the
second regression of Table 9. Here we have interacted the ASYMMETRIC variable with a
dummy variable indicating as to whether the inventor had been working as an individual
inventor ("garage") in her preceding patent. The results, which are persistent in the pre and
post 1995 subsamples, provide strong support of the "Asymmetric Information" Hypothesis.
As can be seen, the ASYMMETRIC variable induces mobility only for those inventors
working for firms or any other institution. As for the individual inventors, there is actually a
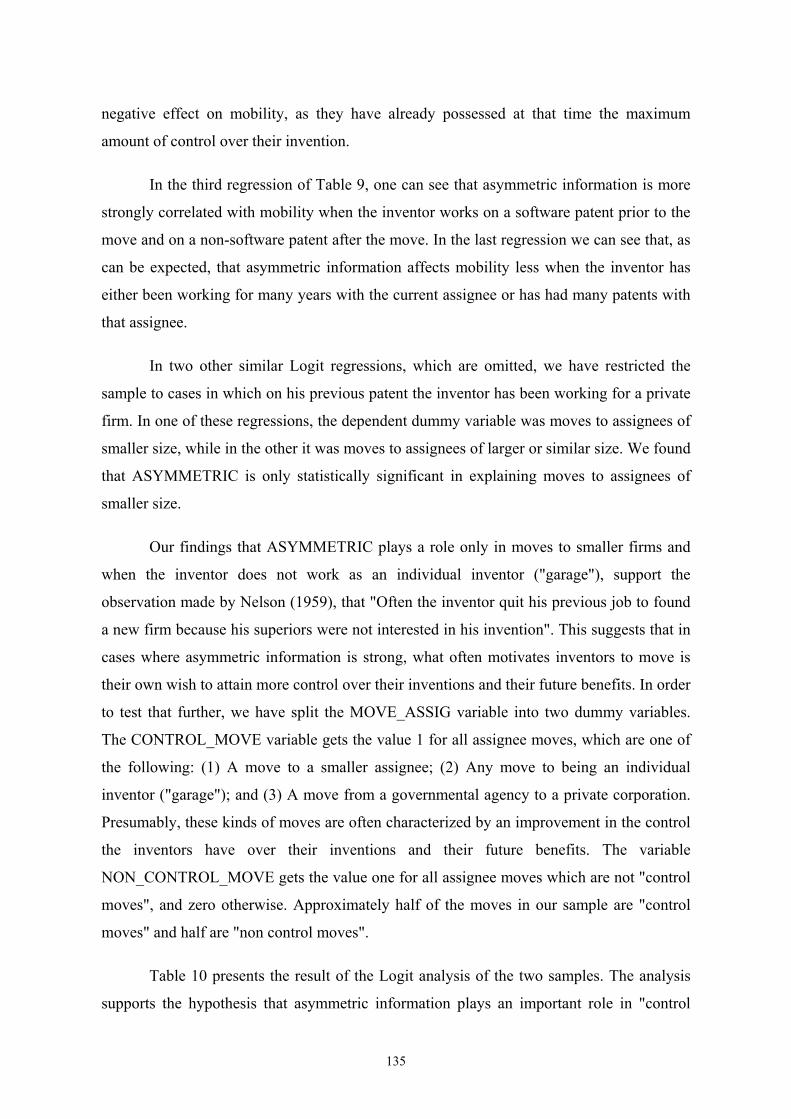
135
negative effect on mobility, as they have already possessed at that time the maximum
amount of control over their invention.
In the third regression of Table 9, one can see that asymmetric information is more
strongly correlated with mobility when the inventor works on a software patent prior to the
move and on a non-software patent after the move. In the last regression we can see that, as
can be expected, that asymmetric information affects mobility less when the inventor has
either been working for many years with the current assignee or has had many patents with
that assignee.
In two other similar Logit regressions, which are omitted, we have restricted the
sample to cases in which on his previous patent the inventor has been working for a private
firm. In one of these regressions, the dependent dummy variable was moves to assignees of
smaller size, while in the other it was moves to assignees of larger or similar size. We found
that ASYMMETRIC is only statistically significant in explaining moves to assignees of
smaller size.
Our findings that ASYMMETRIC plays a role only in moves to smaller firms and
when the inventor does not work as an individual inventor ("garage"), support the
observation made by Nelson (1959), that "Often the inventor quit his previous job to found
a new firm because his superiors were not interested in his invention". This suggests that in
cases where asymmetric information is strong, what often motivates inventors to move is
their own wish to attain more control over their inventions and their future benefits. In order
to test that further, we have split the MOVE_ASSIG variable into two dummy variables.
The CONTROL_MOVE variable gets the value 1 for all assignee moves, which are one of
the following: (1) A move to a smaller assignee; (2) Any move to being an individual
inventor ("garage"); and (3) A move from a governmental agency to a private corporation.
Presumably, these kinds of moves are often characterized by an improvement in the control
the inventors have over their inventions and their future benefits. The variable
NON_CONTROL_MOVE gets the value one for all assignee moves which are not "control
moves", and zero otherwise. Approximately half of the moves in our sample are "control
moves" and half are "non control moves".
Table 10 presents the result of the Logit analysis of the two samples. The analysis
supports the hypothesis that asymmetric information plays an important role in "control
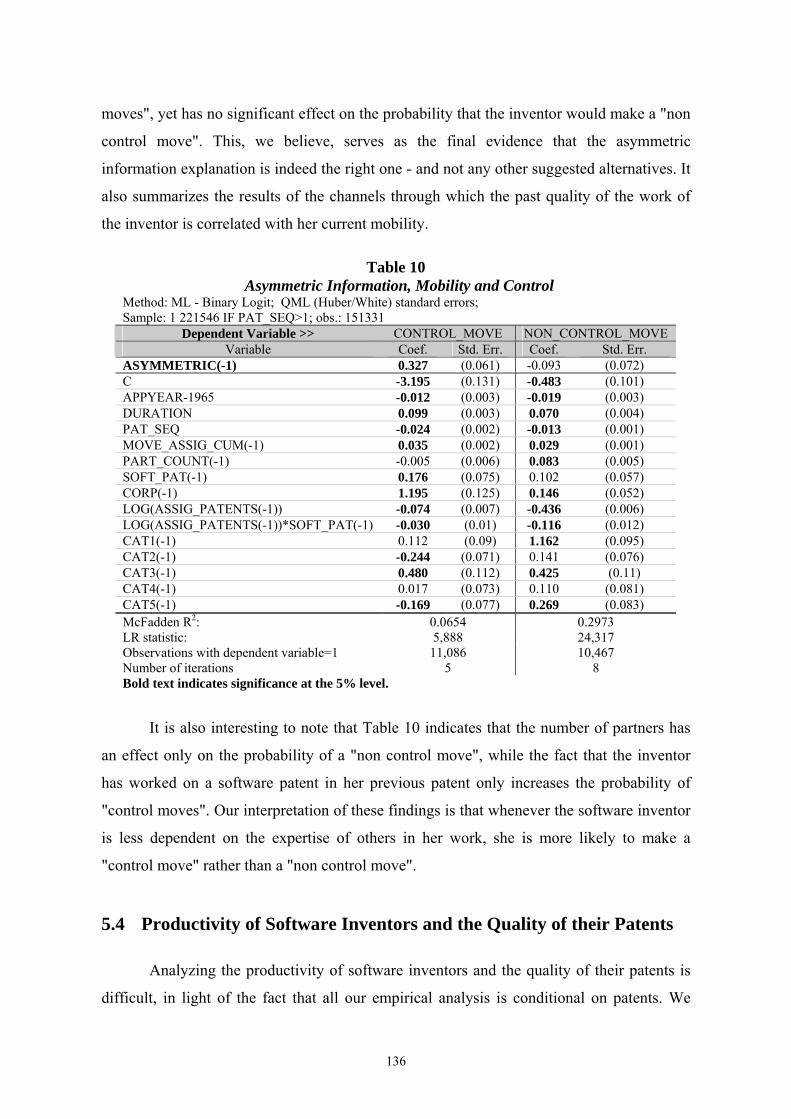
136
moves", yet has no significant effect on the probability that the inventor would make a "non
control move". This, we believe, serves as the final evidence that the asymmetric
information explanation is indeed the right one - and not any other suggested alternatives. It
also summarizes the results of the channels through which the past quality of the work of
the inventor is correlated with her current mobility.
Table 10 Asymmetric Information, Mobility and Control
Method: ML - Binary Logit; QML (Huber/White) standard errors; Sample: 1 221546 IF PAT_SEQ>1; obs.: 151331
Dependent Variable >> CONTROL_MOVE NON_CONTROL_MOVE Variable Coef. Std. Err. Coef. Std. Err.
ASYMMETRIC(-1) 0.327 (0.061) -0.093 (0.072) C -3.195 (0.131) -0.483 (0.101) APPYEAR-1965 -0.012 (0.003) -0.019 (0.003) DURATION 0.099 (0.003) 0.070 (0.004) PAT_SEQ -0.024 (0.002) -0.013 (0.001) MOVE_ASSIG_CUM(-1) 0.035 (0.002) 0.029 (0.001) PART_COUNT(-1) -0.005 (0.006) 0.083 (0.005) SOFT_PAT(-1) 0.176 (0.075) 0.102 (0.057) CORP(-1) 1.195 (0.125) 0.146 (0.052) LOG(ASSIG_PATENTS(-1)) -0.074 (0.007) -0.436 (0.006) LOG(ASSIG_PATENTS(-1))*SOFT_PAT(-1) -0.030 (0.01) -0.116 (0.012) CAT1(-1) 0.112 (0.09) 1.162 (0.095) CAT2(-1) -0.244 (0.071) 0.141 (0.076) CAT3(-1) 0.480 (0.112) 0.425 (0.11) CAT4(-1) 0.017 (0.073) 0.110 (0.081) CAT5(-1) -0.169 (0.077) 0.269 (0.083) McFadden R2: 0.0654 0.2973 LR statistic: 5,888 24,317 Observations with dependent variable=1 11,086 10,467 Number of iterations 5 8 Bold text indicates significance at the 5% level.
It is also interesting to note that Table 10 indicates that the number of partners has
an effect only on the probability of a "non control move", while the fact that the inventor
has worked on a software patent in her previous patent only increases the probability of
"control moves". Our interpretation of these findings is that whenever the software inventor
is less dependent on the expertise of others in her work, she is more likely to make a
"control move" rather than a "non control move".
5.4 Productivity of Software Inventors and the Quality of their Patents
Analyzing the productivity of software inventors and the quality of their patents is
difficult, in light of the fact that all our empirical analysis is conditional on patents. We
137
have attempted to do so by building measures of productivity and quality, and then
analyzing their relationship to various parameters - in particular to the mobility of the
inventors.
The first, and more intuitive measure of quality, is the number of citations made for
the patent. This measure has been quite a common measure of quality in the literature, ever
since the variable has become available in the NBER Hall-Jaffe-Trajtenberg Patent Data.
However, as already pointed out, this variable suffers from various statistical problems.
Simple averages over this variable might reflect these problems. Therefore, a proper
analysis will have to at least control for time trend in this variable. Table 11 summarizes the
results of a regression in which the dependent variable is the number of citations received
for the patent.
Table 11 Patent Citations
Dependent Variable: CRECEIVE Method: Least Squares with White Heteroskedasticity-Consistent Standard Errors; Sample: 1 221546 IF PAT_SEQ>1 and CRECEIVE<500*; obs: 168793; mean dependent variable: 12.04
(1) (2) (3) Variable Coef. Std. Err. Coef. Std. Err. Coef. Std. Err. C -12.913 (0.55) -12.768 (0.553) -9.73 (0.512) APPYEAR-1965 3.066 (0.049) 3.071 (0.049) 2.123 (0.046) (APPYEAR-1965)2 -0.082 (0.001) -0.082 (0.001) -0.059 (0.001) M_CRECEIVE(-1) 0.369 (0.006) DURATION -0.124 (0.007) -0.121 (0.007) -0.137 (0.007) PAT_SEQ 0.003 (0.002) 0.003 (0.002) 0.009 (0.002) PART_COUNT 0.509 (0.018) 0.515 (0.018) 0.331 (0.017) SOFT_PAT 4.051 (0.284) 3.965 (0.284) 2.883 (0.255) LOG(ASSIG_PATENTS) -0.378 (0.018) -0.409 (0.02) -0.154 (0.018) LOG(ASSIG_PATENTS)*SOFT_PAT -0.181 (0.034) -0.172 (0.034) -0.131 (0.03) MOVE_GEO -0.394 (0.094) -0.382 (0.094) -0.196 (0.088) MOVE_ASSIG_CUM -0.003 (0.002) -0.002 (0.002) -0.004 (0.002) MOVE_ASSIG -0.667 (0.138) 0.010 (0.313) 0.385 (0.294) MOVE_ASSIG*SOFT_PAT(-1) 2.183 (0.278) 2.036 (0.279) -0.437 (0.270) MOVE_ASSIG*LOG(ASSIG_PATENTS(-1)) -0.34 (0.033) -0.144 (0.031) MOVE_ASSIG*LOG(ASSIG_PATENTS) 0.208 (0.037) 0.112 (0.035) CAT1 -0.469 (0.197) -0.365 (0.197) -0.588 (0.183) CAT2 5.683 (0.163) 5.719 (0.163) 3.302 (0.152) CAT3 2.655 (0.307) 2.669 (0.306) 1.698 (0.287) CAT4 3.136 (0.171) 3.152 (0.171) 1.846 (0.157) CAT5 1.376 (0.174) 1.394 (0.174) 0.432 (0.156) Adjusted R2: 0.1118 0.1125 0.2429 F-statistic: 1,250 1,127 2,709 Bold text indicates significance at the 5% level. * 7 observations, in which CRECEIVE>500, were dropped.
138
The sample includes the patents of software inventors; once again dropping the first
patent of each inventor, in order to include mobility as a variable. A new variable appearing
in the estimation is M_CRECEIVE(-1), which is the mean citation received for the prior
patents of the inventor, and serves as a kind of an inventor specific effect. The first two
equations do not include this variable. Their results indicate on a robust effect of moves
between assignees on the number of citation received. The third equation does include this
variable and, not surprisingly, suggests that the individual effect is very significant. It also
shows that after controlling for this effect, the assignee moves do not directly affect the
number of citations received. There is, however, an indirect effect via the sizes of the
assignees. In general, moves from smaller to larger assignee result in receiving more
citations. This finding exactly supports our “Productivity, Mobility and the Firm's Size”
hypothesis, regarding the short-run costs of a move. Finally, geographical movement is
found to have a negative effect on citation, even after controlling for the past citations of the
inventor.
In the absence of an assignee move, an inventor will be more cited when working
for a small assignee. This effect is much stronger for software patents. One should also bear
in mind the possibility that software inventors who work for large corporations on non-
software inventions might be involved in projects which are firm specific, thus they might
not be as well cited as pure software inventions. Nevertheless, the fact remains that the data
indicates that the small firms are, on average, responsible for the more important software
innovations§§§§§§§. By contrast, the opposite is found just following a move, which might be
an indication that smaller firms sometimes rush into strategically patenting the invention, so
as to resolve property rights disputes with the former employer of the inventor. Hence, we
have found a tradeoff between the long and the short run regarding the patent quality;
though it seems that in the long run an inventor would be better off inventing for many
years in a small company, the transition to a smaller company might prove to have short run
negative effects.
As in the previous regressions, the coefficients of DURATION and PAT_SEQ
should be interpreted together. The results indicate that in the later stages of their career,
§§§§§§§ It should be taken into account that the larger firms might also have a higher probability of continuing
their research; thus, a greater portion of their citations might actually be self-citations.
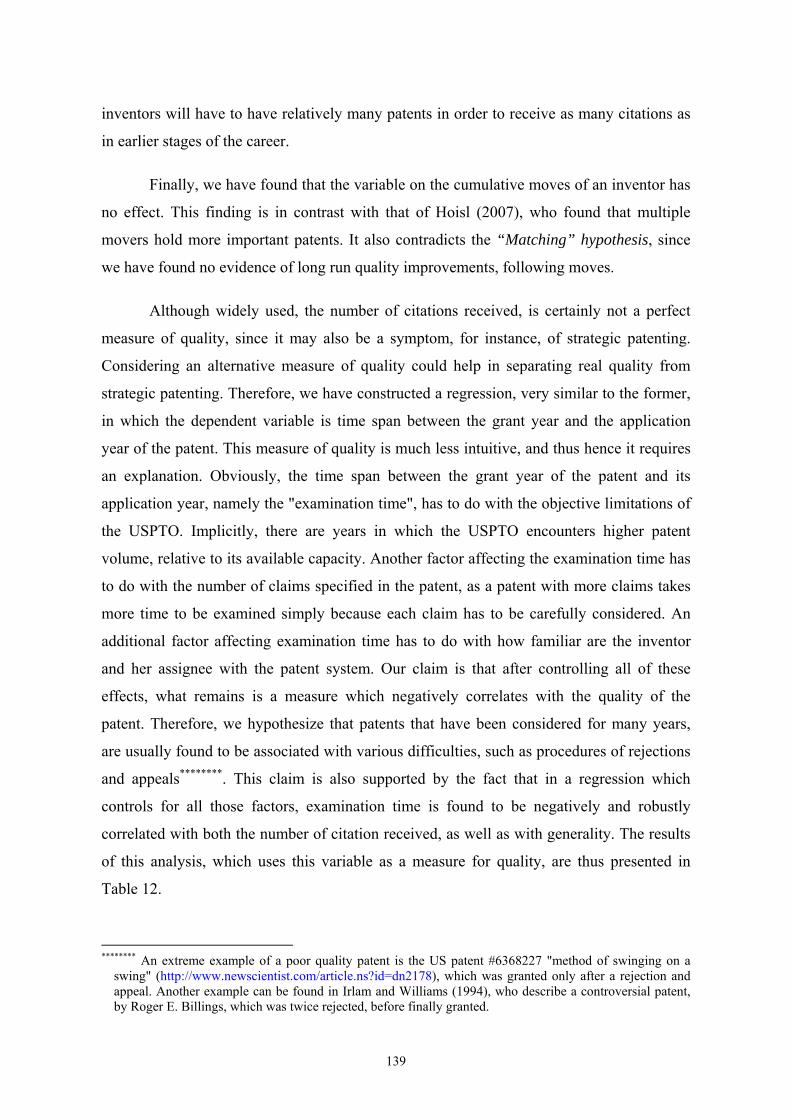
139
inventors will have to have relatively many patents in order to receive as many citations as
in earlier stages of the career.
Finally, we have found that the variable on the cumulative moves of an inventor has
no effect. This finding is in contrast with that of Hoisl (2007), who found that multiple
movers hold more important patents. It also contradicts the “Matching” hypothesis, since
we have found no evidence of long run quality improvements, following moves.
Although widely used, the number of citations received, is certainly not a perfect
measure of quality, since it may also be a symptom, for instance, of strategic patenting.
Considering an alternative measure of quality could help in separating real quality from
strategic patenting. Therefore, we have constructed a regression, very similar to the former,
in which the dependent variable is time span between the grant year and the application
year of the patent. This measure of quality is much less intuitive, and thus hence it requires
an explanation. Obviously, the time span between the grant year of the patent and its
application year, namely the "examination time", has to do with the objective limitations of
the USPTO. Implicitly, there are years in which the USPTO encounters higher patent
volume, relative to its available capacity. Another factor affecting the examination time has
to do with the number of claims specified in the patent, as a patent with more claims takes
more time to be examined simply because each claim has to be carefully considered. An
additional factor affecting examination time has to do with how familiar are the inventor
and her assignee with the patent system. Our claim is that after controlling all of these
effects, what remains is a measure which negatively correlates with the quality of the
patent. Therefore, we hypothesize that patents that have been considered for many years,
are usually found to be associated with various difficulties, such as procedures of rejections
and appeals********. This claim is also supported by the fact that in a regression which
controls for all those factors, examination time is found to be negatively and robustly
correlated with both the number of citation received, as well as with generality. The results
of this analysis, which uses this variable as a measure for quality, are thus presented in
Table 12.
******** An extreme example of a poor quality patent is the US patent #6368227 "method of swinging on a
swing" (http://www.newscientist.com/article.ns?id=dn2178), which was granted only after a rejection and appeal. Another example can be found in Irlam and Williams (1994), who describe a controversial patent, by Roger E. Billings, which was twice rejected, before finally granted.
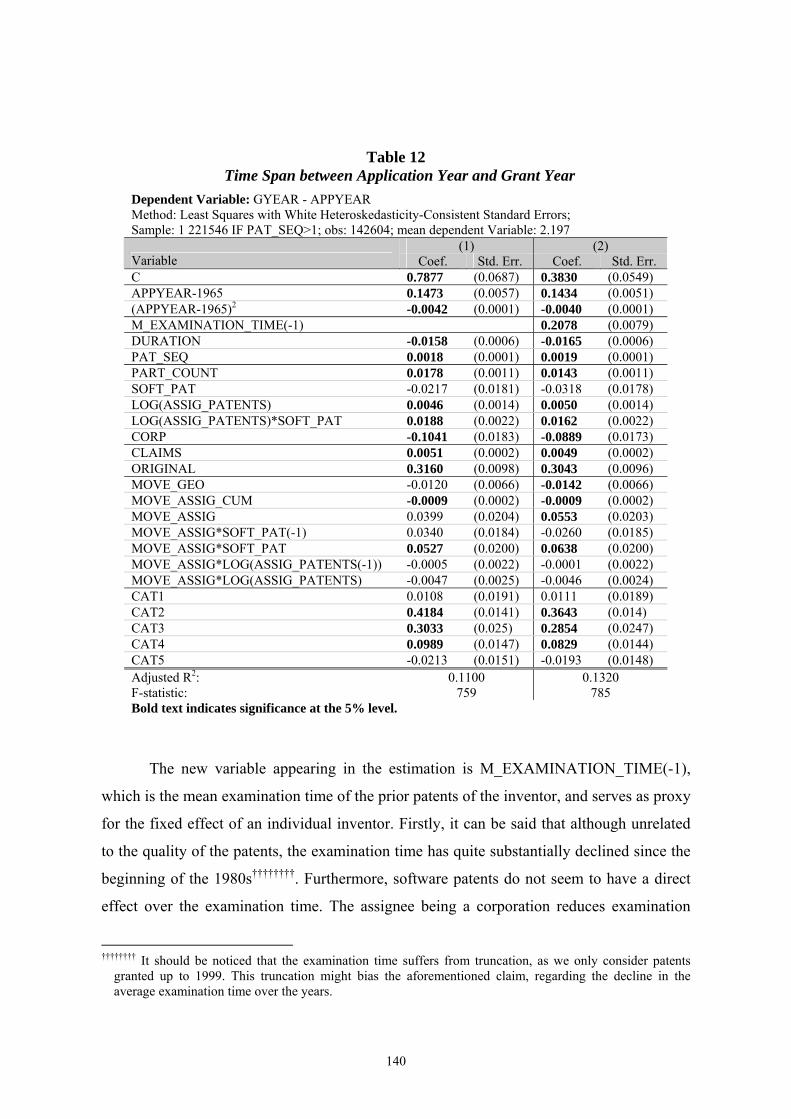
140
Table 12 Time Span between Application Year and Grant Year
Dependent Variable: GYEAR - APPYEAR Method: Least Squares with White Heteroskedasticity-Consistent Standard Errors; Sample: 1 221546 IF PAT_SEQ>1; obs: 142604; mean dependent Variable: 2.197
(1) (2) Variable Coef. Std. Err. Coef. Std. Err. C 0.7877 (0.0687) 0.3830 (0.0549) APPYEAR-1965 0.1473 (0.0057) 0.1434 (0.0051) (APPYEAR-1965)2 -0.0042 (0.0001) -0.0040 (0.0001) M_EXAMINATION_TIME(-1) 0.2078 (0.0079) DURATION -0.0158 (0.0006) -0.0165 (0.0006) PAT_SEQ 0.0018 (0.0001) 0.0019 (0.0001) PART_COUNT 0.0178 (0.0011) 0.0143 (0.0011) SOFT_PAT -0.0217 (0.0181) -0.0318 (0.0178) LOG(ASSIG_PATENTS) 0.0046 (0.0014) 0.0050 (0.0014) LOG(ASSIG_PATENTS)*SOFT_PAT 0.0188 (0.0022) 0.0162 (0.0022) CORP -0.1041 (0.0183) -0.0889 (0.0173) CLAIMS 0.0051 (0.0002) 0.0049 (0.0002) ORIGINAL 0.3160 (0.0098) 0.3043 (0.0096) MOVE_GEO -0.0120 (0.0066) -0.0142 (0.0066) MOVE_ASSIG_CUM -0.0009 (0.0002) -0.0009 (0.0002) MOVE_ASSIG 0.0399 (0.0204) 0.0553 (0.0203) MOVE_ASSIG*SOFT_PAT(-1) 0.0340 (0.0184) -0.0260 (0.0185) MOVE_ASSIG*SOFT_PAT 0.0527 (0.0200) 0.0638 (0.0200) MOVE_ASSIG*LOG(ASSIG_PATENTS(-1)) -0.0005 (0.0022) -0.0001 (0.0022) MOVE_ASSIG*LOG(ASSIG_PATENTS) -0.0047 (0.0025) -0.0046 (0.0024) CAT1 0.0108 (0.0191) 0.0111 (0.0189) CAT2 0.4184 (0.0141) 0.3643 (0.014) CAT3 0.3033 (0.025) 0.2854 (0.0247) CAT4 0.0989 (0.0147) 0.0829 (0.0144) CAT5 -0.0213 (0.0151) -0.0193 (0.0148) Adjusted R2: 0.1100 0.1320 F-statistic: 759 785 Bold text indicates significance at the 5% level.
The new variable appearing in the estimation is M_EXAMINATION_TIME(-1),
which is the mean examination time of the prior patents of the inventor, and serves as proxy
for the fixed effect of an individual inventor. Firstly, it can be said that although unrelated
to the quality of the patents, the examination time has quite substantially declined since the
beginning of the 1980s††††††††. Furthermore, software patents do not seem to have a direct
effect over the examination time. The assignee being a corporation reduces examination
†††††††† It should be noticed that the examination time suffers from truncation, as we only consider patents
granted up to 1999. This truncation might bias the aforementioned claim, regarding the decline in the average examination time over the years.
141
time, which probably does not indicate on the quality of the patents, but rather on the fact
that corporations are usually more experienced in filing patents. Furthermore, both the
number of claims and originality are variables related the complexity of the examined
patent; hence, increasing the examination time.
A larger size assignee usually implies a corporation with more experience and better
patenting abilities, such as lawyers and consultants. Yet, size is found to increase
examination time, especially for software patents. The fact that the capabilities of larger
assignees do not lessen examination time indicates on the poor quality of their patents; thus
firmly supporting the hypothesis that important software innovations are usually produced
by the smaller companies. Similarly, since smaller firms and individual inventors are
probably more prone to file for provisional patents, which extends their average processing
time, our finding that the processing time is actually shorter for them, further supports the
hypothesis.
A geographic move, even one which does not involve moving to a different
assignee, frequently involves some adjustment costs - both personally to the inventor, as
well as to those involved in the invention. Geographic moves are found to reduce
examination time, yet are associated with lower citations. These results suggest that the
geographical moves in our sample are related to inventors who move in order to work on
predefined and specific projects.
Quite surprisingly, the effects of DURATION and PAT_SEQ on this quality
measure are found to lie in the opposite directions, as compared with the effect they had on
the number of citations received. One possible explanation is that the coefficients in Table
12 represent more of the non-quality factors which affect examination time. The negative
sign of the duration might represent the fact that the years of experience help selecting
patents which are more easily granted, whereas the positive sign of the patent sequence
might represent the increased complexity of the patents of inventors, throughout their
career.
Finally, the short-run effect of assignees move is found to be positive on the
examination time, regardless of the size of the assignees. Once again, with regard to the
“Productivity, Mobility and the Firm’s Size” hypothesis, we have found that mobility
creates an impact more negative in the short run than in the long run. However, contrary to
142
that hypothesis, we have found that the examination time does vary with the size of the
assignee after the move. These findings also emphasize, once again, the tendency to
prematurely patent inventions following a move. Presumably, this is done so as to resolve
property rights disputes with the inventor’s former employer. By contrast, multiple movers
gain, in the long run, a certain advantage in shortening the examination time.
5.5 Teamwork
Teamwork seems to be especially important for software inventors. In this section
we will hence try to verify the effects of teamwork, as predicted by the "Teamwork"
Hypothesis. Table 3 reveals that software inventors have, on average, more co-inventors
than other types of inventors. We have also looked into the structure of the teams, by taking
the averages across all patents, using the entire universe of patents. It turns out that an
average patent, which does not have a software inventor, has two inventors, while software
patents have, on average, 2.5 inventors. However, the most interesting statistic regards the
non-software patents, which involve at least one software inventor. The results show that on
such a team there are, on average, 2.8 inventors, out of which exactly half (1.4 inventors)
are software inventors. This finding indicates that in such "mixed" inventions, software is
typically a very significant component. Finally, as for patents in which software inventors
are involved, 30.3% of them (39,006 patents) do not involve teamwork, 27.1% (34,816
patents) have more than one inventor, but are all software inventors, and 42.6% (54,856
patents) involve a team comprised of both software and non software inventors.
Table 8 shows that inventors who patent with many partners are more likely to
move. The long run effect of the number of co-inventors, captured by the coefficient of
MAX_PART_COUNT(-1), is positive and significant throughout the years. By contrast, the
short term effect, captured by the coefficient of PART_COUNT(-1), is not significant after
1995. We suspect this to be an indication that better IPR protection of software, in the
second half of the 1990s, helped in preventing some spinoff attempts.
The fact that teamwork increases mobility might be due to the social and
professional connections established amongst team-members. However, as has been shown
in the previous sections, mobility of software inventors is often related to their ability to
change and shift their research focus, by getting involved in projects different from their
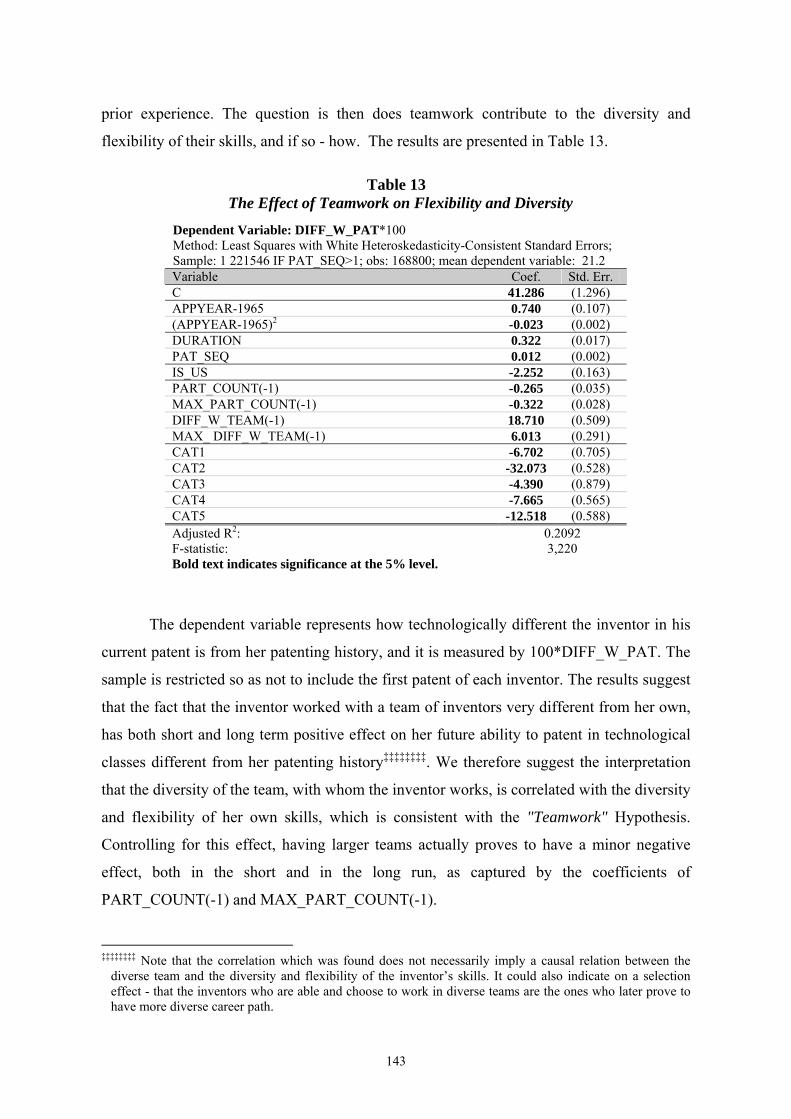
143
prior experience. The question is then does teamwork contribute to the diversity and
flexibility of their skills, and if so - how. The results are presented in Table 13.
Table 13 The Effect of Teamwork on Flexibility and Diversity
Dependent Variable: DIFF_W_PAT*100 Method: Least Squares with White Heteroskedasticity-Consistent Standard Errors; Sample: 1 221546 IF PAT_SEQ>1; obs: 168800; mean dependent variable: 21.2 Variable Coef. Std. Err. C 41.286 (1.296) APPYEAR-1965 0.740 (0.107) (APPYEAR-1965)2 -0.023 (0.002) DURATION 0.322 (0.017) PAT_SEQ 0.012 (0.002) IS_US -2.252 (0.163) PART_COUNT(-1) -0.265 (0.035) MAX_PART_COUNT(-1) -0.322 (0.028) DIFF_W_TEAM(-1) 18.710 (0.509) MAX_ DIFF_W_TEAM(-1) 6.013 (0.291) CAT1 -6.702 (0.705) CAT2 -32.073 (0.528) CAT3 -4.390 (0.879) CAT4 -7.665 (0.565) CAT5 -12.518 (0.588) Adjusted R2: 0.2092 F-statistic: 3,220 Bold text indicates significance at the 5% level.
The dependent variable represents how technologically different the inventor in his
current patent is from her patenting history, and it is measured by 100*DIFF_W_PAT. The
sample is restricted so as not to include the first patent of each inventor. The results suggest
that the fact that the inventor worked with a team of inventors very different from her own,
has both short and long term positive effect on her future ability to patent in technological
classes different from her patenting history‡‡‡‡‡‡‡‡. We therefore suggest the interpretation
that the diversity of the team, with whom the inventor works, is correlated with the diversity
and flexibility of her own skills, which is consistent with the "Teamwork" Hypothesis.
Controlling for this effect, having larger teams actually proves to have a minor negative
effect, both in the short and in the long run, as captured by the coefficients of
PART_COUNT(-1) and MAX_PART_COUNT(-1).
‡‡‡‡‡‡‡‡ Note that the correlation which was found does not necessarily imply a causal relation between the
diverse team and the diversity and flexibility of the inventor’s skills. It could also indicate on a selection effect - that the inventors who are able and choose to work in diverse teams are the ones who later prove to have more diverse career path.
144
When the variables MAX_DIFF_W_TEAM(-1) and DIFF_W_TEAM(-1) are
included in the mobility regression of Table 8, both prove to have a positive and significant
effect on mobility. The short term effect of the number of co-inventors is positive and
insignificant, yet the long term effect is positive and significant. Our interpretation of the
results is that both the team size and its diversity contribute to the mobility of inventors.
The latter factor probably affects mobility via its contribution to the diversity and flexibility
of the skills of the software inventors, while the former factor does not affect the diversity
and flexibility of the skills directly; instead it is likely to contribute to mobility by such
means as expanding the professional networks of the inventors.
As for the effect that teamwork has on the quality of patents, Table 11 shows that
patents with many inventors tend to be more cited. This phenomenon might indicate a better
patent quality, or perhaps is simply an indication that a patent with many inventors tend to
have more successive innovations and ramifications. Table 12 exhibits the fact that a larger
number of partners results in an increase in the examination time, which, as has been
explained, is a negative signal of quality. Thus, we infer that inventions created by larger
teams are probably more cited owing to the future inventive work done by the members of
the original team. Additional tests we have conducted show that the number of inventors is
also positively related to generality, originality and to the number of claims; hence,
inventions which involve a large team of inventors are probably more complex in nature.
However, after controlling for this rise in complexity, we believe that the increase in the
examination time is probably due to premature application of the patent, which is consistent
with the arguments raised in the “Teamwork” hypothesis.
6 Concluding Remarks
This paper has uniquely utilized patent data for the purpose of empirically exploring
the mobility of software inventors. The close link between the mobility of inventors and
knowledge spillovers is a convention in the literature. Hence, changes in the pattern of
mobility have been examined in this paper in light of the revolution that the software
industry has undergone, in terms of IPR protection, which reached its peak in the mid
1990s. In fact, spillovers and the ability of the firm to protect its IPR, are both an important
145
part of the incentives for mobility as well as its results. Thus, studying this bi-directional
relationship between mobility and patenting decision has been the main purpose of this
paper.
Our findings, thus, show that smaller firms are typically responsible for the more
important software innovations. Apparently, small firms are especially sensitive to IPR
protection, and its tightening has probably benefited them; for instance, after 1995 there has
been a drop in mobility of inventors from smaller firms. Our analysis further indicates that
in the "patent era" there has been a shift of software inventors and software patenting
towards smaller, more specialized software firms. The data also seems to support the
assertion that right after a move occurs, a recipient smaller firm sometimes rushes into
strategically patenting the invention - probably in order to resolve property rights disputes
with the former employer of the inventor.
We have also found that the work of software inventors, much like the software
industry, is characterized by diversity and cumulative knowledge. Their special abilities and
skills account for more frequent and diverse job mobility, as compared with other inventors.
By the same token, we have found evidence that the mobility of software inventors is
closely related to the diversity and flexibility of their ability, i.e. their capability to apply
their skills in different fields and to divert the trajectory of their research focus.
Surprisingly, we have found no support in the data to the hypothesis that mobility is
a matching process between the inventor and her employer, since the quality of the patents
of the inventor does not increase after a move. Instead, mobility seems to result in some
short term costs, which are apparently lower when moving to a larger firm, where the
infrastructure should help in assimilating new employees. Moreover, mobility of software
inventors does not seem to be a process in which inventors are moving to similar firms;
instead it is rather a recombination process, in which inventors are likely to move to a firm
with a different focus from that of their past work.
Compared to other inventors, teamwork has proved to be a feature of a particular
importance, characterizing the work of software inventors. Teamwork is found to increase
mobility, both in the short and long run. Mobility has been found to be directly affected by
the number of co-inventors, as well as by the diversity of the team, which in turn has a long
term effect on the diversity and flexibility of the skills of the team-members. We have also
146
found some clues that this increased mobility affects the patenting decisions of the firms.
Accordingly, although patents involving large teams of inventors typically have more
successive innovations and ramifications, we have found that they are probably prematurely
applied for, and are characterized by long inspection time at the patent office.
The effect that the quality of the invention has on mobility is not straightforward.
Asymmetric information between the inventor and her employer, regarding the quality of
the invention, has been found to play an important role in generating incentives for job
mobility. It has been shown to play a significant role in generating the conditions for
“control moves”, i.e. move to the "garage" or to a smaller or private firm. This effect
diminishes when the inventor and her employer share a long patenting history together.
As the software industry has rapidly been evolving, it has experienced frequent
revolutionary changes. Unfortunately, the timing when the peak of the change in
patentability occurred, in the mid 1990s, coincided with the internet revolution, making it
extremely difficult to isolate the various effects resulting from the two events. Hence, some
of our conclusions, on the effect that the change. in software patentability has had, should
be taken with a grain of salt. We hope that future papers would include longer and more
updated datasets that would enable them to reach more conclusive results.
7 Appendix - The Variables Used
This appendix elaborates on the variables, which are included in the NBER Hall-
Jaffe-Trajtenberg Patent Data File, as well as on the constructed variables, which do not
originally appear in that file. For further details on the original variables, the reader is
referred to Hall, Jaffe and Trajtenberg (2001). Note that throughout Tables 10-13, we use
"(-1)" to refer to the inventor's previous patent.
Original variables of the NBER file (at the patent level):
1. APPYEAR - The year in which the patent was applied for.
2. GYEAR - The year in which the patent was granted.
147
3. CAT1, CAT2,… - Dummy variables which indicate which of the six main
technological categories the main USPTO patent class of the current patent
corresponds to. The six categories are respectively Computers & Communications,
Drugs & Medical, Electrical & Electronics, Chemical, Mechanical and Others.
4. CLAIMS - The number of claims that the patent makes.
5. CRECEIVE - The number of patents, granted between 1963 and 2002, which cite the
current patent. This updated variable is downloadable from Bronwyn H. Hall's
website: http://elsa.berkeley.edu/~bhhall/bhdata.html.
6. GENERAL - A measure of the diversity of the patents which cite the current patent,
across the technological classes. This variable too is updated to patents granted up to
the year 2002, and was downloaded from Bronwyn H. Hall's website.
7. ORIGINAL - A measure of the diversity of the patents which the current patent cites,
across the technological classes.
Constructed variables at the inventor level:
1. M_CAT1, M_CAT2,… - These variables are the share of patents of the inventor in
each of the patent categories, in our entire sample. For instance, for an inventor who
has one patent in the Chemical category and three patents in Computers &
Communications will have M_CAT1=0.25, M_CAT2=0.75 and all the others will
equal zero.
2. FIRSTYEAR - The application year of the first patent of the inventor.
3. TOTAL_DURATION - The duration between the first and the last patent of the
inventor, namely the application year of the last patent of the inventor in our sample
minus the application year of the first patent of the inventor. This serves as a proxy for
the length of the career span of the inventor.
4. US - A dummy indicating whether the country of the first patent of the inventor is the
US. This serves as a proxy for checking whether the inventor started her career in the
US.
148
Constructed variables at the patent level:
1. MOVE_ASSIG - A dummy variable which equals one if the inventor has a different
assignee for her current patent relative to her preceding patent.
2. DURATION - The time span, in years, between the application year of the current
patent and the application year of the first patent of the inventor. This serves as a
proxy for the years of experience the inventor has accumulated, while applying for the
current patent.
3. PAT_SEQ - The patent sequence for the inventor, e.g. 1 for her first patent, 2 for her
second patent, etc. This variable was also constructed as a proxy for the career stage
of the inventor.
4. MOVE_ASSIG_CUM - The number of assignee moves the inventor has made up to
the current patent.
5. PART_COUNT - Counts the number of co-inventors the inventor has in her current
patent (zero if she is the sole inventor).
6. SOFT_PAT - A dummy variable for whether the current patent is a software patent.
7. CORP - A dummy for whether the inventor works in a corporation on the current
patent, rather than working as an individual inventor (“garage”) or for a governmental
agency. This corresponds to assignee types 2 or 3 in the NBER Hall-Jaffe-Trajtenberg
Patent Data File.
8. ASSIG_PATENTS - The number of patents that the assignee possesses, in the entire
NBER Hall-Jaffe-Trajtenberg Patent Data File. If the patent is assigned to an
individual inventor (“garage”), this variable is one. This serves as a proxy for the size
of the assignee.
9. ASYMMETRIC - An asymmetric information proxy, defined as follows:
( * )(1- * 1- )ASYMMETRIC k CRECEIVED GENERAL CLAIMS ORIGINAL≡ + + ,
149
where CRECEIVED* and CLAIMS* are the aforementioned original variables, only
scaled between zero and one, as the variables GENERAL and ORIGINAL are, by
construction, simply by dividing each by its maximal value in the data. The constant k
scales this constructed variable between zero and one. This variable is largest when
there is an interaction of both larger unobserved quality measures, and small observed
quality measures.
10. NOT_INDIVIDUAL - A dummy variable for whether in the current patent the inventor
works for either a corporation or a governmental agency. This corresponds to assignee
types 2, 3, 6 or 7 in the NBER Hall-Jaffe-Trajtenberg Patent Data File.
11. PATENTS_WITH_ASSIG - The number of patents the inventor has had with her
current assignee up to the current patent.
12. YEARS_WITH_ASSIG - The number of years between the application year of the first
patent the inventor has had with the current assignee and the application year of the
current patent.
13. MOVE_GEO - A dummy for whether the inventor moved across states between the
current patent and the previous one.
14. M_CRECEIVE - The mean citation received for the inventor’s previous patents, up to
the current one.
15. M_EXAMINATION_TIME - The mean examination time, i.e. the average, over the
inventor’s previous patents, up to the current one, of the grant year minus the
application year.
16. MAX_PART_COUNT - The maximal number of partners (co-inventors) the inventor
has worked with, for each of the patents she had up to the current one.
The following three variables are measures of technological closeness, very similar to the
one introduced by Jaffe (1986):
17. DIFF_W_ASSIG - For each data point, let the vector i denote the proportion of the
past patents of the inventor, in each of the six technological categories. Similarly, let
the vector a denote the proportion of the past patents of the current assignee, in each
150
of the six technological categories. The measure of the technological difference
between the patenting history of the inventor and the assignee would be:
( )( )
'_ _ 1' 'i aDIFF W ASSIG
i i a a≡ −
This measure will be zero if the patenting history of the inventor and the assignee are
divided identically between the six technological categories; it is one if the inventor
has only patented in categories in which the assignee has not; and is a decreasing
function of their similarity. For individual inventors (“garage”), this variable is zero.
18. DIFF_W_PAT - For each data point, let i, as before, denote the proportions of the past
patents of the inventor in each of the six technological categories. Let p be a 6-
elements vector with 5 zeros, and one in the position corresponding to the patent
category of the current patent. DIFF_W_PAT is hence defined as:
( ) ( )
'_ _ 1' 'i pDIFF W PAT
i i p p≡ −
19. DIFF_W_TEAM - For each data point, let i, as before, denote the proportions of the
past patents of the inventor in each of the six technological categories. Let t denote the
proportions of the past patents of the current team-members:
( ) ( )
'_ _ 1' 'i tDIFF W TEAM
i i t t≡ −
This variable, obviously, takes the value zero whenever the inventor is the sole
inventor of the patent.
20. MAX_ DIFF_W_TEAM - The maximal value of DIFF_W_TEAM the inventor has in
each of the patents she has had up to the current patent.
151
8 References
Almeida, Paul and Bruce Kogut (1999), “Localization of Knowledge and the Mobility of
Engineers in Regional Networks,” Management Science, 45: 905-917.
Arrow, Kenneth J. (1962), "Economic Welfare and the Allocation of Resources for
Invention," The Rate and Direction of Inventive Activity: Economic and Social Factors.
Bessen, James and Robert M. Hunt (2004), “The Software Patent Experiment,” Working
paper (March).
Bessen, James and Robert M. Hunt (2006), “An Empirical Look at Software Patents,”
forthcoming in the Journal of Economics and Management Strategy.
Evans, David S. and Anne Layne-Farrar (2004), "Software Patents and Open Source: The
Battle over Intellectual Property Rights," Virginia Journal of Law and Technology 9.
Gilson, Ronald (1999), “The Legal Infrastructure of High Technology Industrial Districts:
Silicon Valley, Route 128, and Covenants Not To Compete,” New York University Law
Review, 74: 575-629.
Graham, Stuart J.H. and David C. Mowery (2003), "Intellectual Property Protection in the
U.S. Software Industry," Patents in the Knowledge-Based Economy (Wesley M. Cohen &
Stephen A. Merrill, eds.), Washington D.C.: National Academies Press.
Graham, Stuart J.H. and David C. Mowery (2005), "Software Patents: Good News or Bad
News?," Intellectual Property Rights in Frontier Industries: Software and Biotechnology
(Robert W. Hahn, eds.), Washington D.C.: AEI-Brookings Joint Center for Regulatory
Studies.
Hall, Bronwyn H, Adam Jaffe, and Manuel Trajtenberg (2001), “The NBER Patent
Citations Data File: Lessons, Insights and Methodological Tools,” NBER Working Paper
No. 8498 (October).
152
Hall, Bronwyn H. and Megan MacGarvie (2006), “The Private Value of Software Patents,”
NBER Working Paper No. 12195.
Hoisl, Karin (2007), "Tracing Mobile Inventors - The Causality between Inventor Mobility
and Inventor Productivity," Research Policy 36: 619-636.
Irlam, Gordon and Ross Williams (1994), "Software Patents: An Industry at Risk," Working
Paper, submitted by The League for Programming Freedom to The Patent and Trademark
Office.
Jackson, Chris (2001), "Capitalization of Software in the National Accounts,"
www.statcan.ca/english/freepub/13-605-XIE/2003001/pdf/2001software.pdf, Statistics Ca-
nada, Income and Expenditure Accounts Division,
Jaffe, Adam B. (1986), "Technological Opportunity and Spillovers of R & D: Evidence
from Firms' Patents, Profits, and Market Value," American Economic Review 76: 984-1001.
Kim, Jinyoung and Gerald Marschke (2005), “Labor Mobility of Scientists, Technological
Diffusion, and the Firm’s Patenting Decision,” Rand Journal of Economic 36: 298-317.
Layne-Farrar, Anne (2005), “Defining Software Patents: A Research Field Guide,” LECG,
Chicago: manuscript, http://www.aei-brookings.org/publications/abstract.php?pid=971.
Mann, Ronald J. and Thomas W. Sager (2006), "Patents, Venture Capital, and Software
Start-ups," Law and Economics Working Paper No. 057, University of Texas (March).
Møen, Jarle (2000), “Is Mobility of Technical Personnel a Source of R&D Spillovers?”
NBER Working Paper No. 7834.
Nelson, Richard R. (1959), "The Economics of Invention: A Survey of the Literature,"
Journal of Business 32: 101-127.
Noel, Michael and Mark Schankerman (2006), "Strategic Patenting and Software
Innovation," CEPR Working Paper No. 5701 (June).
153
Pakes, Ariel and Shmuel Nitzan (1983), “Optimum Contracts for Research Personnel,
Research Employment and the Establishment of ‘Rival’ Enterprises,” Journal of Labor
Economics, 1(4): 345-365.
Prusa, Thomas J. and James A. Schmitz, Jr. (1994), "Can Companies Maintain their Initial
Innovative Thrust? A Study of the PC Software Industry," Review of Economics and
Statistics 76: 523-540.
Schacht, Wendy H. (2006), "Patent Reform: Issues in the Biomedical and Software
Industries," CRS Report for Congress.
Song, Jaeyong, Paul Almeida and Geraldine Wu (2003), "Learning-by-Hiring: When Is
Mobility More Likely to Facilitate Interfirm Knowledge Transfer?" Management Science
49: 351-365.
Topel, Robert H. and Michael P. Ward (1992), "Job Mobility and the Careers of Young
Men" The Quarterly Journal of Economics 107: 439-479.
Trajtenberg, Manuel (1990), ''A Penny for Your Quotes: Patent Citations and the Value of
Innovations,'' Rand Journal of Economics 21 (1): 172-187.
Trajtenberg, Manuel (2005), "Recombinant Ideas: The Mobility of Inventors and the
Productivity of Research," In: Proceedings of the CEPR Conference, Munich, May 26-28,
2005.
Trajtenberg, Manuel, Gil Shiff and Ran Melamed (2006), "The “Names Game”: Harnessing
Inventors’ Patent Data for Economic Research," NBER Working Paper No. 12479.
U.S. Bureau of Labor Statistics (2006), Occupational Outlook Handbook, 2006-07 Edition,
Department of Labor, http://www.bls.gov/oco/.
Wheeler, David A. (2006), "The Most Important Software Innovations," Working Paper,
http://www.dwheeler.com/innovation.
![Patenting Trends at Ivy League Universities · [9] © Copyright 2012 IP Checkups, Inc. PART III. Top Inventors One hundred and sixteen inventors appeared on ten or more patents assigned](https://img.pdfslide.us/doc/110x75/5f528c442fed22084f7148b3/patenting-trends-at-ivy-league-9-copyright-2012-ip-checkups-inc-part-iii.jpg)