Embed Size (px)
Citation preview
Technical ReportCMU/SEI-92-TR-019ESC-TR-92-019
Software Measurement for DoD Systems: Recommendations for Initial Core Measures
Anita D. Carleton
Robert E. Park
Wolfhart B. Goethert
William A. Florac
Elizabeth K. Bailey
Shari Lawrence Pfleeger

(Draft) /Helvetica /B -52 /UL .8/gray exch def/start exch def/rotval exch def/mode exch deffindfont /infont exch def/printme exch def
Software Engineering InstituteCarnegie Mellon University
Pittsburgh, Pennsylvania 15213
Unlimited distribution subject to the copyright.
Technical ReportCMU/SEI-92-TR-019
ESC-TR-92-019September 1992
Software Measurement for DoD Systems:Recommendations for Initial Core Measures
Anita D. Carleton
Robert E. Park
Wolfhart B. Goethert
William A. Florac
Software Process Measurement Project
Elizabeth K. Bailey
Institute for Defense Analyses
Shari Lawrence Pfleeger
The MITRE Corporation

(Draft) /Helvetica /B -52 /UL .8/gray exch def/start exch def/rotval exch def/mode exch deffindfont /infont exch def/printme exch def
This report was prepared for the
SEI Joint Program OfficeHQ ESC/AXS5 Eglin StreetHanscom AFB, MA 01731-2116
The ideas and findings in this report should not be construed as an official DoD position. It is published in theinterest of scientific and technical information exchange.
FOR THE COMMANDER
(signature on file)
Thomas R. Miller, Lt Col, USAFSEI Joint Program Office
This work is sponsored by the U.S. Department of Defense.
Copyright © 1996 by Carnegie Mellon University.
Permission to reproduce this document and to prepare derivative works from this document for internal use isgranted, provided the copyright and “No Warranty” statements are included with all reproductions and derivativeworks.
Requests for permission to reproduce this document or to prepare derivative works of this document for externaland commercial use should be addressed to the SEI Licensing Agent.
NO WARRANTY
THIS CARNEGIE MELLON UNIVERSITY AND SOFTWARE ENGINEERING INSTITUTE MATERIALIS FURNISHED ON AN “AS-IS” BASIS. CARNEGIE MELLON UNIVERSITY MAKES NO WARRAN-TIES OF ANY KIND, EITHER EXPRESSED OR IMPLIED, AS TO ANY MATTER INCLUDING, BUT NOTLIMITED TO, WARRANTY OF FITNESS FOR PURPOSE OR MERCHANTIBILITY, EXCLUSIVITY, ORRESULTS OBTAINED FROM USE OF THE MATERIAL. CARNEGIE MELLON UNIVERSITY DOESNOT MAKE ANY WARRANTY OF ANY KIND WITH RESPECT TO FREEDOM FROM PATENT,TRADEMARK, OR COPYRIGHT INFRINGEMENT.
This work was created in the performance of Federal Government Contract Number F19628-95-C-0003 withCarnegie Mellon University for the operation of the Software Engineering Institute, a federally funded researchand development center. The Government of the United States has a royalty-free government-purpose license touse, duplicate, or disclose the work, in whole or in part and in any manner, and to have or permit others to do so,for government purposes pursuant to the copyright license under the clause at 52.227-7013.
This document is available through Research Access, Inc., 800 Vinial Street, Pittsburgh, PA 15212. Phone: 1-800-685-6510. FAX: (412) 321-2994. RAI also maintains a World Wide Web home page. The URL ishttp://www.rai.com
Copies of this document are available through the National Technical Information Service (NTIS). For informa-tion on ordering, please contact NTIS directly: National Technical Information Service, U.S. Department ofCommerce, Springfield, VA 22161. Phone: (703) 487-4600.
This document is also available through the Defense Technical Information Center (DTIC). DTIC provides accessto and transfer of scientific and technical information for DoD personnel, DoD contractors and potential contrac-tors, and other U.S. Government agency personnel and their contractors. To obtain a copy, please contact DTICdirectly: Defense Technical Information Center / 8725 John J. Kingman Road / Suite 0944 / Ft. Belvoir, VA22060-6218. Phone: (703) 767-8222 or 1-800 225-3842.]
Use of any trademarks in this report is not intended in any way to infringe on the rights of the trademark holder.
CMU/SEI-92-TR-19 i
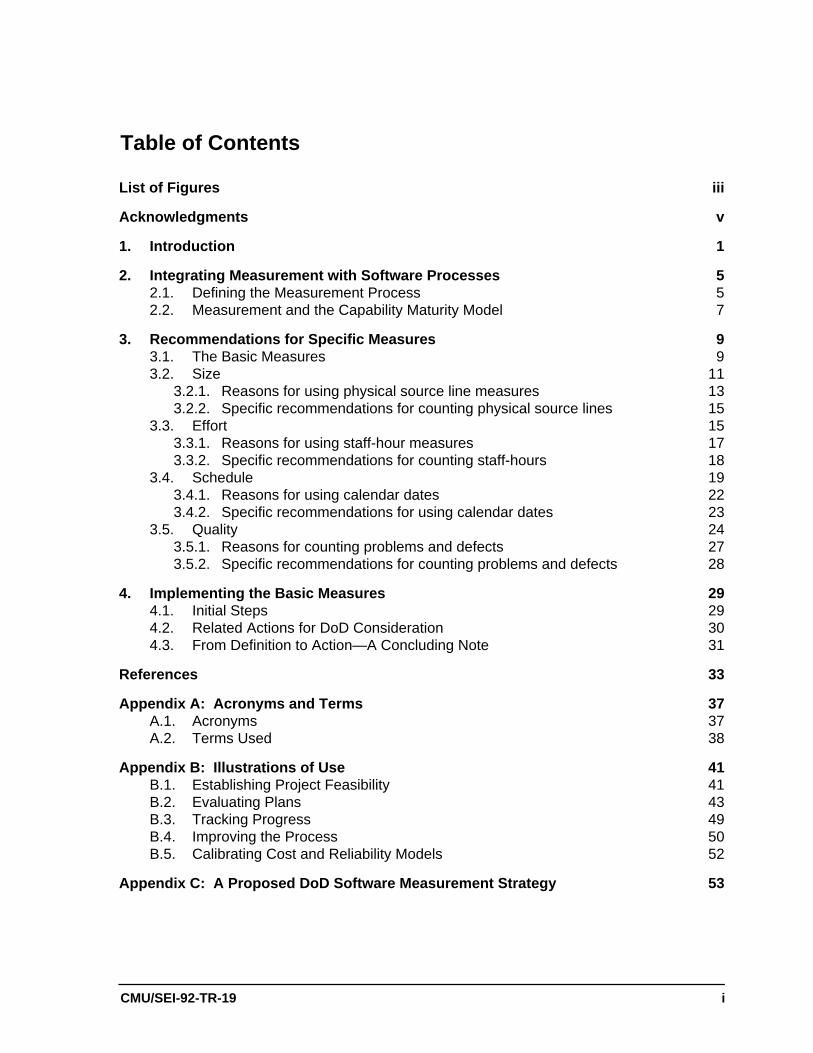
Table of Contents
List of Figures iii
Acknowledgments v
1. Introduction 1
2. Integrating Measurement with Software Processes 52.1. Defining the Measurement Process 52.2. Measurement and the Capability Maturity Model 7
3. Recommendations for Specific Measures 93.1. The Basic Measures 93.2. Size 11
3.2.1. Reasons for using physical source line measures 133.2.2. Specific recommendations for counting physical source lines 15
3.3. Effort 153.3.1. Reasons for using staff-hour measures 173.3.2. Specific recommendations for counting staff-hours 18
3.4. Schedule 193.4.1. Reasons for using calendar dates 223.4.2. Specific recommendations for using calendar dates 23
3.5. Quality 243.5.1. Reasons for counting problems and defects 273.5.2. Specific recommendations for counting problems and defects 28
4. Implementing the Basic Measures 294.1. Initial Steps 294.2. Related Actions for DoD Consideration 304.3. From Definition to Action—A Concluding Note 31
References 33
Appendix A: Acronyms and Terms 37A.1. Acronyms 37A.2. Terms Used 38
Appendix B: Illustrations of Use 41B.1. Establishing Project Feasibility 41B.2. Evaluating Plans 43B.3. Tracking Progress 49B.4. Improving the Process 50B.5. Calibrating Cost and Reliability Models 52
Appendix C: A Proposed DoD Software Measurement Strategy 53

ii CMU/SEI-92-TR-19
CMU/SEI-92-TR-19 iii
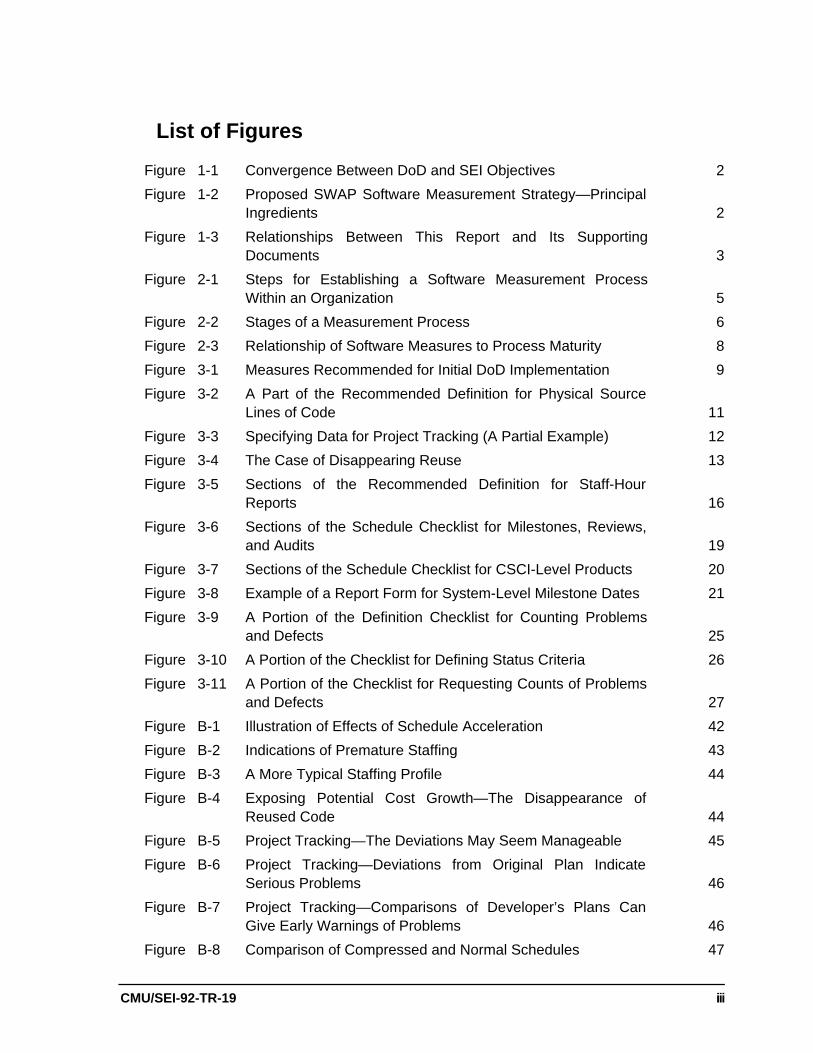
List of Figures
Figure 1-1 Convergence Between DoD and SEI Objectives 2
Figure 1-2 Proposed SWAP Software Measurement Strategy—PrincipalIngredients 2
Figure 1-3 Relationships Between This Report and Its SupportingDocuments 3
Figure 2-1 Steps for Establishing a Software Measurement ProcessWithin an Organization 5
Figure 2-2 Stages of a Measurement Process 6
Figure 2-3 Relationship of Software Measures to Process Maturity 8
Figure 3-1 Measures Recommended for Initial DoD Implementation 9
Figure 3-2 A Part of the Recommended Definition for Physical SourceLines of Code 11
Figure 3-3 Specifying Data for Project Tracking (A Partial Example) 12
Figure 3-4 The Case of Disappearing Reuse 13
Figure 3-5 Sections of the Recommended Definition for Staff-HourReports 16
Figure 3-6 Sections of the Schedule Checklist for Milestones, Reviews,and Audits 19
Figure 3-7 Sections of the Schedule Checklist for CSCI-Level Products 20
Figure 3-8 Example of a Report Form for System-Level Milestone Dates 21
Figure 3-9 A Portion of the Definition Checklist for Counting Problemsand Defects 25
Figure 3-10 A Portion of the Checklist for Defining Status Criteria 26
Figure 3-11 A Portion of the Checklist for Requesting Counts of Problemsand Defects 27
Figure B-1 Illustration of Effects of Schedule Acceleration 42
Figure B-2 Indications of Premature Staffing 43
Figure B-3 A More Typical Staffing Profile 44
Figure B-4 Exposing Potential Cost Growth—The Disappearance ofReused Code 44
Figure B-5 Project Tracking—The Deviations May Seem Manageable 45
Figure B-6 Project Tracking—Deviations from Original Plan IndicateSerious Problems 46
Figure B-7 Project Tracking—Comparisons of Developer’s Plans CanGive Early Warnings of Problems 46
Figure B-8 Comparison of Compressed and Normal Schedules 47
iv CMU/SEI-92-TR-19
Figure B-9 Continually Slipping Milestones 48
Figure B-10 Effects of Slipping Intermediate Milestones 48
Figure B-11 Extrapolating Measurements to Forecast a Completion Date 49
Figure B-12 Effects of Normal Schedules 50
Figure B-13 Effects of Detecting Defects Early 51
Figure C-1 Context for Initial Core Measures 53
CMU/SEI-92-TR-19 v
Acknowledgments
Since 1989, the SEI has been assisted in its software measurement initiative by aMeasurement Steering Committee that consists of senior representatives from industry,government, and academia. The people on this committee have earned solid national andinternational reputations for contributions to measurement and software management. Theyhave helped us guide the efforts of our working groups so that we could integrate their workwith not only this report, but also our other software measurement activities. We thank themembers of the committee for their many thoughtful contributions. The insight and advicethese professionals have provided have been invaluable:
William AgrestiThe MITRE Corporation
Henry BlockUniversity of Pittsburgh
David CardComputer Sciences Corporation
Andrew ChruscickiUS Air Force Rome Laboratory
Samuel ContePurdue University
Bill CurtisSoftware Engineering Institute
Joseph DeanTecolote Research
Stewart FenickUS Army Communications-ElectronicsCommand
Charles FullerAir Force Materiel Command
Robert GradyHewlett-Packard
John HardingBull HN Information Systems, Inc.
Frank McGarryNASA (Goddard Space Flight Center)
John McGarryNaval Underwater Systems Center
Watts HumphreySoftware Engineering Institute
Richard MitchellNaval Air Development Center
John MusaAT&T Bell Laboratories
Alfred PeschelTRW
Marshall PotterDepartment of the Navy
Samuel RedwineSoftware Productivity Consortium
Kyle RoneIBM Corporation
Norman SchneidewindNaval Postgraduate School
Herman SchultzThe MITRE Corporation
Seward (Ed) SmithIBM Corporation
Robert SulgroveNCR Corporation
Ray WolvertonHughes Aircraft

vi CMU/SEI-92-TR-19
As we prepared this report, we were aided in our activities by the able and professionalsupport staff of the SEI. Special thanks are owed to Linda Pesante and Mary Zoys, whoseeditorial assistance helped guide us to a final, publishable form; to Lori Race, whocoordinated our meeting activities and provided outstanding secretarial services; and toHelen Joyce and her assistants, who so competently assured that meeting rooms, lodgings,and refreshments were there when we needed them.
And finally, this report could not have been assembled without the active participation andmany contributions from the other members of the SEI Software Process MeasurementProject and the SWAP measurement team who helped us shape these materials into formsthat could be used to support the DoD Software Action Plan:
John BaumertComputer Sciences Corporation
Mary BusbyIBM Corporation
Andrew ChruscickiUS Air Force Rome Laboratory
Judith ClappThe MITRE Corporation
Donald McAndrewsSoftware Engineering Institute
James RozumSoftware Engineering Institute
Timothy ShimeallNaval Postgraduate School
Patricia Van VerthCanisius College
Software Measurement for DoD Systems:Recommendations for Initial Core Measures
Abstract. This report presents our recommendations for a basic set of softwaremeasures that Department of Defense (DoD) organizations can use to help plan andmanage the acquisition, development, and support of software systems. Theserecommendations are based on work that was initiated by the Software MetricsDefinition Working Group and subsequently extended by the SEI to support the DoDSoftware Action Plan. The central theme is the use of checklists to create and recordstructured measurement descriptions and reporting specifications. These checklistsprovide a mechanism for obtaining consistent measures from project to project and forcommunicating unambiguous measurement results.
1. Introduction
In its 1991 Software Technology Strategy [DoD 91], the Department of Defense (DoD) setthree objectives to be achieved by the software community by the year 2000:
• Reduce equivalent software life-cycle costs by a factor of two.
• Reduce software problem rates by a factor of ten.
• Achieve new levels of DoD mission capability and interoperability via software.
To achieve these objectives, the DoD needs a clear picture of software developmentcapabilities and a quantitative basis from which to measure overall improvement. Withquantitative information, national goals can be set to help keep the entire communitycompetitive and focused on continuous improvement of products and processes. This is notpossible today. Few organizations have a comprehensive, clearly defined softwaremeasurement program, and measurement is frequently done in different ways. Becausethere are no standard methods for measuring and reporting software products andprocesses, comparisons across domains or across the nation are impossible. A UScompany cannot know if its software quality is better or worse than the national averagebecause no such national information is available. The meters, liters, and grams available asstandards in other disciplines are missing, and there is seldom a clear understanding of howa measure on one software project can be compared or converted to a similar measure onanother.
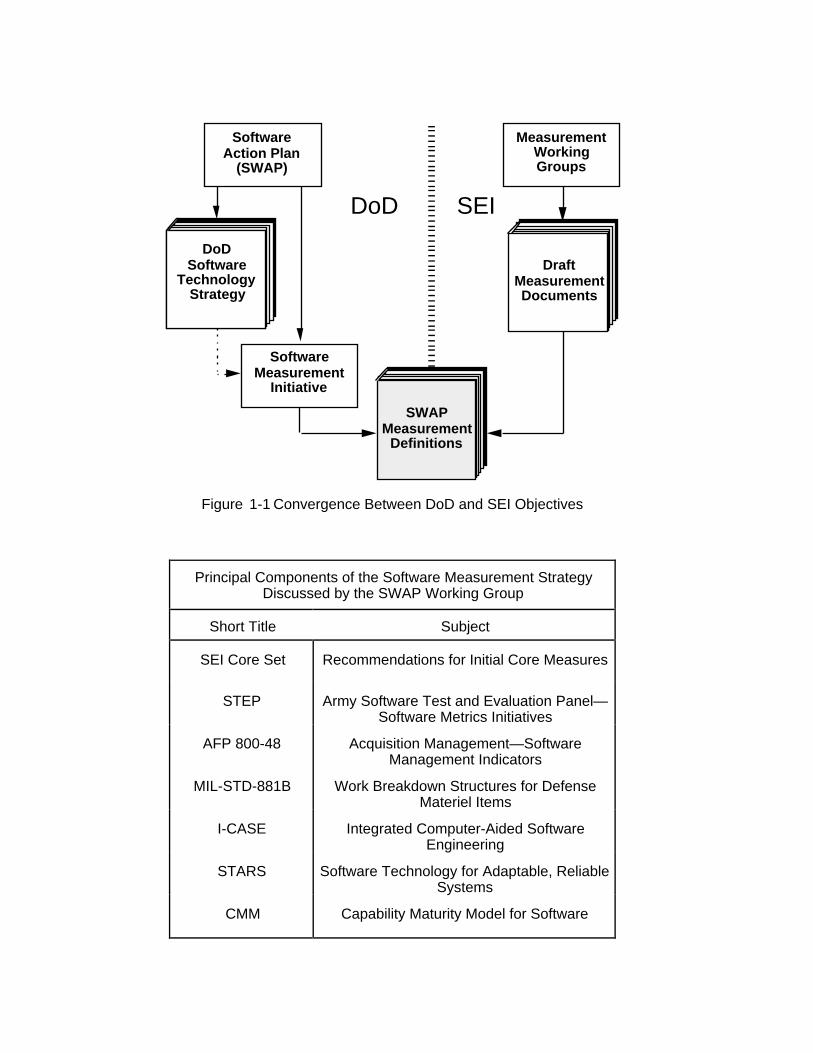
The Software Technology Strategy has now been made part of a larger DoD initiative calledthe Software Action Plan (SWAP). This plan establishes 17 initiatives related to developingand managing software systems. One of its initiatives is to define a core set of measures foruse within DoD software projects. The Software Engineering Institute (SEI) was asked tolead this initiative because there was a natural convergence between DoD objectives andwork that the SEI already had underway (Figure 1-1).
DoD SEI
DoDSoftware
TechnologyStrategy
SoftwareAction Plan
(SWAP)
SoftwareMeasurement
Initiative
MeasurementWorkingGroups
DraftMeasurementDocuments
SWAPMeasurement
Definitions
Figure 1-1 Convergence Between DoD and SEI Objectives
Principal Components of the Software Measurement StrategyDiscussed by the SWAP Working Group
Short Title Subject
SEI Core Set Recommendations for Initial Core Measures
STEP Army Software Test and Evaluation Panel—Software Metrics Initiatives
AFP 800-48 Acquisition Management—SoftwareManagement Indicators
MIL-STD-881B Work Breakdown Structures for DefenseMateriel Items
I-CASE Integrated Computer-Aided SoftwareEngineering
STARS Software Technology for Adaptable, ReliableSystems
CMM Capability Maturity Model for Software
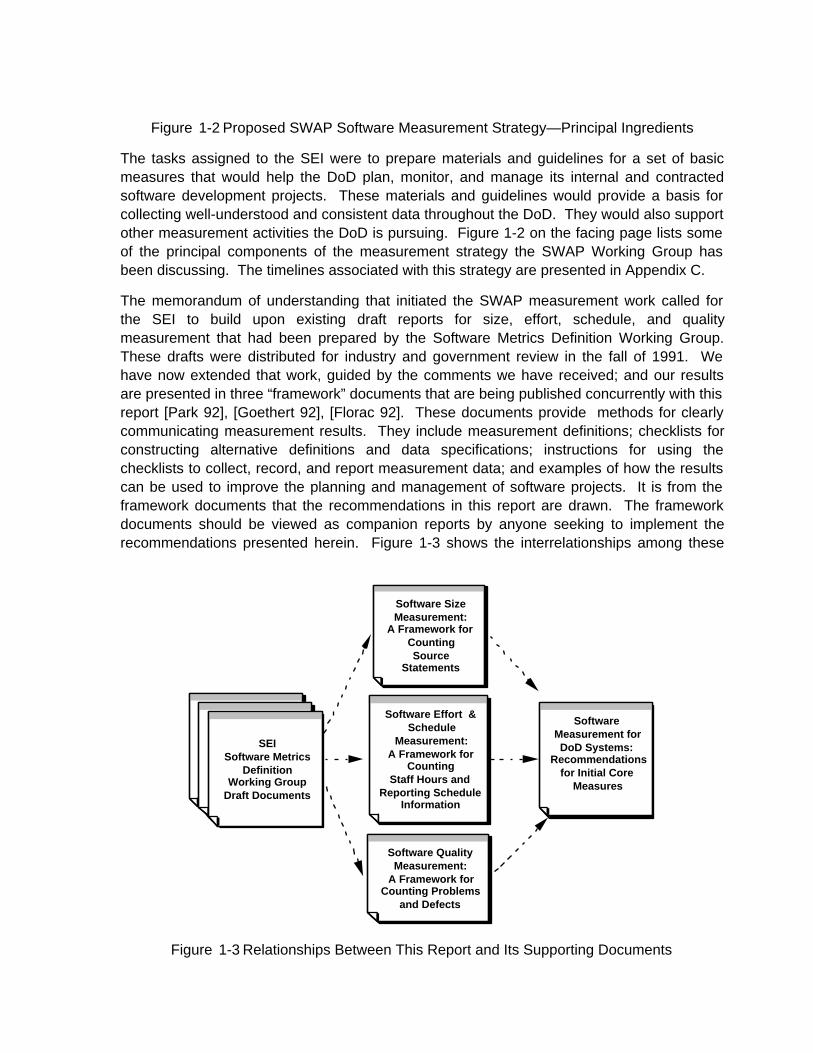
Figure 1-2 Proposed SWAP Software Measurement Strategy—Principal Ingredients
The tasks assigned to the SEI were to prepare materials and guidelines for a set of basicmeasures that would help the DoD plan, monitor, and manage its internal and contractedsoftware development projects. These materials and guidelines would provide a basis forcollecting well-understood and consistent data throughout the DoD. They would also supportother measurement activities the DoD is pursuing. Figure 1-2 on the facing page lists someof the principal components of the measurement strategy the SWAP Working Group hasbeen discussing. The timelines associated with this strategy are presented in Appendix C.
The memorandum of understanding that initiated the SWAP measurement work called forthe SEI to build upon existing draft reports for size, effort, schedule, and qualitymeasurement that had been prepared by the Software Metrics Definition Working Group.These drafts were distributed for industry and government review in the fall of 1991. Wehave now extended that work, guided by the comments we have received; and our resultsare presented in three “framework” documents that are being published concurrently with thisreport [Park 92], [Goethert 92], [Florac 92]. These documents provide methods for clearlycommunicating measurement results. They include measurement definitions; checklists forconstructing alternative definitions and data specifications; instructions for using thechecklists to collect, record, and report measurement data; and examples of how the resultscan be used to improve the planning and management of software projects. It is from theframework documents that the recommendations in this report are drawn. The frameworkdocuments should be viewed as companion reports by anyone seeking to implement therecommendations presented herein. Figure 1-3 shows the interrelationships among these
SEISoftware Metrics
DefinitionWorking Group
Draft Documents
Software Size Measurement:
A Framework forCountingSource
Statements
Software Effort & Schedule
Measurement:A Framework for
CountingStaff Hours and
Reporting Schedule Information
Software Quality Measurement:
A Framework forCounting Problems
and Defects
SoftwareMeasurement for DoD Systems:
Recommendationsfor Initial Core
Measures
SEISoftware Metrics
DefinitionWorking Group
Draft Documents
SEISoftware Metrics
DefinitionWorking Group
Draft Documents
Figure 1-3 Relationships Between This Report and Its Supporting Documents
reports.
The starting point for our measurement definition work has been management’s need foranswers to several key questions that are present in any software project:
• How large is the job?
• Do we have sufficient staff to meet our commitments?
• Will we deliver on schedule?
• How good is our product?
• How are we doing with respect to our plans?
To address these questions, we have concentrated on developing methods for obtainingunambiguous measures for size, effort, schedule, and quality. Reliable assessments ofthese characteristics are crucial to managing project commitments. Measures of thesecharacteristics also serve as foundations for achieving improved levels of process maturity,as defined in the SEI Capability Maturity Model for Software [Humphrey 89], [Paulk 91],[Weber 91].
The objective of our measurement work is to assist program managers, project managers,and government sponsors who want to improve their software products and processes. Thepurpose of the recommendations in this report and its supporting framework documents is toprovide operational mechanisms for getting information for three important managementfunctions:
• Project planning—estimating costs, schedules, and defect rates.
• Project management—tracking and controlling costs, schedules, and quality.
• Process improvement—providing baseline data, tracing root causes of problems anddefects, identifying changes from baseline data, and measuring trends.
The measures we recommend in this report form a basis from which to build acomprehensive measurement and process improvement program. We support thesemeasures with structured methods that can help organizations implement clear andconsistent recording and reporting. The methods include provisions for capturing theadditional details that individual organizations need for addressing issues important to localprojects and processes.
A Note on Implementation Policy
Our understanding is that the DoD plans to implement the recommendations in this report.Although we expect to be assisting the DoD in this endeavor, responsibility forimplementation rests with the Department of Defense. Questions with respect toimplementation policy and directives should be referred to the appropriate DoD agencies.
2. Integrating Measurement with Software Processes
Collecting and using even the most basic measures in ways that are meaningful will prove tobe a challenge for many organizations. Although some projects already collect forms of themeasures we recommend and a number of others as well, it is also true that many measure-ment efforts have failed because they attempted to collect too much too soon [Rifkin 91].This chapter describes an implementation strategy that addresses both the challenge andplanning of software measurement. The strategy stresses foundations that must be laid ifmeasurement is to be successful.
2.1. Defining the Measurement Process
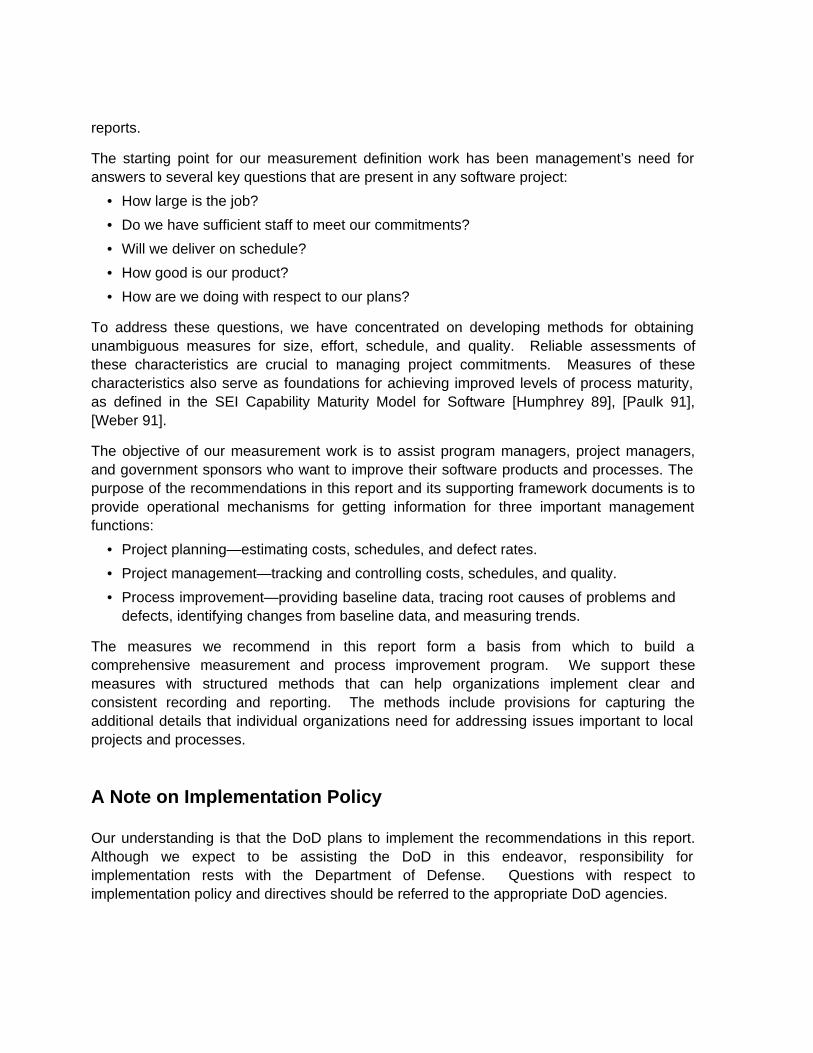
Measurement definitions like those in our framework documents address but one part of ameasurement program. A broader process and process infrastructure is needed to establishsuccessful software measurement within an organization. Figure 2-1 shows the sequence oftasks that should be performed [McAndrews 92]. Organizations often tend to overlook thefirst two steps and jump immediately to prototyping or collecting data. When this happens,measurement is apt to become viewed as just another cost rather than as an integral part ofmanagement and process improvement.
Develop strategy
Establish process
Prototype process
Establish policy
Establish office
Expand program
Figure 2-1 Steps for Establishing a Software Measurement Process Within an Organization
In the context of Figure 2-1, the Establish process step entails identifying and integrating aconsistent, goal-related, measurement process into an organization’s overall software
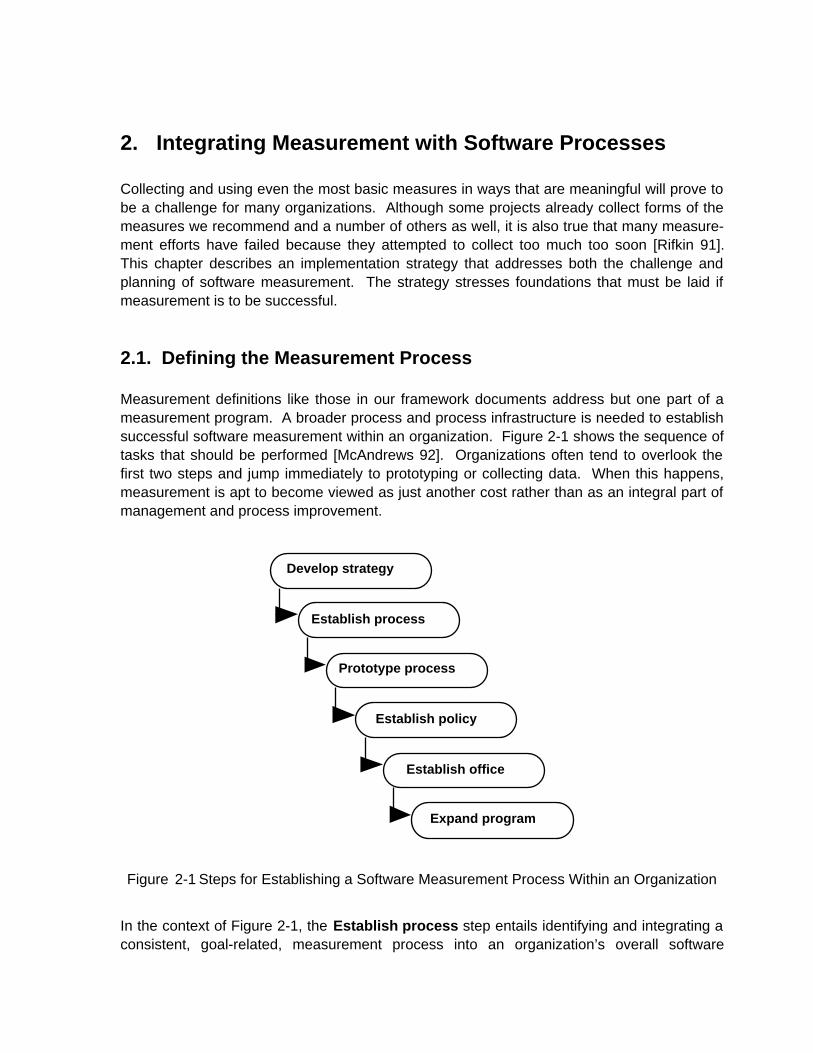
methodology. Figure 2-2 provides a top-level view of the stages that comprise successfulmeasurement processes [McAndrews 92]. Organizations begin the process with specificmanagement needs. During the first stage, they identify the measurements they mustcollect. They do this by identifying the current organizational situation, primary goals, andcorresponding primitive measures that will be used to determine progress toward the goals.Basili's Goal/Question/Metric (GQM) paradigm [Basili 88] provides guidelines that can beused at this stage to help identify the primitive measures. Without careful analysis ofmanagement needs before measurement begins, organizations frequently collect data that isnot meaningful for making decisions within their overall process.
Management Identify• Current situation• Primary goals• Primitive measures
Define• Measurement specs• Measurement report• Analysis techniques
Obtain feedback• Presentation• Evaluation
Analyze• Measurement report
Collect• Primitive data
need
Figure 2-2 Stages of a Measurement Process
Once primitive measures are identified, they must be defined. While the Identify stageidentifies measures such as staff-hours or source lines of code, the Define stage states howthese measures are to be collected and used. During this stage, organizations createspecifications for each of their primitive measures. They also define reporting formats andprocedures for analyzing the data that will be collected. The procedures show how the datawill be analyzed to establish baselines and determine progress toward management goals.Without this stage, data tends to be inconsistently reported and untrustworthy, and managersseldom know if they can compare their data with that of other projects.
Completion of the first two stages results in a documented baseline measurement plan.Organizations can now follow this plan to execute the next stages: Collect data and Analyzethe data as defined. The Obtain feedback stage includes presenting and distributingmeasurement results and incorporating reviewers’ comments into the reports. In addition,the Obtain feedback stage evaluates the effectiveness of the efforts at each stage in
addressing the original project goals. The situation and goals are then re-evaluated and thecycle is repeated, much as in the Plan/Do/Check/Act cycle upon which the quality methods ofShewhart and Deming are built [Deming 86].
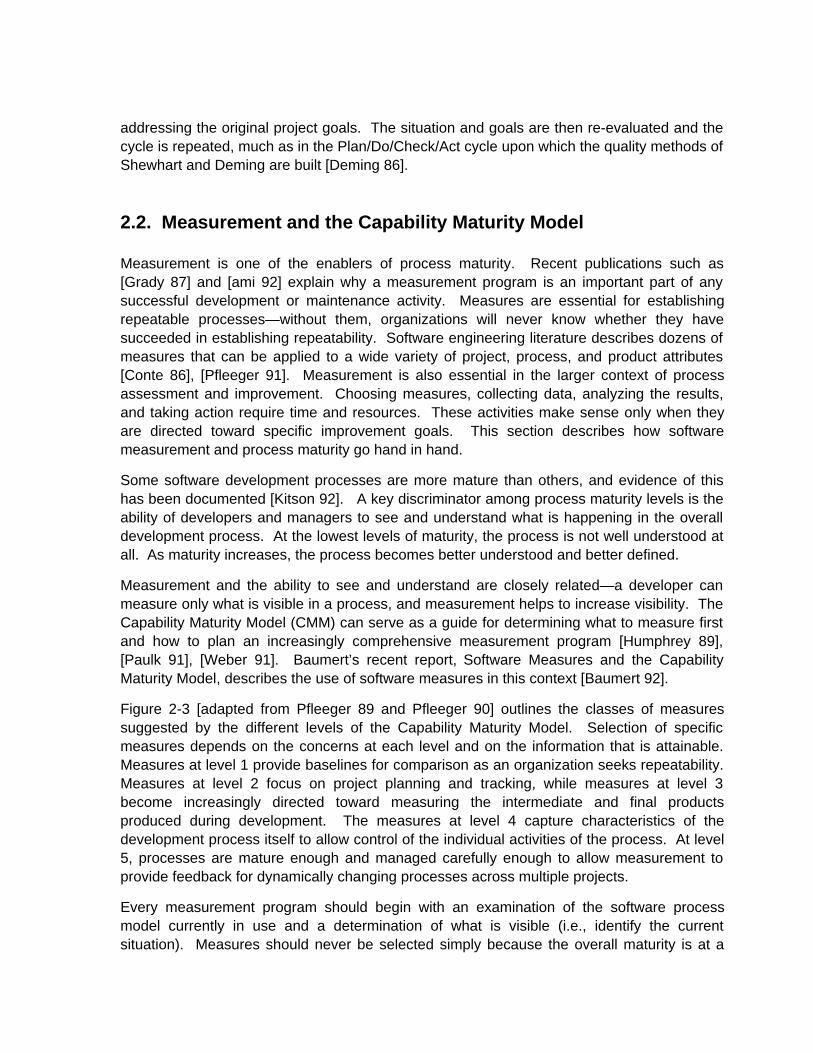
2.2. Measurement and the Capability Maturity Model
Measurement is one of the enablers of process maturity. Recent publications such as[Grady 87] and [ami 92] explain why a measurement program is an important part of anysuccessful development or maintenance activity. Measures are essential for establishingrepeatable processes—without them, organizations will never know whether they havesucceeded in establishing repeatability. Software engineering literature describes dozens ofmeasures that can be applied to a wide variety of project, process, and product attributes[Conte 86], [Pfleeger 91]. Measurement is also essential in the larger context of processassessment and improvement. Choosing measures, collecting data, analyzing the results,and taking action require time and resources. These activities make sense only when theyare directed toward specific improvement goals. This section describes how softwaremeasurement and process maturity go hand in hand.
Some software development processes are more mature than others, and evidence of thishas been documented [Kitson 92]. A key discriminator among process maturity levels is theability of developers and managers to see and understand what is happening in the overalldevelopment process. At the lowest levels of maturity, the process is not well understood atall. As maturity increases, the process becomes better understood and better defined.
Measurement and the ability to see and understand are closely related—a developer canmeasure only what is visible in a process, and measurement helps to increase visibility. TheCapability Maturity Model (CMM) can serve as a guide for determining what to measure firstand how to plan an increasingly comprehensive measurement program [Humphrey 89],[Paulk 91], [Weber 91]. Baumert’s recent report, Software Measures and the CapabilityMaturity Model, describes the use of software measures in this context [Baumert 92].
Figure 2-3 [adapted from Pfleeger 89 and Pfleeger 90] outlines the classes of measuressuggested by the different levels of the Capability Maturity Model. Selection of specificmeasures depends on the concerns at each level and on the information that is attainable.Measures at level 1 provide baselines for comparison as an organization seeks repeatability.Measures at level 2 focus on project planning and tracking, while measures at level 3become increasingly directed toward measuring the intermediate and final productsproduced during development. The measures at level 4 capture characteristics of thedevelopment process itself to allow control of the individual activities of the process. At level5, processes are mature enough and managed carefully enough to allow measurement toprovide feedback for dynamically changing processes across multiple projects.
Every measurement program should begin with an examination of the software processmodel currently in use and a determination of what is visible (i.e., identify the currentsituation). Measures should never be selected simply because the overall maturity is at a
particular level. If one part of a process is more mature than others, tailored measures canenhance the visibility of that part and help meet overall project goals while basic measuresare bringing the rest of the process up to a higher level of capability. For example, in arepeatable process with a well-defined configuration management activity, it may beappropriate and desirable to track reused elements from their origins to their uses in finalproducts, even though the measures associated with this level of detail are not generallycharacteristic of level 2 organizations.
Evidence suggests that successful measurement programs start small and grow according tothe goals and needs of the organization [Rifkin 91]. A measurement program should beginby addressing the critical problems or goals of each project, viewed in terms of what ismeaningful or realistic at that organization’s process maturity level. The process maturityframework then acts as a guide for expanding and building a measurement program that notonly takes advantage of visibility and maturity, but also enhances process improvementactivities.
Maturity Level Characteristics Focus of Measurements
1.Initial Ad hoc, chaotic Establishing baselines for planningand estimating
2.Repeatable Processes depend onindividuals
Project tracking and control
3.Defined Processes are definedand institutionalized
Definition and quantification of inter-mediate products and processes
4.Managed Processes are measured Definition, quantification, and controlof subprocesses and elements
5.Optimizing Improvements are fedback to processes
Dynamic optimization andimprovement across projects
Figure 2-3 Relationship of Software Measures to Process Maturity
3. Recommendations for Specific Measures
This chapter presents our recommendations for a basic set of software measures for usewith DoD software systems. These recommendations are based on checklists, forms, andoperational practices that are presented and discussed more completely in three frameworkreports:
• Software Size Measurement: A Framework for Counting Source Statements [Park 92]
• Software Effort & Schedule Measurement: A Framework for Counting Staff-Hoursand Reporting Schedule Information [Goethert 92]
• Software Quality Measurement: A Framework for Counting Problems and Defects[Florac 92]
The framework reports should be used as references when implementing therecommendations in this report.
In the discussion that follow, we first introduce the basic measures and explain the criteria weused in developing the definitions and practices we recommend. Then, for each measure,we illustrate portions of the checklists we have constructed for defining and reportingmeasurement results. We support these illustrations with reasons for using the measures,and we provide advice and recommendations for making the measures effective.
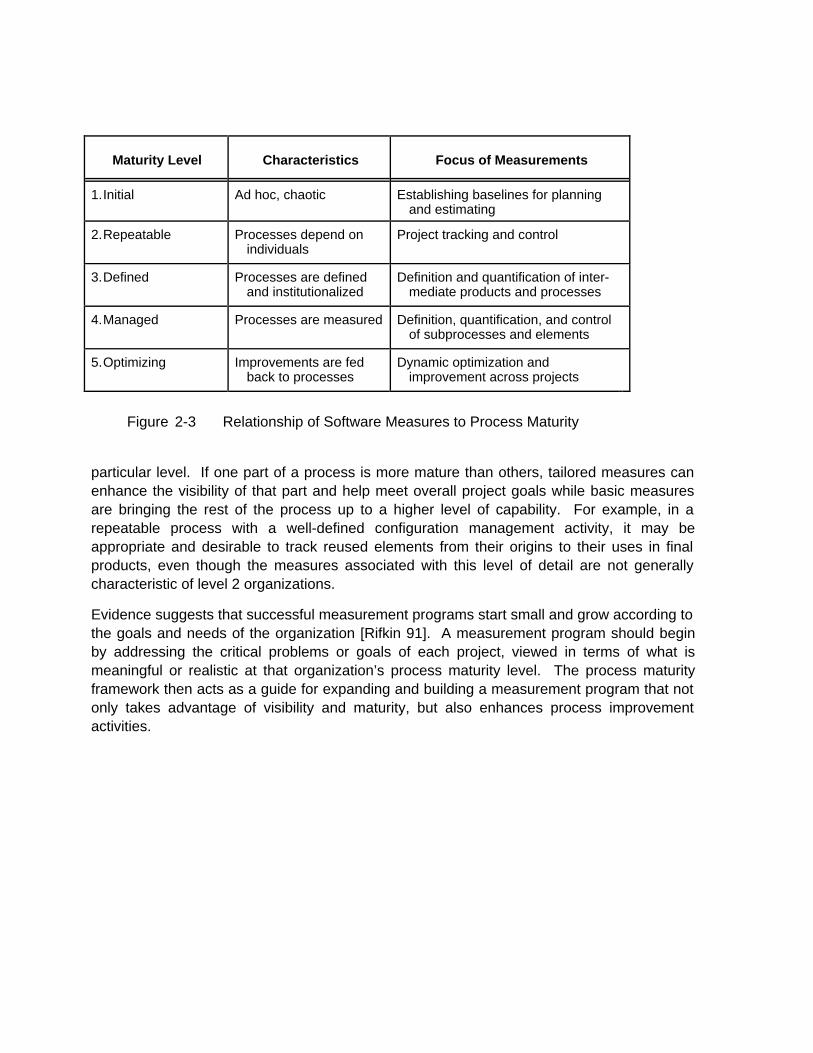
3.1. The Basic Measures
We recommend that four basic measures be among the management tools used within DoDorganizations for acquiring, developing, and maintaining software systems. These measuresaddress important product and process characteristics that are central to planning, tracking,and process improvement. Figure 3-1 lists the measures and relates them to thecharacteristics they address.
Figure 3-1 Measures Recommended for Initial DoD Implementation
Unit of measure Characteristics addressed
Counts of physical source lines of code Size, progress, reuse
Counts of staff-hours expended Effort, cost, resource allocations
Calendar dates Schedule
Counts of software problems and defects Quality, readiness for delivery,improvement trends
The measures in Figure 3-1 are not the only ones that can be used to describe softwareproducts and processes. But they are practical measures that do produce useful information.And, importantly, they are measures that we can define in ways that promote consistent use.
The exact definitions we recommend are presented in the three framework reports citedabove. These definitions follow structured rules that state explicitly what is included in eachmeasure and what is excluded. They are accompanied by checklists that individualorganizations can use to specify and obtain the supporting data that they need foraddressing the management issues that are important to them. The checklists can be usedalso to describe the measurement data that is reported now, so that receivers of theinformation will not be misled by unstated assumptions or local variations in measurementpractices.
In preparing the framework reports, we were guided by two criteria:
• Communication: If someone uses one of our checklists or definitions to record andreport measurement results, will others know precisely what is included, what isexcluded, and how the measurement unit is defined?
• Repeatability: Would others be able to repeat the measurements and get the sameresults?
These properties are essential if misunderstandings and misinterpretations are to beavoided. They are essential also if consistency is to be achieved across projects or fromorganization to organization.
As we show in the framework reports, each basic measure provides for collecting data onmultiple attributes. Rarely, if ever, will experienced managers be satisfied with just a singlenumber. For example, problems and defects will usually be classified according to attributessuch as status, type, severity, and priority; effort will be classified by labor class and type ofwork performed; schedules will be defined in terms of dates and completion criteria; and sizemeasures will be aggregated according to programming language, statement type,development status, origin, and production method. Moreover, to be of value, both estimatesand measured values must be collected at regular intervals (e.g., weekly or monthly). Thus,what may at first glance appear to be just a few measures is, in reality, much more.Implementing the collection and use of these measures uniformly across the DoD usingclearly specified, consistent definitions, will be a major accomplishment. Neither the difficultynor the value of this task should be underestimated.
The four sections that follow present our recommendations for addressing each of the basicmeasurement categories. They illustrate the checklist-based methods we recommend, givereasons for using each measure, and present specific recommendations for implementationand use.

3.2. Size
We recommend that DoD organizations adopt physical source lines of code (SLOC) as oneof their first measures of software size. The coverage we recommend is defined in theframework report on software size [Park 92, Figure 5-1]. Figure 3-2 shows a portion thedefinition so that you can see how we have used checklists to make measurement rulesexplicit.
Definition Checklist for Source Statement Counts
Definition name: Physical Source Lines of Code Date: 8/7/92(basic definition) Originator: SEI
Measurement unit: Physical source lines ✔
Logical source statements
Statement type Definition ✔ Data array Includes ExcludesWhen a line or statement contains more than one type,classify it as the type with the highest precedence.
1 Executable Order of precedence -> 1 ✔
2 Nonexecutable3 Declarations 2 ✔
4 Compiler directives 3 ✔
5 Comments6 On their own lines 4 ✔
7 On lines with source code 5 ✔
8 Banners and nonblank spacers 6 ✔
9 Blank (empty) comments 7 ✔
10 Blank lines 8 ✔1112How produced Definition ✔ Data array Includes Excludes
1 Programmed ✔
2 Generated with source code generators ✔
3 Converted with automated translators ✔
4 Copied or reused without change ✔
5 Modified ✔
6 Removed ✔
78
Figure 3-2 A Part of the Recommended Definition for Physical Source Lines of Code
As Figure 3-2 shows, the measure we recommend for physical source lines is a version ofone often called noncomment, nonblank source statements. However, it is considerablymore explicit. Not only does it spell out the rules to be used when comments are on thesame lines as other source statements, it also addresses all origins, stages of development,and forms of code production and distinguishes between delivered and nondeliveredstatements, code that is integral to the product and external to the product, operative andinoperative (dead) code, master source code and various kinds of copies, and differentsource languages.
The full definition in the framework report on software size produces a single measure of sizefor each source language used. We recommend the DoD and its supporting organizationsuse this measure to describe the overall size of the products they build and support.
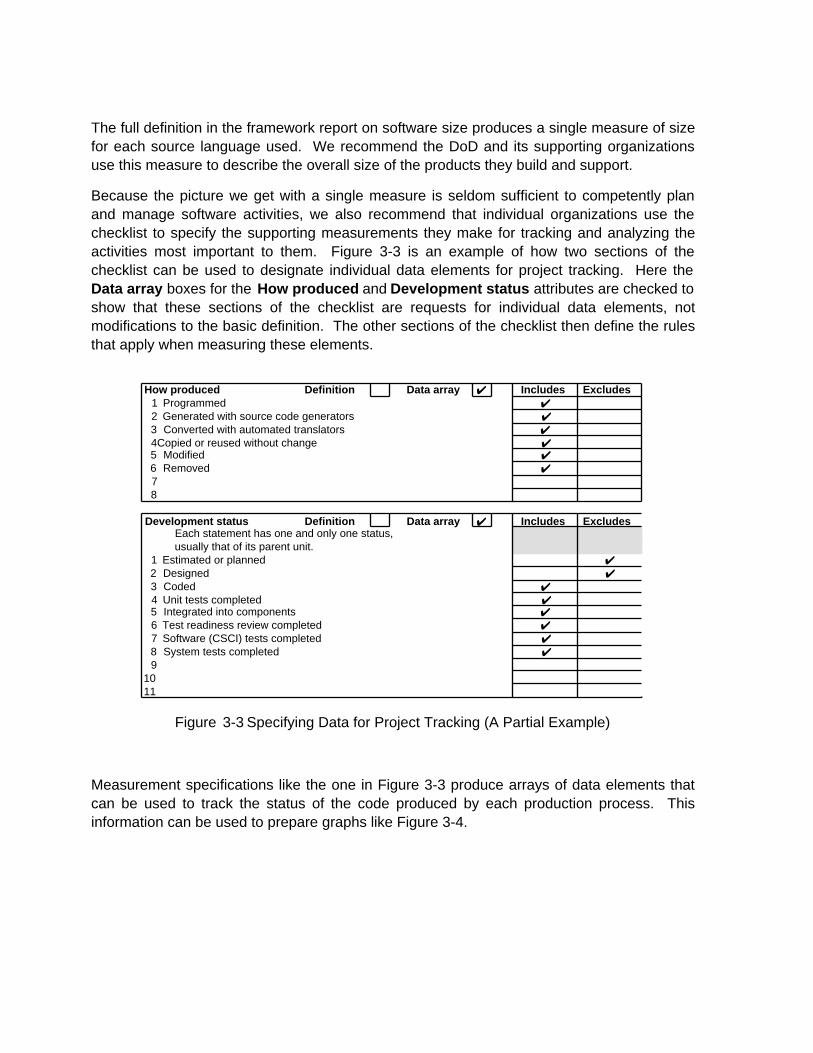
Because the picture we get with a single measure is seldom sufficient to competently planand manage software activities, we also recommend that individual organizations use thechecklist to specify the supporting measurements they make for tracking and analyzing theactivities most important to them. Figure 3-3 is an example of how two sections of thechecklist can be used to designate individual data elements for project tracking. Here theData array boxes for the How produced and Development status attributes are checked toshow that these sections of the checklist are requests for individual data elements, notmodifications to the basic definition. The other sections of the checklist then define the rulesthat apply when measuring these elements.
How produced Definition Data array ✔ Includes Excludes1 Programmed ✔
2 Generated with source code generators ✔
3 Converted with automated translators ✔
4 Copied or reused without change ✔5 Modified ✔
6 Removed ✔
78
Development status Definition Data array ✔ Includes ExcludesEach statement has one and only one status, usually that of its parent unit.
1 Estimated or planned ✔
2 Designed ✔
3 Coded ✔
4 Unit tests completed ✔5 Integrated into components ✔
6 Test readiness review completed ✔
7 Software (CSCI) tests completed ✔
8 System tests completed ✔
91011
Figure 3-3 Specifying Data for Project Tracking (A Partial Example)
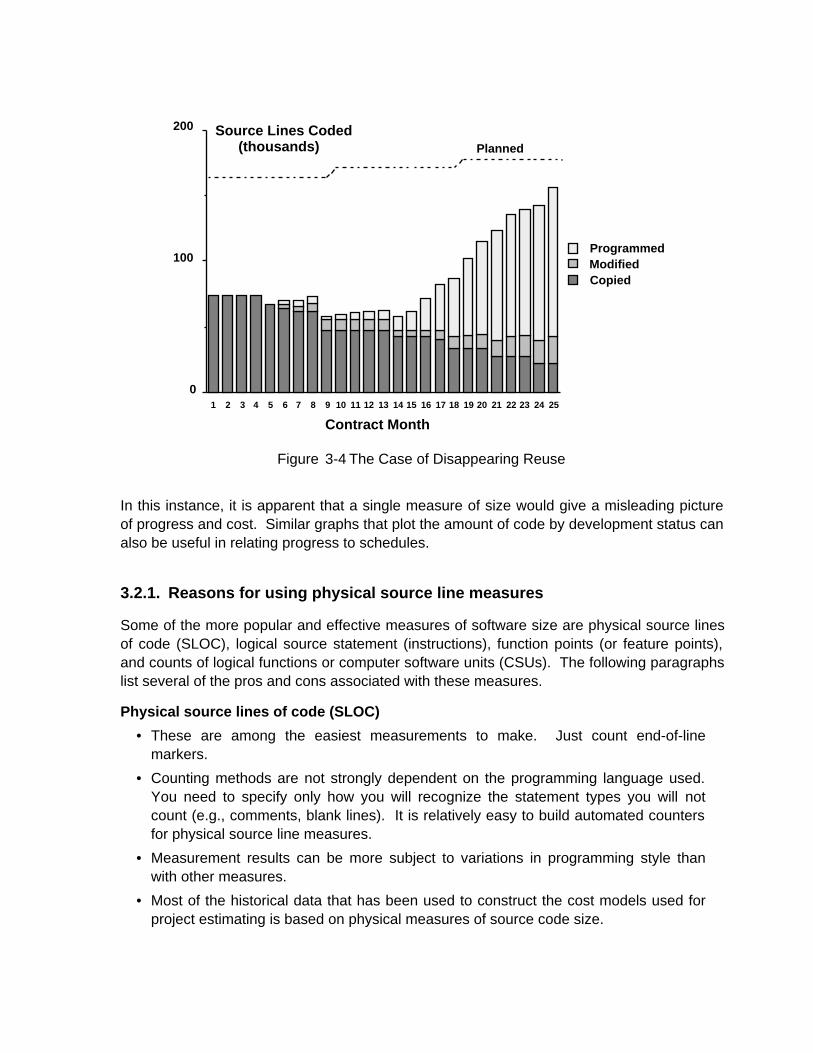
Measurement specifications like the one in Figure 3-3 produce arrays of data elements thatcan be used to track the status of the code produced by each production process. Thisinformation can be used to prepare graphs like Figure 3-4.
1 2 3 4 5 6 7 8 9 10 11 12 13 14 15 16 17 18 19 20 21 22 23 24 25
0
100
200
CopiedModifiedProgrammed
Contract Month
Source Lines Coded(thousands) Planned
Figure 3-4 The Case of Disappearing Reuse
In this instance, it is apparent that a single measure of size would give a misleading pictureof progress and cost. Similar graphs that plot the amount of code by development status canalso be useful in relating progress to schedules.
3.2.1. Reasons for using physical source line measures
Some of the more popular and effective measures of software size are physical source linesof code (SLOC), logical source statement (instructions), function points (or feature points),and counts of logical functions or computer software units (CSUs). The following paragraphslist several of the pros and cons associated with these measures.
Physical source lines of code (SLOC)
• These are among the easiest measurements to make. Just count end-of-linemarkers.
• Counting methods are not strongly dependent on the programming language used.You need to specify only how you will recognize the statement types you will notcount (e.g., comments, blank lines). It is relatively easy to build automated countersfor physical source line measures.
• Measurement results can be more subject to variations in programming style thanwith other measures.
• Most of the historical data that has been used to construct the cost models used forproject estimating is based on physical measures of source code size.
Logical source statements (instructions)
• Users must specify exact and complete rules for identifying the beginnings andendings for all possible statement types.
• Every language is different.• Users must specify complete rules for each.• Different rules for different languages can cause lack of comparability across
languages.
• Users must specify the rules to be used for recognizing and counting embeddedstatements for each source language.
• Reference manuals for several important languages reserve the term “statement” tomean executable statement. This can introduce confusion with respect to elementslike declarations, comments, compiler directives, and blank lines—any of which wemay want to count.
• Methods for designating comments vary widely among languages. Without aconsistent concept for what constitutes a “logical comment,” most organizations haveto resort to physical line counts to achieve any form of comparability if the extent ofcommenting is to be measured.
• Users must state clear and consistent rules for distinguishing between expressionsand statements. This can present problems in expression-based languages such asC and C++.
Function Points and Feature Points
• Function point and feature point counts do not depend on the source languagesused.
• Estimates for function points and feature points can be obtained early in thedevelopment cycle.
• Function point and feature point counts are oriented toward the customer’s view(what the software does) rather than the producer’s view (how he does it). This putsthe focus on value received, rather than on the particular design that is employed.
• Because function point and feature point counts are system-level (distributed)measures, we cannot use them to determine status. For example, they cannot helpus say that a project is 80% of the way through coding and 35% of the way throughcomponent integration. This makes them unsuitable for project tracking.
• Function point and feature point counts are not equally applicable to all kinds ofsoftware. Although effective in business environments, they have not enjoyedwidespread success in embedded systems or heavily computational applications.
• Automated function point or feature point counters do not yet exist.
Counts of units or functions
• These are clearly useful measures. We suggest you use them to supplement otherbasic size measures. But as of now there is no work that we know to help inconstructing and communicating formal definitions for these measures.
Although we recommend starting with physical source lines as one of the first measures ofsoftware size, we do not suggest that anyone abandon any measure that is now being usedto good effect. Nor do we suggest that counts of physical source lines are the best measurefor software size. It is unlikely that they are. But until we get firm, well-defined evidence thatother measures are better, we opt for simplicity—and in particular, for the simplest set ofexplicit rules that can be applied across many languages.
3.2.2. Specific recommendations for counting physical source lines
• Use the size checklist and supplemental rules forms to record the rules you currentlyuse in your size reports [Park 92, Figures 3-2, 7-1, 7-2, 7-3].
• Adopt physical source lines of code (SLOC) as one of your first measures of softwaresize. This measure should supplement rather than replace size measures youcurrently use.
• When counting physical source lines of code, use the definition for basic SLOC inFigure 5-1 of the Software Size Measurement framework report [Park 92].
• When adopting (or modifying) the recommended definition for physical source lines,complete a copy of the supplemental rules form for each language you plan tomeasure [Park 92, Figure 7-1]).
• If you presently count logical source statements, consider adopting the definition inFigure 5-2 of the Software Size Measurement framework report [Park 92]. Completethis definition by filling out the supplemental rules form for each source language youuse [Park 92, Figure 7-2].
• Use Data Spec A or a subset thereof to collect data for project tracking [Park 92,Figure 5-4].
• Use Data Spec B or a similar specification at the completion of projects to collectpostmortem data for future planning and estimating [Park 92, Figure 5-9].
• Use the size checklist and supplemental rules forms to record and report the rulesyou use when preparing estimates of software size.
3.3. Effort
We recommend that DoD organizations adopt staff-hours as their principal measure foreffort. The staff-hour unit we recommend is the one used by the IEEE in its draft Standardfor Software Productivity Metrics: “A staff-hour is an hour of time expended by a member ofthe staff” [IEEE P1045/D5.0].
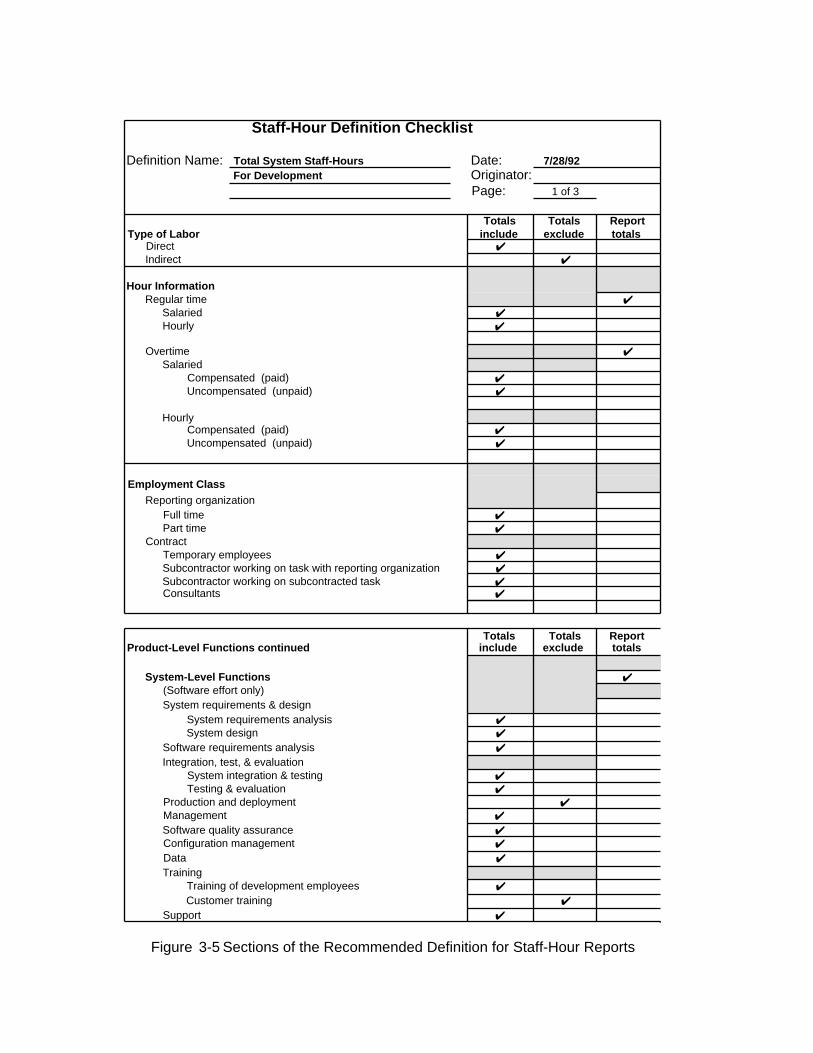
The coverage we recommend for total staff-hour measures is defined in the framework reporton effort and schedule measurement [Goethert 92, Figure 8-1]. Figure 3-5 shows two partsof the checklist to illustrate some of the coverage rules we recommend.
Staff-Hour Definition Checklist
Definition Name: Total System Staff-Hours Date: 7/28/92 For Development Originator:
Page: 1 of 3
Totals Totals ReportType of Labor include exclude totals
Direct ✔
Indirect ✔
Hour InformationRegular time ✔
Salaried ✔
Hourly ✔
Overtime ✔
SalariedCompensated (paid) ✔
Uncompensated (unpaid) ✔
Hourly Compensated (paid) ✔
Uncompensated (unpaid) ✔
Employment Class Reporting organization
Full time ✔
Part time ✔
Contract Temporary employees ✔
Subcontractor working on task with reporting organization ✔
Subcontractor working on subcontracted task ✔ Consultants ✔
Totals Totals ReportProduct-Level Functions continued include exclude totals
System-Level Functions ✔
(Software effort only)System requirements & design
System requirements analysis ✔
System design ✔
Software requirements analysis ✔
Integration, test, & evaluationSystem integration & testing ✔
Testing & evaluation ✔
Production and deployment ✔
Management ✔
Software quality assurance ✔
Configuration management ✔
Data ✔
TrainingTraining of development employees ✔
Customer training ✔
Support ✔
Figure 3-5 Sections of the Recommended Definition for Staff-Hour Reports
From the full definition in the framework report on effort and schedule measurement,organizations can construct a number of data specifications to meet specific needs. Forexample, subtotals can be requested for any element or collection of elements in thechecklist. Many organizations will want to use these subtotals to estimate and track the effortexpended on major functional activities. Measuring effort for requirements analysis, design,coding, unit testing, integration, IV&V, and configuration management are cases in point.Similarly, individual totals for overtime or for system-level activities may be useful. Individualtotals can also be collected for elements that are excluded from formal definitions of totaleffort.
The coverage requested by our recommended definition ranges more widely than someprojects or organizations may encounter. This should not be a problem. If some elementsin the checklist are not present in a particular project, the effort associated with them will bezero and the overall totals will not be affected.
Of more concern are cases where elements are present but not recorded. There is animportant distinction that must be maintained between elements excluded from a report andelements of effort not performed on a project. It is generally safer and more explicit toinclude elements in your coverage and report zero values for them when they are not presentthan to exclude these values and make readers guess about their existence. This is thereason the definition we recommend for staff-hour coverage includes almost all elements inthe definition checklist. It is also the reason why you will find individual reports for subtotalsto be useful additions to overall measures of total effort.
3.3.1. Reasons for using staff-hour measures
Reliable measures for effort are prerequisites for reliable measures of software cost. Theyare also important in a more direct way. The principal means we have for managing andcontrolling costs and schedules is through planning and tracking the human resources weassign to individual tasks and activities.
Some candidate units for measuring and reporting effort data are labor-months, staff-weeksand staff-hours. The concept of a labor-month is well understood. Nevertheless, usinglabor-months to record and report effort data presents two obstacles:
• There is no standard for the number of hours in a labor-month. Practices vary widelyamong contractors and within the government, and reported values range from lessthan 150 hours per labor-month to more than 170. Moreover, it is possible forindividual organizations to use different definitions for a labor-month on differentprojects, either because of government requirements or because the organization isworking as a subcontractor to another contractor.
• Labor-months often do not provide the granularity we need for measuring andtracking individual activities and processes, particularly when our focus is on processimprovement.
Measuring effort in terms of staff-weeks presents many of the same problems and someadditional ones as well. For example, although the basic assumption is that a calendar weekis five working days, the length of a standard working day can vary from organization toorganization. Weekend work, overtime work, and holidays falling within a week must also beaddressed and defined if staff-week measures are to be used.
By using staff-hours as the fundamental unit for recording and reporting effort data, we avoidthese problems. Labor-month and staff-week measures can still be calculated from staff-hours, should these measures be needed for presentations or other summaries.
3.3.2. Specific recommendations for counting staff-hours
• Adopt staff-hours as your fundamental measure of effort.
• Use the Staff-Hour Definition Checklist and the Supplemental Information Form torecord the definition of staff-hours you are currently using [Goethert 92, Appendix Eand Figure 4-1].
• Use the Staff-Hour Definition Checklist to specify the rules for the effort elements youwant included in and excluded from total staff-hour measures.
• When adopting a definition for the coverage of staff-hour measures, use the onerecommended in the framework report on software effort and schedule measurement[Goethert 92, Figure 8-1].
• Report staff-hour totals at the computer software configuration item (CSCI) level,build level, and system level.
• Use the Staff-Hour Definition Checklist to report and communicate attributes andvalues included in the staff-hour measures.
• At the beginning of projects, use the staff-hour definition checklist to define thecoverage of the effort measures you want reported.
• During projects, use the reporting forms in the framework report to augment (notreplace) your contractually required status reports.
• At the end of projects, retain your staff-hour definition checklists, periodic staff-hourreports, and final staff-hour report.
3.4. Schedule
We recommend that DoD projects adopt structured methods for defining two important andrelated aspects of the schedules they report: the dates (both planned and actual) associatedwith project milestones, reviews, audits, and deliverables; and the exit or completioncriteria associated with each date.
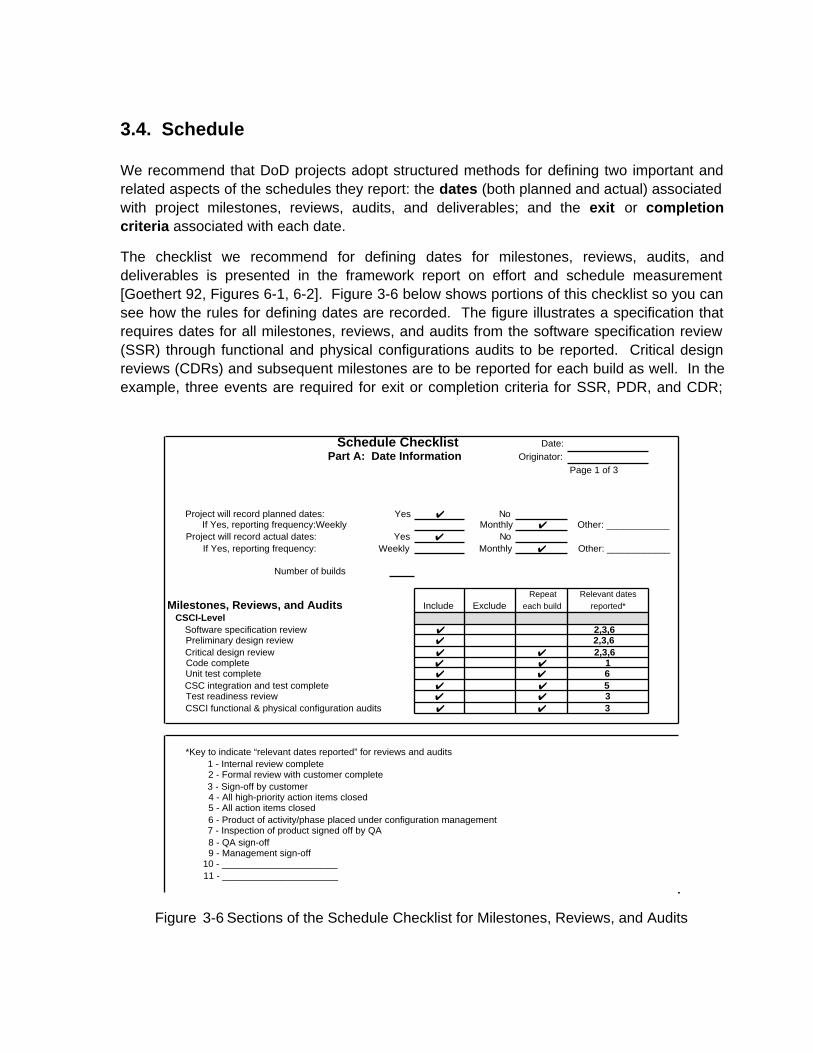
The checklist we recommend for defining dates for milestones, reviews, audits, anddeliverables is presented in the framework report on effort and schedule measurement[Goethert 92, Figures 6-1, 6-2]. Figure 3-6 below shows portions of this checklist so you cansee how the rules for defining dates are recorded. The figure illustrates a specification thatrequires dates for all milestones, reviews, and audits from the software specification review(SSR) through functional and physical configurations audits to be reported. Critical designreviews (CDRs) and subsequent milestones are to be reported for each build as well. In theexample, three events are required for exit or completion criteria for SSR, PDR, and CDR;
Schedule Checklist Date: Part A: Date Information Originator:
Page 1 of 3
Project will record planned dates: Yes ✔ No If Yes, reporting frequency: Weekly Monthly ✔ Other: ____________
Project will record actual dates: Yes ✔ No If Yes, reporting frequency: Weekly Monthly ✔ Other: ____________
Number of builds
Repeat Relevant datesMilestones, Reviews, and Audits Include Exclude each build reported* CSCI-Level
Software specification review ✔ 2,3,6Preliminary design review ✔ 2,3,6Critical design review ✔ ✔ 2,3,6Code complete ✔ ✔ 1Unit test complete ✔ ✔ 6CSC integration and test complete ✔ ✔ 5Test readiness review ✔ ✔ 3CSCI functional & physical configuration audits ✔ ✔ 3
*Key to indicate “relevant dates reported” for reviews and audits 1 - Internal review complete 2 - Formal review with customer complete 3 - Sign-off by customer 4 - All high-priority action items closed 5 - All action items closed 6 - Product of activity/phase placed under configuration management 7 - Inspection of product signed off by QA 8 - QA sign-off 9 - Management sign-off10 - ______________________11 - ______________________
Figure 3-6 Sections of the Schedule Checklist for Milestones, Reviews, and Audits

but only a single criterion is used for each of the remaining milestones, reviews, and audits.Reporting the dates associated with the individual criteria helps insure accuracy in the overallreport. It also provides insight into process timelines that can be useful for planning futureprojects and for process improvement.
The schedule checklist in the framework report lists several completion criteria formilestones, reviews, audits, and deliverables. Others can easily be added. Examples thatcould be appropriate for specific activities include the following:
• Internal review held.
• Formal review with customer held.
• All high-priority action items closed.
• All action items closed.
• Document entered under configuration management.
• Deliverer to customer.
• Customer comments received.
• Changes incorporated.
• Customer sign-off obtained.
The part of the checklist that addresses deliverables is similar to the part that describesmilestones, reviews, and audits. Figure 3-7 shows the portion of the part that defines thedeliverables associated with CSCI-level products.
Page 2 of 3Part A: Date Information (cont.)
Repeat Relevant datesDeliverable Products Include Exclude each build reported* CSCI-Level
Preliminary software requirements spec(s) ✔ 3Software requirements specification(s) ✔ 1,3,5,6Software preliminary design document(s) ✔ 1,3,5,6Software (detailed) design document(s) ✔ ✔ 1,3,5,6Software test description(s) (cases) ✔ ✔ 1,3,5,6Software test description(s) (procedures) ✔ ✔ 1,3,5,6Software test report(s) ✔ ✔ 3,7Source code ✔ ✔ 1,2,3,6,7Software development files ✔Version description document(s) ✔
*Key to indicate “relevant dates reported” for deliverable products1 - Product under configuration control2 - Internal delivery3 - Delivery to customer4 - Customer comments received5 - Changes incorporated6 - Sign-off by customer7 - IV&V sign-off8 -
Figure 3-7 Sections of the Schedule Checklist for CSCI-Level Products
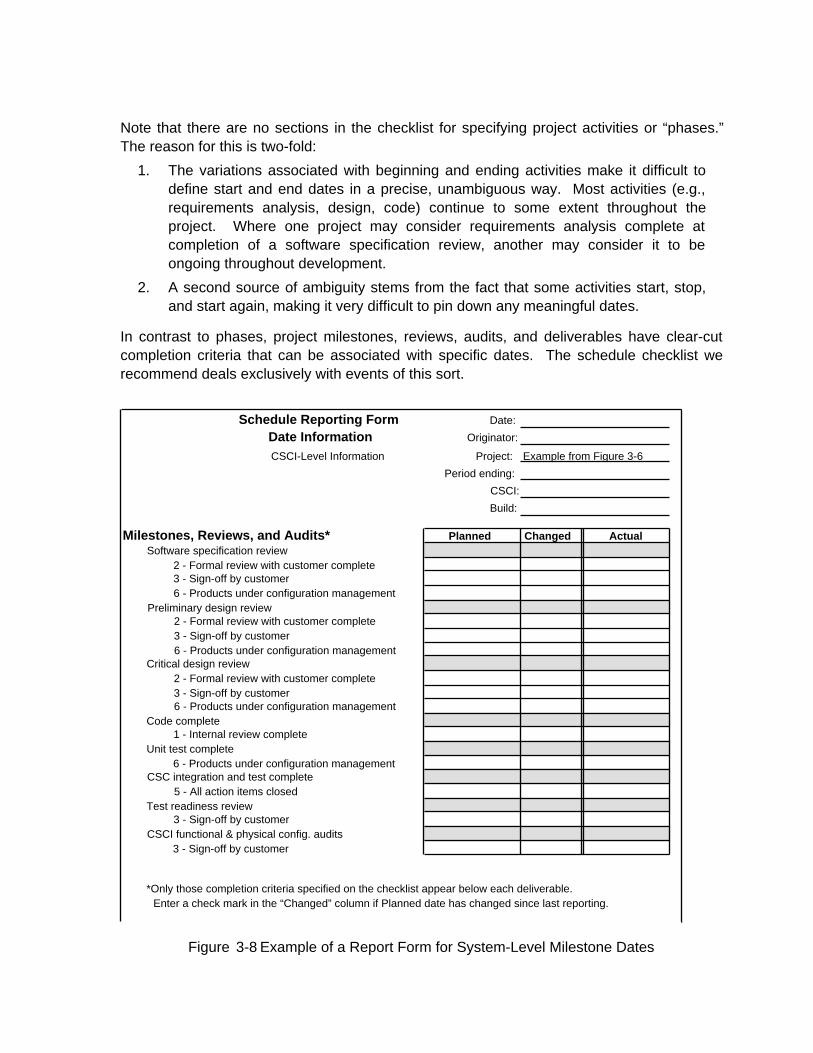
Note that there are no sections in the checklist for specifying project activities or “phases.”The reason for this is two-fold:
1. The variations associated with beginning and ending activities make it difficult todefine start and end dates in a precise, unambiguous way. Most activities (e.g.,requirements analysis, design, code) continue to some extent throughout theproject. Where one project may consider requirements analysis complete atcompletion of a software specification review, another may consider it to beongoing throughout development.
2. A second source of ambiguity stems from the fact that some activities start, stop,and start again, making it very difficult to pin down any meaningful dates.
In contrast to phases, project milestones, reviews, audits, and deliverables have clear-cutcompletion criteria that can be associated with specific dates. The schedule checklist werecommend deals exclusively with events of this sort.
Schedule Reporting Form Date:
Date Information Originator:
CSCI-Level Information Project: Example from Figure 3-6
Period ending:
CSCI:
Build:
Milestones, Reviews, and Audits* Planned Changed ActualSoftware specification review
2 - Formal review with customer complete3 - Sign-off by customer6 - Products under configuration management
Preliminary design review2 - Formal review with customer complete3 - Sign-off by customer6 - Products under configuration management
Critical design review2 - Formal review with customer complete3 - Sign-off by customer6 - Products under configuration management
Code complete1 - Internal review complete
Unit test complete6 - Products under configuration management
CSC integration and test complete5 - All action items closed
Test readiness review3 - Sign-off by customer
CSCI functional & physical config. audits3 - Sign-off by customer
*Only those completion criteria specified on the checklist appear below each deliverable. Enter a check mark in the “Changed” column if Planned date has changed since last reporting.
Figure 3-8 Example of a Report Form for System-Level Milestone Dates
We recommend that milestones, reviews, audits, and deliverables be reported on forms likethe one in Figure 3-8 on the previous page. This figure shows how a report has beentailored to reflect the dates and completion criteria checked in Figure 3-6. Note the columnlabeled Changed. A check in this column indicates that the value shown is different from theprevious report (either changed or newly added). This is intended to make it easy for thereceiver of the report to update only those values that have changed. We recommend that aseparate report be filled out for each CSCI. A similar form is presented in the frameworkreport for reporting system-level dates. Reporting forms, in general, are intended to betailored.
A checklist for specifying progress measures is also illustrated in the framework report foreffort and schedule measurement. Appendix D of that report gives three examples that showhow this checklist can be used to define progress measures used in Air Force Pamphlet 800-48 (Acquisition Management Software Management Indicators) [USAF 92], the ArmySoftware Test and Evaluation Panel (STEP) measurement set [Betz 92], and the MITREmetrics (Software Management Metrics ) [Schultz 88].
3.4.1. Reasons for using calendar dates
Schedule is a primary concern of project management. Timely delivery is often as importantas either functionality or quality in determining the ultimate value of a software product.Moreover, project management can become especially complicated when delivery dates aredetermined by external constraints rather than by the inherent size and complexity of thesoftware product. Extremely ambitious schedules often result.
Because schedule is a key concern, it is important for managers to monitor adherence tointermediate milestone dates. Early schedule slips are often a precursor to future problems.It is also important to have objective and timely measures of progress that provide anaccurate indication of status and that can be used for projecting completion dates for futuremilestones.
Cost estimators and cost model developers are also very interested in schedules. Projectduration is a key parameter when developing or calibrating cost models. Both modeldevelopers and estimators must understand what activities the duration includes andexcludes. If we are told that a project took three and half years, a reasonable response is toask exactly what was included in that time period. Does the period include systemrequirements analysis and design or just software activities? Does it include hardware-software integration and testing or just software integration?
People involved in process improvement also use schedule information. They need tounderstand the basic time dependencies of the project and so they can identify bottlenecks inthe process.
Tracking dates for milestones, reviews, audits, and deliverables provides a macro-level viewof project schedule. Not only can slips in early milestones be precursors of future problems,but also insight can be gained by tracking the progress of activities which culminate in
reviews and deliverables. By tracking the rate at which the underlying units of work arecompleted, we have an objective basis for knowing where the project is at any given point intime and for projecting where it will be in the future.
3.4.2. Specific recommendations for using calendar dates
We recommend the following practices be used by acquisition and development managers:
Dates of milestones, reviews, audits, and deliverables
• Require and report both planned and actual dates for milestones, reviews,audits, and deliverables.
• Use the checklist to specify the exact dates to be reported. A good first setincludes the date of baselining for products developed as part of a given activity,the date of formal review, the date of delivery for interim products, and the dateof formal sign-off.
• Some dates apply to the entire build or system. In other cases, there will bedates for each CSCI. Track schedule information at least to the CSCI level. Forcritical CSCIs, you may want to track dates for individual computers softwarecomponents (CSCs) and computer software units (CSUs).
• Require that planned and actual dates be updated at regular intervals. Keep allplans. Much can be learned by looking at the volatility of plans over time and theextent to which they are based on supporting data (like the progress measures).
Progress measures
• Use the checklist for progress measures to specify the measures to be tracked.
• Require or produce a plan that shows the rate at which work will beaccomplished. There should be a plan for each CSCI. Require that the plannedand measured values be reported at regular intervals.
• Progress measures are meaningless without objective completion criteria. Makesure that these criteria can be audited. It is your way of being assured thatprogress is real.
• At a minimum, require that the following be planned for and tracked:
the number of CSUs completing unit test.
the number of lines of code completing unit test.
the number of CSUs integrated.
the number of lines of code integrated.
DOD-STD-2167A leaves a huge gap between the critical design review which precedescoding and the test readiness review which precedes CSCI testing. If there are problems inmeeting integration and test schedules, the earlier you know about it the better. Thesesimple measures have been found to be extremely useful. Schultz presents an example inwhich counts of the number of CSUs completing unit test were plotted weekly [Schultz 88]. Asimple linear extrapolation of the plot provided a remarkably accurate projection of when unit

testing would be complete for all CSUs . We present a similar example for source lines ofcode in Appendix B (Figure B-11).
We recommend the following practices for cost estimators and database administrators:
• Whenever possible, use the checklist before data is reported to specify the dates youwould like to see (e.g., “For all reviews, report the date the review began and the datethat the last document to be included in that review was signed off”).
• Require a filled-out definition checklist from anyone submitting schedule data, so thatyou can understand and document what the dates represent.
• For project start and end dates, make sure that it is clear which activities are includedand whether the dates are planned or actual.
3.5. Quality
We recommend that counts of software problems and defects be used to help plan and trackdevelopment and support of software systems. We recommend also that they be used tohelp determine when products are ready for delivery to customers and to providefundamental data for process and product improvement We recommend that these countsbe clearly and completely defined. We recommend that the checklists and forms in theframework report on software quality measurement be one of the methods used fordescribing and reporting the quality of DoD software systems.
We do not recommend that standardized definitions for the details of problem and defectmeasurement be attempted above the organization level. The situation is different here thanit is for size, effort, and schedule measures. Processes for detecting, recording, fixing, andpreventing problems and defects are far more closely coupled with the specific softwareprocesses that individual developers and maintainers use. Each process may well usedifferent stages for defect resolution and have different definitions for states such as open,recognized, evaluated, resolved, and closed. Moreover, these processes and the definitionsthat accompany them are the prerogatives of the individual organizations. However, we dobelieve that the checklists and forms we have constructed (or others much like them) can beused by most organizations in purely descriptive ways to report the definitions of thenumerical measures they report.
The checklists and forms we recommend for counting problems and defects are presented inthe framework report on software quality measurement [Florac 92]. Figures 3-9, 3-10, and3-11 in the paragraphs that follow illustrate portions of these forms.
Problem Count Definition Checklist. The Problem Count Definition Checklist (Figure 3-9)provides a structured approach for dealing with the details that we must resolve to reducemisunderstandings when collecting and communicating measures of problems and defects.With such a checklist, we can address issues one at a time by designating the elements thatpeople want included in measurement results. We can also designate the elements to beexcluded and, by doing so, direct attention to actions that must be taken to avoid
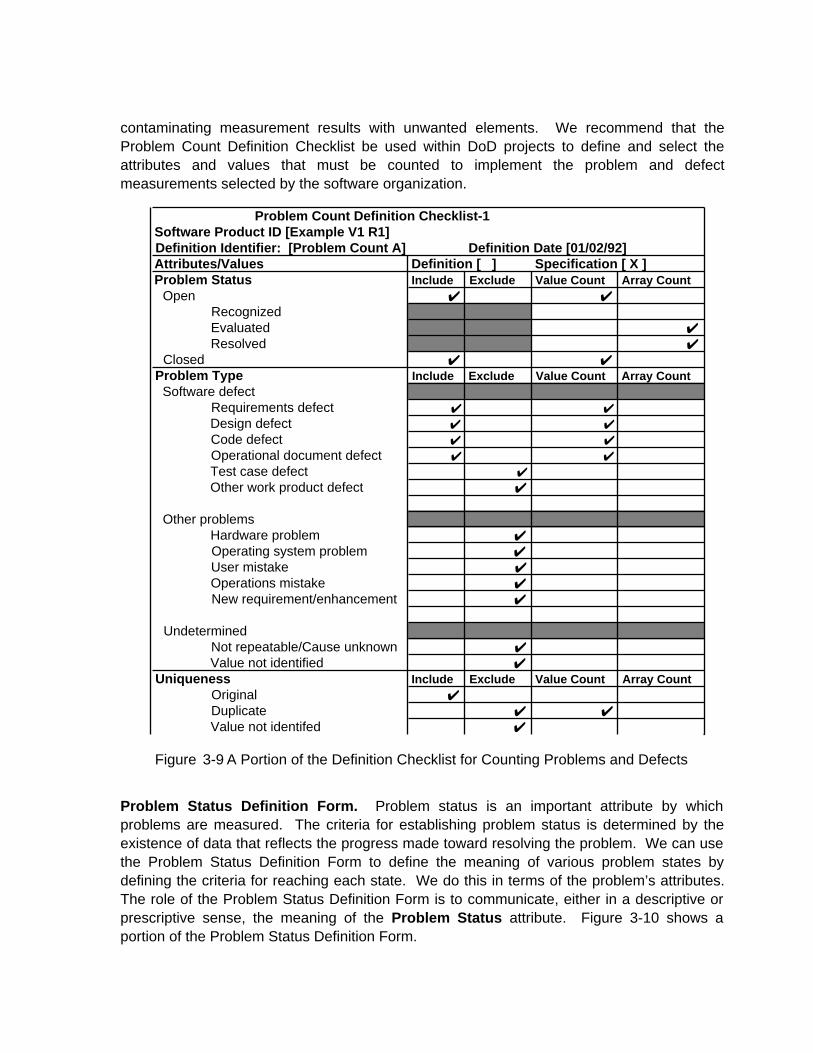
contaminating measurement results with unwanted elements. We recommend that theProblem Count Definition Checklist be used within DoD projects to define and select theattributes and values that must be counted to implement the problem and defectmeasurements selected by the software organization.
Problem Count Definition Checklist-1Software Product ID [Example V1 R1]Definition Identifier: [Problem Count A] Definition Date [01/02/92]Attributes/Values Definition [ ] Specification [ X ]Problem Status Include Exclude Value Count Array Count
Open ✔ ✔RecognizedEvaluated ✔Resolved ✔
Closed ✔ ✔Problem Type Include Exclude Value Count Array Count
Software defectRequirements defect ✔ ✔
Design defect ✔ ✔
Code defect ✔ ✔
Operational document defect ✔ ✔
Test case defect ✔
Other work product defect ✔
Other problemsHardware problem ✔Operating system problem ✔User mistake ✔Operations mistake ✔New requirement/enhancement ✔
UndeterminedNot repeatable/Cause unknown ✔Value not identified ✔
Uniqueness Include Exclude Value Count Array CountOriginal ✔Duplicate ✔ ✔Value not identifed ✔
Figure 3-9 A Portion of the Definition Checklist for Counting Problems and Defects
Problem Status Definition Form. Problem status is an important attribute by whichproblems are measured. The criteria for establishing problem status is determined by theexistence of data that reflects the progress made toward resolving the problem. We can usethe Problem Status Definition Form to define the meaning of various problem states bydefining the criteria for reaching each state. We do this in terms of the problem’s attributes.The role of the Problem Status Definition Form is to communicate, either in a descriptive orprescriptive sense, the meaning of the Problem Status attribute. Figure 3-10 shows aportion of the Problem Status Definition Form.
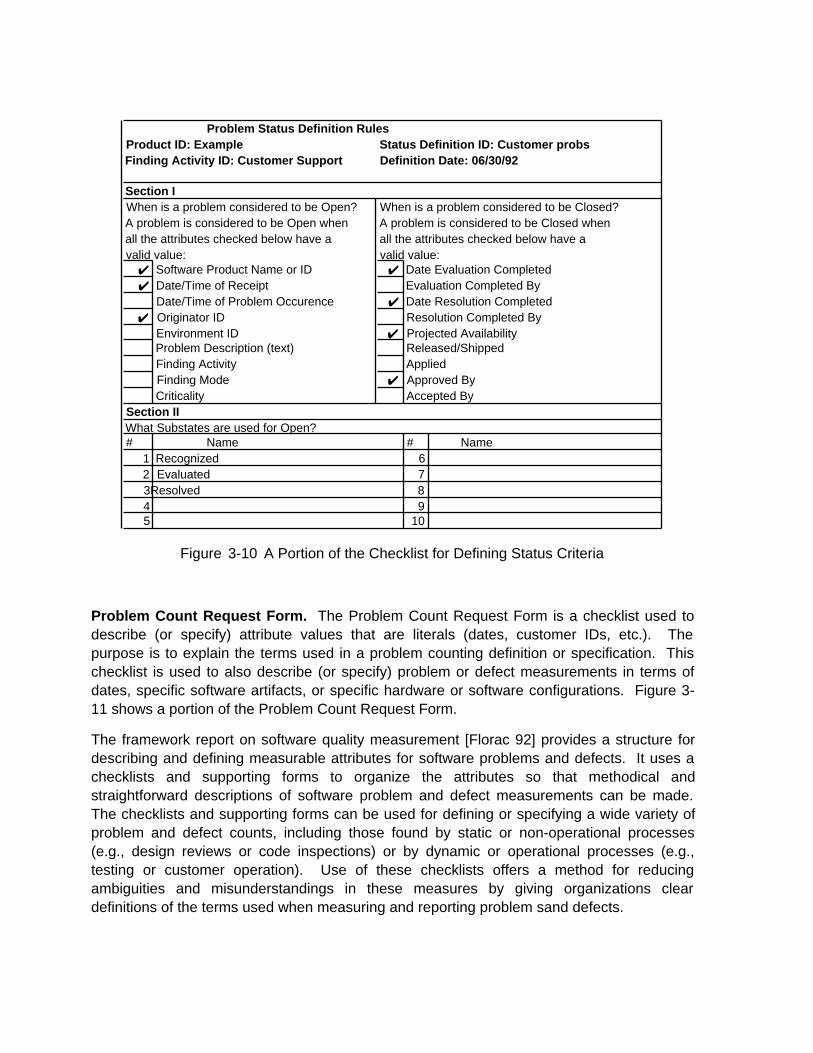
Problem Status Definition RulesProduct ID: Example Status Definition ID: Customer probsFinding Activity ID: Customer Support Definition Date: 06/30/92
Section IWhen is a problem considered to be Open? When is a problem considered to be Closed?A problem is considered to be Open when A problem is considered to be Closed whenall the attributes checked below have a all the attributes checked below have avalid value: valid value:
✔ Software Product Name or ID ✔ Date Evaluation Completed✔ Date/Time of Receipt Evaluation Completed By
Date/Time of Problem Occurence ✔ Date Resolution Completed✔ Originator ID Resolution Completed By
Environment ID ✔ Projected AvailabilityProblem Description (text) Released/ShippedFinding Activity AppliedFinding Mode ✔ Approved ByCriticality Accepted By
Section IIWhat Substates are used for Open?# Name # Name
1 Recognized 62 Evaluated 73 Resolved 84 95 10
Figure 3-10 A Portion of the Checklist for Defining Status Criteria
Problem Count Request Form. The Problem Count Request Form is a checklist used todescribe (or specify) attribute values that are literals (dates, customer IDs, etc.). Thepurpose is to explain the terms used in a problem counting definition or specification. Thischecklist is used to also describe (or specify) problem or defect measurements in terms ofdates, specific software artifacts, or specific hardware or software configurations. Figure 3-11 shows a portion of the Problem Count Request Form.
The framework report on software quality measurement [Florac 92] provides a structure fordescribing and defining measurable attributes for software problems and defects. It uses achecklists and supporting forms to organize the attributes so that methodical andstraightforward descriptions of software problem and defect measurements can be made.The checklists and supporting forms can be used for defining or specifying a wide variety ofproblem and defect counts, including those found by static or non-operational processes(e.g., design reviews or code inspections) or by dynamic or operational processes (e.g.,testing or customer operation). Use of these checklists offers a method for reducingambiguities and misunderstandings in these measures by giving organizations cleardefinitions of the terms used when measuring and reporting problem sand defects.
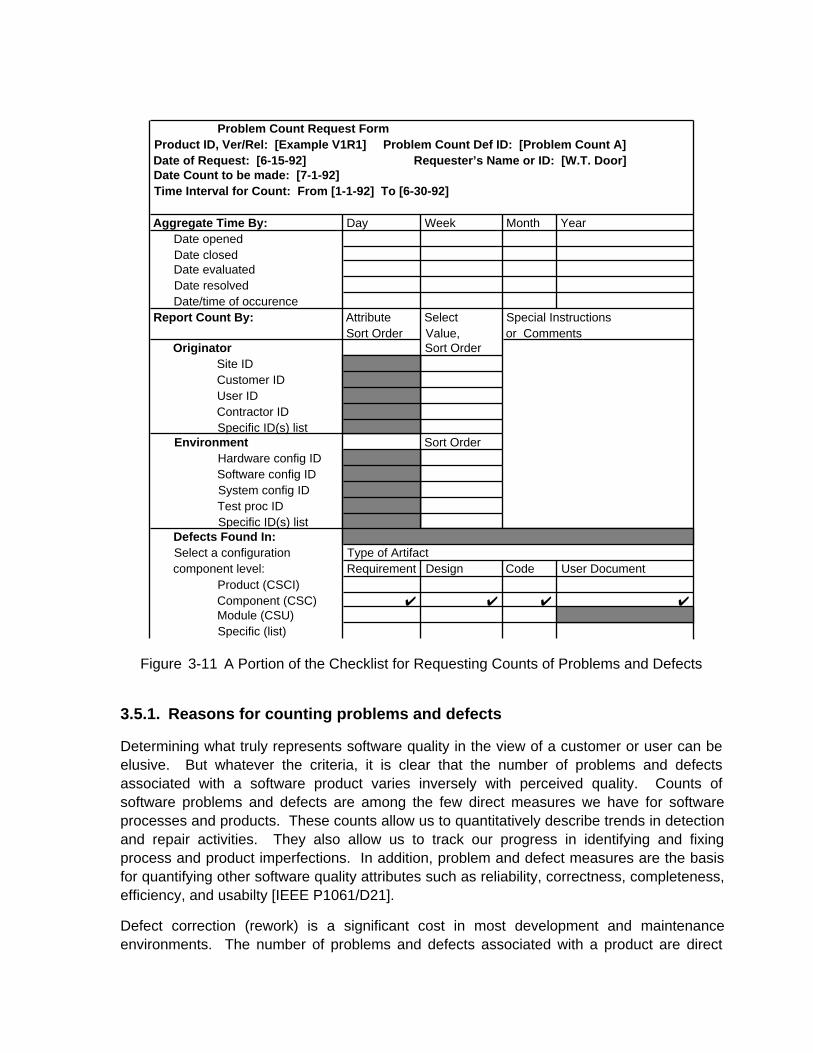
Problem Count Request Form Product ID, Ver/Rel: [Example V1R1] Problem Count Def ID: [Problem Count A]Date of Request: [6-15-92] Requester’s Name or ID: [W.T. Door]Date Count to be made: [7-1-92]Time Interval for Count: From [1-1-92] To [6-30-92]
Aggregate Time By: Day Week Month YearDate openedDate closedDate evaluatedDate resolvedDate/time of occurence
Report Count By: Attribute Select Special InstructionsSort Order Value, or Comments
Originator Sort OrderSite IDCustomer IDUser IDContractor IDSpecific ID(s) list
Environment Sort OrderHardware config IDSoftware config IDSystem config IDTest proc IDSpecific ID(s) list
Defects Found In:Select a configuration Type of Artifactcomponent level: Requirement Design Code User Document
Product (CSCI)Component (CSC) ✔ ✔ ✔ ✔
Module (CSU)Specific (list)
Figure 3-11 A Portion of the Checklist for Requesting Counts of Problems and Defects
3.5.1. Reasons for counting problems and defects
Determining what truly represents software quality in the view of a customer or user can beelusive. But whatever the criteria, it is clear that the number of problems and defectsassociated with a software product varies inversely with perceived quality. Counts ofsoftware problems and defects are among the few direct measures we have for softwareprocesses and products. These counts allow us to quantitatively describe trends in detectionand repair activities. They also allow us to track our progress in identifying and fixingprocess and product imperfections. In addition, problem and defect measures are the basisfor quantifying other software quality attributes such as reliability, correctness, completeness,efficiency, and usabilty [IEEE P1061/D21].
Defect correction (rework) is a significant cost in most development and maintenanceenvironments. The number of problems and defects associated with a product are direct
contributors to this cost. Counting problems and defects can help us understand where andhow they occur and provide insight into methods for detection, prevention, and prediction.Counting problems and defects can also provide direct help in tracking project progress,identifying process inefficiencies, and forecasting obstacles that will jeopardize schedulecommitments.
3.5.2. Specific recommendations for counting problems and defects
Our principal recommendation is that organizations begin using the checklists in theframework report on software quality measurement to describe the meaning of their problemand defect tracking reports [Florac 92]. There are many opportunities for using the checkliststo advantage. We outline several below:
Ongoing projects. For projects that are currently in development and are measuringproblem and defects, we recommend using the Problem Count Definition Checklist andsupporting forms to verify that the data collected conforms to requirements and needs. Thismay reveal two things about the measurements: (1) the measurements do not “measure up”,that is, they are less than clear and precise in their meaning, or (2) the existingmeasurements fall short of what is needed to control the development or maintenanceactivity. If the measurements in use can be documented by using the Problem CountDefinition checklist, we recommend you to use the checklist to describe the measurements tothose who will use the measurement results. The combination of a completed checklist andits supporting forms then becomes a vehicle for communicating the meaning ofmeasurement results to others, both within and outside the originating organization.
New and expanding projects. For projects that want to establish or expand ameasurement system, an initial task is to define the measurements that will be used todetermine and assess progress, process stability, and attainment of quality requirements orgoals. We recommend using the Problem Count Definition Checklist and supporting formsas mechanisms for specifying the software problem and defect measurement part of thesoftware process. Using the checklists to precisely define the measurements helps tocrystallize several significant questions—what data is required, when is it required, whocollects it, how is it collected, where and how is it kept, when it is reported, who has access,and how are the measurements to be used?
Serving the needs of many. Software problem and defect measurements have directapplication to estimating, planning, and tracking various parts of the software developmentprocess. Users within organizations are likely to have different purposes for using andreporting this data. We recommend that the Problem Count Definition Checklist be used tonegotiate and resolve the conflicting views that can arise from these different purposes.
Repository starting point. Finally, the attributes and attribute values in the checklists canserve as a starting point for developing a repository of problem and defect data that can beused as a basis for comparing past experience to new projects, showing the degree ofimprovement or deterioration, rationalizing or justifying equipment investment, and trackingproduct reliability and responsiveness to customers.
4. Implementing the Basic Measures
This chapter outlines some priorities and related actions we recommend for implementing thebasic measures discussed in this report and the supporting framework documents.
4.1. Initial Steps
The checklists and supporting forms in the framework documents can be used in two distinctways: (1) to describe measurement results that are being reported now and (2) to prescribethose that will be collected in the future. When implementing the methods in the frameworkreports, first priority should go to describing information that is currently being reported. Withclear descriptions for measurement results, misunderstandings can be minimized andinappropriate decisions avoided. Descriptions of existing measures can be obtained in shortorder and at very little cost. Standardizing definitions across projects or acrossorganizations, on the other hand, will require more in the way of guidelines, training, and usersupport. This will require time to put in place, and the DoD need not wait to benefit from themethods in the framework reports. If organizations cannot describe what they are doingnow, it is unlikely that the measures they use will be interpreted correctly.
To help make our advice specific, we have organized the priorities that we see into threeclasses—priorities within a project, within an organization, and within the DoD. We anticipatethat the methods in the framework reports will be used in slightly different ways at eachorganizational level.
Within a project:
1. Understand the data you are getting now. Have your acquisition, development,and maintenance organizations use the checklists and supplemental forms todescribe the measurements they currently report. To do this, they need only readthe framework documents, reproduce the forms found at the back of each, and fillout those that are useful for describing the information they report.
2. Standardize the content of future measurement reports. Use the checklists andsupplemental forms to define the counting and coverage rules that you want appliedwhen collecting and reporting future software measurements.
3. Define and collect the additional information you need for project planningand tracking. Use the checklists and related forms to describe the additional dataelements you want recorded and reported to support your primary measures.
Within an organization:
1. Understand the historical data you already have. Use the checklists for size,effort, and schedule to describe the data from past projects that you currently use asreferences for estimating and planning. This will help you see what the data
contains and what it excludes, so that projections made from the data can be appliedappropriately to new projects.
2. Get consistent data from project to project. Use the checklists and theirsupplemental forms to ensure that the same definitions get applied to all projects.
3. Get consistent data over time, while adjusting to the needs and practices ofincreasing process maturities. Use the same checklist-based definitions with allprojects. Use additional checklists as needed to create specialized specifications forthe individual data elements that address your changing needs.
Within the DoD:
1. Understand the data you are getting now. Have reporting organizations attachcopies of the checklists and their supplemental forms to each measurement report,so that readers of the reports will know exactly what the numbers in the reportsrepresent.
2. Get consistent data across different organizations. Use the checklists andsupplemental forms to create and communicate standardized specifications for theprincipal data elements you want recorded and reported for each project.
3. Get consistent data over time, while permitting individual organizations toadjust to increasing process maturities. Use the checklists and supplementalforms to define the basic data you want recorded and reported for each project.Permit each organization to add data elements and reports to meet their individualneeds, provided they use the checklists and supplemental forms to specify theirmethods and report their results.
4.2. Related Actions for DoD Consideration
In addition to the priorities just listed, other actions will be needed if a consistent andsustained measurement program is to be implemented successfully across the DoD. Tomake implementation effective, we recommend that the DoD consider the following actions:
• Develop instructional and training materials to support the introduction and use of thedefinitions and measurement methods that will be implemented.
• Offer an initial implementation period in which individual organizations are permittedto test the checklist-based forms in their own operations. This will help insure that theproposed practices and definitions work for those organizations and that people arecomfortable when using the forms to specify and report measurement results.
• Designate and staff an organization to respond to user questions and provide adviceand assistance to organizations that are implementing the practices described in theframework reports.
• Consider preparing and distributing software to assist in automatically collecting therecommended measures. This would avoid duplicative development of automatedtools and help ensure standardized (and comparable) measurement results.

• Provide for a review and revision cycle for updating the framework documents.Feedback from organizations that use the methods in the framework documents isvery likely to identify ways in which the checklists and definitions can be improvedand made to better serve DoD needs.
• Plan for republishing and redistributing of the framework documents after they areupdated.
• Consider extending the set of framework reports to cover other useful measures.Extensions that should be considered include the following:
• Develop checklists and methods for formally defining counts of software units (orfunctions). These definitions would be helpful in estimating software size and inplanning and tracking convergence to completion. They could also be used earlyin planning cycles, before size estimates for individual software units areavailable. Since many of the coverage issues are the same as for sourcestatement counting, a substantial foundation for this work has already been laid.
• Apply the checklists in the size measurement report [Park 92] to prepare rules foridentifying the beginnings and endings of logical source statements for theprincipal programming languages used in DoD systems. These rules would helporganizations implement a measure of source code size that is less dependenton programming style than physical source lines of code. These rules could beadded to automated code counters so that counts for logical source statementscan be obtained at the same time as counts for physical source lines.
• Construct analogs of the staff-hour checklists and supplemental forms that canbe used to define and specify dollar cost measures. Much of the groundworkhas been laid already in the framework report on effort and schedulemeasurement.
4.3. From Definition to Action—A Concluding Note
The power of clear definitions is not that they require action, but that they set goals andfacilitate communication and consistent interpretation. In the framework reports and theinitial measures we recommend, we seek only to bring clarity to definitions. Implementationand enforcement, on the other hand, are action-oriented endeavors. These endeavors arethe prerogative and responsibility of the Department of Defense and its acquisition,development, and support agencies. We hope that the recommendations in this report andin the supporting framework documents provide the foundations and operational methodsthat will make this implementation effective.

References
[ami 92] Metric Users’ Handbook. London, England: The ami Consortium,South Bank Polytechnic, 1992.
[ANSI/IEEE 729-1983] IEEE Standard Glossary of Software Engineering Terminology(ANSI/IEEE Std 729-1983). New York, N.Y.: Institute of Electricaland Electronic Engineers, Inc., 1983.
[Bailey 86] Bailey, Elizabeth K.; Frazier, Tom P.; & Bailey, John W.A Descriptive Evaluation of Automated Software Cost-EstimationModels (IDA Paper P-1979). Alexandria, Virginia: October 1986.
[Basili 88] Basili, V.; & Rombach, H. D. “The TAME Project: TowardsImprovement Oriented Software Environment”. IEEE Transactionson Software Engineering, 14 , 6 (June 1988): 758-773 .
[Baumert 92] Baumert, John H. Software Measures and the Capability MaturityModel (CMU/SEI-92-TR-25). Pittsburgh, Pa.: Software EngineeringInstitute, Carnegie Mellon University, 1992.
[Betz 92] Betz, Henry P.; & O’Neill, Patrick J. Army Software Test andEvaluation Panel (STEP) Software Metrics Initiatives Report.Aberdeen Proving Grounds, Md.: U. S. Army Materiel SystemsAnalysis Activity, 1992.
[Conte 86] Conte, S. D.; Dunsmore H. E.; & Shen V. Y. Software EngineeringMetrics and Models. Menlo Park, California: Benjamin-Cummings,1986.
[Deming 86] Deming, W. Edwards. Out of the Crisis. Cambridge, Mass.: Centerfor Advanced Engineering Study, Massachusetts Institute ofTechnology, 1986.
[DoD 91] Department of Defense Software Technology Strategy (draft).Washington D.C.: Department of Defense, December 1991.
[DOD-STD-2167A] Military Standard, Defense System Software Development (DOD-STD-2167A). Washington, D.C.: United States Department ofDefense, February 1989.
[Florac 92] Florac, William A. et al. Software Quality Measurement: AFramework for Counting Problems and Defects (CMU/SEI-92-TR-22). Pittsburgh, Pa: Software Engineering Institute, Carnegie MellonUniversity, September 1992.
[Goethert 92] Goethert, Wolfhart B. et al. Software Effort Measurement: AFramework for Counting Staff-Hours (CMU/SEI-92-TR-21).Pittsburgh, Pa: Software Engineering Institute, Carnegie MellonUniversity, September 1992.
[Grady 87] Grady, Robert B.; & Caswell, Deborah L. Software Metrics:Establishing a Company-Wide Program. Englewood Cliffs, N.J.:Prentice-Hall, 1987.
[Humphrey 89] Humphrey, Watts S. Managing the Software Process. Reading,Mass.: Addison-Wesley, 1989.
[IEEE P1045/D5.0] Standard for Software Productivity Metrics [draft] (P1045/D5.0).Washington, D.C.: The Institute of Electrical and ElectronicsEngineers, Inc., 1992.
[IEEE P1061/D21] IEEE Standard for a Software Quality Metrics Methodology (IEEEStandard P-1061/D21). New York, N.Y.: Institute of Electrical andElectronic Engineers, Inc., 1990.
[Kitson 92] Kitson, David H.; & Masters, Steve. An Analysis of SEI SoftwareProcess Assessment Results (CMU/SEI-92-TR-24). Pittsburgh, Pa:Software Engineering Institute, Carnegie Mellon University, July1992.
[McAndrews 92] McAndrews, Donald R. “Establishing a Software MeasurementProcess,” Proceeding of the 4th Annual Software Quality Workshop .Alexandria Bay, New York: Rome Laboratory, August 2-6, 1992.
[MIL-STD-881B] Work Breakdown Structures for Defense Material Items (MIL-STD-881B, draft). Air Force System Command, 18 February 1992.
[Park 92] Park, Robert E. et al. Software Size Measurement: A Framework forCounting Source Statements (CMU/SEI-92-TR-20). Pittsburgh, Pa:Software Engineering Institute, Carnegie Mellon University,September 1992.
[Paulk 91] Paulk, Mark et al. Capability Maturity Model (CMU/SEI-91-TR-24).Pittsburgh, Pa: Software Engineering Institute, Carnegie MellonUniversity, August 1991.
[Pfleeger 89] Pfleeger, Shari Lawrence. Recommendations for an Initial MetricsSet (Contel Technology Center Technical Report CTC-TR-89-017).Chantilly, Virginia: 1989 (available from GTE).
[Pfleeger 90] Pfleeger, Shari Lawrence; & McGowan, Clement L. “SoftwareMetrics in a Process Maturity Framework”. Journal of Systems andSoftware, 12 (July 1990): 255-261.
[Pfleeger 91] Pfleeger, Shari Lawrence. Software Engineering: The Production ofQuality Software, 2nd edition. New York, New York: Macmillan,1991.
[Rifkin 91] Rifkin, Stan; & Cox, Charles. Measurement in Practice (CMU/SEI-91-TR-16). Pittsburgh, PA: Software Engineering Institute, CarnegieMellon University, 1991.
[Schultz 88] Schultz, Herman P. Software Management Metrics (ESD-TR-88-001). Bedford, Mass.: The MITRE Corporation, 1988.
[USAF 92] Software Management Indicators (Air Force Pamphlet 800-48).Washington, D.C.: Department of the Air Force, 1992.
[Weber 91] Weber, Charles V.; Paulk, Mark C.; Wise, Cynthia J.; & Withey,James V. Key Practices for the Capability Maturity Model (CMU/SEI-91-TR-25). Pittsburgh, Pa: Software Engineering Institute, CarnegieMellon University, August 1991.


Appendix A: Acronyms and Terms
A.1. Acronyms
BAFO best and final offer
CMM Capability Maturity Model
CMU Carnegie Mellon University
CDR critical design review
CSC computer software component
CSCI computer software configuration item
CSU computer software unit
DACS Data & Analysis Center for Software
DISA Defense Information Systems Agency
DoD Department of Defense
I-CASE Integrated Computer-Aided Software Engineering
IV&V independent verification and validation
IEEE The Institute of Electrical and Electronics Engineers, Inc.
KSLOC thousands of source lines of code
PDR preliminary design review
QA quality assurance
SEI Software Engineering Institute
SLOC source lines of code
SSR software specification review
STARS Software Technology for Adaptable, Reliable Systems
SWAP Software Action Plan
WBS work breakdown structure
A.2. Terms Used
Attribute – A quality or characteristic of a person or thing. Attributes describe the nature ofobjects measured.
Baseline – A specification or product that has been formally reviewed and agreed upon,which thereafter serves as the basis for future development, and which can be changed onlythrough formal change control procedures.
Blank comments – Source lines or source statements that are designated as comments butcontain no other visible textual symbols.
Blank lines – Lines in a source listing or display that have no visible textual symbols.
Comments – Textual strings, lines, or statements that have no effect on compiler or programoperations. Usually designated or delimited by special symbols. Omitting or changingcomments has no effect on program logic or data structures.
Compiler directives – Instructions to compilers, preprocessors, or translators. Usuallydesignated by special symbols or keywords.
Computer software component (CSC) – A distinct part of a computer softwareconfiguration item (CSCI). CSCs may be further decomposed into other CSCs and computersoftware units (CSUs) [DOD-STD-2167A].
Computer software configuration item (CSCI) – A configuration item for software [DOD-STD-2167A].
Computer software unit (CSU) – An element specified in the design of a computer softwarecomponent (CSC) that is separately testable [DOD-STD-2167A].
Declarations – A non-executable program statement that affects the assembler’s orcompiler’s interpretation of other statements in the program. Examples include type andbounds declarations, variable definitions, declarations of constants, static initializations,procedure headers and argument lists, function declarations, task declarations, packagedeclarations, interface specifications, generic declarations, and generic instantiations.
Defect – (1) Any unintended characteristic that impairs the utility or worth of an item, (2) Anykind of shortcoming, imperfection or deficiency, (3) Any flaw or imperfection in a softwarework product or software process. Examples include such things as mistakes, omissionsand imperfections in software artifacts, or faults contained in software sufficiently mature fortest or operation. See also fault.
Delivered statements – Statements that are delivered to a customer as part of or along witha software product. There are two subclasses: (1) statements delivered in source form and(2) statements delivered in executable form but not as source.
Duplicate problem – A problem encountered in a software product for which a problemreport has already been created.
Embedded statement – A statement used within or as an argument to another or insertedbetween begin/end markers.
Error – (1) differences between computed, observed, or measured values and the true,specified, or theoretically correct value or conditions, (2) an incorrect step process or datadefinition, (3) an incorrect result, (4) a human action that produces an incorrect result.Distinguished by using “error” for (1), “fault” for (2), “failure” for (3), and “mistake” for (4).(IEEE 610.12-1990). See also failure, fault and mistake.
Executable statement – A statement that produces runtime actions or controls programflow.
Failure – The inability of a system or component to perform its required functions withinspecified performance requirements (IEEE 610.12-1990).
Fault – (1) a defect in a hardware device or component, (2) an incorrect step in a process ordata definition in a computer program (IEEE 610.12-1990).
Format statement – A statement that provides information (data) for formatting or editinginputs or outputs.
Logical source statement – A single software instruction, having a defined beginning andending independent of any relationship to the physical lines on which it is recorded or printed.Logical source statements are used to measure software size in ways that are independentof the physical formats in which the instructions appear.
Measure – n. A standard or unit of measurement; the extent, dimensions, capacity, etc. ofanything, especially as determined by a standard; an act or process of measuring; a result ofmeasurement. v. To ascertain the quantity, mass, extent, or degree of something in termsof a standard unit or fixed amount, usually by means of an instrument or process; to computethe size of something from dimensional measurements; to estimate the extent, strength,worth, or character of something; to take measurements.
Measurement – The act or process of measuring something. Also a result, such as a figureexpressing the extent or value that is obtained by measuring.
Mistake (software) – Human action that was taken during software development ormaintenance and that produced an incorrect result. A software defect is a manifestation of amistake. Examples are (1) typographical or syntactical mistakes (2) mistakes in theapplication of judgment, knowledge, or experience (3) mistakes made due to inadequacies ofthe development process.
Module – (1) A program unit that is discrete and identifiable with respect to other units (2) Alogically separable part of a program (adapted from ANSI/IEEE 729-1983). (This iscomparable to a CSU as defined in DOD-STD-2167A.)
Nondelivered statements – Statements developed in support of the final product, but notdelivered to the customer.
Origin – An attribute that identifies the prior form, if any, upon which product software isbased.
Problem report – A document or set of documents (electronic or hard copy) used torecognize, record, track, and close problems. (Sometimes referred to as trouble reports,discrepancy reports, anomaly reports, etc.).
Problem (software) – A human encounter with software that causes a difficulty, doubt, oruncertainty with the use of or examination of the software. Examples include: (1) a difficultyencountered with a software product or software work product resulting from an apparentfailure, misuse, misunderstanding, or inadequacy (2) a perception that the software productor software work product is not behaving or responding according to specification (3) anobservation that the software product or software work product is lacking function orcapability needed to complete a task or work effort.
Software life cycle – The period of time that begins when a software product is conceivedand ends when the software is no longer available for use. Typically includes followingstages or phases: concept, requirements, design, implementation, test, installation andcheckout, operation and maintenance, and retirement (IEEE 610.12-1990).
Software product – The complete set, or any of the individual items of the set, of computerprograms, procedures, and associated documentation and data designated for delivery to acustomer or end-user (IEEE 610.12-1990).
Software work product – Any artifact created as part of the software process, includingcomputer programs, plans, procedures, and associated documentation and data, that maynot be intended for delivery to a customer or end-user [Weber 91].
Source statements – Instructions or other textual symbols, either written by people orintended to be read by people, that direct the compilation or operation of a computer-basedsystem.
Staff-hour – An hour of time expended by a member of the staff [P1045/D4.0].
Statement type – An attribute that classifies source statements and source lines of code bythe principal functions that they perform.
Appendix B: Illustrations of Use
The purpose of this chapter is to illustrate some ways the measures in this report can beused to provide early warnings of potential problems, generate reliable projections for thefuture, or suggest and evaluate process improvements. The examples are organized intofive sections:
1. The first section discusses the use of the measures in establishing the feasibility ofsize-schedule-cost parameters prior to the start of a project.
2. The second section gives examples of information that can be obtained fromproject plans. Some patterns that characterize high-risk projects are shown.
3. The third section discusses the use of measurements to track projects. Someidentifiable symptoms that point to a project at risk are illustrated. This sectionincludes examples of trends that reflect likely problems. It also includes examplesof how the measures have been used to provide objective information regarding aproject’s current status and to generate projections regarding the future.
4. The fourth section discusses the use of the basic measures in processimprovement. Examples are presented of using measurement results tostreamline maintenance and evaluate the impact of design and code inspections.
5. The fifth section discusses the use of the measures in calibrating cost andreliability models.
Most of the examples in these sections are real. Several have been provided through thegenerosity of John McGarry (Naval Undersea Warfare Center, Newport), Steve Keller(Dynamics Research Corporation), and Douglas Putnam (Quantitative SoftwareManagement, Inc.). These individuals have extensive experience in working with softwaremeasurements. Their willingness to share their observations and insights is greatlyappreciated. The measurement results in the examples have been changed to preventidentification of the projects in question, but the relative values and trends are shown as theywere reported. It is hoped that the examples may help to convey some of the richnesscontained in the measures recommended in this report.
It is important to add that the measures often need supplementary information to be useful.This supplementary data can characterize the system being developed, the developmentprocess, resources, and so forth. The parameters of cost-estimation models provide goodexamples of the kinds of data that are useful in comparing and calibrating measures acrossprojects and organizations.
B.1. Establishing Project Feasibility
If a project is to be successful (that is, if it is to deliver the required functionality on schedule,within budget, and with acceptable quality), it has to begin with realistic estimates. Many
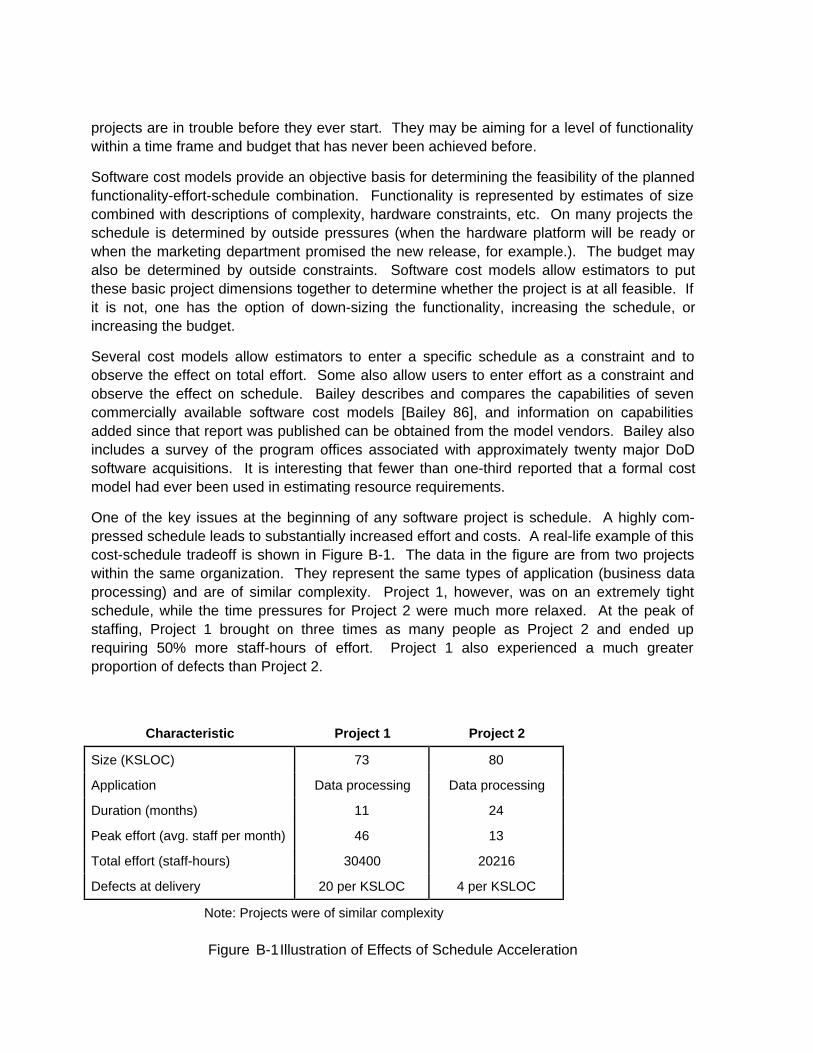
projects are in trouble before they ever start. They may be aiming for a level of functionalitywithin a time frame and budget that has never been achieved before.
Software cost models provide an objective basis for determining the feasibility of the plannedfunctionality-effort-schedule combination. Functionality is represented by estimates of sizecombined with descriptions of complexity, hardware constraints, etc. On many projects theschedule is determined by outside pressures (when the hardware platform will be ready orwhen the marketing department promised the new release, for example.). The budget mayalso be determined by outside constraints. Software cost models allow estimators to putthese basic project dimensions together to determine whether the project is at all feasible. Ifit is not, one has the option of down-sizing the functionality, increasing the schedule, orincreasing the budget.
Several cost models allow estimators to enter a specific schedule as a constraint and toobserve the effect on total effort. Some also allow users to enter effort as a constraint andobserve the effect on schedule. Bailey describes and compares the capabilities of sevencommercially available software cost models [Bailey 86], and information on capabilitiesadded since that report was published can be obtained from the model vendors. Bailey alsoincludes a survey of the program offices associated with approximately twenty major DoDsoftware acquisitions. It is interesting that fewer than one-third reported that a formal costmodel had ever been used in estimating resource requirements.
One of the key issues at the beginning of any software project is schedule. A highly com-pressed schedule leads to substantially increased effort and costs. A real-life example of thiscost-schedule tradeoff is shown in Figure B-1. The data in the figure are from two projectswithin the same organization. They represent the same types of application (business dataprocessing) and are of similar complexity. Project 1, however, was on an extremely tightschedule, while the time pressures for Project 2 were much more relaxed. At the peak ofstaffing, Project 1 brought on three times as many people as Project 2 and ended uprequiring 50% more staff-hours of effort. Project 1 also experienced a much greaterproportion of defects than Project 2.
Characteristic Project 1 Project 2
Size (KSLOC) 73 80
Application Data processing Data processing
Duration (months) 11 24
Peak effort (avg. staff per month) 46 13
Total effort (staff-hours) 30400 20216
Defects at delivery 20 per KSLOC 4 per KSLOC
Note: Projects were of similar complexity
Figure B-1Illustration of Effects of Schedule Acceleration
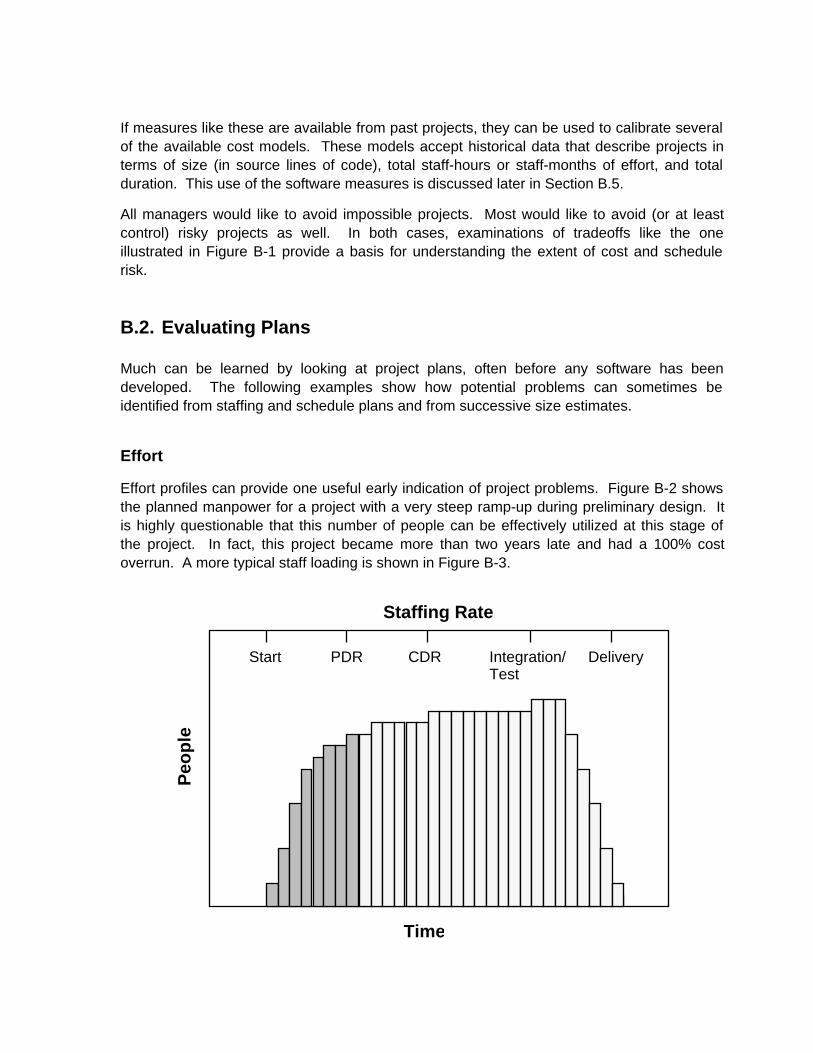
If measures like these are available from past projects, they can be used to calibrate severalof the available cost models. These models accept historical data that describe projects interms of size (in source lines of code), total staff-hours or staff-months of effort, and totalduration. This use of the software measures is discussed later in Section B.5.
All managers would like to avoid impossible projects. Most would like to avoid (or at leastcontrol) risky projects as well. In both cases, examinations of tradeoffs like the oneillustrated in Figure B-1 provide a basis for understanding the extent of cost and schedulerisk.
B.2. Evaluating Plans
Much can be learned by looking at project plans, often before any software has beendeveloped. The following examples show how potential problems can sometimes beidentified from staffing and schedule plans and from successive size estimates.
Effort
Effort profiles can provide one useful early indication of project problems. Figure B-2 showsthe planned manpower for a project with a very steep ramp-up during preliminary design. Itis highly questionable that this number of people can be effectively utilized at this stage ofthe project. In fact, this project became more than two years late and had a 100% costoverrun. A more typical staff loading is shown in Figure B-3.
Time
Staffing Rate
Peo
ple
Start PDR CDR Integration/Test
Delivery
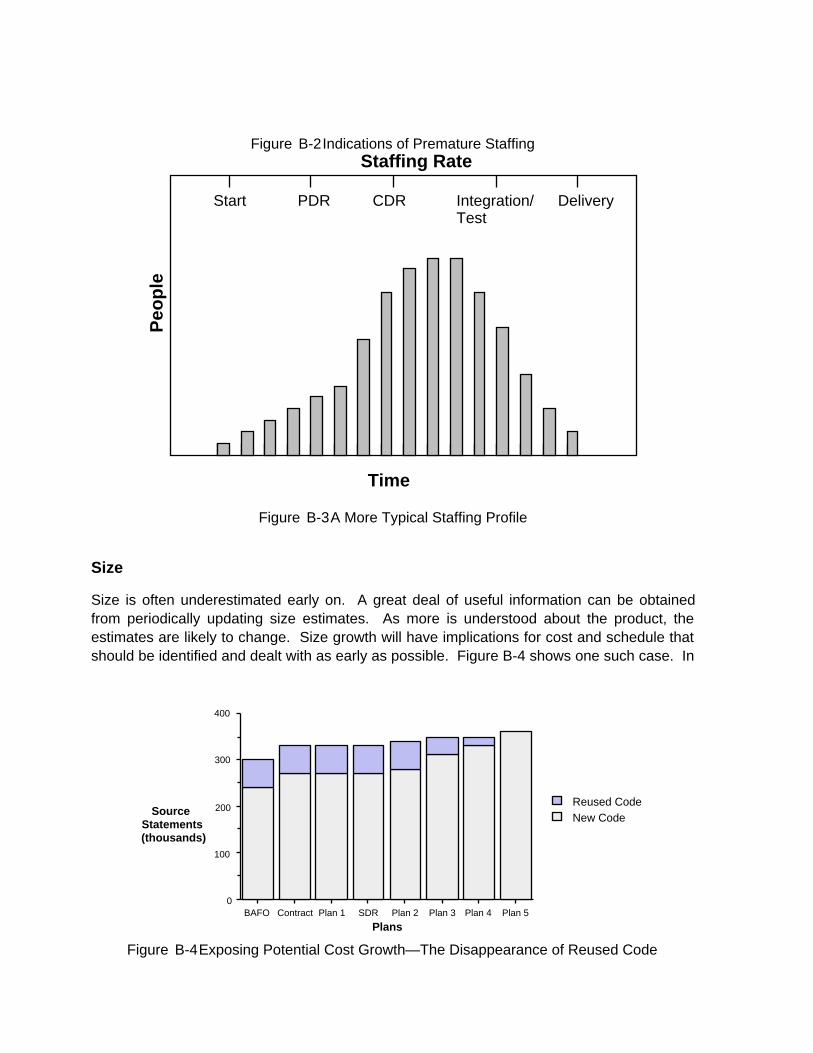
Figure B-2Indications of Premature Staffing
Start PDR CDR Integration/Test
Delivery
Time
Staffing Rate P
eop
le
Figure B-3A More Typical Staffing Profile
Size
Size is often underestimated early on. A great deal of useful information can be obtainedfrom periodically updating size estimates. As more is understood about the product, theestimates are likely to change. Size growth will have implications for cost and schedule thatshould be identified and dealt with as early as possible. Figure B-4 shows one such case. In
BAFO Contract Plan 1 SDR Plan 2 Plan 3 Plan 4 Plan 50
100
200
300
400
New CodeReused Code
Plans
SourceStatements(thousands)
Figure B-4Exposing Potential Cost Growth—The Disappearance of Reused Code

this example, counts of reused and new code have been extracted from each of asuccession of development plans. This contract was bid and won on the basis that therewould be substantial reuse of existing code. The first conclusion that we can draw fromFigure B-4 is that code growth appears to be nearing 20% and that costs are likely to besimilarly affected. The second conclusion is that the situation is actually much worse—all ofthe promised reuse has disappeared and the forecast for new code development is now upby 50%. If this information has not been reflected in current schedules and cost estimates,some serious questions should be asked.
The next three figures demonstrate the importance of keeping and comparing earlier sets ofplans. Figures B-5, B-6, and B-7 show three views of the same project. Figure B-5 showscoding progress plotted against the third version of the development plan. If this is all theinformation we have, we might infer that the project was pretty much on schedule throughmonth 10 but that it has now started to fall behind and may require some minor adjustmentsor replanning to bring it back onto track.
201510500
50
100
150
Plan 3Actuals
Contract Month
SourceStatements(thousands)
Figure B-5Project Tracking—The Deviations May Seem Manageable
Figure B-6, however, suggests that the problems may be more serious than Figure B-5suggests. This figure compares actual progress with the projections that were made in theoriginal plan. Major shortfalls are now apparent. After seeing Figure B-6, we would certainlywant to ask about the replanning that has occurred since the original plan and the impact thatthe departures from the original plan will have on projected costs and schedules.
Interestingly, we do not have to wait for actual measurements from the developmentorganization to gain much of the insight we seek. In fact, we can obtain this insight evenearlier. As Figure B-7 shows, if we simply plot the data from each of the developer’s planson the same graph, we see that early dates have simply been slipped and that no realschedule replanning has been done.
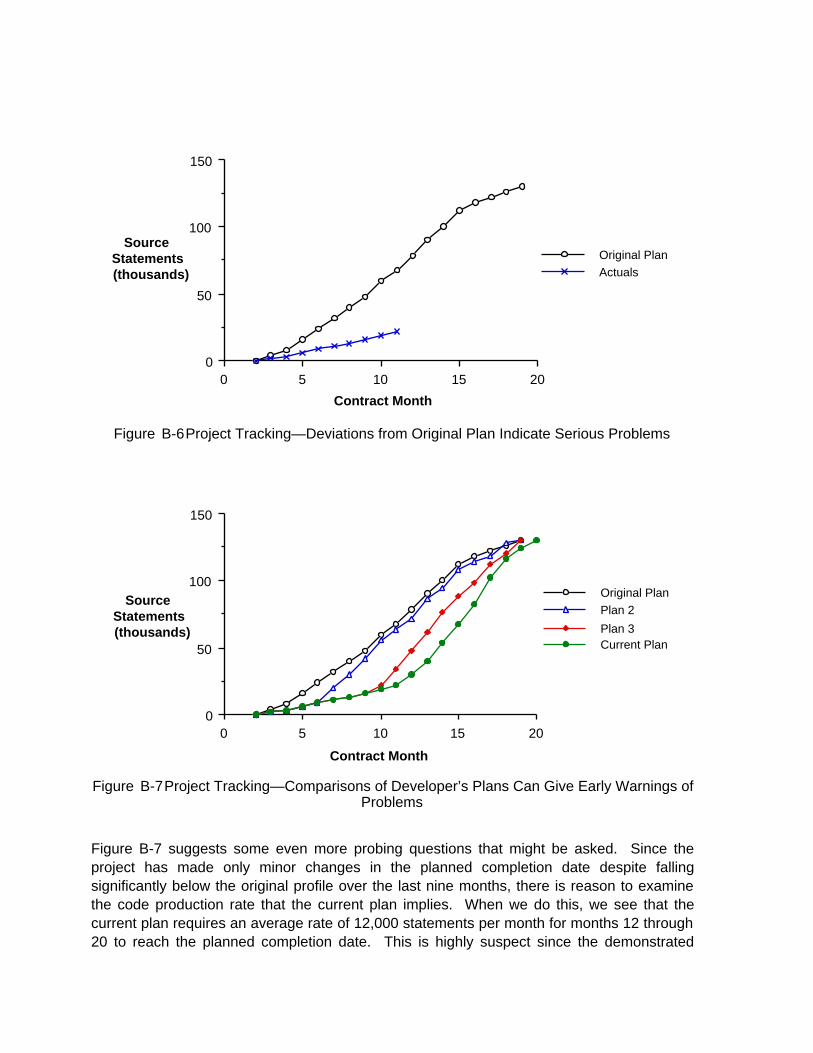
201510500
50
100
150
Original PlanActuals
Contract Month
SourceStatements(thousands)
Figure B-6Project Tracking—Deviations from Original Plan Indicate Serious Problems
201510500
50
100
150
Original PlanPlan 2
Plan 3Current Plan
Contract Month
SourceStatements(thousands)
Figure B-7Project Tracking—Comparisons of Developer’s Plans Can Give Early Warnings ofProblems
Figure B-7 suggests some even more probing questions that might be asked. Since theproject has made only minor changes in the planned completion date despite fallingsignificantly below the original profile over the last nine months, there is reason to examinethe code production rate that the current plan implies. When we do this, we see that thecurrent plan requires an average rate of 12,000 statements per month for months 12 through20 to reach the planned completion date. This is highly suspect since the demonstrated
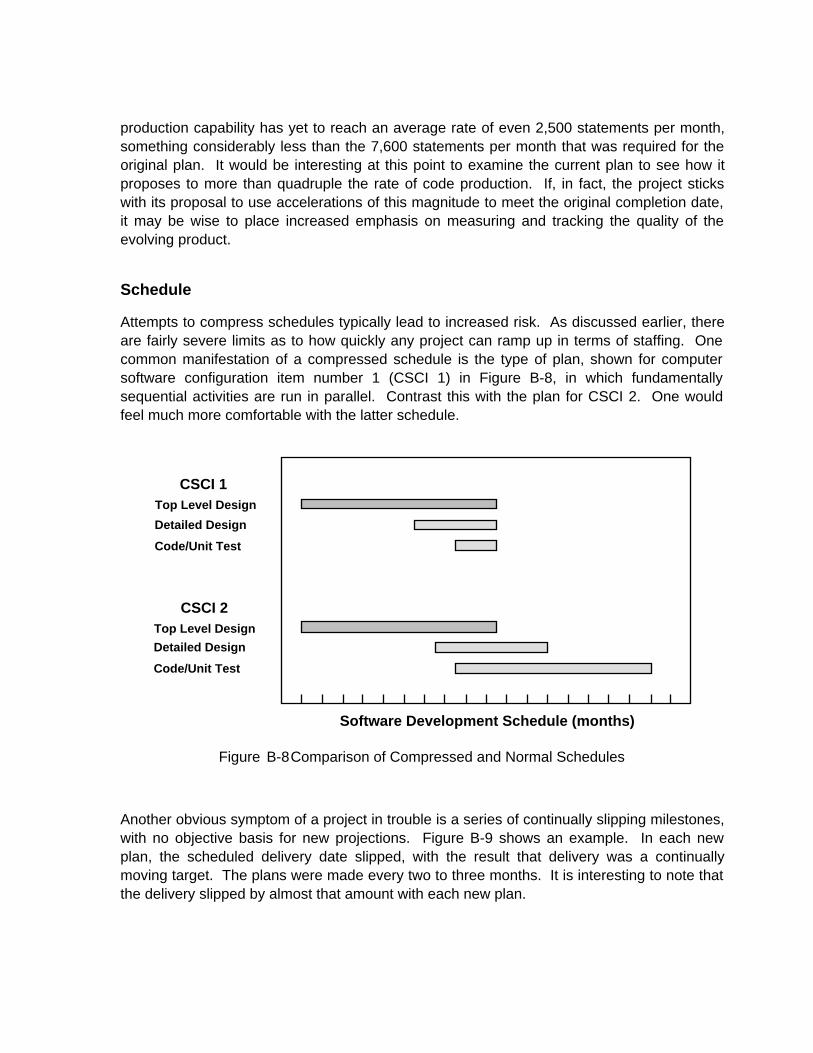
production capability has yet to reach an average rate of even 2,500 statements per month,something considerably less than the 7,600 statements per month that was required for theoriginal plan. It would be interesting at this point to examine the current plan to see how itproposes to more than quadruple the rate of code production. If, in fact, the project stickswith its proposal to use accelerations of this magnitude to meet the original completion date,it may be wise to place increased emphasis on measuring and tracking the quality of theevolving product.
Schedule
Attempts to compress schedules typically lead to increased risk. As discussed earlier, thereare fairly severe limits as to how quickly any project can ramp up in terms of staffing. Onecommon manifestation of a compressed schedule is the type of plan, shown for computersoftware configuration item number 1 (CSCI 1) in Figure B-8, in which fundamentallysequential activities are run in parallel. Contrast this with the plan for CSCI 2. One wouldfeel much more comfortable with the latter schedule.
Software Development Schedule (months)
CSCI 1
CSCI 2
Top Level Design
Detailed Design
Code/Unit Test
Top Level Design
Detailed Design
Code/Unit Test
Figure B-8Comparison of Compressed and Normal Schedules
Another obvious symptom of a project in trouble is a series of continually slipping milestones,with no objective basis for new projections. Figure B-9 shows an example. In each newplan, the scheduled delivery date slipped, with the result that delivery was a continuallymoving target. The plans were made every two to three months. It is interesting to note thatthe delivery slipped by almost that amount with each new plan.
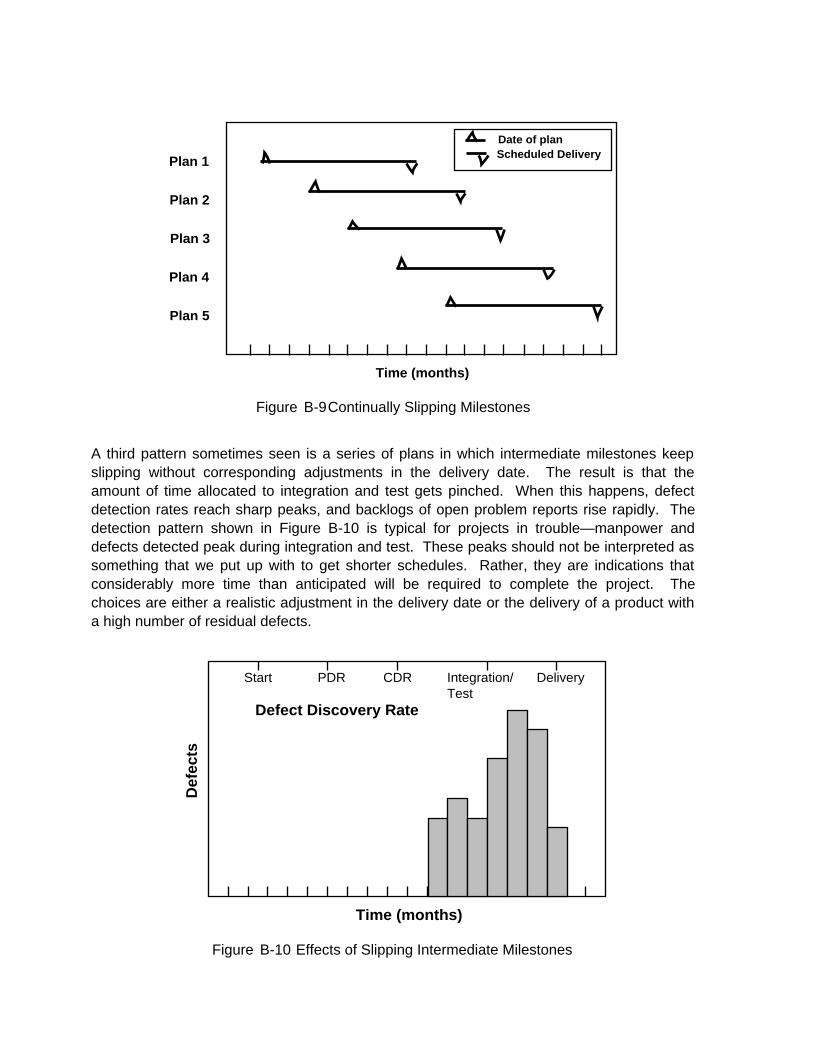
Time (months)
Plan 1
Plan 2
Plan 3
Plan 4
Plan 5
Date of planScheduled Delivery
Figure B-9Continually Slipping Milestones
A third pattern sometimes seen is a series of plans in which intermediate milestones keepslipping without corresponding adjustments in the delivery date. The result is that theamount of time allocated to integration and test gets pinched. When this happens, defectdetection rates reach sharp peaks, and backlogs of open problem reports rise rapidly. Thedetection pattern shown in Figure B-10 is typical for projects in trouble—manpower anddefects detected peak during integration and test. These peaks should not be interpreted assomething that we put up with to get shorter schedules. Rather, they are indications thatconsiderably more time than anticipated will be required to complete the project. Thechoices are either a realistic adjustment in the delivery date or the delivery of a product witha high number of residual defects.
Start PDR CDR Integration/Test
Delivery
Time (months)
Defect Discovery Rate
Def
ects
Figure B-10 Effects of Slipping Intermediate Milestones
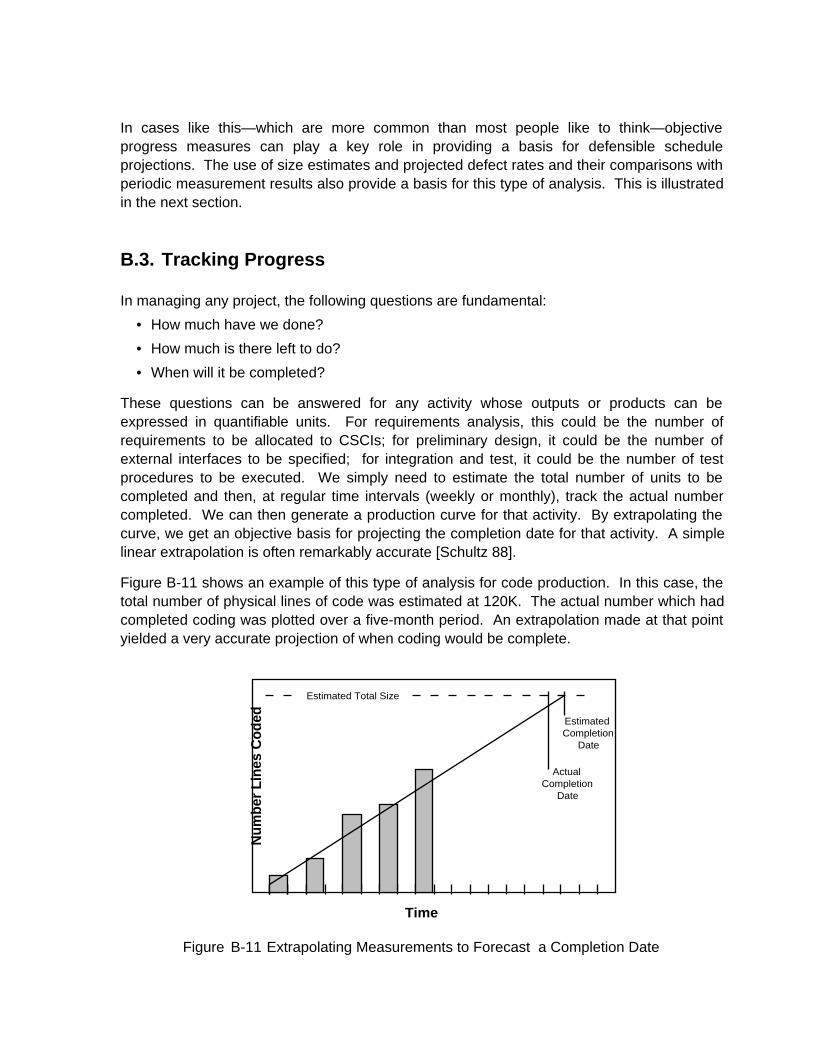
In cases like this—which are more common than most people like to think—objectiveprogress measures can play a key role in providing a basis for defensible scheduleprojections. The use of size estimates and projected defect rates and their comparisons withperiodic measurement results also provide a basis for this type of analysis. This is illustratedin the next section.
B.3. Tracking Progress
In managing any project, the following questions are fundamental:
• How much have we done?
• How much is there left to do?
• When will it be completed?
These questions can be answered for any activity whose outputs or products can beexpressed in quantifiable units. For requirements analysis, this could be the number ofrequirements to be allocated to CSCIs; for preliminary design, it could be the number ofexternal interfaces to be specified; for integration and test, it could be the number of testprocedures to be executed. We simply need to estimate the total number of units to becompleted and then, at regular time intervals (weekly or monthly), track the actual numbercompleted. We can then generate a production curve for that activity. By extrapolating thecurve, we get an objective basis for projecting the completion date for that activity. A simplelinear extrapolation is often remarkably accurate [Schultz 88].
Figure B-11 shows an example of this type of analysis for code production. In this case, thetotal number of physical lines of code was estimated at 120K. The actual number which hadcompleted coding was plotted over a five-month period. An extrapolation made at that pointyielded a very accurate projection of when coding would be complete.
Time
Nu
mb
er L
ines
Co
ded
Estimated Total Size
EstimatedCompletion
Date
ActualCompletion
Date
Figure B-11 Extrapolating Measurements to Forecast a Completion Date
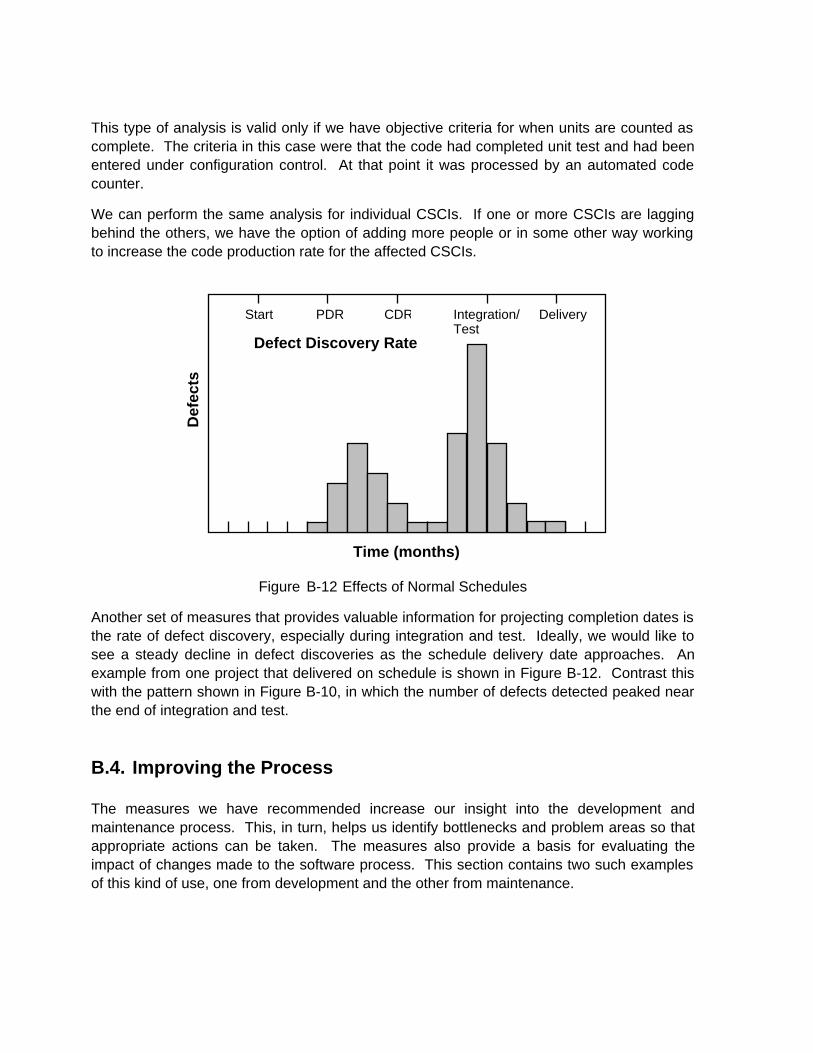
This type of analysis is valid only if we have objective criteria for when units are counted ascomplete. The criteria in this case were that the code had completed unit test and had beenentered under configuration control. At that point it was processed by an automated codecounter.
We can perform the same analysis for individual CSCIs. If one or more CSCIs are laggingbehind the others, we have the option of adding more people or in some other way workingto increase the code production rate for the affected CSCIs.
Time (months)
Defect Discovery Rate
Def
ects
Start PDR CDR Integration/Test
Delivery
Figure B-12 Effects of Normal Schedules
Another set of measures that provides valuable information for projecting completion dates isthe rate of defect discovery, especially during integration and test. Ideally, we would like tosee a steady decline in defect discoveries as the schedule delivery date approaches. Anexample from one project that delivered on schedule is shown in Figure B-12. Contrast thiswith the pattern shown in Figure B-10, in which the number of defects detected peaked nearthe end of integration and test.
B.4. Improving the Process
The measures we have recommended increase our insight into the development andmaintenance process. This, in turn, helps us identify bottlenecks and problem areas so thatappropriate actions can be taken. The measures also provide a basis for evaluating theimpact of changes made to the software process. This section contains two such examplesof this kind of use, one from development and the other from maintenance.
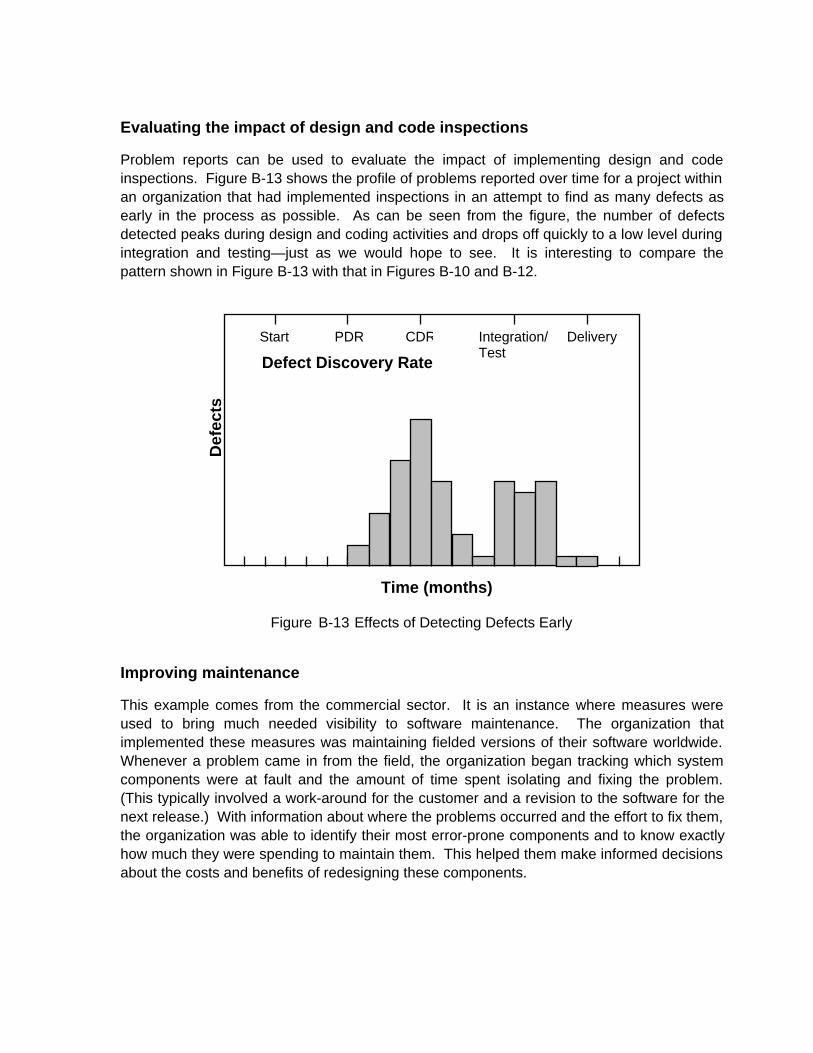
Evaluating the impact of design and code inspections
Problem reports can be used to evaluate the impact of implementing design and codeinspections. Figure B-13 shows the profile of problems reported over time for a project withinan organization that had implemented inspections in an attempt to find as many defects asearly in the process as possible. As can be seen from the figure, the number of defectsdetected peaks during design and coding activities and drops off quickly to a low level duringintegration and testing—just as we would hope to see. It is interesting to compare thepattern shown in Figure B-13 with that in Figures B-10 and B-12.
Time (months)
Defect Discovery Rate
Def
ects
Start PDR CDR Integration/Test
Delivery
Figure B-13 Effects of Detecting Defects Early
Improving maintenance
This example comes from the commercial sector. It is an instance where measures wereused to bring much needed visibility to software maintenance. The organization thatimplemented these measures was maintaining fielded versions of their software worldwide.Whenever a problem came in from the field, the organization began tracking which systemcomponents were at fault and the amount of time spent isolating and fixing the problem.(This typically involved a work-around for the customer and a revision to the software for thenext release.) With information about where the problems occurred and the effort to fix them,the organization was able to identify their most error-prone components and to know exactlyhow much they were spending to maintain them. This helped them make informed decisionsabout the costs and benefits of redesigning these components.
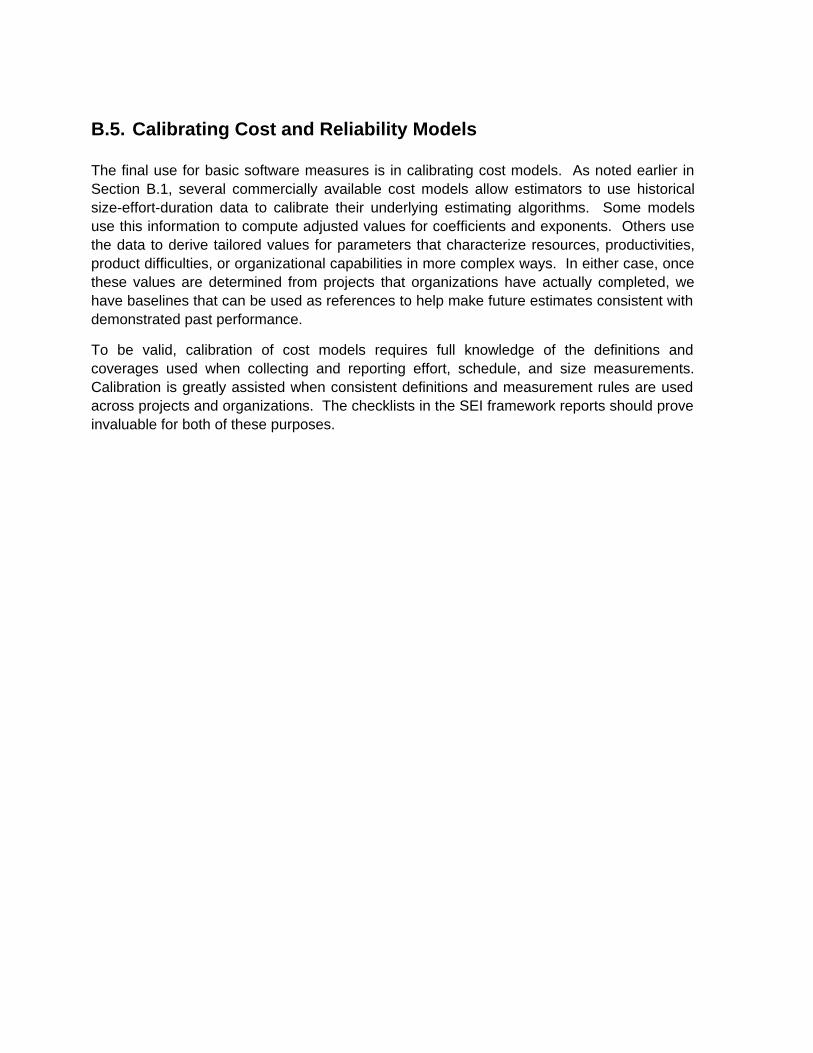
B.5. Calibrating Cost and Reliability Models
The final use for basic software measures is in calibrating cost models. As noted earlier inSection B.1, several commercially available cost models allow estimators to use historicalsize-effort-duration data to calibrate their underlying estimating algorithms. Some modelsuse this information to compute adjusted values for coefficients and exponents. Others usethe data to derive tailored values for parameters that characterize resources, productivities,product difficulties, or organizational capabilities in more complex ways. In either case, oncethese values are determined from projects that organizations have actually completed, wehave baselines that can be used as references to help make future estimates consistent withdemonstrated past performance.
To be valid, calibration of cost models requires full knowledge of the definitions andcoverages used when collecting and reporting effort, schedule, and size measurements.Calibration is greatly assisted when consistent definitions and measurement rules are usedacross projects and organizations. The checklists in the SEI framework reports should proveinvaluable for both of these purposes.
Appendix C: A Proposed DoD Software MeasurementStrategy
This appendix shows where the SEI basic measurement set fits in the context of other DoDmeasurement activities. Figure C-1 is from the DoD SWAP Working Group. It shows astrategy that members of the working group have proposed for building on the measurementwork described in the SEI framework reports and relates the activities to calendar years.
CY 1992 1993
Uniformdefinitions
Managementmetrics set
Modelingmetrics set
Reportingpolicies
Training
Tools
Data analysissupportcenters
1994 1995 1996
CoreSet
- SEI
Usage feedback,iteration, extension
Expandeddefinitions set
STEP,AFP 800-48
–ICASE
IOC, integratedwith coredefinitions
Core modeling metrics
Usage feedbackiteration, extension
FOC, integratedwith expandeddefinitions set
MIL-STD-881B
IOC metricspolicy—ASD(C31), USD(A)
Organization’simplementationof IOC policy
Core definitions &management metrics
Govt. Commercial
Revision,including policy,modeling metrics
ICASE mgmt.metrics tools
Integrate w/core definitions,modeling metrics,training
- STARS
Usage feedback,iteration, extension
– ICASE, STARS
FOC tools,training
Basic capability- DISA, DACS
Expandedcapability
Continuous process improvements
Proposed DoD Software Measurement Strategy
}
FOC policy,Organizational Implementation
Figure C-1Context for Initial Core Measures