Embed Size (px)
Citation preview

Software Faults in Evolving a Large, Real-Time System: a Case Study
Dewayne E. Perry and Carol S. StiegAT&T Bell Laboratories
(Revised August 1992)
Abstract
We report the results of a survey about the software faults encountered during the testing phases in evolving
a large real-time system. The survey was done in two parts: the first part surveyed all the faults that were
reported and characterized them in terms of general categories of faults; the second part surveyed in depth
the faults found in the design and coding phases. For the first part, we describe the general faults found and
characterize the requirements, design and coding faults by the testing phases in which they were found and
how they were found over time during the testing phases. For the second part, we describe the questionaire
used to survey the design and coding faults, report the faults that occurred, how difficult they were to find
and to fix, what their underlying causes were (that is, what their corresponding errors were), and what
means might have prevented them from occurring; we then characterize the results in terms of interface and
implementation faults.
Keywords: Software fault analysis; large-scale, real-time system case study; design and coding faults;
interface and implementation faults; effort to find/fix faults; underlying causes of faults; means of fault
prevention.

- 1 -
1. Introduction
Far too little attention has been given to the empirical foundations of software engineering. We software
engineers, as a group, try the latest techniques and tools with little attention, either before hand or
afterwards, to their projected or actual effects. We propose research solutions to the building and evolving
of software systems with virtually no empirical basis, with little more than an intuition of what the ‘‘real’’
problems are. We build and evolve systems, but spend little time measuring either the process or the
product. Or if we do measure the process, we make little use of the resulting information. We make even
less use of it as a source of ideas for software engineering research.
It is surprising that so few studies have appeared in the software engineering literature, especially since the
monitoring of the mistakes we make is one of the fundamental tools by which we improve our process and
product. This is particularly true for the development of large systems. In preceding work [13, 14], Perry
and Evangelist reported the prevalence of interface faults as a major factor in the development and
evolution of a large real-time system (68% of the faults). One of the main purposes of this software fault
study was to indicate the importance of tools (such as the Inscape Environment [16]) that manage interfaces
and the dependencies on those interfaces .
Prior to this work, Endress [7], Schneidewind and Hoffman [19], and Glass [8] reported on various fault
analyses of software development, but did not delineate interface faults as a specific category. Thayer,
Lipow and Nelson [20] and Bowen [5] provide extensive categorization of faults, but with a relatively
narrow view of interface faults. Basili and Perricone offer the most comprehensive study of problems
encountered in the development phase of a medium-scale system, reporting data on the fault, the number of
components affected, the type of the fault, and the effort required to correct the fault. Interface faults were
the largest class of faults (39% of the faults).
The purpose of this paper is to three-fold: first, to provide a data point on software (interface and
implementation) faults encountered in the evolution (that is, what is often called the maintenance phase, not
the initial development phase) of a very large real-time system; second, to provide a deeper understanding
of those faults in terms of the effort required to find and fix them, their underlying causes, and their means
of prevention; and third, to gain insight into the kinds of tools and techniques that we need to support an
evolutionary software process [16].
In section 2, we provide the background for the study, describing the system in general terms, the
methodology employed in evolving the system, and the approach we used in conducting the survey.
Section 3 reports the overall Modification Request (MR) survey, providing first a summary of the
questionnaire, then a summary of the results, and finally some conclusions drawn from this part of the
study. Section 4 presents the design and coding fault survey, providing first a summary of the
questionnaire, then a discussion of the statistical analysis, and finally a summary relating the results to
interface faults. Finally, in section 5, we present our summary, conclusions and recommendations.
2. Background
The system discussed in this paper is a very1 large scale, distributed, real-time system written in the C
__________________
1. By ‘‘very large’’, we mean a system of 1,000,000 lines or more [4]. AT&T has a wide variety of such very large systems.

- 2 -
programming language in a Unix-based, multiple machine, multiple location environment.
The organizational structure is typical with respect to AT&T projects for systems of this size and for the
number of people in each organization. Not surprisingly, different organizations are responsible for various
parts of the system development: requirements specification; architecture, design, coding and capability
testing; system and system stability testing; and alpha testing.
The process of development is also typical with respect to AT&T projects of this size. Systems Engineers
prepare informal and structured documents defining the requirements for the changes to be made to the
system. Designers prepare informal design documents that are subjected to formal reviews by three to
fifteen peers depending on the size of the unit under consideration. The design is then broken into design
units for low level design and coding. The products of this phase are subjected both to formal code reviews
by three to five reviewers and to low level unit testing. As components are available, integration and
system testing is performed until the system is completely integrated.
The release considered here is a ‘‘non-initial’’ release — one that can be viewed as an arbitrary point in the
evolution of this class of systems. Because of the size of the system, the system evolution process consists
of multiple, concurrent releases — that is, while the release dates are sequential, a number of releases
proceed concurrently in differing phases. This concurrency accentuates the inter-release dependencies and
their associated problems. The magnitude of the changes (approximately 15-20% new code for each
release) and the general make-up of the changes (bug-fixes, improvements, and new functionality, etc.) are
generally uniform across releases. It is because of these two facts that we consider this study to provide a
representative sample in the life of the project. This relative uniformity of releases contrasts with Lehman
and Belady [10] where releases alternated between adding new functionality and fixing existing problems.
Faults discovered during testing phases are reported and monitored by a modification request (MR) tracking
system (such as for example, CMS [18]). Access to source files for modification is possible only through
the tracking system. Thus all change activity is automatically tracked by the system. This activity includes
not only repairs but enhancements and new functionality as well. It should be kept in mind, however, that
this fault tracking activity occurs only during the testing and released phases of the project, not during the
architecture, design and coding phases. Problems encountered during these earlier phases are resolved
informally without being tracked by the MR system.
The goal of this study was to gain insight into the current process of system evolution by concentrating on
one release of a particular system. The approach we used is that of surveying, by means of a prepared
questionnaire, those who ‘‘owned’’ the MR at the time it was closed, surveying first the complete set of
faults and then concentrating on the largest set of faults in more depth. This survey was the first of its type,
although there have been some smaller studies using random selections. The survey data was then used in
conjunction with data from the MR tracking system database.
Some caveats should be kept in mind while reviewing our results:
• In both phases, approximately 68% of questionnaires were returned — that is, we have data on about
two-thirds of the MRs in both the overall survey and in the design/coding survey. Given the
circumstances under which the survey was taken, this level of response exceeded our best expectations.
Even so, there is still some room for questions about the representativeness of the responses. We know
of no existent factor (such as reporting only the hard or easy problems, receiving reports from only
junior or senior programmers, etc.) that would skew the results significantly [1].

- 3 -
• Given the standard development schedule pressures, the survey was mandated to be non-intrusive. The
responses were to be voluntary and anonymous and no manual checks were allowed. Because of this
management mandate, we were unable to validate the results [3] and are unable to assess the accuracy
of the responses. Mitigating the lack of validation are two facts: first, the questionaire was created by
the authors working with a group of developers; second, the questionaire was reviewed by an
independent group of developers.
• While we tried very hard to provide a neutral questionnaire, we have noticed a few things that we could
have done differently. Some of the results may be skewed slightly by the predisposition of the
questionnaires (for example, the ordering of the possible faults where a more general fault earlier in the
list might subsume a more particular fault later in the list).
• The survey was not an integral part of the evolution cycle, but occurred after the release was completed.
Thus, the responses report remembered solutions that may be different from those responses that one
would give if the facts were ‘‘fresh’’ — that is, some information may be inadvertently incorrect
because the survey occurred anywhere from one to nine months after the MRs were fixed.
• Because the facts may not have been ‘‘fresh’’ in the minds of those taking part in the survey and
because there were a limited number of choices, the respondents were, in some cases, forced to make
‘‘judgment calls’’ about their responses — that is, where it was not immediately clear what the correct
choice was, the respondent had to choose what he or she considered to be the most appropriate answer.
• The overall proportions of the faults may be affected by the fact that data is only kept during the testing
phase of evolution. MRs for the entire process from the receipt of the requirements to the release of the
system would, of course, give a much more accurate picture.
• The sample size is large, but due to the proprietary nature of the data we cannot be more specific.
However, we have been as precise as is justifiably possible.
It is with this background that we present our surveys, analyses, and results.
3. Overall Survey
There were three specific purposes in the original, overall survey:
• to determine, generally, what kinds of problems were found (which we report here) as well as,
specifically, what kinds of application problems arose during the preparation of this release (which we
do not report because of their lack of generality);
• to determine how the problem was found (that is, in which testing phase); and
• to determine when the problem was found.
In the discussion that follows, we first present a summary of the questionnaire, summarize our results, and
draw some conclusions.
3.1 Summary of Questionnaire
The survey questionnaire had two main components: the determination of the fault reported in the MR and
the testing phase in which the fault was found. In determining the fault, two aspects were of importance:
first, the development phase in which the fault was introduced, and second, the particular type of the fault.
Since the particular type of fault reported at this stage of the survey tended to be application or

- 4 -
methodology specific, we have emphasized the phase-origin nature of the fault categorization. The general
fault categories are as follows:
• Previous — residual problems left over from previous releases;
• Requirements — problems originating during the requirements specification phase of development;
• Design — problems originating during the architectural and design phases of development;
• Coding — problems originating during the coding phases of development;
• Testing Environment — problems originating in the construction or provision of the testing
environment (for example, faults in the system configuration, static data, etc);
• Testing — problems in testing (for example, pilot faults, etc);
• Duplicates — problems that have already been reported;
• No problems — problems due to misunderstandings about interfaces, functionality, etc., on the part of
the user;
• Other — various problems that do not fit neatly in the preceding categories such as hardware problems,
etc.
The other main component of the survey concerned the phase of testing that uncovered the fault. The
following are the different testing phases.
• Capability Test (CT) — testing isolated portions of the system to ensure proper capabilities of that
portion.
• System Test (ST) — testing the entire system to ensure proper execution of the system as a whole in the
laboratory environment.
• System Stability Test (SS) — testing with simulated load conditions in the laboratory environment for
extended periods of time.
• Alpha Test (AT) — live use of the release in a friendly user environment.
• Released (RE) — live use. However, in this study, this data refers not to this release, but the previous
release. Our expectation is that this provides a projection of the fault results for this release.
The time interval during which the faults were found (that is, when the MRs were initiated) was retrieved
from the MR tracking system database.
Ideally, the testing phases occur sequentially. In practice, however, due to the size and complexity of the
system, various phases overlap. The overlap is due to several specific factors. First, various parts of the
system are modified in parallel. This means that the various parts of the system are in different states at any
one time. Second, the iterative nature of evolution results in recycling back through previous phases for
various parts of the system. Third, various testing phases are begun as early as possible, even though it is
known that that component may be incomplete. Looked at in one way, testing proceeds in a hierarchical
manner: testing is begun with various pieces, then subsystems and finally integrating those parts into the
complete system. It is a judgment call as to when different parts of the system move from one phase to the
next determined primarily by the percentage of capabilities incorporated and the number of tests executed.
Looked at in a slightly different way, testing proceeds by increasing the size and complexity of the system,

- 5 -
while at the same time increasing its load and stress.
3.2 Summary of Results
We present the summary of each fault category and discuss some of the main issues that stem from these
results. Next we summarize the requirements, design and coding faults first as found by testing phase and
then as found by time interval.
3.2.1 Summary of Responses
Table 1 presents the summary of the MRs by category.
TABLE 1. Summary of Faults_ ______________________________MR Categories Proportion_ _______________________________ ______________________________
Previous 4.0%
Requirements 4.9%
Design 10.6%
Coding 18.2%
Testing Environment 19.1%
Testing 5.7%
Duplicates 13.9%
No problems 15.9%
Other 7.8%_ ______________________________ ⎜⎜⎜⎜⎜⎜⎜⎜⎜⎜⎜⎜⎜⎜⎜
⎜⎜⎜⎜⎜⎜⎜⎜⎜⎜⎜⎜⎜⎜⎜
⎜⎜⎜⎜⎜⎜⎜⎜⎜⎜⎜⎜⎜⎜⎜
‘‘Previous’’ MRs indicate the level of difficulty in finding some of the faults in a large, real-time system.
These problems may have been impossible to find in the previous releases and have only now been exposed
because of changes in the use of the system.
The MRs representing the earlier part of the development or evolution process (that is, those representing
requirements, design and coding) are the most significant, accounting for approximately 33.7% of the MRs.
Given that the distinction between a design fault and a coding fault was one of those which required a
‘‘judgment call’’ on the part of the respondent, we decided to merge the results of those two categories into
one: design/coding faults account for 28.8% of the MRs. However, in the process structure used in the
project, the distinction between requirements and design/coding is much clearer. Requirements
specifications are produced by systems engineers while the design and coding are done by developers.
The next most significant subset of MRs were those that concern testing (the testing environment and
testing categories ) — 24.8% of the MRs. On the one hand, it is not surprising that a significant number of
problems are encountered in testing a large and complex real-time system where conditions have to be
simulated to represent the ‘‘real-world’’ in a laboratory environment. First, the testing environment itself is
a large and complex system that must be tested. Second, as the real-time system evolves, so must the
laboratory test environment evolve. On the other hand, this general problem is clearly one that needs to be
addressed by further study.
‘‘Duplicate’’ and ‘‘No Problem’’ MRs account for another significant subset of the data — 28.9%.
Historically, these have been considered to be part of the overhead. Certainly the ‘‘duplicate’’ MRs are in
large part due to the inherent concurrency of activities in a large-scale project and, as such, are difficult to
eliminate. The ‘‘no problem’’ MRs, however, are in large part due to the lack of understanding that comes
from informal and out-of-date documentation. Obviously, measures taken to reduce these kinds of
problems will have beneficial effects on other categories as well. In either case, reduction of administrative
- 6 -
overhead will improve the cost effectiveness of the project.
3.2.2 Requirements, Design and Coding MRs by Testing Phase
We have focused on the early part of the software process because that is where the most MRs occurred
and, accordingly, where closer attention should yield the most results. For this reason, we present the
requirements, design and coding faults distributed by testing phase.
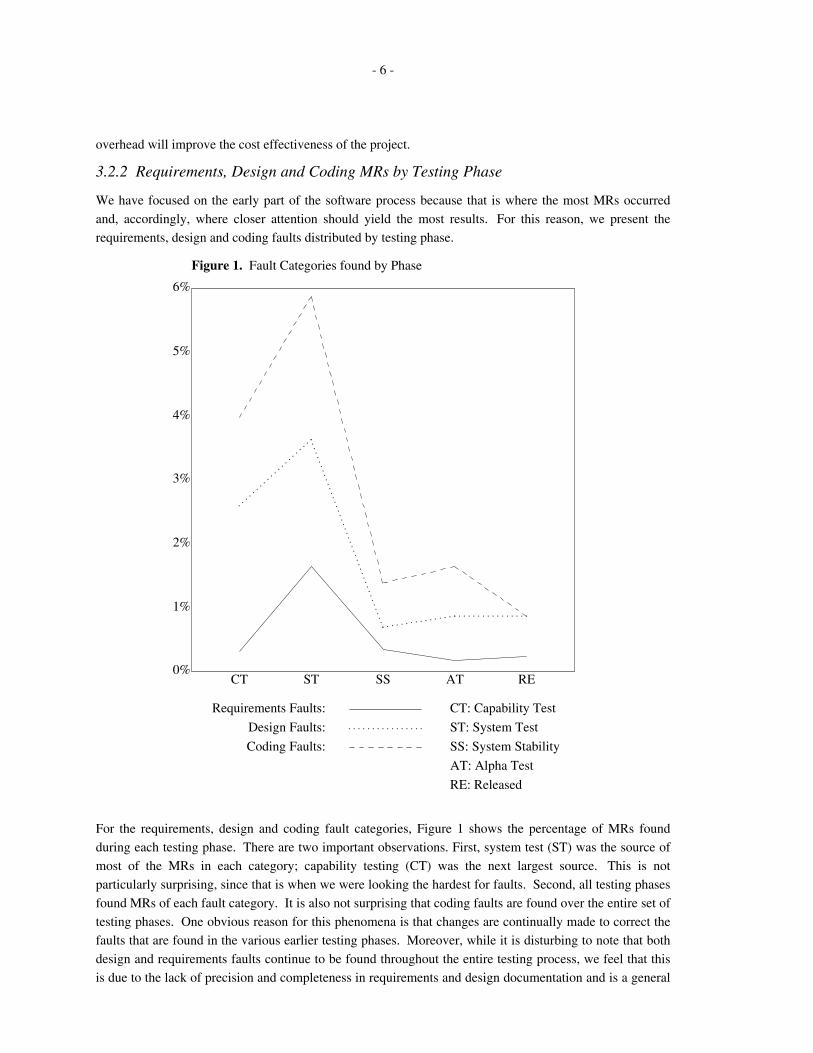
Figure 1. Fault Categories found by Phase
6%
0%
3%
2%
1%
4%
5%
CT ST SS AT RE
. .. . . . . .
. . . . . . . .. .
. .. ........................................... . . . . . . . . . . . . . . . . . . . . . . . . . . . . . . . .
Requirements Faults:
Design Faults:
Coding Faults:
. . . . . . . . . . . . . . . .
CT: Capability Test
ST: System Test
SS: System Stability
AT: Alpha Test
RE: Released
For the requirements, design and coding fault categories, Figure 1 shows the percentage of MRs found
during each testing phase. There are two important observations. First, system test (ST) was the source of
most of the MRs in each category; capability testing (CT) was the next largest source. This is not
particularly surprising, since that is when we were looking the hardest for faults. Second, all testing phases
found MRs of each fault category. It is also not surprising that coding faults are found over the entire set of
testing phases. One obvious reason for this phenomena is that changes are continually made to correct the
faults that are found in the various earlier testing phases. Moreover, while it is disturbing to note that both
design and requirements faults continue to be found throughout the entire testing process, we feel that this
is due to the lack of precision and completeness in requirements and design documentation and is a general
- 7 -
problem in the current state-of-practice rather than a project-specific problem.
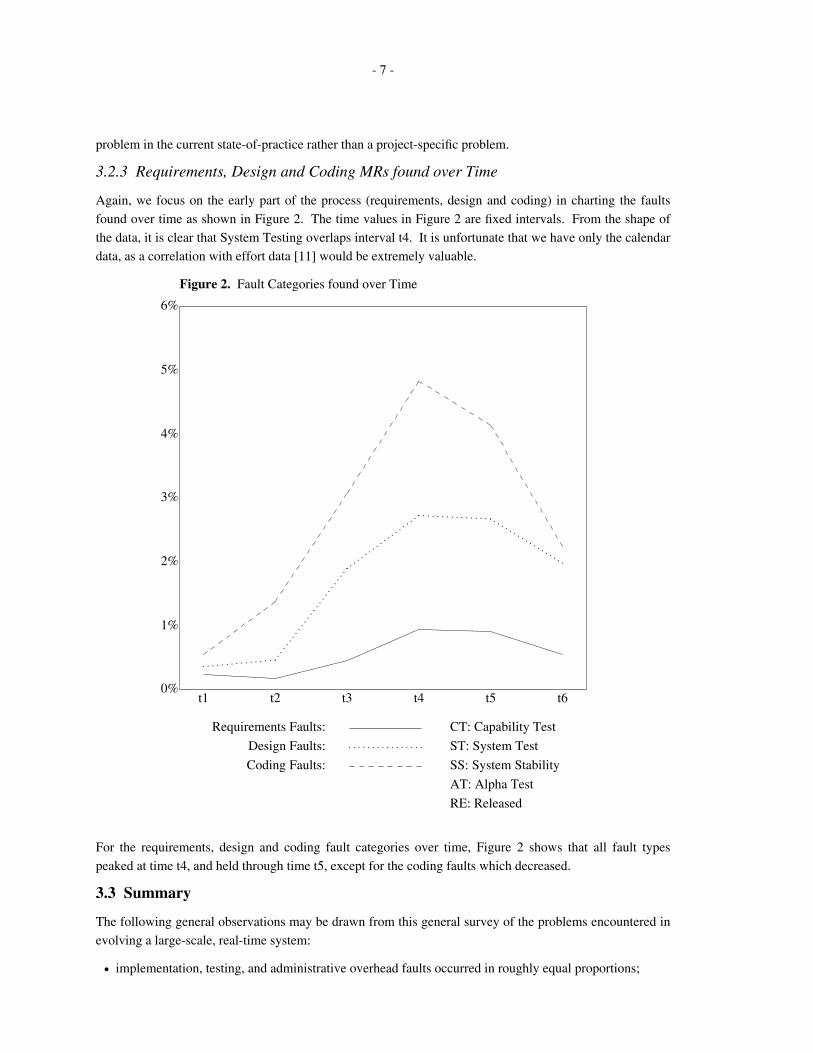
3.2.3 Requirements, Design and Coding MRs found over Time
Again, we focus on the early part of the process (requirements, design and coding) in charting the faults
found over time as shown in Figure 2. The time values in Figure 2 are fixed intervals. From the shape of
the data, it is clear that System Testing overlaps interval t4. It is unfortunate that we have only the calendar
data, as a correlation with effort data [11] would be extremely valuable.
Figure 2. Fault Categories found over Time
6%
0%
3%
2%
1%
4%
5%
t1 t2 t3 t4 t5 t6
. . . . . . . . . . . . . . . . ... .
....
... .
....
... .
....
. . . . . . . . . . . . . . . . . . . . . . . . . . . . . . . . . . . . . . . . . . . . . . . . . . . . . . . .
Requirements Faults:
Design Faults:
Coding Faults:
. . . . . . . . . . . . . . . .
CT: Capability Test
ST: System Test
SS: System Stability
AT: Alpha Test
RE: Released
For the requirements, design and coding fault categories over time, Figure 2 shows that all fault types
peaked at time t4, and held through time t5, except for the coding faults which decreased.
3.3 Summary
The following general observations may be drawn from this general survey of the problems encountered in
evolving a large-scale, real-time system:
• implementation, testing, and administrative overhead faults occurred in roughly equal proportions;
- 8 -
• requirements problems, while not overwhelmingly numerous, are still significant (especially since the
majority were found late in the testing process);
• the most faults were found when the level of testing effort was the highest (that is, at system test); and
• the majority of faults were found late in the testing cycle.
These observations are limited by the fact that the tracking of MRs is primarily a testing activity. It would
be extremely useful to observe the kinds and frequencies of faults that exists in the earlier phases of the
project. Moreover, it would be beneficial to incorporate ways of detecting requirements and design faults
into the existing development process.
4. Design/Code Fault Survey
As a result of the general survey, we decided to survey the design and coding MRs in depth. The following
were the goals we wanted to achieve in this part of the study:
• determine the kinds of faults that occurred in design and coding;
• determine the difficulty both in finding or reproducing these faults and in fixing them;
• determine the underlying causes of the faults; and
• determine how the faults might have been prevented.
There were two reasons for choosing this part of the general set of MRs. First, it seemed to be exceedingly
difficult to separate the two kinds of faults. Second, catching these kinds of faults earlier in the process
would provide a significant reduction in overall fault cost — that is, the cost of finding faults before system
integration is significantly less than finding them in the laboratory testing environment. Our internal cost
data is consistent with Boehm’s [4]. Thus, gaining insight into these problems will yield significant and
cost beneficial results.
In the two subsections that follow, we summarize the survey questionnaire, present the results of our
statistical analysis, and summarize our findings with regard to interface and implementation faults.
4.1 Summary of Questionnaire and Response
The questionnaire is presented in summary form in the following subsections. The respondents were asked
to indicate the difficulty of finding and fixing the problem, determine the actual and underlying causes,
indicate the best means of either preventing or avoiding the problem, and give their level of confidence in
their responses.
4.1.1 Ease of finding or reproducing the fault
The MR in question is to be ranked according to how difficult it was to reproduce the failure and locate the
fault.
1. Easy — could produce at will.
2. Moderate — happened some of the time (intermittent).
3. Difficult — needed theories to figure out how to reproduce the error.
4. Very Difficult — exceedingly hard to reproduce.

- 9 -
4.1.2 Ease of fixing the fault
For each MR, how much time was needed to design and code the fix, document and test it.2
1. Easy — less than one day
2. Moderate — 1 to 5 days
3. Difficult — 6 to 30 days
4. Very difficult — greater than 30 days
4.1.3 Fault Types
For this fault, consider the following 22 possible types and select the one that most closely applies to the
cause of this MR.
1. Language pitfalls — for example, pointer problems, or the use of ‘‘=’’ instead of ‘‘= =’’.
2. Protocol — violated rules about interprocess communication.
3. Low-level logic — for example, loop termination problems, pointer initialization, etc.
4. CMS complexity — for example, due to software change management system complexity.
5. Internal functionality — either inadequate functionality or changes and/or additions were needed to
existing functionality within the module or subsystem.
6. External functionality — either inadequate functionality or changes and/or additions were needed to
existing functionality outside the module or subsystem.
7. Primitives misused — the design or code depended on primitives which were not used correctly.
8. Primitives unsupported — the design or code depended on primitives that were not adequately
developed (that is, the primitives do not work correctly).
9. Change coordination — either did not know about previous changes or depended on concurrent
changes.
10. Interface complexity — interfaces were badly structured or incomprehensible.
11. Design/Code complexity — the implementation was badly structured or incomprehensible.
12. Error handling — incorrect handling of, or recovery from, exceptions.
13. Race conditions — incorrect coordination in the sharing of data.
14. Performance — for example, real-time constraints, resource access, or response time constraints.
15. Resource allocation — incorrect resource allocation and deallocation.
__________________
2. Note that what would be an easy fix in a single programmer system takes considerably more time in a large, multi-person projectwith a complex laboratory test environment.

- 10 -
16. Dynamic data design — incorrect design of dynamic data resources or structures.
17. Dynamic data use — incorrect use of dynamic data structures (for example, initialization,
maintaining constraints, etc.).
18. Static data design — incorrect design of static data structures (for example, their location,
partitioning, redundancy, etc.).
19. Unknown Interactions — unknowingly involved other functionality or parts of the system.
20. Unexpected dependencies — unexpected interactions or dependencies on other parts of the system.
21. Concurrent work — unexpected dependencies on concurrent work in other releases.
22. Other — describe the fault.
4.1.4 Underlying causes
Because the fault may be only a symptom, provide what you regard to be the underlying root cause for each
problem.
1. None given — no underlying causes given.
2. Incomplete/omitted requirements — the source of the fault stemmed from either incomplete or
unstated requirements.
3. Ambiguous requirements — the requirements were (informally) stated, but they were open to more
than one interpretation. The interpretation selected was evidently incorrect.
4. Incomplete/omitted design — the source of the fault stemmed from either incomplete or unstated
design specifications.
5. Ambiguous design — the design was (informally) given, but was open to more than one
interpretation. The interpretation selected was evidently incorrect.
6. Earlier incorrect fix — the fault was induced by an earlier incorrect fix (that is, the fault was not the
result of new development).
7. Lack of knowledge — there was something that I needed to know, but did not know that I needed to
know it.
8. Incorrect modification — I suspected that the solution was incorrect, but could not determine how to
correctly solve the problem.
9. Submitted under duress — the solution was submitted under duress, knowing that it was incorrect
(generally due to schedule pressure, etc).
10. Other — describe the underlying cause.
4.1.5 Means of prevention
For this fault, consider possible ways to prevent or avoid it and select the most useful or appropriate choice
for preventing or avoiding the fault.
1. Formal requirements — use precise, unambiguous requirements (or design) in a formal notation
(which may be either graphical or textual).

- 11 -
2. Requirements/Design templates — provide more specific requirements (or design) document
templates.
3. Formal interface specifications — use a formal notation for describing the module interfaces.
4. Training — provide discussions, training seminars, and formal courses.
5. Application walk-throughs — determine, informally, the interactions among the various application
specific processes and data objects.
6. Expert person/documentation — provide an ‘‘expert’’ person or clear documentation when needed.
7. Design/code currency — keep design documents up to date with code changes.
8. Guideline enforcement — enforce code inspections guidelines and the use of static analysis tools
such as lint.
9. Better test planning — provide better test planning and/or execution (for example, automatic
regression testing).
10. Others — describe the means of prevention.
4.1.6 Confidence levels
Confidence levels requested of the respondents were: very high, high, moderate, low and very low. We
discarded the small number of responses that had a confidence level of either low or very low.
4.2 Statistical Analysis
68% of the questionnaires were returned. Of those, we dropped the responses that were either low or very
low in confidence (6%). The remainder were then subjected to analysis.
TABLE 2. Chi-Square Analysis Summary_ _______________________________________________Variables Degrees of Total p
Freedom Chi-Square_ ________________________________________________ _______________________________________________Find, Fix 6 51.489 .0001
Fault, Find 63 174.269 .0001
Fault, Fix 63 204.252 .0001
Cause, Find 27 94.493 .0001
Cause, Fix 27 55.232 .0011
Fault, Cause 189 403.136 .0001
Prevention, Find 27 41.021 .041
Prevention, Fix 27 97.886 .0001
Fault, Prevention 189 492.826 .0001
Cause, Prevention 81 641.417 .0001_ _______________________________________________ ⎜⎜⎜⎜⎜⎜⎜⎜⎜⎜⎜⎜⎜⎜⎜⎜⎜⎜
⎜⎜⎜⎜⎜⎜⎜⎜⎜⎜⎜⎜⎜⎜⎜⎜⎜⎜
⎜⎜⎜⎜⎜⎜⎜⎜⎜⎜⎜⎜⎜⎜⎜⎜⎜⎜
⎜⎜⎜⎜⎜⎜⎜⎜⎜⎜⎜⎜⎜⎜⎜⎜⎜⎜
⎜⎜⎜⎜⎜⎜⎜⎜⎜⎜⎜⎜⎜⎜⎜⎜⎜⎜
The results of the survey were cross tabulated and then subjected to chi-square analysis. Table 2 provides a
summary of the chi-square analysis. Note that that in all cases the relationships are clearly statistically
significant, with the relationship between the means of prevention and the ease of finding the fault coming
closest to being independent and the relationship between the means of prevention and the underlying
causes being the most significantly interdependent.
- 12 -
We first consider the difficulty of finding and fixing the faults. We then discuss the faults and weight them
by the cost of finding and fixing them. Next we consider the underlying causes and the means of
prevention, correlate the faults with underlying causes and means of prevention, and correlate underlying
causes and means of prevention. Finally, we divide the faults into interface and implementation categories
and compare them in terms of difficulty to find and fix, their underlying causes and their means of
prevention.
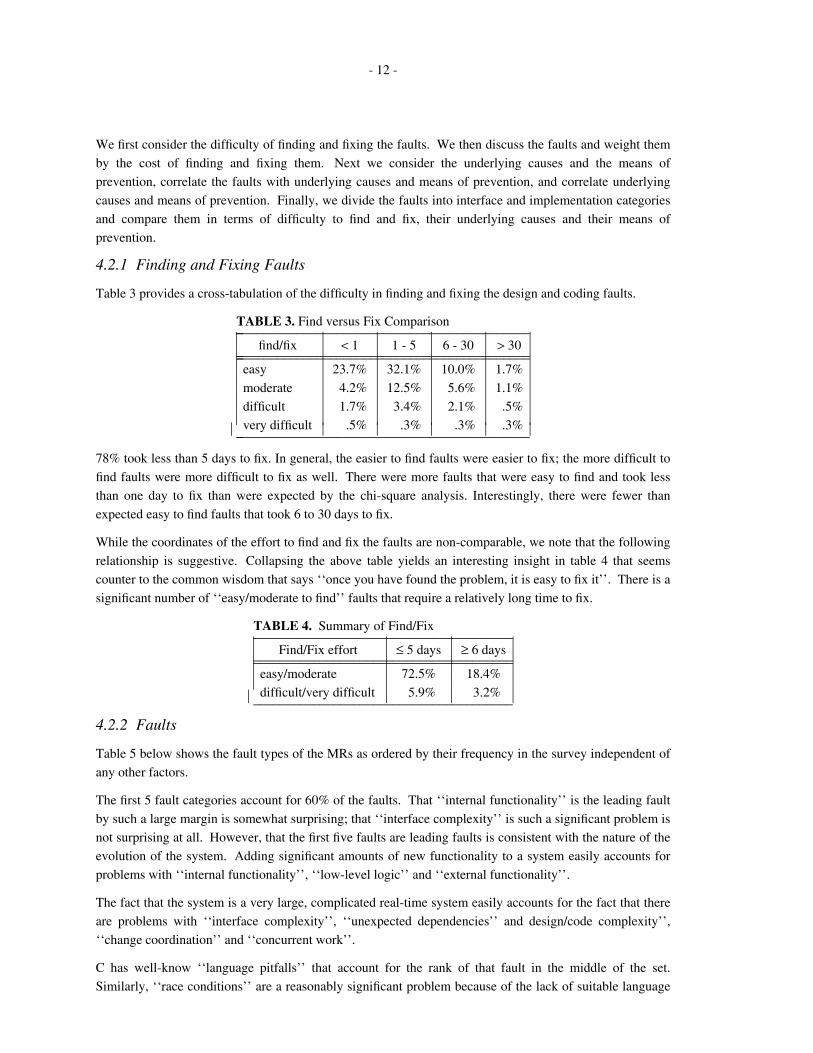
4.2.1 Finding and Fixing Faults
Table 3 provides a cross-tabulation of the difficulty in finding and fixing the design and coding faults.
TABLE 3. Find versus Fix Comparison_ ____________________________________________find/fix < 1 1 - 5 6 - 30 > 30_ _____________________________________________ ____________________________________________
easy 23.7% 32.1% 10.0% 1.7%
moderate 4.2% 12.5% 5.6% 1.1%
difficult 1.7% 3.4% 2.1% .5%
very difficult .5% .3% .3% .3%_ ____________________________________________ ⎜⎜⎜⎜⎜⎜⎜⎜
⎜⎜⎜⎜⎜⎜⎜⎜
⎜⎜⎜⎜⎜⎜⎜⎜
⎜⎜⎜⎜⎜⎜⎜⎜
⎜⎜⎜⎜⎜⎜⎜⎜
⎜⎜⎜⎜⎜⎜⎜⎜
78% took less than 5 days to fix. In general, the easier to find faults were easier to fix; the more difficult to
find faults were more difficult to fix as well. There were more faults that were easy to find and took less
than one day to fix than were expected by the chi-square analysis. Interestingly, there were fewer than
expected easy to find faults that took 6 to 30 days to fix.
While the coordinates of the effort to find and fix the faults are non-comparable, we note that the following
relationship is suggestive. Collapsing the above table yields an interesting insight in table 4 that seems
counter to the common wisdom that says ‘‘once you have found the problem, it is easy to fix it’’. There is a
significant number of ‘‘easy/moderate to find’’ faults that require a relatively long time to fix.
TABLE 4. Summary of Find/Fix_______________________________________Find/Fix effort ≤ 5 days ≥ 6 days______________________________________________________________________________
easy/moderate 72.5% 18.4%
difficult/very difficult 5.9% 3.2%_______________________________________ ⎜⎜⎜⎜⎜
⎜⎜⎜⎜⎜
⎜⎜⎜⎜⎜
⎜⎜⎜⎜⎜
4.2.2 Faults
Table 5 below shows the fault types of the MRs as ordered by their frequency in the survey independent of
any other factors.
The first 5 fault categories account for 60% of the faults. That ‘‘internal functionality’’ is the leading fault
by such a large margin is somewhat surprising; that ‘‘interface complexity’’ is such a significant problem is
not surprising at all. However, that the first five faults are leading faults is consistent with the nature of the
evolution of the system. Adding significant amounts of new functionality to a system easily accounts for
problems with ‘‘internal functionality’’, ‘‘low-level logic’’ and ‘‘external functionality’’.
The fact that the system is a very large, complicated real-time system easily accounts for the fact that there
are problems with ‘‘interface complexity’’, ‘‘unexpected dependencies’’ and design/code complexity’’,
‘‘change coordination’’ and ‘‘concurrent work’’.
C has well-know ‘‘language pitfalls’’ that account for the rank of that fault in the middle of the set.
Similarly, ‘‘race conditions’’ are a reasonably significant problem because of the lack of suitable language

- 13 -
TABLE 5. Faults ordered by Frequency_ __________________________________________cause observed % description_ ___________________________________________ __________________________________________
5 25.0% internal functionality
10 11.4% interface complexity
20 8.0% unexpected dependencies
3 7.9% low-level logic
11 7.7% design/code complexity
22 5.8% other
9 4.9% change coordination
21 4.4% concurrent work
13 4.3% race conditions
6 3.6% external functionality
1 3.5% language pitfalls
12 3.3% error handling
7 2.4% primitive’s misuse
17 2.1% dynamic data use
15 1.5% resource allocation
18 1.0% static data design
14 .9% performance
19 .7% unknown interactions
8 .6% primitives unsupported
2 .4% protocol
4 .3% CMS complexity
16 .3% dynamic data design_ __________________________________________ ⎜⎜⎜⎜⎜⎜⎜⎜⎜⎜⎜⎜⎜⎜⎜⎜⎜⎜⎜⎜⎜⎜⎜⎜⎜⎜⎜⎜⎜⎜⎜⎜⎜
⎜⎜⎜⎜⎜⎜⎜⎜⎜⎜⎜⎜⎜⎜⎜⎜⎜⎜⎜⎜⎜⎜⎜⎜⎜⎜⎜⎜⎜⎜⎜⎜⎜
⎜⎜⎜⎜⎜⎜⎜⎜⎜⎜⎜⎜⎜⎜⎜⎜⎜⎜⎜⎜⎜⎜⎜⎜⎜⎜⎜⎜⎜⎜⎜⎜⎜
⎜⎜⎜⎜⎜⎜⎜⎜⎜⎜⎜⎜⎜⎜⎜⎜⎜⎜⎜⎜⎜⎜⎜⎜⎜⎜⎜⎜⎜⎜⎜⎜⎜
facilities in C.
That ‘‘performance’’ faults are a relatively insignificant is due probably to the fact that this is not an early
release of the system.
4.2.3 Finding and Fixing Faults
There are two interesting relationships to consider in the ordering of the various faults: the affect that the
difficulty in finding the faults have on the ordering and the affect that the difficulty of fixing the faults has
on the ordering.
The following table (table 6) captures the weighted difficulty of finding the various faults. The weighting is
done multiplying the proportion of observed values for each fault with multiplicative weights of 1, 2, 3 and
43 for each find category, respectively, and summing the results. For example, if a fault was easy to find in
66% of the cases, moderate in 23%, difficult in 11%, and very difficult in 0%, the weight is 145 = (66 * 1)
+ (23 * 2) + (11 * 3) + (0 * 4). The following are the faults weighted by difficulty to find from easiest to
__________________
3. Obviously it would have been better to have had some duration assigned to the effort to find faults and the correlated the weightingwith those durations as we do subsequently in weighting by effort to fix faults. The weights used are intended to be suggestive, notdefinitive.

- 14 -
TABLE 6. Determining the Find weighting_ ____________________________________________________fault find proportion weight change description
e/m/d/vd_ _____________________________________________________ ____________________________________________________4 100/0/0/0 100 CMS complexity
18 100/0/0/0 100 static data design
7 88/8/4/0 120 primitive’s misuse
2 75/25/0/0 125 protocol
20 78/16/5/1 129 unexpected dependencies
21 70/23/2/4 130 concurrent work
3 73/22/5/0 132 low-level logic
22 82/12/2/5 132 other
5 74/19/6/1 134 internal functionality
6 67/31/3/0 139 external functionality
1 68/26/2/2 141 language pitfalls
10 66/23/11/0 145 interface complexity
9 65/20/12/2 149 change coordination
8 67/17/17/0 152 primitives unsupported
19 88/8/4/0 157 unknown interactions
16 67/0/33/0 157 dynamic data design
17 52/38/10/0 158 dynamic data use
15 47/47/7/0 162 resource allocation
12 55/30/12/3 163 error handling
11 55/29/16/1 165 code complexity
14 56/11/11/22 199 performance
13 12/67/21/0 209 race conditions_ ____________________________________________________ ⎜⎜⎜⎜⎜⎜⎜⎜⎜⎜⎜⎜⎜⎜⎜⎜⎜⎜⎜⎜⎜⎜⎜⎜⎜⎜⎜⎜⎜⎜⎜⎜⎜⎜⎜
⎜⎜⎜⎜⎜⎜⎜⎜⎜⎜⎜⎜⎜⎜⎜⎜⎜⎜⎜⎜⎜⎜⎜⎜⎜⎜⎜⎜⎜⎜⎜⎜⎜⎜⎜
⎜⎜⎜⎜⎜⎜⎜⎜⎜⎜⎜⎜⎜⎜⎜⎜⎜⎜⎜⎜⎜⎜⎜⎜⎜⎜⎜⎜⎜⎜⎜⎜⎜⎜⎜
⎜⎜⎜⎜⎜⎜⎜⎜⎜⎜⎜⎜⎜⎜⎜⎜⎜⎜⎜⎜⎜⎜⎜⎜⎜⎜⎜⎜⎜⎜⎜⎜⎜⎜⎜
⎜⎜⎜⎜⎜⎜⎜⎜⎜⎜⎜⎜⎜⎜⎜⎜⎜⎜⎜⎜⎜⎜⎜⎜⎜⎜⎜⎜⎜⎜⎜⎜⎜⎜⎜
most difficult.
We do not find the ordering here to conflict with our intuition of how difficult these faults might be to find.
Typically, performance faults and race conditions are very difficult to isolate and reproduce. We would
expect that ‘‘code complexity’’ and ‘‘error handling’’ faults would also be difficult to find and reproduce.
In the chi-square analysis, ‘‘internal functionality’’, ‘‘unexpected dependencies’’ and ‘‘other’’ tended to be
easier to find than expected. ‘‘Code complexity’’ and ‘‘performance’’ tended to be harder to find than
expected. There tended to be more significant deviations where the population was larger.
If we weight the proportions by multiplying the number of occurrences of each fault by its weight from
Table 5 and dividing by the total weighted number of occurrences, we get only a slight change in the
ordering of the faults, with ‘‘internal functionality’’, ‘‘code complexity’’, and ‘‘race conditions’’ (faults 5,
11, and 13) changing slightly more than the rest of the faults.
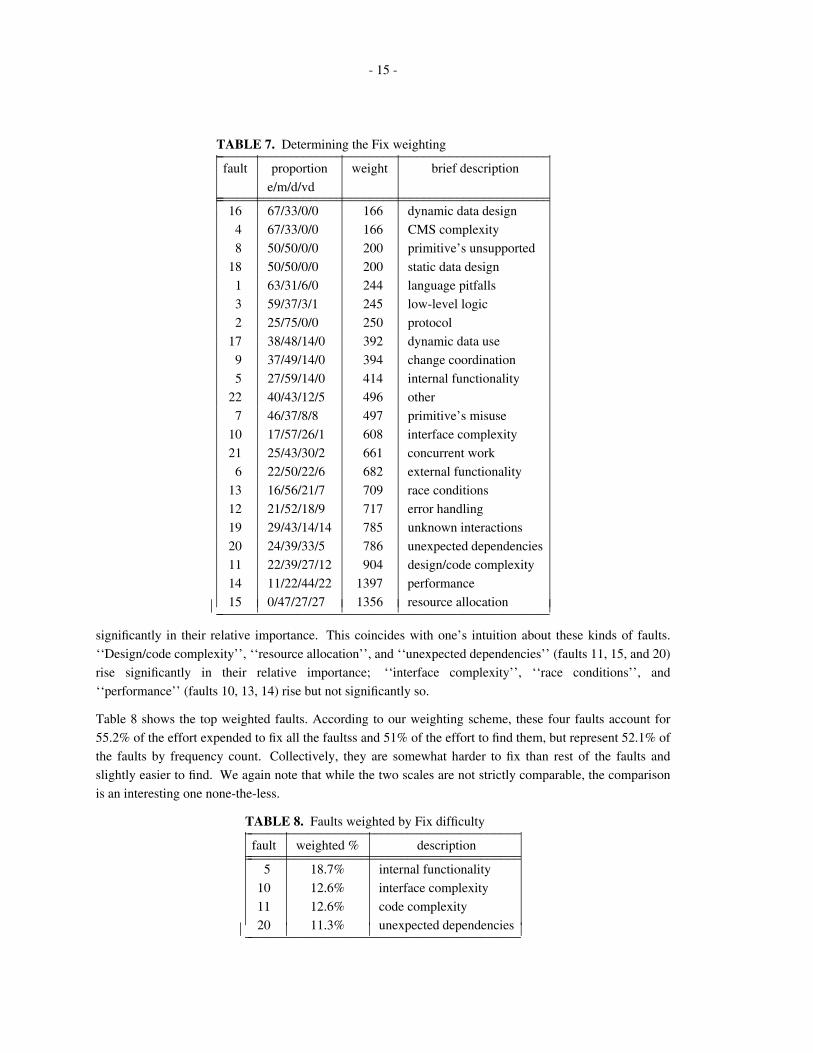
The following table (table 7) represents the results of weighting the difficulty of fixing the various faults by
factoring in the actual time needed to fix the faults. The multiplicative scheme uses the values 1, 3, 15, and
30 for the four average times in fixing a fault. The calculations are performed as in the example of
weighting the difficulty of finding the faults.
The weighting according to the difficulty in fixing the fault causes some interesting shifts in the ordering of
the faults. ‘‘Language pitfalls’’, ‘‘low-level logic’’, and ‘‘internal functionality’’ (faults 1, 3, and 5) drop
- 15 -
TABLE 7. Determining the Fix weighting_ __________________________________________________fault proportion weight brief description
e/m/d/vd_ ___________________________________________________ __________________________________________________16 67/33/0/0 166 dynamic data design
4 67/33/0/0 166 CMS complexity
8 50/50/0/0 200 primitive’s unsupported
18 50/50/0/0 200 static data design
1 63/31/6/0 244 language pitfalls
3 59/37/3/1 245 low-level logic
2 25/75/0/0 250 protocol
17 38/48/14/0 392 dynamic data use
9 37/49/14/0 394 change coordination
5 27/59/14/0 414 internal functionality
22 40/43/12/5 496 other
7 46/37/8/8 497 primitive’s misuse
10 17/57/26/1 608 interface complexity
21 25/43/30/2 661 concurrent work
6 22/50/22/6 682 external functionality
13 16/56/21/7 709 race conditions
12 21/52/18/9 717 error handling
19 29/43/14/14 785 unknown interactions
20 24/39/33/5 786 unexpected dependencies
11 22/39/27/12 904 design/code complexity
14 11/22/44/22 1397 performance
15 0/47/27/27 1356 resource allocation_ __________________________________________________ ⎜⎜⎜⎜⎜⎜⎜⎜⎜⎜⎜⎜⎜⎜⎜⎜⎜⎜⎜⎜⎜⎜⎜⎜⎜⎜⎜⎜⎜⎜⎜⎜⎜⎜⎜
⎜⎜⎜⎜⎜⎜⎜⎜⎜⎜⎜⎜⎜⎜⎜⎜⎜⎜⎜⎜⎜⎜⎜⎜⎜⎜⎜⎜⎜⎜⎜⎜⎜⎜⎜
⎜⎜⎜⎜⎜⎜⎜⎜⎜⎜⎜⎜⎜⎜⎜⎜⎜⎜⎜⎜⎜⎜⎜⎜⎜⎜⎜⎜⎜⎜⎜⎜⎜⎜⎜
⎜⎜⎜⎜⎜⎜⎜⎜⎜⎜⎜⎜⎜⎜⎜⎜⎜⎜⎜⎜⎜⎜⎜⎜⎜⎜⎜⎜⎜⎜⎜⎜⎜⎜⎜
⎜⎜⎜⎜⎜⎜⎜⎜⎜⎜⎜⎜⎜⎜⎜⎜⎜⎜⎜⎜⎜⎜⎜⎜⎜⎜⎜⎜⎜⎜⎜⎜⎜⎜⎜
significantly in their relative importance. This coincides with one’s intuition about these kinds of faults.
‘‘Design/code complexity’’, ‘‘resource allocation’’, and ‘‘unexpected dependencies’’ (faults 11, 15, and 20)
rise significantly in their relative importance; ‘‘interface complexity’’, ‘‘race conditions’’, and
‘‘performance’’ (faults 10, 13, 14) rise but not significantly so.
Table 8 shows the top weighted faults. According to our weighting scheme, these four faults account for
55.2% of the effort expended to fix all the faultss and 51% of the effort to find them, but represent 52.1% of
the faults by frequency count. Collectively, they are somewhat harder to fix than rest of the faults and
slightly easier to find. We again note that while the two scales are not strictly comparable, the comparison
is an interesting one none-the-less.
TABLE 8. Faults weighted by Fix difficulty_ _________________________________________fault weighted % description_ __________________________________________ _________________________________________
5 18.7% internal functionality
10 12.6% interface complexity
11 12.6% code complexity
20 11.3% unexpected dependencies_ _________________________________________ ⎜⎜⎜⎜⎜⎜⎜⎜
⎜⎜⎜⎜⎜⎜⎜⎜
⎜⎜⎜⎜⎜⎜⎜⎜
⎜⎜⎜⎜⎜⎜⎜⎜
- 16 -
In the chi-square analysis, ‘‘language pitfalls’’, and ‘‘low-level logic’’ took fewer days to fix than expected.
‘‘Interface complexity’’ and ‘‘internal functionality’’ took 1 to 30 days more often than expected, while
‘‘design/code complexity’’ and ‘‘unexpected dependencies’’ took longer to fix (that is, 6 to over 30 days)
than expected. These deviations reenforce our weighted assessment of the effort to fix the faults.
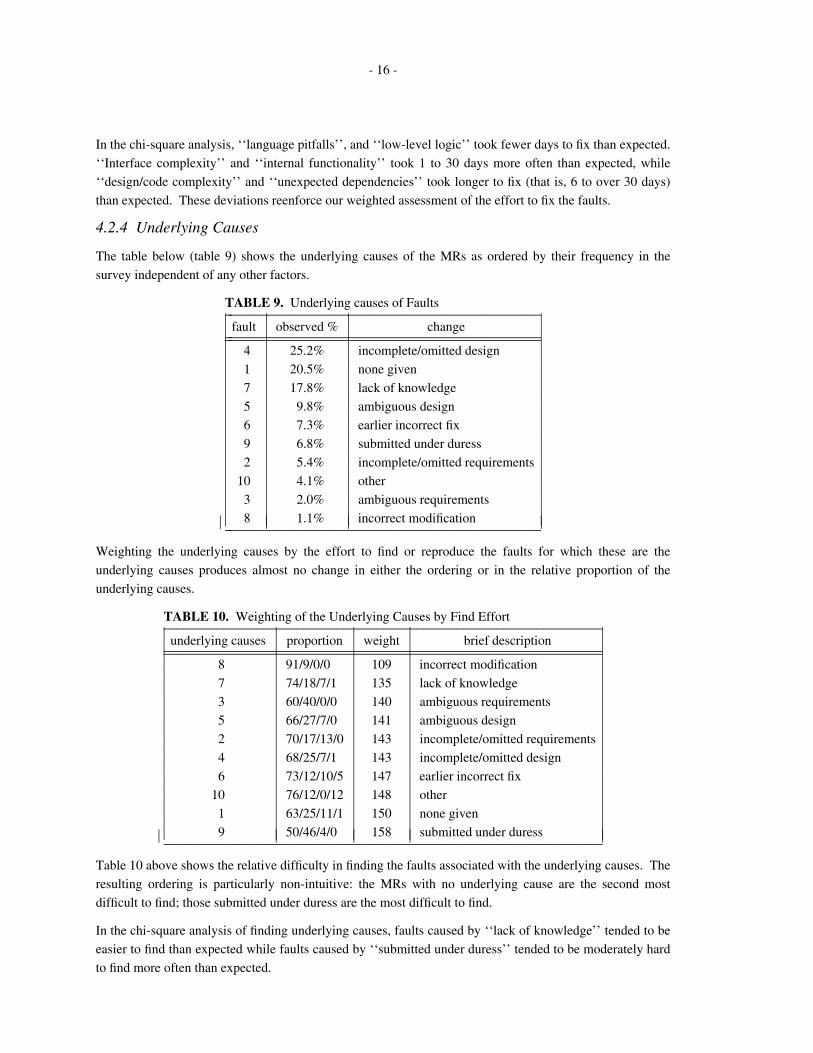
4.2.4 Underlying Causes
The table below (table 9) shows the underlying causes of the MRs as ordered by their frequency in the
survey independent of any other factors.
TABLE 9. Underlying causes of Faults_ _______________________________________________fault observed % change_ ________________________________________________ _______________________________________________
4 25.2% incomplete/omitted design
1 20.5% none given
7 17.8% lack of knowledge
5 9.8% ambiguous design
6 7.3% earlier incorrect fix
9 6.8% submitted under duress
2 5.4% incomplete/omitted requirements
10 4.1% other
3 2.0% ambiguous requirements
8 1.1% incorrect modification_ _______________________________________________ ⎜⎜⎜⎜⎜⎜⎜⎜⎜⎜⎜⎜⎜⎜⎜⎜⎜
⎜⎜⎜⎜⎜⎜⎜⎜⎜⎜⎜⎜⎜⎜⎜⎜⎜
⎜⎜⎜⎜⎜⎜⎜⎜⎜⎜⎜⎜⎜⎜⎜⎜⎜
⎜⎜⎜⎜⎜⎜⎜⎜⎜⎜⎜⎜⎜⎜⎜⎜⎜
Weighting the underlying causes by the effort to find or reproduce the faults for which these are the
underlying causes produces almost no change in either the ordering or in the relative proportion of the
underlying causes.
TABLE 10. Weighting of the Underlying Causes by Find Effort__________________________________________________________________underlying causes proportion weight brief description____________________________________________________________________________________________________________________________________
8 91/9/0/0 109 incorrect modification
7 74/18/7/1 135 lack of knowledge
3 60/40/0/0 140 ambiguous requirements
5 66/27/7/0 141 ambiguous design
2 70/17/13/0 143 incomplete/omitted requirements
4 68/25/7/1 143 incomplete/omitted design
6 73/12/10/5 147 earlier incorrect fix
10 76/12/0/12 148 other
1 63/25/11/1 150 none given
9 50/46/4/0 158 submitted under duress__________________________________________________________________ ⎜⎜⎜⎜⎜⎜⎜⎜⎜⎜⎜⎜⎜⎜⎜⎜⎜
⎜⎜⎜⎜⎜⎜⎜⎜⎜⎜⎜⎜⎜⎜⎜⎜⎜
⎜⎜⎜⎜⎜⎜⎜⎜⎜⎜⎜⎜⎜⎜⎜⎜⎜
⎜⎜⎜⎜⎜⎜⎜⎜⎜⎜⎜⎜⎜⎜⎜⎜⎜
⎜⎜⎜⎜⎜⎜⎜⎜⎜⎜⎜⎜⎜⎜⎜⎜⎜
Table 10 above shows the relative difficulty in finding the faults associated with the underlying causes. The
resulting ordering is particularly non-intuitive: the MRs with no underlying cause are the second most
difficult to find; those submitted under duress are the most difficult to find.
In the chi-square analysis of finding underlying causes, faults caused by ‘‘lack of knowledge’’ tended to be
easier to find than expected while faults caused by ‘‘submitted under duress’’ tended to be moderately hard
to find more often than expected.

- 17 -
Weighting the underlying causes by the effort to fix the faults (table 11) represented by the underlying
causes yields a few shifts in the proportion of effort: ‘‘incomplete/omitted design’’ increased significantly,
‘‘unclear requirements’’ and ‘‘incomplete/omitted requirements’’ increased less significantly; ‘‘none’’
decreased significantly, ‘‘unclear design’’ and ‘‘other’’ decreased less significantly. However, the relative
ordering of the various underlying causes is unchanged.
TABLE 11. Weighting of the Underlying Causes by Fix Effort___________________________________________________________________underlying causes proportion weight brief description______________________________________________________________________________________________________________________________________
10 37/42/12/10 340 other
1 43/43/12/2 412 none given
5 29/55/14/2 464 ambiguous design
7 30/50/17/3 525 lack of knowledge
6 34/45/17/4 544 earlier incorrect fix
9 18/57/25/0 564 submitted under duress
8 18/55/27/0 588 incorrect modification
4 23/50/22/5 653 incomplete/omitted design
2 26/44/24/6 698 incomplete/omitted requirements
3 25/30/24/6 940 ambiguous requirements___________________________________________________________________ ⎜⎜⎜⎜⎜⎜⎜⎜⎜⎜⎜⎜⎜⎜⎜⎜⎜
⎜⎜⎜⎜⎜⎜⎜⎜⎜⎜⎜⎜⎜⎜⎜⎜⎜
⎜⎜⎜⎜⎜⎜⎜⎜⎜⎜⎜⎜⎜⎜⎜⎜⎜
⎜⎜⎜⎜⎜⎜⎜⎜⎜⎜⎜⎜⎜⎜⎜⎜⎜
⎜⎜⎜⎜⎜⎜⎜⎜⎜⎜⎜⎜⎜⎜⎜⎜⎜
The relative weighting of the effort to fix these kinds of underlying causes seems to coincide with one’s
intuition very nicely.
In the chi-square analysis of fixing underlying causes, faults caused by ‘‘none given’’ tended to take less
time to fix than expected, while faults caused by ‘‘incomplete/omitted design’’ and ‘‘submitted under
duress’’ tended to take more time to fix than expected.
In table 12, we present the cross-tabulation of faults and their underlying causes. Faults are represented by
the rows, underlying causes by the columns. The numbers in the matrix are the percentages of the total
population of faults. Thus, 1.5% of the total faults were fault 1 with the underlying cause 1. The expected
number of faults for fault 1 and underlying cause 1 can be computed by multiplying the total faults for each
of those categories: 20.5% * 3.5% = .7%. In this example, the actual number of faults was higher than
expected.
For the sake of brevity, we consider only the most frequently occurring faults and their major underlying
causes. ‘‘Incomplete/omitted design’’ (cause 4) is the primary underlying cause in all of these major faults.
‘‘Ambiguous design’’ (cause 5), ‘‘lack of knowledge’’ (cause 7), and ‘‘none given’’ (cause 1) were also
significant contributors to the presense of these faults.
• internal functionality (fault 5) — ‘‘incomplete/omitted design’’ (cause 4) was felt to have been the
cause of 31% (that is, 7.7% / 25%) of the occurrences of this fault, a percentage higher than expected;
‘‘lack of knowledge’’ (cause 7) was thought to have caused 21% of the occurrences of this fault, higher
than expected; and ‘‘none given’’ was listed as the third underlying cause representing 13% of the
occurrences.
• interface complexity (fault 10) — again, ‘‘incomplete/omitted design’’ was seen to be the primary cause
in the occurrence of this fault (36%), higher than expected; ‘‘lack of knowledge’’ and ‘‘ambiguous
design’’ were seen as the second and third primary causes of this fault (13% and 12% respectively).

- 18 -
TA
BL
E 1
2.C
ross
Tab
ulat
ing
Und
erly
ing
Cau
ses
and
Faul
ts
_ ____
____
____
____
____
____
____
____
____
____
____
____
____
____
____
____
____
____
____
____
____
____
____
____
____
____
____
____
____
____
____
____
_1
2 3
4 5
6 7
8 9
10no
ne
i/o
ambi
guou
s i/o
am
bigu
ous
earl
ier
lack
of
inco
rrec
t su
b’d
othe
rgi
ven
reqs
re
qs
desi
gn
desi
gn
inco
rrec
t kn
owle
dge
mod
un
der
fix
dure
ss20
.5%
5.
4%
2.0%
25
.2%
9.
8%
7.3%
17
.8%
1.
1%
6.8%
4.
1%_ __
____
____
____
____
____
____
____
____
____
____
____
____
____
____
____
____
____
____
____
____
____
____
____
____
____
____
____
____
____
____
____
___
_ ____
____
____
____
____
____
____
____
____
____
____
____
____
____
____
____
____
____
____
____
____
____
____
____
____
____
____
____
____
____
____
____
_1
lang
uage
pitf
alls
3.
5%
1.5
.0
.0
.2
.1
.2
.8
.1
.5
.12
prot
ocol
.4
%
.0
.0
.1
.2
.0
.0
.1
.0
.0
.03
low
-lev
el lo
gic
7.9%
3.
7 .3
.1
.6
.3
1.
2 .7
.0
.6
.4
4 C
MS
com
plex
ity
.3%
.1
.0
.0
.0
.0
.1
.1
.0
.0
.0
5 in
tern
al f
unct
iona
lity
25.0
%
3.3
1.3
.6
7.7
2.8
2.0
5.2
.3
1.2
.66
exte
rnal
fun
ctio
nalit
y 3.
6%
.7
.3
.1
.4
.5
.6
.7
.0
.3
.07
prim
itive
s m
isus
ed
2.4%
.4
.0
.0
.5
.0
.1
.8
.0
.0
.6
8 pr
imiti
ves
unsu
ppor
ted
.6%
.0
.2
.0
.1
.0
.1
.1
.0
.1
.0
9 ch
ange
coo
rdin
atio
n 4.
9%
1.1
.0
.0
.8
1.0
.6
.8
.1
.3
.210
inte
rfac
e co
mpl
exity
11
.4%
2.
1 .6
.2
4.
1 1.
4 1.
1 1.
4 .2
.0
.3
11 d
esig
n/co
de c
ompl
exity
7.
7%
1.3
.0
.3
3.0
1.6
.2
1.0
.0
.0
.312
err
or h
andl
ing
3.3%
.9
.3
.0
.8
.0
.1
.7
.0
.4
.1
13 r
ace
cond
ition
s 4.
3%
1.4
.2
.0
1.3
.5
.1
.3
.0
.4
.114
per
form
ance
.9
%
.2
.0
.1
.2
.0
.0
.3
.0
.0
.115
res
ourc
e al
loca
tion
1.5%
.5
.0
.0
.3
.1
.0
.4
.1
.0
.1
16 d
ynam
ic d
ata
desi
gn
.3%
.0
.0
.0
.1
.0
.0
.1
.0
.1
.0
17 d
ynam
ic d
ata
use
2.1%
.7
.1
.0
.2
.1
.0
.6
.0
.4
.0
18 s
tatic
dat
a de
sign
1.
0%
.3
.1
.1
.2
.1
.0
.1
.0
.1
.019
unk
now
n in
tera
ctio
ns
.7%
.0
.1
.1
.0
.2
.0
.2
.0
.1
.0
20 u
nexp
ecte
d de
pend
enci
es
8.0%
.5
.8
.3
2.
7 .5
.1
1.
4 .0
1.
7 .0
21 c
oncu
rren
t wor
k 4.
4%
.6
.3
.0
1.2
.2
.4
.9
.2
.4
.222
oth
er
5.8%
1.
2 .8
.0
.6
.4
.4
1.
1 .1
.2
1.
0_ __
____
____
____
____
____
____
____
____
____
____
____
____
____
____
____
____
____
____
____
____
____
____
____
____
____
____
____
____
____
____
____
___
⎜⎜⎜⎜⎜⎜⎜⎜⎜⎜⎜⎜⎜⎜⎜⎜⎜⎜⎜⎜⎜⎜⎜⎜⎜⎜⎜⎜⎜⎜⎜⎜⎜
⎜⎜⎜⎜⎜⎜⎜⎜⎜⎜⎜⎜⎜⎜⎜⎜⎜⎜⎜⎜⎜⎜⎜⎜⎜⎜⎜⎜⎜⎜⎜⎜⎜ ⎜⎜⎜⎜⎜⎜⎜⎜⎜⎜⎜⎜⎜⎜⎜⎜⎜⎜⎜⎜⎜⎜⎜⎜⎜⎜⎜⎜⎜⎜⎜⎜⎜
⎜⎜⎜⎜⎜⎜⎜⎜⎜⎜⎜⎜⎜⎜⎜⎜⎜⎜⎜⎜⎜⎜⎜⎜⎜⎜⎜⎜⎜⎜⎜⎜⎜
⎜⎜⎜⎜⎜⎜⎜⎜⎜⎜⎜⎜⎜⎜⎜⎜⎜⎜⎜⎜⎜⎜⎜⎜⎜⎜⎜⎜⎜⎜⎜⎜⎜
⎜⎜⎜⎜⎜⎜⎜⎜⎜⎜⎜⎜⎜⎜⎜⎜⎜⎜⎜⎜⎜⎜⎜⎜⎜⎜⎜⎜⎜⎜⎜⎜⎜
⎜⎜⎜⎜⎜⎜⎜⎜⎜⎜⎜⎜⎜⎜⎜⎜⎜⎜⎜⎜⎜⎜⎜⎜⎜⎜⎜⎜⎜⎜⎜⎜⎜
⎜⎜⎜⎜⎜⎜⎜⎜⎜⎜⎜⎜⎜⎜⎜⎜⎜⎜⎜⎜⎜⎜⎜⎜⎜⎜⎜⎜⎜⎜⎜⎜⎜
⎜⎜⎜⎜⎜⎜⎜⎜⎜⎜⎜⎜⎜⎜⎜⎜⎜⎜⎜⎜⎜⎜⎜⎜⎜⎜⎜⎜⎜⎜⎜⎜⎜
⎜⎜⎜⎜⎜⎜⎜⎜⎜⎜⎜⎜⎜⎜⎜⎜⎜⎜⎜⎜⎜⎜⎜⎜⎜⎜⎜⎜⎜⎜⎜⎜⎜
⎜⎜⎜⎜⎜⎜⎜⎜⎜⎜⎜⎜⎜⎜⎜⎜⎜⎜⎜⎜⎜⎜⎜⎜⎜⎜⎜⎜⎜⎜⎜⎜⎜
⎜⎜⎜⎜⎜⎜⎜⎜⎜⎜⎜⎜⎜⎜⎜⎜⎜⎜⎜⎜⎜⎜⎜⎜⎜⎜⎜⎜⎜⎜⎜⎜⎜
⎜⎜⎜⎜⎜⎜⎜⎜⎜⎜⎜⎜⎜⎜⎜⎜⎜⎜⎜⎜⎜⎜⎜⎜⎜⎜⎜⎜⎜⎜⎜⎜⎜
- 19 -
• unexpected dependencies (fault 20) — not surprisingly, ‘‘incomplete/omitted design’’ was felt to have
been the primary cause of this fault (in 34% of the cases); ‘‘submitted under duress’’ (cause 9)
contributed to 21% of the occurrences, a percentage higher than expected; ‘‘lack of knowledge’’ was
the tertiary cause of this fault, representing 18% of the occurrences.
• design/code complexity (fault 11) — again, ‘‘incomplete/omitted design’’ was felt to have been the
primary cause in 39% of the occurrences of this fault, a percentage higher than expected; ‘‘ambiguous
design’’ was the second most frequent underlying cause of this fault, causing 21% of the faults (also a
higher percentage than expected); ‘‘none given’’ was listed as the third underlying cause representing
17% of the occurrences.
Again, for the sake of brevity, we consider only the most frequently occurring underlying causes and the
faults they were most applicable to. Since ‘‘internal functionality’’ is the most frequently occurring fault,
one is not surprised that it is one of the faults to which these major underlying causes are applicable,
• incomplete/omitted design (cause 4) — as we noted in the preceding paragraph, ‘‘internal
functionality’’, ‘‘interface complexity’’, ‘‘code/design complexity’’, and ‘‘unexpected dependencies’’
were the major applicable faults (31%, 12%, 12% and 11% respectively) with the first three occurring
with higher than expected frequency.
• none given (cause 1) — ‘‘low-level logic’’ (fault 3) was the leading fault, representing 18% of the
occurrences (a percentage higher than expected); ‘‘internal functionality’’ (fault 5) was the second
major fault, representing 16% of the occurrences (a percentage lower than expected); ‘‘interface
complexity’’ (fault 10) was the third leading fault, representing 10% of the occurrences; and ‘‘language
pitfalls’’ was the fourth leading fault, representing 8% of the occurrences (a percentage higher than
expected).
• lack of knowledge (cause 7) — ‘‘internal functionality’’ was the leading fault, representing 29% of the
occurrences (a percentage higher than expected); ‘‘interface complexity’’ was next with 8% of the
occurrences (a percentage lower than expected); ‘‘unexpected dependencies’’ was third with 8% of the
occurrences; and ‘‘other’’ (fault 22) was the fourth with 6%.
• ambiguous design (cause 5) — ‘‘internal functionality’’ represented 29% of the occurrences;
‘‘code/design complexity’’ (fault 11) was second fault, representing 16% of the occurrences (a
percentage higher than expected); ‘‘interface complexity’’ was third with 14%; and ‘‘change
coordination’’ (fault 9) was fourth, representing 10% of the occurrences (a percentage higher than
expected).
The high proportion of ‘‘none given’’ as an underlying cause requires some explanation. One of the
reasons for this is that faults such as ‘‘language pitfalls’’, ‘‘low-level logic’’, ‘‘race conditions’’ and
‘‘change coordination’’ tend to be both the fault and the underlying cause (7.8% — or 33% of the in the
‘‘none given’’ underlying cause category). In addition, one could easily imagine that some of the faults
such as ‘‘interface complexity’’ and ‘‘design/code complexity’’ could also be considered both the fault and
the underlying cause (3.3% — or 16% of the faults in the ‘‘none given’’ underlying cause category). On
the other hand, we were surprised that no cause was given for a substantial part of the ‘‘internal
functionality’’ faults (3.7% — or 18% of the faults in the ‘‘none given’’ category). One would expect there
to be some underlying cause for that particular fault.

- 20 -
4.2.5 Means of Prevention
The table below (table 13) shows the means of prevention of the MRs as ordered by their occurrence
independent of any other factors. We note that the various means of prevention are by no means
independent or non-overlapping. Moreover, the means selected may well reflect a particular approach of the
responder in selecting one means over another (for example, see the discussion below about formal versus
informal means of prevention).
TABLE 13. Means of Error Prevention_ ______________________________________________causes observed % brief description_ _______________________________________________ ______________________________________________
5 24.5% application walk-throughs
6 15.7% expert person/documentation
8 13.3% guideline enforcement
2 10.0% requirements/design templates
9 9.9% better test planning
1 8.8% formal requirements
3 7.2% formal interface specifications
10 6.9% other
4 2.2% training
7 1.5% design/code currency_ ______________________________________________ ⎜⎜⎜⎜⎜⎜⎜⎜⎜⎜⎜⎜⎜⎜⎜⎜⎜
⎜⎜⎜⎜⎜⎜⎜⎜⎜⎜⎜⎜⎜⎜⎜⎜⎜
⎜⎜⎜⎜⎜⎜⎜⎜⎜⎜⎜⎜⎜⎜⎜⎜⎜
⎜⎜⎜⎜⎜⎜⎜⎜⎜⎜⎜⎜⎜⎜⎜⎜⎜
It is interesting to note that the application-specific means of prevention (‘‘application walk-throughs’’) is
considered the most effective means of prevention. This selection of application walk-throughs as the most
useful means of error prevention appears to confirm the observation of Curtis, Krasner and Iscoe [6] that a
thin spread of application knowledge is the most significant problem in building large systems.
Further it is worth noting that informal means of prevention rank higher than formal ones. On the one
hand, this may reflect the general bias in the United States against formal methods. On the other hand, the
informal means are a non-technical solution to providing the information that may be supplied by the
formal representations (and which provide a more technical solution with perhaps higher attendant adoption
costs).
The level of effort to find the faults for which these are the means of prevention does not change the order
found in the table above, with the exception of ‘‘requirements/design templates’’ which seems to apply to
the easier to find faults and ‘‘guideline enforcement’’ which seems to apply more to the harder to find
faults.
In the chi-square analysis, the relationship between finding faults and preventing them is the most
independent of the relationships reported here with p=.041. ‘‘Application walk-throughs’’ applied to faults
that were marginally easier to find than expected, while ‘‘guideline enforcement’’ applied to faults that
were less easy to find than expected.
The table below is the means of prevention weighted by the effort to fix the associated faultss.

- 21 -
TABLE 14. Means of Prevention Weighted by Fix Effort_ ___________________________________________________________prevention proportion weight brief description_ ____________________________________________________________ ___________________________________________________________
8 38/52/7/3 389 guideline enforcement
9 35/52/12/1 401 better test planning
7 40/40/20/0 460 design/code currency
5 33/50/17/1 468 application walk-throughs
10 49/36/6/9 517 other
2 10/52/30/1 654 requirements/design templates
3 26/43/26/4 675 formal interface specifications
6 22/48/24/6 706 expert person/documentation
1 20/50/22/8 740 formal requirements
4 23/36/23/18 1016 training_ ___________________________________________________________ ⎜⎜⎜⎜⎜⎜⎜⎜⎜⎜⎜⎜⎜⎜⎜⎜⎜
⎜⎜⎜⎜⎜⎜⎜⎜⎜⎜⎜⎜⎜⎜⎜⎜⎜
⎜⎜⎜⎜⎜⎜⎜⎜⎜⎜⎜⎜⎜⎜⎜⎜⎜
⎜⎜⎜⎜⎜⎜⎜⎜⎜⎜⎜⎜⎜⎜⎜⎜⎜
⎜⎜⎜⎜⎜⎜⎜⎜⎜⎜⎜⎜⎜⎜⎜⎜⎜
It is interesting to note that the faults considered to be prevented by training are the hardest to fix. The
formal methods also apply to classes of faults that take a long time to fix.
Weighting the means of prevention by effort to fix their corresponding faults yields a few shifts in
proportion: ‘‘application walk-throughs’’, ‘‘better test planning’’, and ‘‘guideline enforcement’’ decreased
in proportion; ‘‘expert person/documentation’’ and ‘‘formal requirements’’ increased in proportion,
‘‘formal interface specifications’’ and ‘‘other’’ less so. As a result, the ordering changes slightly to 5, 6, 2,
1, 8, 10, 3, 9, 4, 7: ‘‘expert person/documentation’’ and ‘‘ formal requirements’’ (numbers 6 and 1) are
weighted significantly higher; ‘‘requirements/design templates’’, ‘‘formal interface specifications’’,
‘‘training’’, and ‘‘other’’ (numbers 2, 3, 4, and 10) are less significantly higher; ‘‘guideline enforcement’’
and ‘‘better test planning’’ (numbers 8 and 9) are significantly lower.
In the chi-square analysis, faults prevented by ‘‘application walk-throughs’’, ‘‘guideline enforcement’’, and
‘‘other’’ tended to take fewer days to fix than expected, while faults prevented by ‘‘formal requirements’’,
requirements/design templates’’ and ‘‘expert person/documentation’’ took longer to fix than expected.
In the table below (table 15), we present the cross-tabulation of faults and their means of prevention.
Again, the faults are represented by the rows, and the means of prevention are represented by the columns.
The data is analogous to the preceding cross tabulation of faults and underlying causes.
For the sake of brevity, we consider only the most frequently occurring faults and their major means of
prevention. ‘‘Application walk-throughs’’ were felt to be an effective means of preventing these most
significant faults. ‘‘Expert person/documentation’’, ‘‘formal requirements’’ and ‘‘formal interface
specifications’’ were also significant means of preventing these faults.
• internal functionality (fault 5) — ‘‘application walk-throughs’’ (prevention 5) were thought to be the
most effective means of prevention, applicable to 27% of the occurrences of this fault; ‘‘expert
person/documentation’’ (prevention 6) was felt to be the second most effective means, applicable to
18% of the fault occurrences; and ‘‘requirements/design templates’’ were thought to applicable to 14%
of the fault occurrences, a percentage higher than expected.

- 22 -
TA
BL
E 1
6.C
ross
Tab
ulat
ing
Mea
ns o
f Pr
even
tion
and
Faul
ts
_ ___
____
____
____
____
____
____
____
____
____
____
____
____
____
____
____
____
____
____
____
____
____
____
____
____
____
____
____
____
__1
2 3
4 5
6 7
8 9
10fo
rmal
re
q/de
s fo
rmal
tr
aini
ng
appl
ex
pert
de
sign
gu
ide-
be
tter
othe
rsre
qs
form
s i’
face
w
alk-
pe
rson
co
de
line
test
spec
s th
rus
doc’
n cu
rren
cy
enf’
mt
plan
s8.
8%
10.0
%
7.2%
2.
2%
24.5
%
15.7
%
1.5%
13
.3%
9.
9%
6.9%
_ ___
____
____
____
____
____
____
____
____
____
____
____
____
____
____
____
____
____
____
____
____
____
____
____
____
____
____
____
____
___ _
____
____
____
____
____
____
____
____
____
____
____
____
____
____
____
____
____
____
____
____
____
____
____
____
____
____
____
____
____
1 la
ngua
ge p
itfal
ls
3.5%
.0
.1
.1
.0
1.
0 .3
.1
1.
3 .4
.2
2 pr
otoc
ol
.4%
.1
.2
.0
.0
.1
.0
.0
.0
.0
.0
3 lo
w-l
evel
logi
c 7.
9%
.1
.0
.1
.2
2.3
.3
.2
3.2
.8
.74
CM
S co
mpl
exity
.3
%
.0
.0
.0
.0
.0
.1
.0
.1
.1
.05
inte
rnal
fun
ctio
nalit
y 25
.0%
1.
9 3.
5 1.
5 .4
6.
6 4.
4 .2
3.
3 3.
1 .1
6 ex
tern
al f
unct
iona
lity
3.6%
.6
.3
.4
.0
.1
.7
.0
.5
.9
.1
7 pr
imiti
ves
mis
used
2.
4%
.1
.1
.2
.0
.8
.3
.0
.1
.2
.68
prim
itive
s un
supp
orte
d .6
%
.1
.0
.0
.0
.3
.0
.0
.0
.1
.19
chan
ge c
oord
inat
ion
4.9%
.4
.9
.3
.4
.8
.3
.3
.3
.7
.5
10 in
terf
ace
com
plex
ity
11.4
%
2.1
.3
2.1
.0
3.0
1.7
.1
1.2
.7
.211
des
ign/
code
com
plex
ity
7.7%
.8
.5
.1
.4
2.
2 2.
4 .2
.3
.4
.4
12 e
rror
han
dlin
g 3.
3%
.2
.2
.3
.1
.6
.6
.0
.4
.5
.413
rac
e co
nditi
ons
4.3%
.8
.0
.4
.0
1.
2 .4
.2
.4
.2
.7
14 p
erfo
rman
ce
.9%
.0
.0
.0
.2
.2
.3
.0
.0
.0
.2
15 r
esou
rce
allo
catio
n 1.
5%
.1
.1
.1
.0
.3
.3
.0
.3
.3
.016
dyn
amic
dat
a de
sign
.3
%
.0
.0
.0
.0
.1
.0
.0
.1
.0
.117
dyn
amic
dat
a us
e 2.
1%
.0
.0
.2
.0
.8
.5
.0
.5
.0
.118
sta
tic d
ata
desi
gn
1.0%
.1
.1
.0
.0
.2
.2
.0
.0
.3
.1
19 u
nkno
wn
inte
ract
ions
.7
%
.1
.0
.2
.0
.0
.2
.0
.0
.2
.020
une
xpec
ted
depe
nden
cies
8.
0%
.6
2.2
1.1
.1
2.3
.6
.0
.4
.6
.121
con
curr
ent w
ork
4.4%
.4
.7
.0
.2
1.
2 1.
1 .1
.3
.0
.4
22 o
ther
5.
8%
.3
.8
.1
.2
.4
1.0
.1
.6
.4
1.9
_ ___
____
____
____
____
____
____
____
____
____
____
____
____
____
____
____
____
____
____
____
____
____
____
____
____
____
____
____
____
__
⎜⎜⎜⎜⎜⎜⎜⎜⎜⎜⎜⎜⎜⎜⎜⎜⎜⎜⎜⎜⎜⎜⎜⎜⎜⎜⎜⎜⎜⎜⎜⎜⎜
⎜⎜⎜⎜⎜⎜⎜⎜⎜⎜⎜⎜⎜⎜⎜⎜⎜⎜⎜⎜⎜⎜⎜⎜⎜⎜⎜⎜⎜⎜⎜⎜⎜ ⎜⎜⎜⎜⎜⎜⎜⎜⎜⎜⎜⎜⎜⎜⎜⎜⎜⎜⎜⎜⎜⎜⎜⎜⎜⎜⎜⎜⎜⎜⎜⎜⎜
⎜⎜⎜⎜⎜⎜⎜⎜⎜⎜⎜⎜⎜⎜⎜⎜⎜⎜⎜⎜⎜⎜⎜⎜⎜⎜⎜⎜⎜⎜⎜⎜⎜
⎜⎜⎜⎜⎜⎜⎜⎜⎜⎜⎜⎜⎜⎜⎜⎜⎜⎜⎜⎜⎜⎜⎜⎜⎜⎜⎜⎜⎜⎜⎜⎜⎜
⎜⎜⎜⎜⎜⎜⎜⎜⎜⎜⎜⎜⎜⎜⎜⎜⎜⎜⎜⎜⎜⎜⎜⎜⎜⎜⎜⎜⎜⎜⎜⎜⎜
⎜⎜⎜⎜⎜⎜⎜⎜⎜⎜⎜⎜⎜⎜⎜⎜⎜⎜⎜⎜⎜⎜⎜⎜⎜⎜⎜⎜⎜⎜⎜⎜⎜
⎜⎜⎜⎜⎜⎜⎜⎜⎜⎜⎜⎜⎜⎜⎜⎜⎜⎜⎜⎜⎜⎜⎜⎜⎜⎜⎜⎜⎜⎜⎜⎜⎜
⎜⎜⎜⎜⎜⎜⎜⎜⎜⎜⎜⎜⎜⎜⎜⎜⎜⎜⎜⎜⎜⎜⎜⎜⎜⎜⎜⎜⎜⎜⎜⎜⎜
⎜⎜⎜⎜⎜⎜⎜⎜⎜⎜⎜⎜⎜⎜⎜⎜⎜⎜⎜⎜⎜⎜⎜⎜⎜⎜⎜⎜⎜⎜⎜⎜⎜
⎜⎜⎜⎜⎜⎜⎜⎜⎜⎜⎜⎜⎜⎜⎜⎜⎜⎜⎜⎜⎜⎜⎜⎜⎜⎜⎜⎜⎜⎜⎜⎜⎜
⎜⎜⎜⎜⎜⎜⎜⎜⎜⎜⎜⎜⎜⎜⎜⎜⎜⎜⎜⎜⎜⎜⎜⎜⎜⎜⎜⎜⎜⎜⎜⎜⎜
⎜⎜⎜⎜⎜⎜⎜⎜⎜⎜⎜⎜⎜⎜⎜⎜⎜⎜⎜⎜⎜⎜⎜⎜⎜⎜⎜⎜⎜⎜⎜⎜⎜
- 23 -
• interface complexity (fault 10) — again, ‘‘application walk-throughs’’ were considered to be the most
effective applicable to 26% of the cases; ‘‘formal requirements’’ (prevention 1) and ‘‘formal interface
specifications’’ were felt to be equally effective with each preventing 18% of the fault occurrences (in
both cases, a percentage higher than expected).
• unexpected dependencies (fault 20) — ‘‘application walk-throughs’’ were felt to be the most effective
means of preventing this fault, applicable to 29% of the occurrences; ‘‘requirements/design templates’’
were considered the second most effective and applicable to 28% of the fault occurrences (a percentage
higher than expected); and ‘‘formal interface specifications’’ were considered applicable to 14% of the
fault occurrences, a percentage higher than expected.
• design/code complexity (fault 11) — ‘‘expert person/documentation’’ was felt to be the most effective
means of preventing this fault, applicable to 31% of the cases (higher than expected); ‘‘application
walk-throughs’’ were the second most effective means, applicable to 29% of the occurrences; and
‘‘formal requirements’’ was third, applicable to 10% of the fault occurrences.
Again, for the sake of brevity, we consider only the most frequently occurring means of prevention and the
faults they were most applicable to. Not surprisingly, these means were most applicable to ‘‘internal
functionality’’, and ‘‘interface complexity’’ the most prevalent faults. Counter-intuitively, they are also
strongly recommended as applicable to ‘‘low level logic’’.
• application walk-throughs (prevention 5) — ‘‘internal functionality’’ (fault 5) was considered as the
primary target in 27% of the uses of this means of prevention; ‘‘interface complexity’’ (fault 10) was
felt to be the secondary target, representing 12% of the uses of this means; and ‘‘low-level logic’’ (fault
3) and ‘‘unexpected dependencies’’ (fault 20) were next with 9% each.
• expert person/documentation (prevention 6) — again, ‘‘internal functionality’’ is the dominant target
for this means, representing 29% of the possible applications; ‘‘design/code complexity’’ is the second
most applicable target, representing 15% of the possible applications (a percentage higher than
expected); and ‘‘interface complexity’’ represented 11% of the uses (higher than expected).
• guideline enforcement (prevention 8) — ‘‘internal functionality’’ and ‘‘low-level logic’’ were the
dominant targets for this means of prevention, representing 25% and 24% respectively (the latter being
higher than expected); ‘‘language pitfalls (fault 1) was seens as the third most relevant fault
representing 10% of the possible applications (higher than expected); and ‘‘interface complexity’’ was
the fourth with 9% of the possible applications of this means of prevention.
4.2.6 Underlying Causes and Means of Prevention
In this section on the data, we summarize the relationships between underlying causes and means of
prevention. The underlying causes are listed across the top of the table and represent the columns, and the
means of prevention are listed down the left side and represent the rows of the table.
It is interesting to note (in table 16 below) that in the chi-square analysis there are lots of deviations (that is,
there is a wider variance between the actual values and the expected values in correlating underlying causes
and means of prevention) and that there does not appear to be much statistical structure. This indicates that
there are strong dependencies between the underlying causes and their means of prevention. Intuitively,
this type of relationship is just what we would expect.

- 24 -
TA
BL
E 1
6.C
ross
Tab
ulat
ing
Und
erly
ing
Cau
ses
and
Mea
ns o
f Pr
even
tion
_ ___
____
____
____
____
____
____
____
____
____
____
____
____
____
____
____
____
____
____
____
____
____
____
____
____
____
____
____
____
____
____
__1
2 3
4 5
6 7
8 9
10no
ne
i/o
ambi
guou
s i/o
am
bigu
ous
earl
ier
lack
of
inco
rrec
t su
b’d
othe
rgi
ven
reqs
re
qs
desi
gn
desi
gn
inco
rrec
t kn
owle
dge
mod
un
der
fix
dure
ss20
.5%
5.
4%
2.0%
25
.2%
9.
8%
7.3%
17
.8%
1.
1%
6.8%
4.
1%_ _
____
____
____
____
____
____
____
____
____
____
____
____
____
____
____
____
____
____
____
____
____
____
____
____
____
____
____
____
____
____
____
_ ___
____
____
____
____
____
____
____
____
____
____
____
____
____
____
____
____
____
____
____
____
____
____
____
____
____
____
____
____
____
____
__1
form
al r
equi
rem
ents
8.
8%
.4
2.3
.9
3.5
.8
.3
.5
.1
.0
.02
reqs
/des
ign
tem
plat
es
10.0
%
.4
1.7
.1
3.7
1.9
.1
.8
.0
1.3
.03
form
al in
terf
ace
spec
s 7.
2%
.8
.3
.1
2.7
.8
.3
2.0
.0
.2
.04
trai
ning
2.
2%
.4
.0
.1
.7
.1
.3
.6
.0
.0
.05
appl
icat
ion
wal
k-th
rus
24.5
%
7.5
.2
.3
7.3
3.1
1.8
3.1
.0
.5
.76
expe
rt p
erso
n/do
c 15
.7%
1.
5 .4
.4
3.
5 1.
8 1.
0 5.
8 .6
.3
.4
7 de
sign
/cod
e cu
rren
cy
1.5%
.4
.0
.0
.6
.2
.1
.2
.0
.0
.0
8 gu
idel
ine
enfo
rcem
ent
13.3
%
4.0
.1
.0
.6
.2
1.6
2.5
.0
3.7
.69
bette
r te
st p
lann
ing
9.90
%
2.8
.2
.0
1.7
.8
1.6
1.9
.3
.2
.410
oth
ers
6.9%
2.
3 .2
.1
.9
.1
.2
.4
.1
.6
2.
0_ _
____
____
____
____
____
____
____
____
____
____
____
____
____
____
____
____
____
____
____
____
____
____
____
____
____
____
____
____
____
____
____
⎜⎜⎜⎜⎜⎜⎜⎜⎜⎜⎜⎜⎜⎜⎜⎜⎜⎜⎜
⎜⎜⎜⎜⎜⎜⎜⎜⎜⎜⎜⎜⎜⎜⎜⎜⎜⎜⎜ ⎜⎜⎜⎜⎜⎜⎜⎜⎜⎜⎜⎜⎜⎜⎜⎜⎜⎜⎜
⎜⎜⎜⎜⎜⎜⎜⎜⎜⎜⎜⎜⎜⎜⎜⎜⎜⎜⎜
⎜⎜⎜⎜⎜⎜⎜⎜⎜⎜⎜⎜⎜⎜⎜⎜⎜⎜⎜
⎜⎜⎜⎜⎜⎜⎜⎜⎜⎜⎜⎜⎜⎜⎜⎜⎜⎜⎜
⎜⎜⎜⎜⎜⎜⎜⎜⎜⎜⎜⎜⎜⎜⎜⎜⎜⎜⎜
⎜⎜⎜⎜⎜⎜⎜⎜⎜⎜⎜⎜⎜⎜⎜⎜⎜⎜⎜
⎜⎜⎜⎜⎜⎜⎜⎜⎜⎜⎜⎜⎜⎜⎜⎜⎜⎜⎜
⎜⎜⎜⎜⎜⎜⎜⎜⎜⎜⎜⎜⎜⎜⎜⎜⎜⎜⎜
⎜⎜⎜⎜⎜⎜⎜⎜⎜⎜⎜⎜⎜⎜⎜⎜⎜⎜⎜
⎜⎜⎜⎜⎜⎜⎜⎜⎜⎜⎜⎜⎜⎜⎜⎜⎜⎜⎜
⎜⎜⎜⎜⎜⎜⎜⎜⎜⎜⎜⎜⎜⎜⎜⎜⎜⎜⎜

- 25 -
We first summarize the means of prevention associated with the major underlying causes. ‘‘Application
walk-throughs’’, ‘‘expert person/documentation’’, and ‘‘guideline enforcement’’ were considered
important in addressing these major underlying causes.
• incomplete/omitted design (cause 4) — ‘‘application walk-throughs’’ (prevention 5) was thought to be
applicable to 28% of the faults with this underlying cause (a percentage higher than expected);
‘‘requirements/design templates’’ (prevention 2) and ‘‘expert person/documentation’’ (prevention 6)
were next in importance with 14% each (the first being higher than expected); and ‘‘formal
requirements’’ (prevention 1) was felt to be applicable to 12% of the faults with this underlying cause (a
percentage higher than expected)
• none given (cause 1) — again, ‘‘application walk-throughs’’ was thought to be applicable to 37% of the
faults with these underlying causes; ‘‘guideline enforcement’’ (prevention 8), ‘‘better test planning’’
(prevention 9), and ‘‘other’’ (prevention 10) were felt to be applicable to 19%, 14%, and 10% of the
faults, respectively. In all four of these cases, the percentages were higher than expected.
• lack of knowledge (cause 7) — ‘‘expert person/documentation’’ was thought to be applicable to 32% of
the faults with this underlying cause, a percentage higher than expected; ‘‘application walk-throughs’’,
‘‘guideline enforcement’’, and ‘‘formal interface specifications’’ were felt to be applicable to 17%, 14%
and 11% of the faults with this underlying cause, respectively, though ‘‘application walk-throughs’’ had
a lower percentage than expected, while ‘‘formal interface specifications’’ had a higher percentage than
expected.
The following summarizes the major underlying causes addressed by the most frequently considered means
of prevention. ‘‘Lack of knowledge’’, ‘‘none given’’, ‘‘incomplete/omitted design’’, and ‘‘ambiguous
design’’ were the major underlying causes for which these means of prevention were considered important.
It is somewhat non-intuitive that the ‘‘none given’’ underlying cause category is so prominent as an
appropriate target for these primary means of prevention.
• application walk-throughs (prevention 5) — ‘‘none given’’ (cause 1) and ‘‘incomplete/omitted design’’
(cause 4) were thought to be the appropriate for this means of prevention for 31% and 30% of the cases
(higher than expected); ‘‘ambiguous design’’ (cause 5) and ‘‘lack of knowledge’’ (cause 7) were both
felt to apply to 13% of the cases each (though the first was higher than expected and the second lower).
• expert person/documentation (prevention 6) — ‘‘lack of knowledge’’ was considered the major target
for this means of prevention, accounting for 37% of the cases (a higher than expected value);
‘‘incomplete/omitted design’’ and ‘‘ambiguous design’’ were thought to be appropriate in 23% and
11% of the cases, respectively; and ‘‘none given’’ was thought appropriate in 10% of the cases (lower
than expected).
• guideline enforcement (prevention 8) — ‘‘none given’’ and ‘‘incorrect modification’’ were felt to be the
most appropriate for this means of prevention for 30% and 28% of the cases, respectively (both higher
than expected); ‘‘lack of knowledge’’ and ‘‘incorrect earlier fix’’ were appropriate in 19% and 12% of
the cases, respectively (the latter was higher than expected).
4.3 Interface Faults versus Implementation Faults
The definition of an interface fault that we use here is that of Basili and Perricone [2] and Perry and
Evangelist [13, 14]: interface faults are ‘‘those that are associated with structures existing outside the
module’s local environment but which the module used’’. Using this definition, we roughly characterize
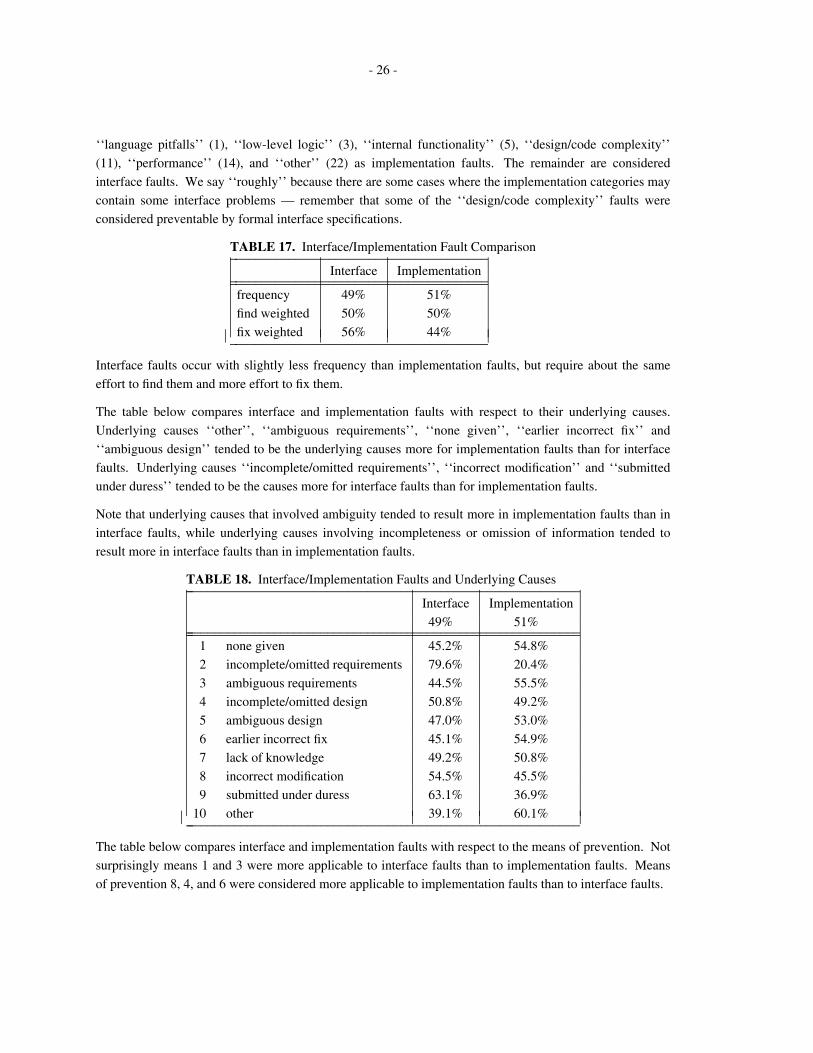
- 26 -
‘‘language pitfalls’’ (1), ‘‘low-level logic’’ (3), ‘‘internal functionality’’ (5), ‘‘design/code complexity’’
(11), ‘‘performance’’ (14), and ‘‘other’’ (22) as implementation faults. The remainder are considered
interface faults. We say ‘‘roughly’’ because there are some cases where the implementation categories may
contain some interface problems — remember that some of the ‘‘design/code complexity’’ faults were
considered preventable by formal interface specifications.
TABLE 17. Interface/Implementation Fault Comparison_ ______________________________________Interface Implementation_ _______________________________________ ______________________________________
frequency 49% 51%
find weighted 50% 50%
fix weighted 56% 44%_ ______________________________________ ⎜⎜⎜⎜⎜⎜⎜
⎜⎜⎜⎜⎜⎜⎜
⎜⎜⎜⎜⎜⎜⎜
⎜⎜⎜⎜⎜⎜⎜
Interface faults occur with slightly less frequency than implementation faults, but require about the same
effort to find them and more effort to fix them.
The table below compares interface and implementation faults with respect to their underlying causes.
Underlying causes ‘‘other’’, ‘‘ambiguous requirements’’, ‘‘none given’’, ‘‘earlier incorrect fix’’ and
‘‘ambiguous design’’ tended to be the underlying causes more for implementation faults than for interface
faults. Underlying causes ‘‘incomplete/omitted requirements’’, ‘‘incorrect modification’’ and ‘‘submitted
under duress’’ tended to be the causes more for interface faults than for implementation faults.
Note that underlying causes that involved ambiguity tended to result more in implementation faults than in
interface faults, while underlying causes involving incompleteness or omission of information tended to
result more in interface faults than in implementation faults.
TABLE 18. Interface/Implementation Faults and Underlying Causes_ ___________________________________________________________Interface Implementation
49% 51%_ ____________________________________________________________ ___________________________________________________________1 none given 45.2% 54.8%
2 incomplete/omitted requirements 79.6% 20.4%
3 ambiguous requirements 44.5% 55.5%
4 incomplete/omitted design 50.8% 49.2%
5 ambiguous design 47.0% 53.0%
6 earlier incorrect fix 45.1% 54.9%
7 lack of knowledge 49.2% 50.8%
8 incorrect modification 54.5% 45.5%
9 submitted under duress 63.1% 36.9%
10 other 39.1% 60.1%_ ___________________________________________________________ ⎜⎜⎜⎜⎜⎜⎜⎜⎜⎜⎜⎜⎜⎜⎜⎜⎜⎜
⎜⎜⎜⎜⎜⎜⎜⎜⎜⎜⎜⎜⎜⎜⎜⎜⎜⎜
⎜⎜⎜⎜⎜⎜⎜⎜⎜⎜⎜⎜⎜⎜⎜⎜⎜⎜
⎜⎜⎜⎜⎜⎜⎜⎜⎜⎜⎜⎜⎜⎜⎜⎜⎜⎜
The table below compares interface and implementation faults with respect to the means of prevention. Not
surprisingly means 1 and 3 were more applicable to interface faults than to implementation faults. Means
of prevention 8, 4, and 6 were considered more applicable to implementation faults than to interface faults.
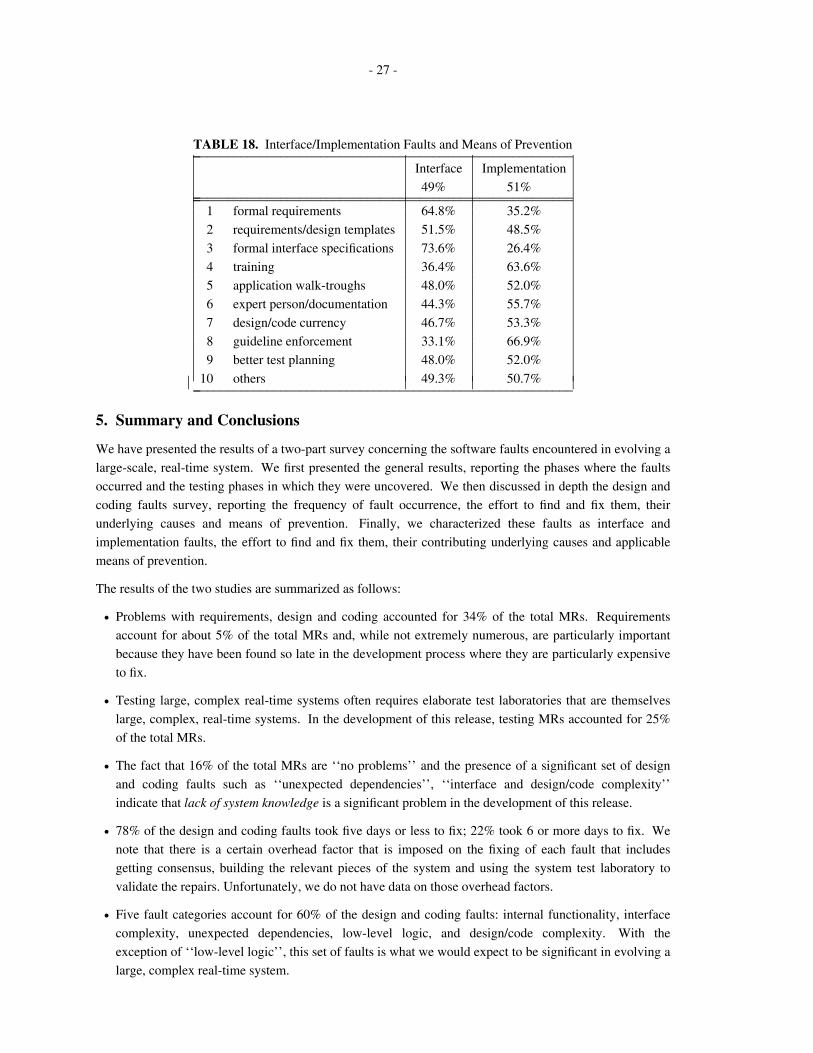
- 27 -
TABLE 18. Interface/Implementation Faults and Means of Prevention_ _________________________________________________________Interface Implementation
49% 51%_ __________________________________________________________ _________________________________________________________1 formal requirements 64.8% 35.2%
2 requirements/design templates 51.5% 48.5%
3 formal interface specifications 73.6% 26.4%
4 training 36.4% 63.6%
5 application walk-troughs 48.0% 52.0%
6 expert person/documentation 44.3% 55.7%
7 design/code currency 46.7% 53.3%
8 guideline enforcement 33.1% 66.9%
9 better test planning 48.0% 52.0%
10 others 49.3% 50.7%_ _________________________________________________________ ⎜⎜⎜⎜⎜⎜⎜⎜⎜⎜⎜⎜⎜⎜⎜⎜⎜⎜
⎜⎜⎜⎜⎜⎜⎜⎜⎜⎜⎜⎜⎜⎜⎜⎜⎜⎜
⎜⎜⎜⎜⎜⎜⎜⎜⎜⎜⎜⎜⎜⎜⎜⎜⎜⎜
⎜⎜⎜⎜⎜⎜⎜⎜⎜⎜⎜⎜⎜⎜⎜⎜⎜⎜
5. Summary and Conclusions
We have presented the results of a two-part survey concerning the software faults encountered in evolving a
large-scale, real-time system. We first presented the general results, reporting the phases where the faults
occurred and the testing phases in which they were uncovered. We then discussed in depth the design and
coding faults survey, reporting the frequency of fault occurrence, the effort to find and fix them, their
underlying causes and means of prevention. Finally, we characterized these faults as interface and
implementation faults, the effort to find and fix them, their contributing underlying causes and applicable
means of prevention.
The results of the two studies are summarized as follows:
• Problems with requirements, design and coding accounted for 34% of the total MRs. Requirements
account for about 5% of the total MRs and, while not extremely numerous, are particularly important
because they have been found so late in the development process where they are particularly expensive
to fix.
• Testing large, complex real-time systems often requires elaborate test laboratories that are themselves
large, complex, real-time systems. In the development of this release, testing MRs accounted for 25%
of the total MRs.
• The fact that 16% of the total MRs are ‘‘no problems’’ and the presence of a significant set of design
and coding faults such as ‘‘unexpected dependencies’’, ‘‘interface and design/code complexity’’
indicate that lack of system knowledge is a significant problem in the development of this release.
• 78% of the design and coding faults took five days or less to fix; 22% took 6 or more days to fix. We
note that there is a certain overhead factor that is imposed on the fixing of each fault that includes
getting consensus, building the relevant pieces of the system and using the system test laboratory to
validate the repairs. Unfortunately, we do not have data on those overhead factors.
• Five fault categories account for 60% of the design and coding faults: internal functionality, interface
complexity, unexpected dependencies, low-level logic, and design/code complexity. With the
exception of ‘‘low-level logic’’, this set of faults is what we would expect to be significant in evolving a
large, complex real-time system.

- 28 -
• Weighting the fault categories by the effort to find and to fix them yielded results that coincide with our
intuition of which faults are easy and hard to find and fix.
• ‘‘Incomplete/omitted design’’, ‘‘lack of knowledge’’, and ‘‘none given’’ (which we conjecture means
that the surface fault is also the underlying cause) account for the underlying causes for 64% of design
and coding faults. The weighting of the effort to fix these underlying causes coincides very nicely with
our intuition: faults caused by requirements problems require the most effort to fix, while faults cause
by ambiguous design and lack of knowledge required among the least effort to fix.
• ‘‘Application walk-throughs’’, ‘‘expert person/documentation’’, ‘‘guideline enforcement’’, and
‘‘requirements/design templates’’ represent 64% of the suggested means of preventing design and
coding faults. As application walk-throughs accounted for 25% of the suggested means of prevention,
we believe that this supports Curtis, Krasner and Iscoe’s claim that lack of application knowledge is a
significant problem.
• While informal means of prevention were preferred over formal means, it was the case that informal
means of prevention tended to be suggested for faults that required less effort to fix and formal means
tended to be suggested for faults that required more effort to fix.
• In Perry and Evangelist [13, 14], interface faults were seen to be a significant portion of the entire set of
faults (68%). However, there was no weighting of these faults versus implementation faults. We found
in this study that interface faults were roughly (see the discussion above) 49% of the entire set of design
and coding faults and that they were harder to fix than the implementation faults. Not surprisingly,
formal requirements and formal interface specifications were suggested as significant means of
preventing interface faults.
The system reported here was developed and evolved using the current ‘‘best practice’’ techniques and
tools with well-qualified practitioners. Because of this fact, we feel that the data point is generalizable to
other large-scale, real-time systems. With this in mind, we offer the following recommendations to improve
the current ‘‘best practice’’.
• Obtain fault data throughout the entire development/evolution cycle (not just in the testing cycle) and
use it monitor the progress of the process.
• Incorporate the non-technological, people-intensive means of prevention into the current process. As
our survey has shown, this will yield benefits for the majority of the faults reported here.
• Introduce tools to increase the precision and completeness of requirements, architecture and design
documents. This will yield benefits for those faults that were generally harder to fix and will help to
detect the requirements, architecture and design problems earlier in the life-cycle.
We are currently incorporating the non-technological solutions into our development process. As we noted
in the introduction, empirical data provides us with insight into the kinds of tools and techniques needed to
support the software engineering of large systems. The data reported here shows clearly the efficacy of
research on requirements specifications (as exemplified by such projects as Watson [9] and Kaleidoscope
[21]), and architectural and design specifications (as exemplified by Perry and Wolf [17] and the Inscape
Environment [15]).

- 29 -
Acknowledgements
David Rosik contributed significantly to the general MR survey; Steve Bruun produced the cross-tabulated
statistical analysis for the design/coding survey and contributed, along with Carolyn Larson, Julie Federico,
H. C. Wei and Tony Lenard, to the analysis of the design/coding survey; and Clive Loader increased our
understanding of the chi-square analysis. We especially thank Marjory P. Yuhas and Lew G. Anderson for
their unflagging support of this work. And finally, we thank all those that participated in the survey.
References
[1] Victor R. Basili and David H. Hutchens, ‘‘An Empirical Study of a Syntactic Complexity Family’’,
IEEE Transactions on Software Engineering, Vol SE-9, No 6 (November 1983), 664-672.
[2] Victor R. Basili and Barry T. Perricone, ‘‘Software Errors and Complexity: an Empirical
Investigation’’, Communications of the ACM, 27:1 (January 1984), 42-52.
[3] Victor R. Basili and DAvid M. Weiss, ‘‘A Methodology for Collecting Valid Software Engineering
Data’’, IEEE Transactions on Software Engineering, Vol. SE-10, No 6 (November 1984), 728-738.
[4] Barry W. Boehm, Software Engineering Economics. Englewood Cliffs: Prentice-Hall, 1981.
[5] John B. Bowen, ‘‘Standard Error Classification to Support Software Reliability Assessment’’,
AFIPS Conference Proceedings, 1980 National Computer Conference, 1980, 697-705.
[6] Bill Curtis, Herb Krasner, and Neil Iscoe, ‘‘A Field Study of the Software Design Process for Large
Systems’’, Communications of the ACM, Vol 31, No 11 (November 1988), 1268-1287.
[7] Albert Endres, ‘‘An Analysis of Errors and Their Causes in System Programs’’, IEEE Transactions
on Software Engineering, Vol. SE-1, No. 2, (June 1975), 140-149.
[8] Robert L. Glass, ‘‘Persistent Software Errors’’ IEEE Transactions on Software Engineering, Vol.
SE-7, No. 2, (March 1981), 162-168.
[9] Van E. Kelly and Uwe Nonnenmann ‘‘Inferring Formal Software Specifications from Episodic
Descriptions’’, Proceedings of AAAI 87. Sixth National Conference on Artificial Intelligence, 13-17
July 1987, Seattle, Washington. 127-132.
[10] M. M. Lehman and L. A. Belady, Program Evolution. Processes of Software Change. London:
Academic Press, 1985.
[11] J. D. Musa, A. Jannino, and K. Okumoto, Software Reliability. New York: McGraw-Hill, 1987.
[12] Thomas J. Ostrand and Elaine J. Weyuker, ‘‘Collecting and Categorizing Software Error Data in an
Industrial Environment’, The Journal of Systems and Software, 4 (1984), 289-300.
[13] Dewayne E. Perry and W. Michael Evangelist. ‘‘An Empirical Study of Software Interface Errors’’,
Proceedings of the International Symposium on New Directions in Computing, IEEE Computer
Society, August 1985, Trondheim, Norway, 32-38.
[14] Dewayne E. Perry and W. Michael Evangelist. ‘‘An Empirical Study of Software Interface Faults
— An Update’’, Proceedings of the Twentieth Annual Hawaii International Conference on Systems
Sciences, January 1987, Volume II, 113-126.
- 30 -
[15] Dewayne E. Perry, ‘‘The Inscape Environment’’, Proceedings of the 11th International Conference
on Software Engineering, 15-18 May 1989, Pittsburgh PA, 2-12.
[16] Dewayne E. Perry, ‘‘Industrial Strength Software Development Environments’’, Proceedings of
IFIPS Congress ’89 — 11th World Computer Congress, August 28 - September 1, 1989, San
Francisco CA.
[17] Dewayne E. Perry and Alexander L. Wolf, ‘‘Software Architecture’’, AT&T Bell Laboratories,
September 1898 (Revised January 1991), submitted for publication.
[18] B. R. Rowland, R. E. Anderson, and P. S. McCabe, ‘‘The 3B20D Processor & DMERT Operating
System: Software Development System’’, The Bell System Technical Journal, 62:1 part 2 (January
1983), 275-290.
[19] N. F. Schneidewind and Heinz-Michael Hoffmann, ‘‘An Experiment in Software Error Data
Collection and Analysis’’, IEEE Transactions on Software Engineering, Vol. SE-5, No. 3, (May
1979), 276-286.
[20] Thomas A. Thayer, Myron Lipow, and Eldred C. Nelson, ‘‘Software Reliability - A Study of Large
Project Reality’’, TRW Series of Software Technology, Volume 2. North-Holland, 1978.
[21] Pamela Zave and Daniel Jackson, ‘‘Practical Specification Techniques for Control-Oriented
Systems’’, Proceedings of IFIPS Congress ’89 — 11th World Computer Congress, August 28 -
September 1, 1989, San Francisco CA.