Embed Size (px)
Citation preview
August 2014
Software Equity Group
Flash Report
Select M&A Transactions and Valuations and
Financial and Valuation Performance of 250+ Publicly Traded Software, SaaS and Internet
Companies by Product Category
• Industry leading boutique investment bank, founded in
1992, representing public and private software and
internet companies seeking:
• Strategic exit
• Growth capital
• Buyout
• Inorganic growth via acquisition
• Buy and sell-side mentoring
• Fairness opinions and valuations
• Sell-side client revenue range: $5 - 75 million
• Buy-side clients include private equity firms and
NASDAQ, NYSE and foreign exchange listed companies
• Clients span virtually every software technology, product
category, delivery model and vertical market
• Global presence providing advice and guidance to more
than 2,000 private and public companies throughout US,
Canada, Europe, Asia-Pacific, Africa and Israel
• Strong cross-functional team leveraging transaction,
operating, legal and engineering experience
• Unparalleled software industry reputation and track
record.
• Highly referenceable base of past clients
LEADERS IN SOFTWARE M&A
We Do Deals.
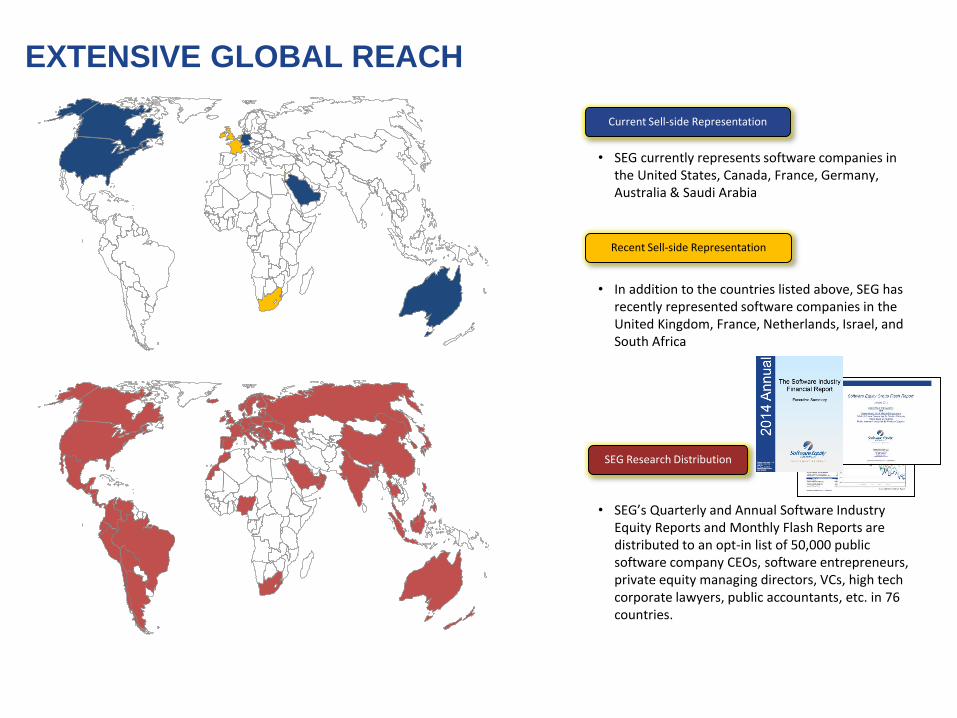
EXTENSIVE GLOBAL REACH
SEG Research Distribution
Current Sell-side Representation
Recent Sell-side Representation
• SEG currently represents software companies in the United States, Canada, France, Germany, Australia & Saudi Arabia
• In addition to the countries listed above, SEG has recently represented software companies in the United Kingdom, France, Netherlands, Israel, and South Africa
• SEG’s Quarterly and Annual Software Industry Equity Reports and Monthly Flash Reports are distributed to an opt-in list of 50,000 public software company CEOs, software entrepreneurs, private equity managing directors, VCs, high tech corporate lawyers, public accountants, etc. in 76 countries.
Software Equity Group is an investment bank and M&A advisory serving the software and technology sectors. Founded in 1992, our firm has guided and advised companies on five continents, including privately-held software and technology companies in the United States, Canada, Europe, Asia Pacific, Africa and Israel. We have represented public companies listed on the NASDAQ, NYSE, American, Toronto, London and Euronext exchanges. Software Equity Group also advises several of the world's leading private equity firms. We are ranked among the top ten investment banks worldwide for application software mergers and acquisitions.
Our value proposition is unique and compelling. We are skilled and accomplished investment bankers with extraordinary software, internet and technology domain expertise. Our industry knowledge and experience span virtually every software product category, technology, market and delivery model, including Software-as-a-Service (Saas), software on-demand and perpetual license. We have profound understanding of software company finances, operations and valuation. We monitor and analyze every publicly disclosed software M&A transaction, as well as the market, economy and technology trends that impact these deals. We're formidable negotiators and savvy dealmakers who facilitate strategic combinations that enhance shareholder value.
Perhaps most important are the relationships we've built and the industry reputation we enjoy. Software Equity Group is known and respected by publicly traded and privately owned software and technology companies worldwide, and we speak with them often. Our Quarterly and Annual Software Industry Equity Reports are read and relied upon by more than thousands of industry executives, entrepreneurs and equity investors in sixty-one countries, and we have been quoted widely in such leading publications as The Wall Street Journal, Barrons, Information Week, The Daily Deal, The Street.com, U.S. News & World Report, Reuters, Mergers & Acquisitions, USA Today, Arizona Republic, Detroit Free Press, Entrepreneur Magazine, Softletter, Software Success, Software CEO Online and Software Business Magazine.
To keep your finger on the pulse of the software equity markets, subscribe to our Annual and Quarterly Research Reports.
Software Equity Group is an investment bank and M&A advisory serving the software and technology sectors. For a confidential consultation without obligation, please contact Kris Beible, Director, Business Development (858) 509-2800, [email protected] .
CONTACT INFORMATION:
Software Equity Group, L.L.C.12220 El Camino Real, Suite 320San Diego, CA 92130www.softwareequity.comp: (858) 509-2800
The information contained in this Report is obtained from sources we believe to be reliable, but no representation or guarantee is made about the accuracy or completeness of such information, or the opinions expressed herein. Nothing in this Report is intended to be a recommendation of a specific security or company or intended to constitute an offer to buy or sell, or the solicitation of an offer to buy or sell, any security. Software Equity Group LLC may have an interest in one or more of the securities or companies discussed herein. Financial data provided by Capital IQ.
This Report may not be reproduced in whole or in part without the expressed prior written authorization of Software Equity Group, L.L.C.Software Equity Group registers each Report with the U.S. Copyright Office and vigorously enforces its intellectual property rights.
ABOUT SOFTWARE EQUITY GROUP
Copyright © 2014 by Software Equity Group, L.L.C., All Rights Reserved
List of Commonly Used Acronyms
CRM Customer Relationship Management
EBITDA Earnings before Interest, Taxes, Depreciation, and Amortization
ERP Enterprise Resource Planning
EV Enterprise Value
FCF Free Cash Flow
FORWARD Current EV / Next Four Quarters' Consensus Financial Estimates
NASDAQ National Association of Securities Dealers Automated Quotation System
PLM Product Lifecycle Management
R&D Research and Development
S&P Standard & Poor's
SaaS Software-as-a-Service
SEG Software Equity Group
SG&A Selling, General, & Administrative
SW Software
TTM Trailing Twelve Month
YoY Year-over-Year
YTD Year-to-date
Copyright © 2014 by Software Equity Group, L.L.C., All Rights Reserved
Table of Contents
SEG Software Index
Select Software Industry M&A Transactions
SEG SaaS Index
SEG Internet Index
Copyright © 2014 by Software Equity Group, L.L.C., All Rights Reserved
SEG Software Index
Select Software Industry M&A Transactions
SEG SaaS Index
SEG Internet Index
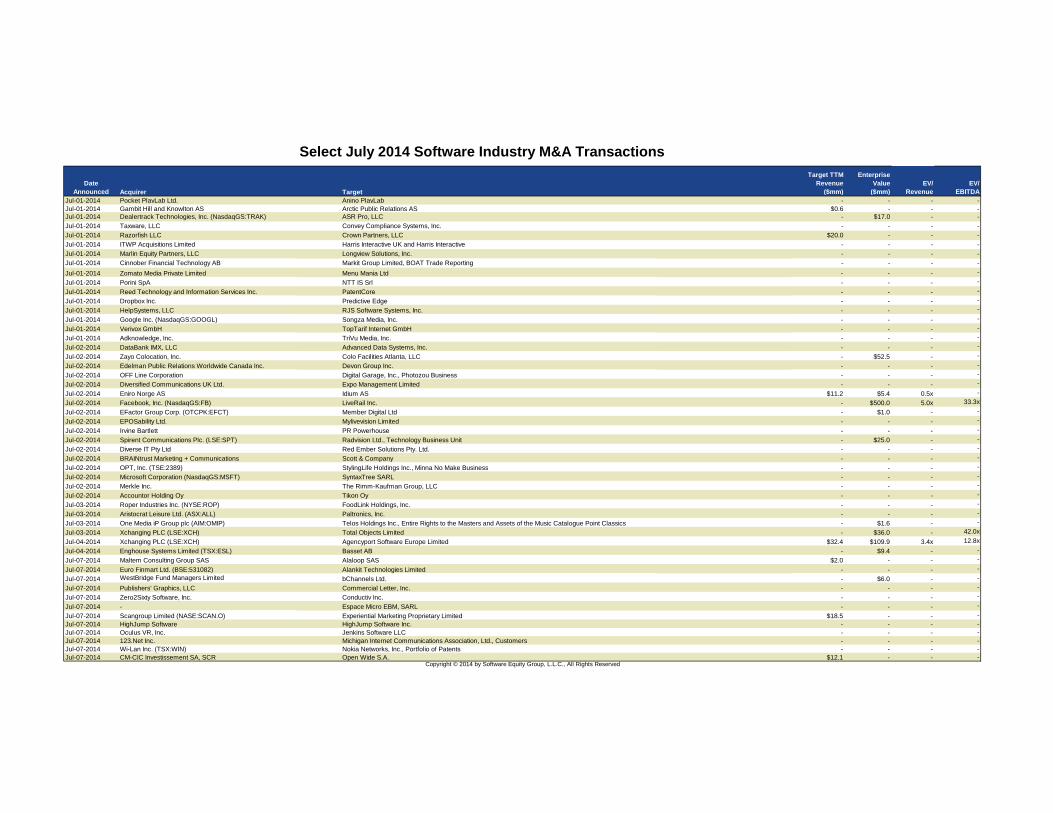
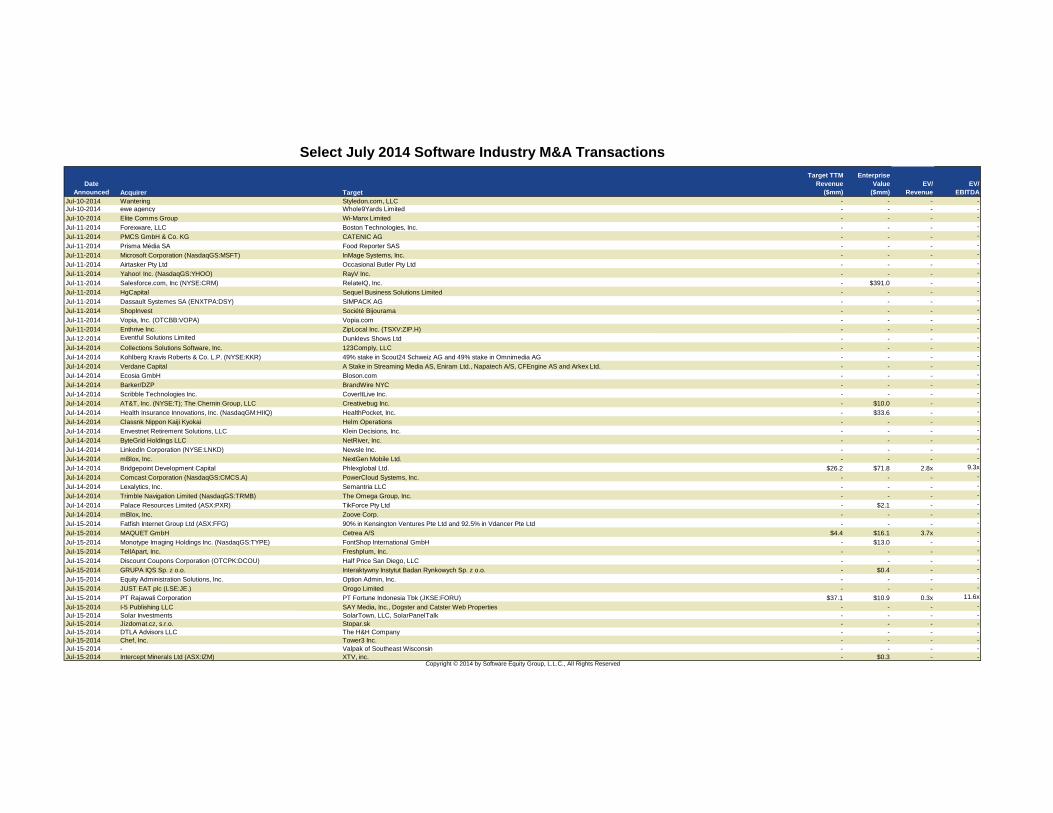
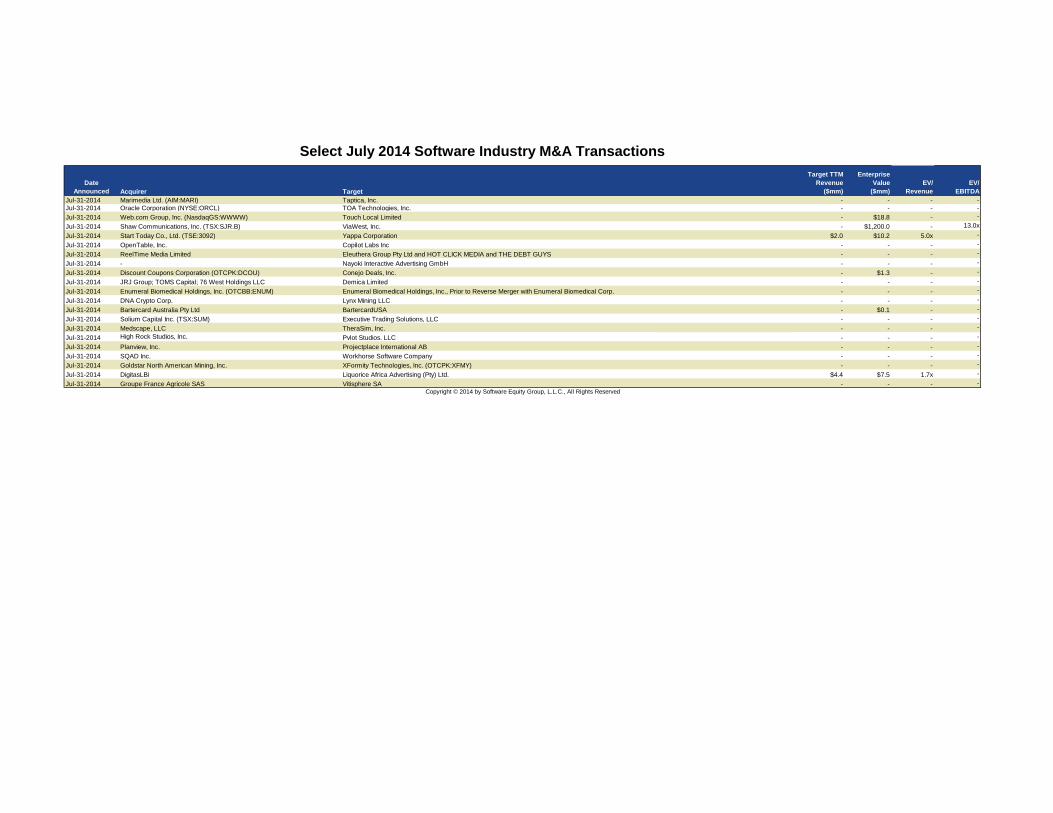
Select July 2014 Software Industry M&A Transactions
Date
Announced Target
Target TTM
Revenue
($mm)
Enterprise
Value
($mm)
EV/
Revenue
EV/
EBITDA
Jul-01-2014 Pocket PlayLab Ltd. Anino PlayLab - - - -
Jul-01-2014 Gambit Hill and Knowlton AS Arctic Public Relations AS $0.6 - - -
Jul-01-2014 Dealertrack Technologies, Inc. (NasdaqGS:TRAK) ASR Pro, LLC - $17.0 - -
Jul-01-2014 Taxware, LLC Convey Compliance Systems, Inc. - - - -
Jul-01-2014 Razorfish LLC Crown Partners, LLC $20.0 - - -
Jul-01-2014 ITWP Acquisitions Limited Harris Interactive UK and Harris Interactive
AG and Harris Interactive SAS
- - - -
Jul-01-2014 Marlin Equity Partners, LLC Longview Solutions, Inc. - - - -
Jul-01-2014 Cinnober Financial Technology AB Markit Group Limited, BOAT Trade Reporting
Service
- - - -
Jul-01-2014 Zomato Media Private Limited Menu Mania Ltd - - - -
Jul-01-2014 Porini SpA NTT IS Srl - - - -
Jul-01-2014 Reed Technology and Information Services Inc. PatentCore - - - -
Jul-01-2014 Dropbox Inc. Predictive Edge - - - -
Jul-01-2014 HelpSystems, LLC RJS Software Systems, Inc. - - - -
Jul-01-2014 Google Inc. (NasdaqGS:GOOGL) Songza Media, Inc. - - - -
Jul-01-2014 Verivox GmbH TopTarif Internet GmbH - - - -
Jul-01-2014 Adknowledge, Inc. TriVu Media, Inc. - - - -
Jul-02-2014 DataBank IMX, LLC Advanced Data Systems, Inc. - - - -
Jul-02-2014 Zayo Colocation, Inc. Colo Facilities Atlanta, LLC - $52.5 - -
Jul-02-2014 Edelman Public Relations Worldwide Canada Inc. Devon Group Inc. - - - -
Jul-02-2014 OFF Line Corporation Digital Garage, Inc., Photozou Business - - - -
Jul-02-2014 Diversified Communications UK Ltd. Expo Management Limited - - - -
Jul-02-2014 Eniro Norge AS Idium AS $11.2 $5.4 0.5x -
Jul-02-2014 Facebook, Inc. (NasdaqGS:FB) LiveRail Inc. - $500.0 5.0x 33.3x
Jul-02-2014 EFactor Group Corp. (OTCPK:EFCT) Member Digital Ltd - $1.0 - -
Jul-02-2014 EPOSability Ltd. Mylivevision Limited - - - -
Jul-02-2014 Irvine Bartlett PR Powerhouse - - - -
Jul-02-2014 Spirent Communications Plc. (LSE:SPT) Radvision Ltd., Technology Business Unit - $25.0 - -
Jul-02-2014 Diverse IT Pty Ltd Red Ember Solutions Pty. Ltd. - - - -
Jul-02-2014 BRAINtrust Marketing + Communications Scott & Company - - - -
Jul-02-2014 OPT, Inc. (TSE:2389) StylingLife Holdings Inc., Minna No Make Business - - - -
Jul-02-2014 Microsoft Corporation (NasdaqGS:MSFT) SyntaxTree SARL - - - -
Jul-02-2014 Merkle Inc. The Rimm-Kaufman Group, LLC - - - -
Jul-02-2014 Accountor Holding Oy Tikon Oy - - - -
Jul-03-2014 Roper Industries Inc. (NYSE:ROP) FoodLink Holdings, Inc. - - - -
Jul-03-2014 Aristocrat Leisure Ltd. (ASX:ALL) Paltronics, Inc. - - - -
Jul-03-2014 One Media iP Group plc (AIM:OMIP) Telos Holdings Inc., Entire Rights to the Masters and Assets of the Music Catalogue Point Classics - $1.6 - -
Jul-03-2014 Xchanging PLC (LSE:XCH) Total Objects Limited - $36.0 - 42.0x
Jul-04-2014 Xchanging PLC (LSE:XCH) Agencyport Software Europe Limited $32.4 $109.9 3.4x 12.8x
Jul-04-2014 Enghouse Systems Limited (TSX:ESL) Basset AB - $9.4 - -
Jul-07-2014 Maltem Consulting Group SAS Alaloop SAS $2.0 - - -
Jul-07-2014 Euro Finmart Ltd. (BSE:531082) Alankit Technologies Limited - - - -
Jul-07-2014 WestBridge Fund Managers Limited bChannels Ltd. - $6.0 - -
Jul-07-2014 Publishers' Graphics, LLC Commercial Letter, Inc. - - - -
Jul-07-2014 Zero2Sixty Software, Inc. Conductiv Inc. - - - -
Jul-07-2014 - Espace Micro EBM, SARL - - - -
Jul-07-2014 Scangroup Limited (NASE:SCAN.O) Experiential Marketing Proprietary Limited $18.5 - - -
Jul-07-2014 HighJump Software HighJump Software Inc. - - - -
Jul-07-2014 Oculus VR, Inc. Jenkins Software LLC - - - -
Jul-07-2014 123.Net Inc. Michigan Internet Communications Association, Ltd., Customers - - - -
Jul-07-2014 Wi-Lan Inc. (TSX:WIN) Nokia Networks, Inc., Portfolio of Patents - - - -
Jul-07-2014 CM-CIC Investissement SA, SCR Open Wide S.A. $12.1 - - -
Acquirer
Copyright © 2014 by Software Equity Group, L.L.C., All Rights Reserved
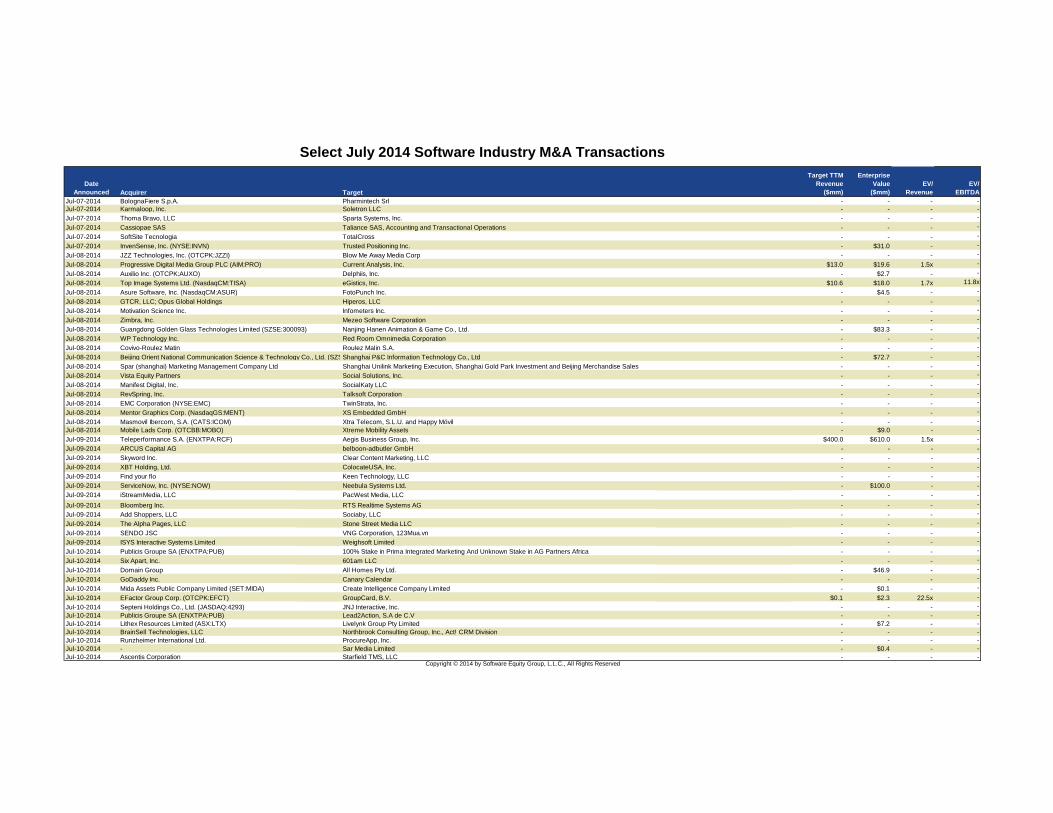
Select July 2014 Software Industry M&A Transactions
Date
Announced Target
Target TTM
Revenue
($mm)
Enterprise
Value
($mm)
EV/
Revenue
EV/
EBITDA
Jul-07-2014 BolognaFiere S.p.A. Pharmintech Srl - - - -
Jul-07-2014 Karmaloop, Inc. Soletron LLC - - - -
Jul-07-2014 Thoma Bravo, LLC Sparta Systems, Inc. - - - -
Jul-07-2014 Cassiopae SAS Taliance SAS, Accounting and Transactional Operations - - - -
Jul-07-2014 SoftSite Tecnologia TotalCross - - - -
Jul-07-2014 InvenSense, Inc. (NYSE:INVN) Trusted Positioning Inc. - $31.0 - -
Jul-08-2014 JZZ Technologies, Inc. (OTCPK:JZZI) Blow Me Away Media Corp - - - -
Jul-08-2014 Progressive Digital Media Group PLC (AIM:PRO) Current Analysis, Inc. $13.0 $19.6 1.5x -
Jul-08-2014 Auxilio Inc. (OTCPK:AUXO) Delphiis, Inc. - $2.7 - -
Jul-08-2014 Top Image Systems Ltd. (NasdaqCM:TISA) eGistics, Inc. $10.6 $18.0 1.7x 11.8x
Jul-08-2014 Asure Software, Inc. (NasdaqCM:ASUR) FotoPunch Inc. - $4.5 - -
Jul-08-2014 GTCR, LLC; Opus Global Holdings Hiperos, LLC - - - -
Jul-08-2014 Motivation Science Inc. Infometers Inc. - - - -
Jul-08-2014 Zimbra, Inc. Mezeo Software Corporation - - - -
Jul-08-2014 Guangdong Golden Glass Technologies Limited (SZSE:300093) Nanjing Hanen Animation & Game Co., Ltd. - $83.3 - -
Jul-08-2014 WP Technology Inc. Red Room Omnimedia Corporation - - - -
Jul-08-2014 Covivo-Roulez Matin Roulez Malin S.A. - - - -
Jul-08-2014 Beijing Orient National Communication Science & Technology Co., Ltd. (SZSE:300166)Shanghai P&C Information Technology Co., Ltd - $72.7 - -
Jul-08-2014 Spar (shanghai) Marketing Management Company Ltd Shanghai Unilink Marketing Execution, Shanghai Gold Park Investment and Beijing Merchandise Sales - - - -
Jul-08-2014 Vista Equity Partners Social Solutions, Inc. - - - -
Jul-08-2014 Manifest Digital, Inc. SocialKaty LLC - - - -
Jul-08-2014 RevSpring, Inc. Talksoft Corporation - - - -
Jul-08-2014 EMC Corporation (NYSE:EMC) TwinStrata, Inc. - - - -
Jul-08-2014 Mentor Graphics Corp. (NasdaqGS:MENT) XS Embedded GmbH - - - -
Jul-08-2014 Masmovil Ibercom, S.A. (CATS:ICOM) Xtra Telecom, S.L.U. and Happy Móvil - - - -
Jul-08-2014 Mobile Lads Corp. (OTCBB:MOBO) Xtreme Mobility Assets - $9.0 - -
Jul-09-2014 Teleperformance S.A. (ENXTPA:RCF) Aegis Business Group, Inc. $400.0 $610.0 1.5x -
Jul-09-2014 ARCUS Capital AG belboon-adbutler GmbH - - - -
Jul-09-2014 Skyword Inc. Clear Content Marketing, LLC - - - -
Jul-09-2014 XBT Holding, Ltd. ColocateUSA, Inc. - - - -
Jul-09-2014 Find your flo Keen Technology, LLC - - - -
Jul-09-2014 ServiceNow, Inc. (NYSE:NOW) Neebula Systems Ltd. - $100.0 - -
Jul-09-2014 iStreamMedia, LLC PacWest Media, LLC - - - -
Jul-09-2014 Bloomberg Inc. RTS Realtime Systems AG - - - -
Jul-09-2014 Add Shoppers, LLC Sociaby, LLC - - - -
Jul-09-2014 The Alpha Pages, LLC Stone Street Media LLC - - - -
Jul-09-2014 SENDO JSC VNG Corporation, 123Mua.vn - - - -
Jul-09-2014 ISYS Interactive Systems Limited Weighsoft Limited - - - -
Jul-10-2014 Publicis Groupe SA (ENXTPA:PUB) 100% Stake in Prima Integrated Marketing And Unknown Stake in AG Partners Africa - - - -
Jul-10-2014 Six Apart, Inc. 601am LLC - - - -
Jul-10-2014 Domain Group All Homes Pty Ltd. - $46.9 - -
Jul-10-2014 GoDaddy Inc. Canary Calendar - - - -
Jul-10-2014 Mida Assets Public Company Limited (SET:MIDA) Create Intelligence Company Limited - $0.1 - -
Jul-10-2014 EFactor Group Corp. (OTCPK:EFCT) GroupCard, B.V. $0.1 $2.3 22.5x -
Jul-10-2014 Septeni Holdings Co., Ltd. (JASDAQ:4293) JNJ Interactive, Inc. - - - -
Jul-10-2014 Publicis Groupe SA (ENXTPA:PUB) Lead2Action, S.A de C.V - - - -
Jul-10-2014 Lithex Resources Limited (ASX:LTX) Livelynk Group Pty Limited - $7.2 - -
Jul-10-2014 BrainSell Technologies, LLC Northbrook Consulting Group, Inc., Act! CRM Division - - - -
Jul-10-2014 Runzheimer International Ltd. ProcureApp, Inc. - - - -
Jul-10-2014 - Sar Media Limited - $0.4 - -
Jul-10-2014 Ascentis Corporation Starfield TMS, LLC - - - -
Acquirer
Copyright © 2014 by Software Equity Group, L.L.C., All Rights Reserved
Select July 2014 Software Industry M&A Transactions
Date
Announced Target
Target TTM
Revenue
($mm)
Enterprise
Value
($mm)
EV/
Revenue
EV/
EBITDA
Jul-10-2014 Wantering Styledon.com, LLC - - - -
Jul-10-2014 ewe agency Whole9Yards Limited - - - -
Jul-10-2014 Elite Comms Group Wi-Manx Limited - - - -
Jul-11-2014 Forexware, LLC Boston Technologies, Inc. - - - -
Jul-11-2014 PMCS GmbH & Co. KG CATENIC AG - - - -
Jul-11-2014 Prisma Média SA Food Reporter SAS - - - -
Jul-11-2014 Microsoft Corporation (NasdaqGS:MSFT) InMage Systems, Inc. - - - -
Jul-11-2014 Airtasker Pty Ltd Occasional Butler Pty Ltd - - - -
Jul-11-2014 Yahoo! Inc. (NasdaqGS:YHOO) RayV Inc. - - - -
Jul-11-2014 Salesforce.com, Inc (NYSE:CRM) RelateIQ, Inc. - $391.0 - -
Jul-11-2014 HgCapital Sequel Business Solutions Limited - - - -
Jul-11-2014 Dassault Systemes SA (ENXTPA:DSY) SIMPACK AG - - - -
Jul-11-2014 ShopInvest Société Bijourama - - - -
Jul-11-2014 Vopia, Inc. (OTCBB:VOPA) Vopia.com - - - -
Jul-11-2014 Enthrive Inc. ZipLocal Inc. (TSXV:ZIP.H) - - - -
Jul-12-2014 Eventful Solutions Limited Dunkleys Shows Ltd - - - -
Jul-14-2014 Collections Solutions Software, Inc. 123Comply, LLC - - - -
Jul-14-2014 Kohlberg Kravis Roberts & Co. L.P. (NYSE:KKR) 49% stake in Scout24 Schweiz AG and 49% stake in Omnimedia AG - - - -
Jul-14-2014 Verdane Capital A Stake in Streaming Media AS, Eniram Ltd., Napatech A/S, CFEngine AS and Arkex Ltd. - - - -
Jul-14-2014 Ecosia GmbH Bloson.com - - - -
Jul-14-2014 Barker/DZP BrandWire NYC - - - -
Jul-14-2014 Scribble Technologies Inc. CoverItLive Inc. - - - -
Jul-14-2014 AT&T, Inc. (NYSE:T); The Chernin Group, LLC Creativebug Inc. - $10.0 - -
Jul-14-2014 Health Insurance Innovations, Inc. (NasdaqGM:HIIQ) HealthPocket, Inc. - $33.6 - -
Jul-14-2014 Classnk Nippon Kaiji Kyokai Helm Operations - - - -
Jul-14-2014 Envestnet Retirement Solutions, LLC Klein Decisions, Inc. - - - -
Jul-14-2014 ByteGrid Holdings LLC NetRiver, Inc. - - - -
Jul-14-2014 LinkedIn Corporation (NYSE:LNKD) Newsle Inc. - - - -
Jul-14-2014 mBlox, Inc. NextGen Mobile Ltd. - - - -
Jul-14-2014 Bridgepoint Development Capital Phlexglobal Ltd. $26.2 $71.8 2.8x 9.3x
Jul-14-2014 Comcast Corporation (NasdaqGS:CMCS.A) PowerCloud Systems, Inc. - - - -
Jul-14-2014 Lexalytics, Inc. Semantria LLC - - - -
Jul-14-2014 Trimble Navigation Limited (NasdaqGS:TRMB) The Omega Group, Inc. - - - -
Jul-14-2014 Palace Resources Limited (ASX:PXR) TikForce Pty Ltd - $2.1 - -
Jul-14-2014 mBlox, Inc. Zoove Corp. - - - -
Jul-15-2014 Fatfish Internet Group Ltd (ASX:FFG) 90% in Kensington Ventures Pte Ltd and 92.5% in Vdancer Pte Ltd - - - -
Jul-15-2014 MAQUET GmbH Cetrea A/S $4.4 $16.1 3.7x -
Jul-15-2014 Monotype Imaging Holdings Inc. (NasdaqGS:TYPE) FontShop International GmbH - $13.0 - -
Jul-15-2014 TellApart, Inc. Freshplum, Inc. - - - -
Jul-15-2014 Discount Coupons Corporation (OTCPK:DCOU) Half Price San Diego, LLC - - - -
Jul-15-2014 GRUPA IQS Sp. z o.o. Interaktywny Instytut Badan Rynkowych Sp. z o.o. - $0.4 - -
Jul-15-2014 Equity Administration Solutions, Inc. Option Admin, Inc. - - - -
Jul-15-2014 JUST EAT plc (LSE:JE.) Orogo Limited - - - -
Jul-15-2014 PT Rajawali Corporation PT Fortune Indonesia Tbk (JKSE:FORU) $37.1 $10.9 0.3x 11.6x
Jul-15-2014 I-5 Publishing LLC SAY Media, Inc., Dogster and Catster Web Properties - - - -
Jul-15-2014 Solar Investments SolarTown, LLC, SolarPanelTalk - - - -
Jul-15-2014 Jízdomat.cz, s.r.o. Stopar.sk - - - -
Jul-15-2014 DTLA Advisors LLC The H&H Company - - - -
Jul-15-2014 Chef, Inc. Tower3 Inc. - - - -
Jul-15-2014 - Valpak of Southeast Wisconsin - - - -
Jul-15-2014 Intercept Minerals Ltd (ASX:IZM) XTV, inc. - $0.3 - -
Acquirer
Copyright © 2014 by Software Equity Group, L.L.C., All Rights Reserved
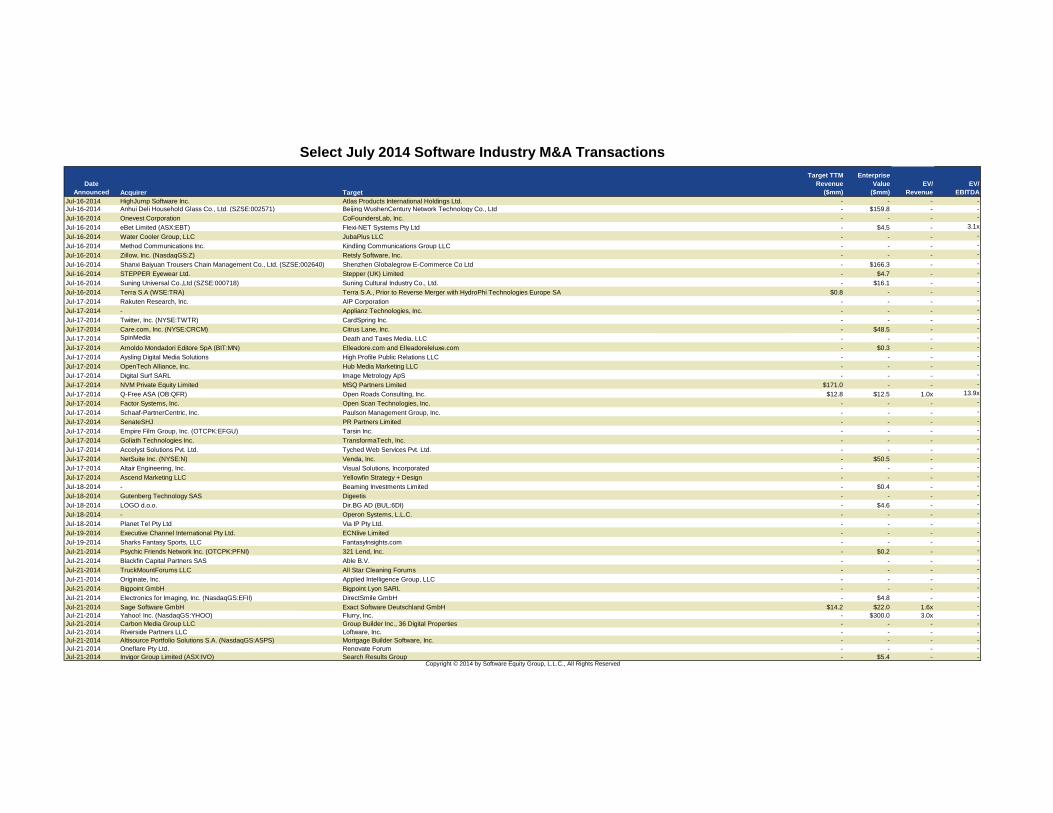
Select July 2014 Software Industry M&A Transactions
Date
Announced Target
Target TTM
Revenue
($mm)
Enterprise
Value
($mm)
EV/
Revenue
EV/
EBITDA
Jul-16-2014 HighJump Software Inc. Atlas Products International Holdings Ltd. - - - -
Jul-16-2014 Anhui Deli Household Glass Co., Ltd. (SZSE:002571) Beijing WushenCentury Network Technology Co., Ltd - $159.8 - -
Jul-16-2014 Onevest Corporation CoFoundersLab, Inc. - - - -
Jul-16-2014 eBet Limited (ASX:EBT) Flexi-NET Systems Pty Ltd - $4.5 - 3.1x
Jul-16-2014 Water Cooler Group, LLC JubaPlus LLC - - - -
Jul-16-2014 Method Communications Inc. Kindling Communications Group LLC - - - -
Jul-16-2014 Zillow, Inc. (NasdaqGS:Z) Retsly Software, Inc. - - - -
Jul-16-2014 Shanxi Baiyuan Trousers Chain Management Co., Ltd. (SZSE:002640) Shenzhen Globalegrow E-Commerce Co Ltd - $166.3 - -
Jul-16-2014 STEPPER Eyewear Ltd. Stepper (UK) Limited - $4.7 - -
Jul-16-2014 Suning Universal Co.,Ltd (SZSE:000718) Suning Cultural Industry Co., Ltd. - $16.1 - -
Jul-16-2014 Terra S.A (WSE:TRA) Terra S.A., Prior to Reverse Merger with HydroPhi Technologies Europe SA $0.8 - - -
Jul-17-2014 Rakuten Research, Inc. AIP Corporation - - - -
Jul-17-2014 - Applianz Technologies, Inc. - - - -
Jul-17-2014 Twitter, Inc. (NYSE:TWTR) CardSpring Inc. - - - -
Jul-17-2014 Care.com, Inc. (NYSE:CRCM) Citrus Lane, Inc. - $48.5 - -
Jul-17-2014 SpinMedia Death and Taxes Media, LLC - - - -
Jul-17-2014 Arnoldo Mondadori Editore SpA (BIT:MN) Elleadore.com and Elleadoreleluxe.com - $0.3 - -
Jul-17-2014 Aysling Digital Media Solutions High Profile Public Relations LLC - - - -
Jul-17-2014 OpenTech Alliance, Inc. Hub Media Marketing LLC - - - -
Jul-17-2014 Digital Surf SARL Image Metrology ApS - - - -
Jul-17-2014 NVM Private Equity Limited MSQ Partners Limited $171.0 - - -
Jul-17-2014 Q-Free ASA (OB:QFR) Open Roads Consulting, Inc. $12.8 $12.5 1.0x 13.9x
Jul-17-2014 Factor Systems, Inc. Open Scan Technologies, Inc. - - - -
Jul-17-2014 Schaaf-PartnerCentric, Inc. Paulson Management Group, Inc. - - - -
Jul-17-2014 SenateSHJ PR Partners Limited - - - -
Jul-17-2014 Empire Film Group, Inc. (OTCPK:EFGU) Tarsin Inc. - - - -
Jul-17-2014 Goliath Technologies Inc. TransformaTech, Inc. - - - -
Jul-17-2014 Accelyst Solutions Pvt. Ltd. Tyched Web Services Pvt. Ltd. - - - -
Jul-17-2014 NetSuite Inc. (NYSE:N) Venda, Inc. - $50.5 - -
Jul-17-2014 Altair Engineering, Inc. Visual Solutions, Incorporated - - - -
Jul-17-2014 Ascend Marketing LLC Yellowfin Strategy + Design - - - -
Jul-18-2014 - Beaming Investments Limited - $0.4 - -
Jul-18-2014 Gutenberg Technology SAS Digeetis - - - -
Jul-18-2014 LOGO d.o.o. Dir.BG AD (BUL:6DI) - $4.6 - -
Jul-18-2014 - Operon Systems, L.L.C. - - - -
Jul-18-2014 Planet Tel Pty Ltd Via IP Pty Ltd. - - - -
Jul-19-2014 Executive Channel International Pty Ltd. ECNlive Limited - - - -
Jul-19-2014 Sharks Fantasy Sports, LLC FantasyInsights.com - - - -
Jul-21-2014 Psychic Friends Network Inc. (OTCPK:PFNI) 321 Lend, Inc. - $0.2 - -
Jul-21-2014 Blackfin Capital Partners SAS Able B.V. - - - -
Jul-21-2014 TruckMountForums LLC All Star Cleaning Forums - - - -
Jul-21-2014 Originate, Inc. Applied Intelligence Group, LLC - - - -
Jul-21-2014 Bigpoint GmbH Bigpoint Lyon SARL - - - -
Jul-21-2014 Electronics for Imaging, Inc. (NasdaqGS:EFII) DirectSmile GmbH - $4.8 - -
Jul-21-2014 Sage Software GmbH Exact Software Deutschland GmbH $14.2 $22.0 1.6x -
Jul-21-2014 Yahoo! Inc. (NasdaqGS:YHOO) Flurry, Inc. - $300.0 3.0x -
Jul-21-2014 Carbon Media Group LLC Group Builder Inc., 36 Digital Properties - - - -
Jul-21-2014 Riverside Partners LLC Loftware, Inc. - - - -
Jul-21-2014 Altisource Portfolio Solutions S.A. (NasdaqGS:ASPS) Mortgage Builder Software, Inc. - - - -
Jul-21-2014 Oneflare Pty Ltd. Renovate Forum - - - -
Jul-21-2014 Invigor Group Limited (ASX:IVO) Search Results Group - $5.4 - -
Acquirer
Copyright © 2014 by Software Equity Group, L.L.C., All Rights Reserved
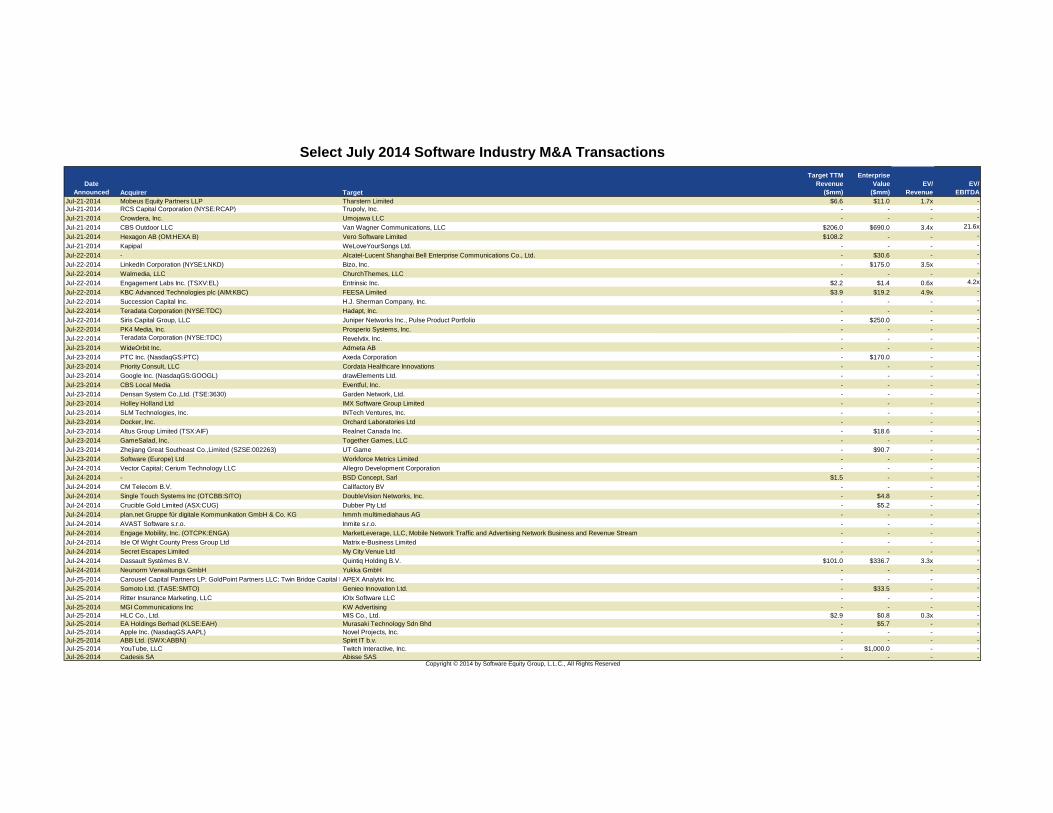
Select July 2014 Software Industry M&A Transactions
Date
Announced Target
Target TTM
Revenue
($mm)
Enterprise
Value
($mm)
EV/
Revenue
EV/
EBITDA
Jul-21-2014 Mobeus Equity Partners LLP Tharstern Limited $6.6 $11.0 1.7x -
Jul-21-2014 RCS Capital Corporation (NYSE:RCAP) Trupoly, Inc. - - - -
Jul-21-2014 Crowdera, Inc. Umojawa LLC - - - -
Jul-21-2014 CBS Outdoor LLC Van Wagner Communications, LLC $206.0 $690.0 3.4x 21.6x
Jul-21-2014 Hexagon AB (OM:HEXA B) Vero Software Limited $108.2 - - -
Jul-21-2014 Kapipal WeLoveYourSongs Ltd. - - - -
Jul-22-2014 - Alcatel-Lucent Shanghai Bell Enterprise Communications Co., Ltd. - $30.6 - -
Jul-22-2014 LinkedIn Corporation (NYSE:LNKD) Bizo, Inc. - $175.0 3.5x -
Jul-22-2014 Walmedia, LLC ChurchThemes, LLC - - - -
Jul-22-2014 Engagement Labs Inc. (TSXV:EL) Entrinsic Inc. $2.2 $1.4 0.6x 4.2x
Jul-22-2014 KBC Advanced Technologies plc (AIM:KBC) FEESA Limited $3.9 $19.2 4.9x -
Jul-22-2014 Succession Capital Inc. H.J. Sherman Company, Inc. - - - -
Jul-22-2014 Teradata Corporation (NYSE:TDC) Hadapt, Inc. - - - -
Jul-22-2014 Siris Capital Group, LLC Juniper Networks Inc., Pulse Product Portfolio - $250.0 - -
Jul-22-2014 PK4 Media, Inc. Prosperio Systems, Inc. - - - -
Jul-22-2014 Teradata Corporation (NYSE:TDC) Revelytix, Inc. - - - -
Jul-23-2014 WideOrbit Inc. Admeta AB - - - -
Jul-23-2014 PTC Inc. (NasdaqGS:PTC) Axeda Corporation - $170.0 - -
Jul-23-2014 Priority Consult, LLC Cordata Healthcare Innovations - - - -
Jul-23-2014 Google Inc. (NasdaqGS:GOOGL) drawElements Ltd. - - - -
Jul-23-2014 CBS Local Media Eventful, Inc. - - - -
Jul-23-2014 Densan System Co.,Ltd. (TSE:3630) Garden Network, Ltd. - - - -
Jul-23-2014 Holley Holland Ltd IMX Software Group Limited - - - -
Jul-23-2014 SLM Technologies, Inc. INTech Ventures, Inc. - - - -
Jul-23-2014 Docker, Inc. Orchard Laboratories Ltd - - - -
Jul-23-2014 Altus Group Limited (TSX:AIF) Realnet Canada Inc. - $18.6 - -
Jul-23-2014 GameSalad, Inc. Together Games, LLC - - - -
Jul-23-2014 Zhejiang Great Southeast Co.,Limited (SZSE:002263) UT Game - $90.7 - -
Jul-23-2014 Software (Europe) Ltd Workforce Metrics Limited - - - -
Jul-24-2014 Vector Capital; Cerium Technology LLC Allegro Development Corporation - - - -
Jul-24-2014 - BSD Concept, Sarl $1.5 - - -
Jul-24-2014 CM Telecom B.V. Callfactory BV - - - -
Jul-24-2014 Single Touch Systems Inc (OTCBB:SITO) DoubleVision Networks, Inc. - $4.8 - -
Jul-24-2014 Crucible Gold Limited (ASX:CUG) Dubber Pty Ltd - $5.2 - -
Jul-24-2014 plan.net Gruppe für digitale Kommunikation GmbH & Co. KG hmmh multimediahaus AG - - - -
Jul-24-2014 AVAST Software s.r.o. Inmite s.r.o. - - - -
Jul-24-2014 Engage Mobility, Inc. (OTCPK:ENGA) MarketLeverage, LLC, Mobile Network Traffic and Advertising Network Business and Revenue Stream - - - -
Jul-24-2014 Isle Of Wight County Press Group Ltd Matrix e-Business Limited - - - -
Jul-24-2014 Secret Escapes Limited My City Venue Ltd - - - -
Jul-24-2014 Dassault Systèmes B.V. Quintiq Holding B.V. $101.0 $336.7 3.3x -
Jul-24-2014 Neunorm Verwaltungs GmbH Yukka GmbH - - - -
Jul-25-2014 Carousel Capital Partners LP; GoldPoint Partners LLC; Twin Bridge Capital PartnersAPEX Analytix Inc. - - - -
Jul-25-2014 Somoto Ltd. (TASE:SMTO) Genieo Innovation Ltd. - $33.5 - -
Jul-25-2014 Ritter Insurance Marketing, LLC IOIx Software LLC - - - -
Jul-25-2014 MGI Communications Inc KW Advertising - - - -
Jul-25-2014 HLC Co., Ltd. MIS Co., Ltd. $2.9 $0.8 0.3x -
Jul-25-2014 EA Holdings Berhad (KLSE:EAH) Murasaki Technology Sdn Bhd - $5.7 - -
Jul-25-2014 Apple Inc. (NasdaqGS:AAPL) Novel Projects, Inc. - - - -
Jul-25-2014 ABB Ltd. (SWX:ABBN) Spirit IT b.v. - - - -
Jul-25-2014 YouTube, LLC Twitch Interactive, Inc. - $1,000.0 - -
Jul-26-2014 Cadesis SA Abisse SAS - - - -
Acquirer
Copyright © 2014 by Software Equity Group, L.L.C., All Rights Reserved
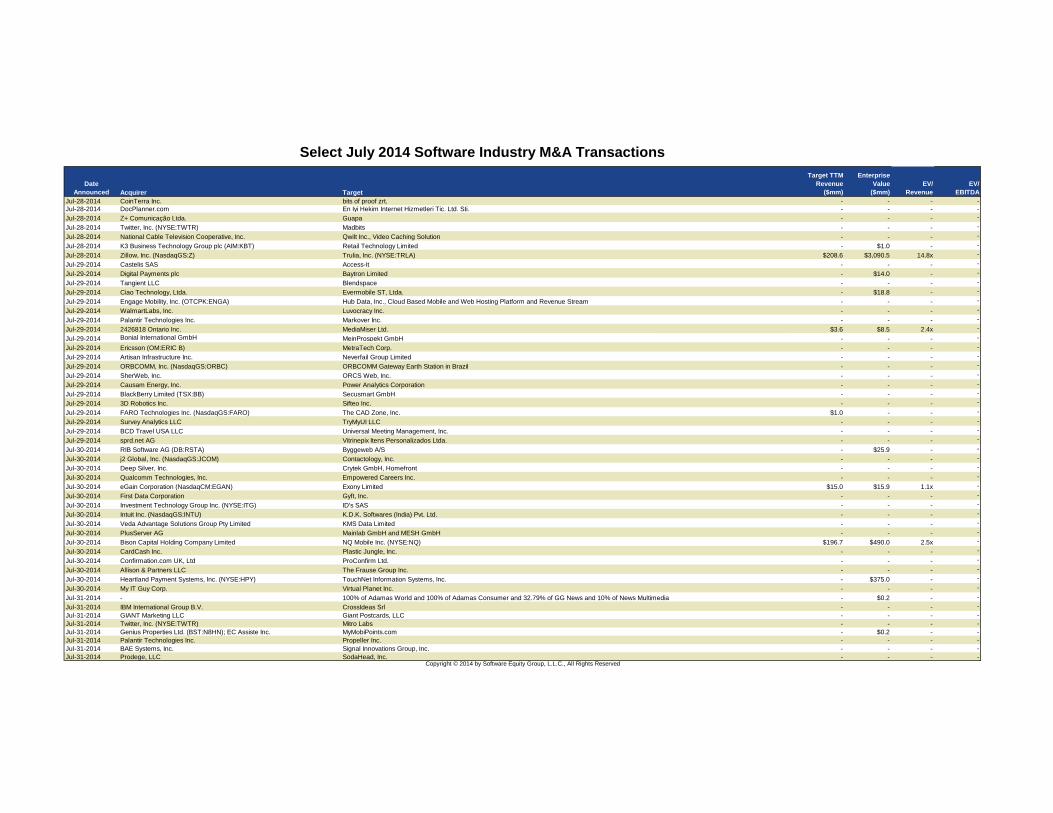
Select July 2014 Software Industry M&A Transactions
Date
Announced Target
Target TTM
Revenue
($mm)
Enterprise
Value
($mm)
EV/
Revenue
EV/
EBITDA
Jul-28-2014 CoinTerra Inc. bits of proof zrt. - - - -
Jul-28-2014 DocPlanner.com En Iyi Hekim Internet Hizmetleri Tic. Ltd. Sti. - - - -
Jul-28-2014 Z+ Comunicação Ltda. Guapa - - - -
Jul-28-2014 Twitter, Inc. (NYSE:TWTR) Madbits - - - -
Jul-28-2014 National Cable Television Cooperative, Inc. Qwilt Inc., Video Caching Solution - - - -
Jul-28-2014 K3 Business Technology Group plc (AIM:KBT) Retail Technology Limited - $1.0 - -
Jul-28-2014 Zillow, Inc. (NasdaqGS:Z) Trulia, Inc. (NYSE:TRLA) $208.6 $3,090.5 14.8x -
Jul-29-2014 Castelis SAS Access-It - - - -
Jul-29-2014 Digital Payments plc Baytron Limited - $14.0 - -
Jul-29-2014 Tangient LLC Blendspace - - - -
Jul-29-2014 Ciao Technology, Ltda. Evermobile ST, Ltda. - $18.8 - -
Jul-29-2014 Engage Mobility, Inc. (OTCPK:ENGA) Hub Data, Inc., Cloud Based Mobile and Web Hosting Platform and Revenue Stream - - - -
Jul-29-2014 WalmartLabs, Inc. Luvocracy Inc. - - - -
Jul-29-2014 Palantir Technologies Inc. Markover Inc. - - - -
Jul-29-2014 2426818 Ontario Inc. MediaMiser Ltd. $3.6 $8.5 2.4x -
Jul-29-2014 Bonial International GmbH MeinProspekt GmbH - - - -
Jul-29-2014 Ericsson (OM:ERIC B) MetraTech Corp. - - - -
Jul-29-2014 Artisan Infrastructure Inc. Neverfail Group Limited - - - -
Jul-29-2014 ORBCOMM, Inc. (NasdaqGS:ORBC) ORBCOMM Gateway Earth Station in Brazil - - - -
Jul-29-2014 SherWeb, Inc. ORCS Web, Inc. - - - -
Jul-29-2014 Causam Energy, Inc. Power Analytics Corporation - - - -
Jul-29-2014 BlackBerry Limited (TSX:BB) Secusmart GmbH - - - -
Jul-29-2014 3D Robotics Inc. Sifteo Inc. - - - -
Jul-29-2014 FARO Technologies Inc. (NasdaqGS:FARO) The CAD Zone, Inc. $1.0 - - -
Jul-29-2014 Survey Analytics LLC TryMyUI LLC - - - -
Jul-29-2014 BCD Travel USA LLC Universal Meeting Management, Inc. - - - -
Jul-29-2014 sprd.net AG Vitrinepix Itens Personalizados Ltda. - - - -
Jul-30-2014 RIB Software AG (DB:RSTA) Byggeweb A/S - $25.9 - -
Jul-30-2014 j2 Global, Inc. (NasdaqGS:JCOM) Contactology, Inc. - - - -
Jul-30-2014 Deep Silver, Inc. Crytek GmbH, Homefront - - - -
Jul-30-2014 Qualcomm Technologies, Inc. Empowered Careers Inc. - - - -
Jul-30-2014 eGain Corporation (NasdaqCM:EGAN) Exony Limited $15.0 $15.9 1.1x -
Jul-30-2014 First Data Corporation Gyft, Inc. - - - -
Jul-30-2014 Investment Technology Group Inc. (NYSE:ITG) ID's SAS - - - -
Jul-30-2014 Intuit Inc. (NasdaqGS:INTU) K.D.K. Softwares (India) Pvt. Ltd. - - - -
Jul-30-2014 Veda Advantage Solutions Group Pty Limited KMS Data Limited - - - -
Jul-30-2014 PlusServer AG Mainlab GmbH and MESH GmbH - - - -
Jul-30-2014 Bison Capital Holding Company Limited NQ Mobile Inc. (NYSE:NQ) $196.7 $490.0 2.5x -
Jul-30-2014 CardCash Inc. Plastic Jungle, Inc. - - - -
Jul-30-2014 Confirmation.com UK, Ltd ProConfirm Ltd. - - - -
Jul-30-2014 Allison & Partners LLC The Frause Group Inc. - - - -
Jul-30-2014 Heartland Payment Systems, Inc. (NYSE:HPY) TouchNet Information Systems, Inc. - $375.0 - -
Jul-30-2014 My IT Guy Corp. Virtual Planet Inc. - - - -
Jul-31-2014 - 100% of Adamas World and 100% of Adamas Consumer and 32.79% of GG News and 10% of News Multimedia - $0.2 - -
Jul-31-2014 IBM International Group B.V. CrossIdeas Srl - - - -
Jul-31-2014 GIANT Marketing LLC Giant Postcards, LLC - - - -
Jul-31-2014 Twitter, Inc. (NYSE:TWTR) Mitro Labs - - - -
Jul-31-2014 Genius Properties Ltd. (BST:N8HN); EC Assiste Inc. MyMobiPoints.com - $0.2 - -
Jul-31-2014 Palantir Technologies Inc. Propeller Inc. - - - -
Jul-31-2014 BAE Systems, Inc. Signal Innovations Group, Inc. - - - -
Jul-31-2014 Prodege, LLC SodaHead, Inc. - - - -
Acquirer
Copyright © 2014 by Software Equity Group, L.L.C., All Rights Reserved
Select July 2014 Software Industry M&A Transactions
Date
Announced Target
Target TTM
Revenue
($mm)
Enterprise
Value
($mm)
EV/
Revenue
EV/
EBITDA
Jul-31-2014 Marimedia Ltd. (AIM:MARI) Taptica, Inc. - - - -
Jul-31-2014 Oracle Corporation (NYSE:ORCL) TOA Technologies, Inc. - - - -
Jul-31-2014 Web.com Group, Inc. (NasdaqGS:WWWW) Touch Local Limited - $18.8 - -
Jul-31-2014 Shaw Communications, Inc. (TSX:SJR.B) ViaWest, Inc. - $1,200.0 - 13.0x
Jul-31-2014 Start Today Co., Ltd. (TSE:3092) Yappa Corporation $2.0 $10.2 5.0x -
Jul-31-2014 OpenTable, Inc. Copilot Labs Inc - - - -
Jul-31-2014 ReelTime Media Limited Eleuthera Group Pty Ltd and HOT CLICK MEDIA and THE DEBT GUYS - - - -
Jul-31-2014 - Nayoki Interactive Advertising GmbH - - - -
Jul-31-2014 Discount Coupons Corporation (OTCPK:DCOU) Conejo Deals, Inc. - $1.3 - -
Jul-31-2014 JRJ Group; TOMS Capital; 76 West Holdings LLC Demica Limited - - - -
Jul-31-2014 Enumeral Biomedical Holdings, Inc. (OTCBB:ENUM) Enumeral Biomedical Holdings, Inc., Prior to Reverse Merger with Enumeral Biomedical Corp. - - - -
Jul-31-2014 DNA Crypto Corp. Lynx Mining LLC - - - -
Jul-31-2014 Bartercard Australia Pty Ltd BartercardUSA - $0.1 - -
Jul-31-2014 Solium Capital Inc. (TSX:SUM) Executive Trading Solutions, LLC - - - -
Jul-31-2014 Medscape, LLC TheraSim, Inc. - - - -
Jul-31-2014 High Rock Studios, Inc. Pylot Studios, LLC - - - -
Jul-31-2014 Planview, Inc. Projectplace International AB - - - -
Jul-31-2014 SQAD Inc. Workhorse Software Company - - - -
Jul-31-2014 Goldstar North American Mining, Inc. XFormity Technologies, Inc. (OTCPK:XFMY) - - - -
Jul-31-2014 DigitasLBi Liquorice Africa Advertising (Pty) Ltd. $4.4 $7.5 1.7x -
Jul-31-2014 Groupe France Agricole SAS Vitisphere SA - - - -
Acquirer
Copyright © 2014 by Software Equity Group, L.L.C., All Rights Reserved
Copyright © 2014 by Software Equity Group, L.L.C., All Rights Reserved
SEG Software Index
Select Software Industry M&A Transactions
SEG SaaS Index
SEG Internet Index
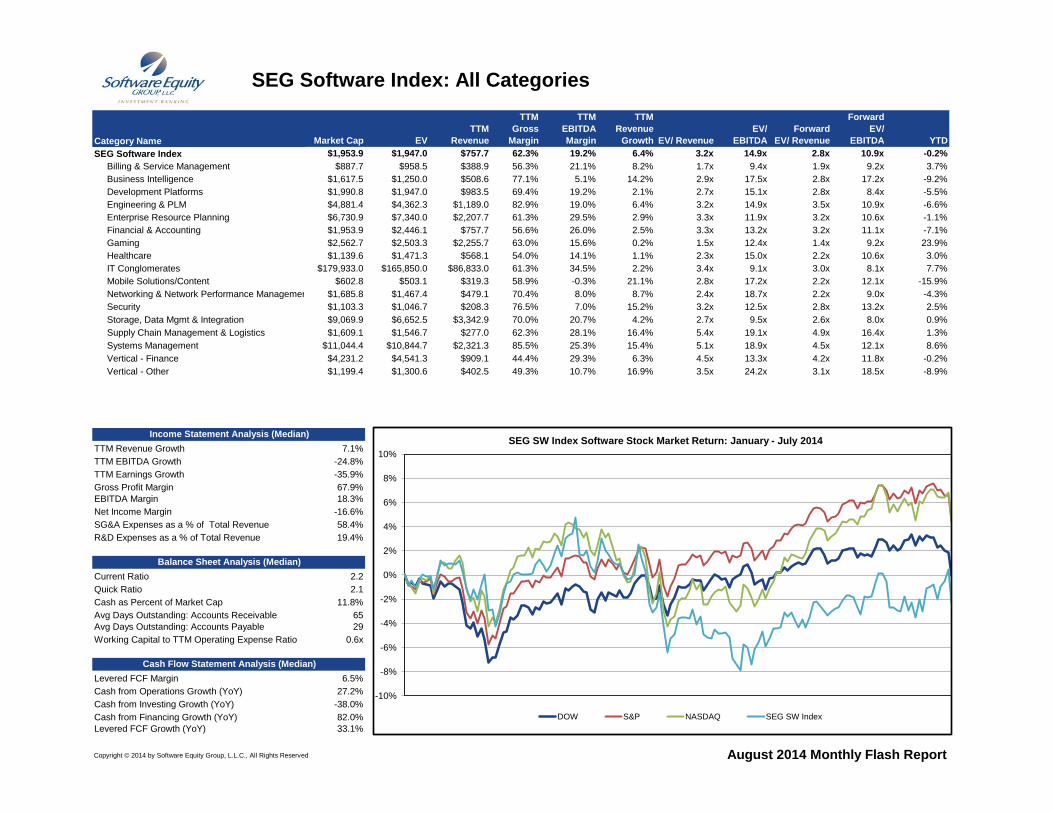
SEG Software Index: All Categories
Market Cap EV
TTM
Revenue
TTM
Gross
Margin
TTM
EBITDA
Margin
TTM
Revenue
Growth EV/ Revenue
EV/
EBITDA
Forward
EV/ Revenue
Forward
EV/
EBITDA YTD
SEG Software Index $1,953.9 $1,947.0 $757.7 62.3% 19.2% 6.4% 3.2x 14.9x 2.8x 10.9x -0.2%
Billing & Service Management $887.7 $958.5 $388.9 56.3% 21.1% 8.2% 1.7x 9.4x 1.9x 9.2x 3.7%
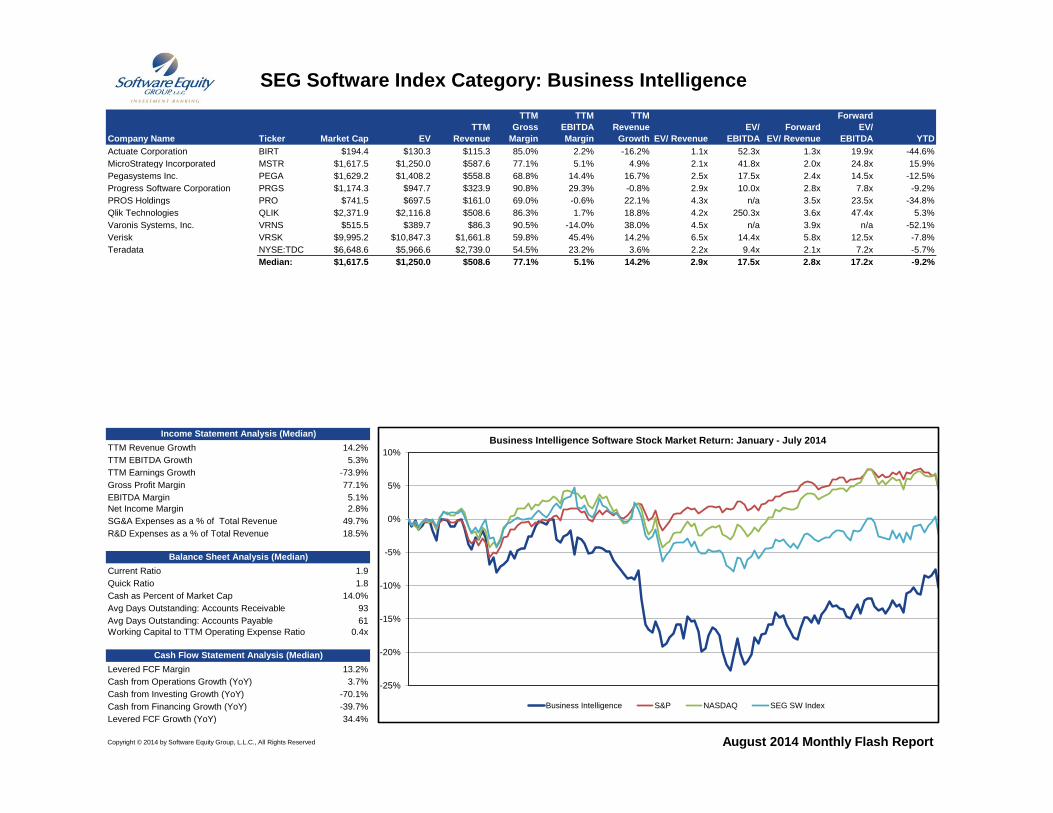
Business Intelligence $1,617.5 $1,250.0 $508.6 77.1% 5.1% 14.2% 2.9x 17.5x 2.8x 17.2x -9.2%
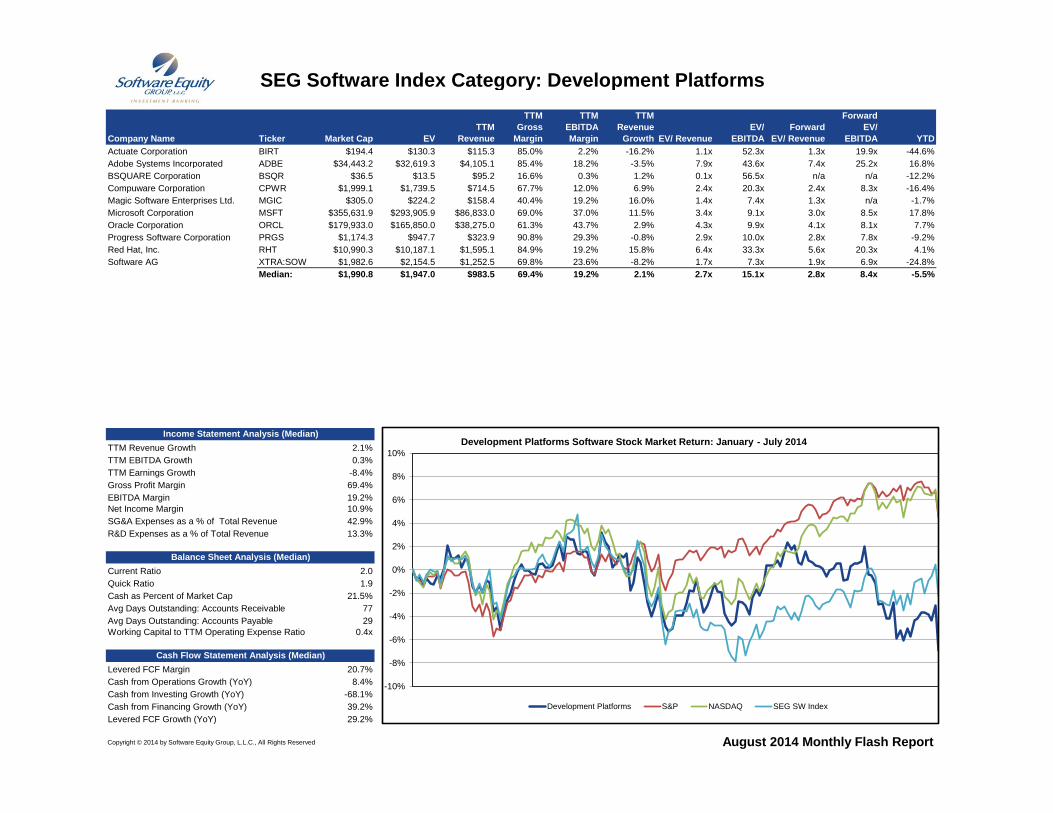
Development Platforms $1,990.8 $1,947.0 $983.5 69.4% 19.2% 2.1% 2.7x 15.1x 2.8x 8.4x -5.5%
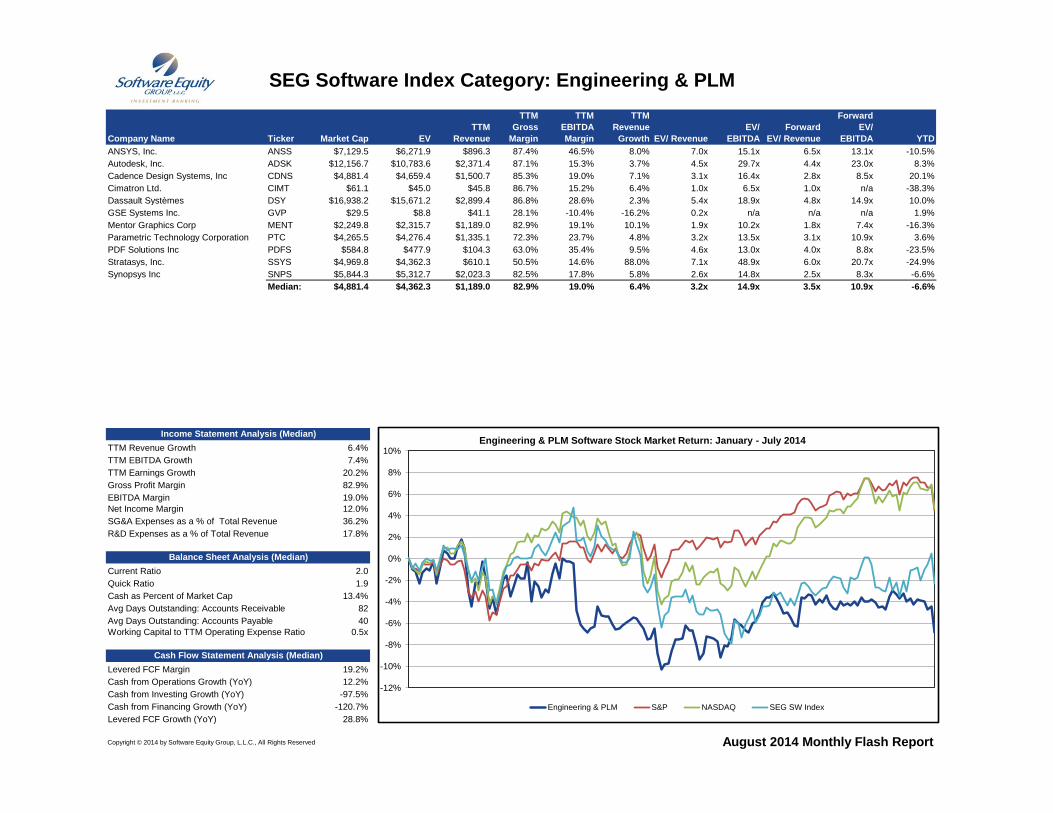
Engineering & PLM $4,881.4 $4,362.3 $1,189.0 82.9% 19.0% 6.4% 3.2x 14.9x 3.5x 10.9x -6.6%
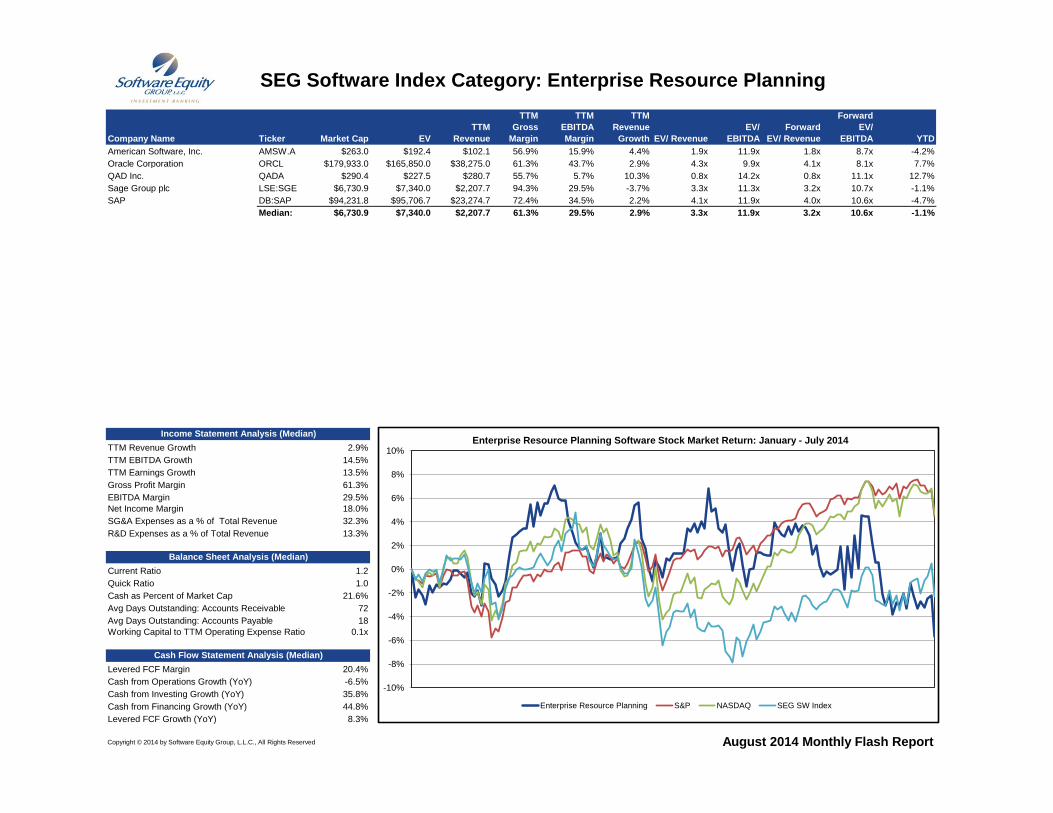
Enterprise Resource Planning $6,730.9 $7,340.0 $2,207.7 61.3% 29.5% 2.9% 3.3x 11.9x 3.2x 10.6x -1.1%
Financial & Accounting $1,953.9 $2,446.1 $757.7 56.6% 26.0% 2.5% 3.3x 13.2x 3.2x 11.1x -7.1%
Gaming $2,562.7 $2,503.3 $2,255.7 63.0% 15.6% 0.2% 1.5x 12.4x 1.4x 9.2x 23.9%
Healthcare $1,139.6 $1,471.3 $568.1 54.0% 14.1% 1.1% 2.3x 15.0x 2.2x 10.6x 3.0%
IT Conglomerates $179,933.0 $165,850.0 $86,833.0 61.3% 34.5% 2.2% 3.4x 9.1x 3.0x 8.1x 7.7%
Mobile Solutions/Content $602.8 $503.1 $319.3 58.9% -0.3% 21.1% 2.8x 17.2x 2.2x 12.1x -15.9%
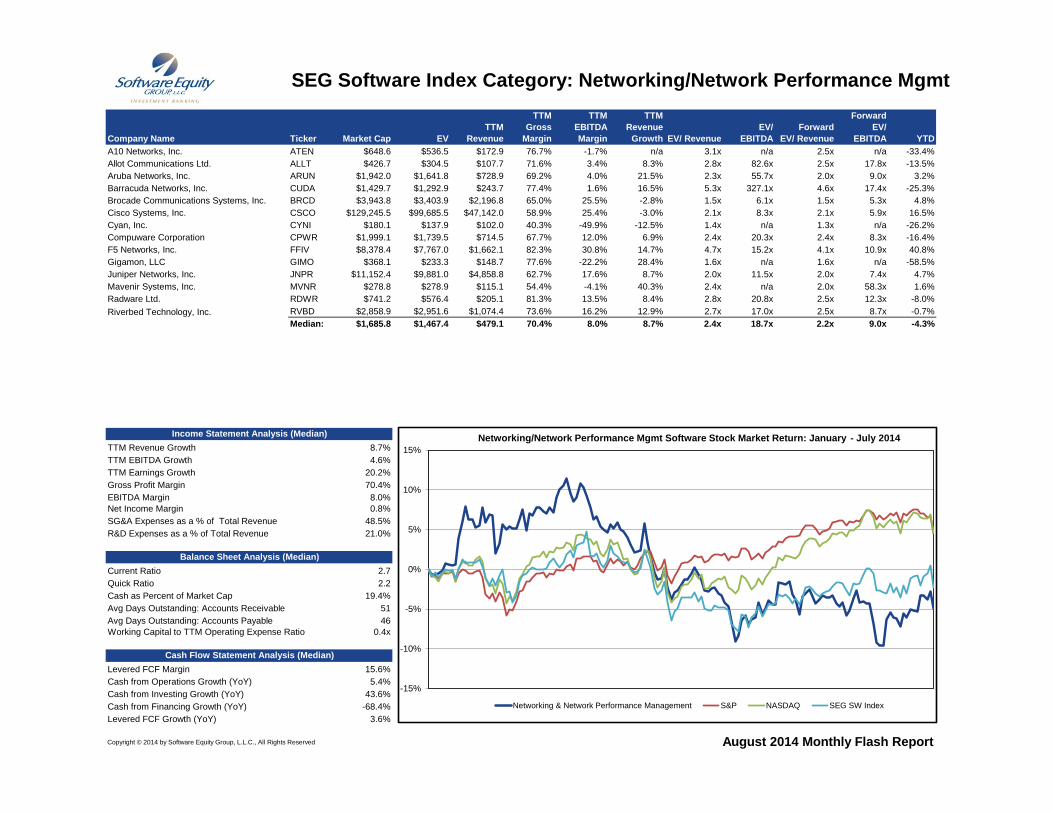
Networking & Network Performance Management $1,685.8 $1,467.4 $479.1 70.4% 8.0% 8.7% 2.4x 18.7x 2.2x 9.0x -4.3%
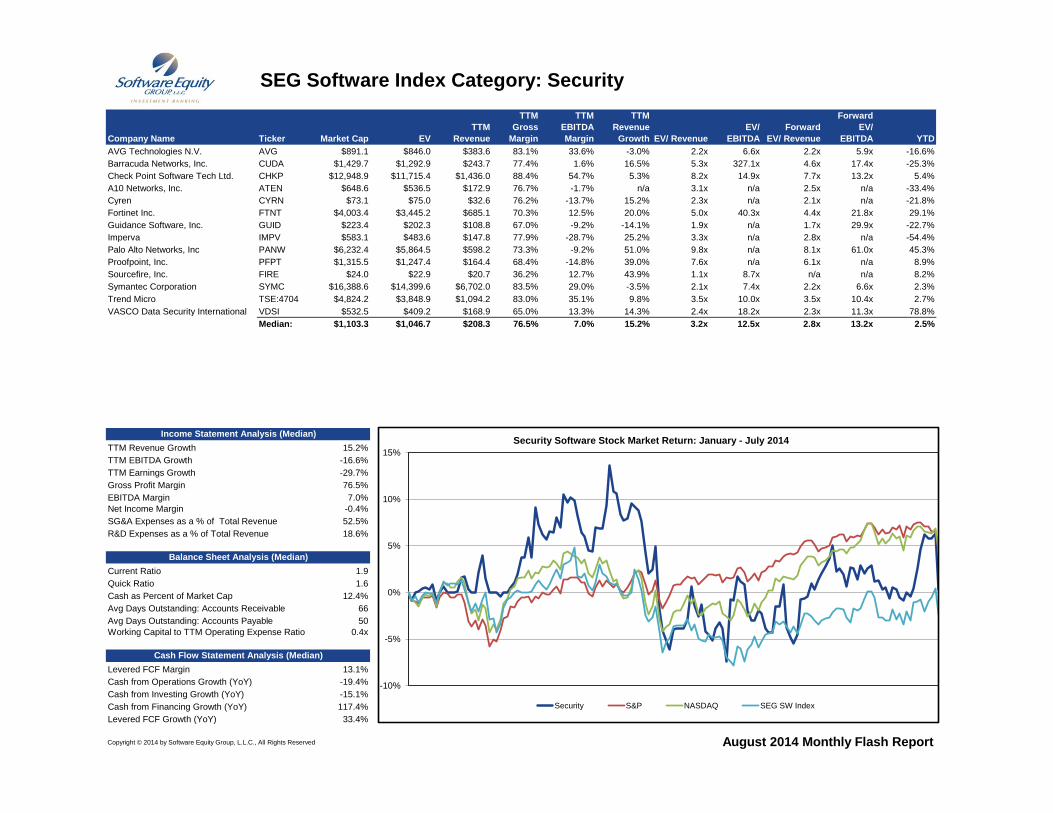
Security $1,103.3 $1,046.7 $208.3 76.5% 7.0% 15.2% 3.2x 12.5x 2.8x 13.2x 2.5%
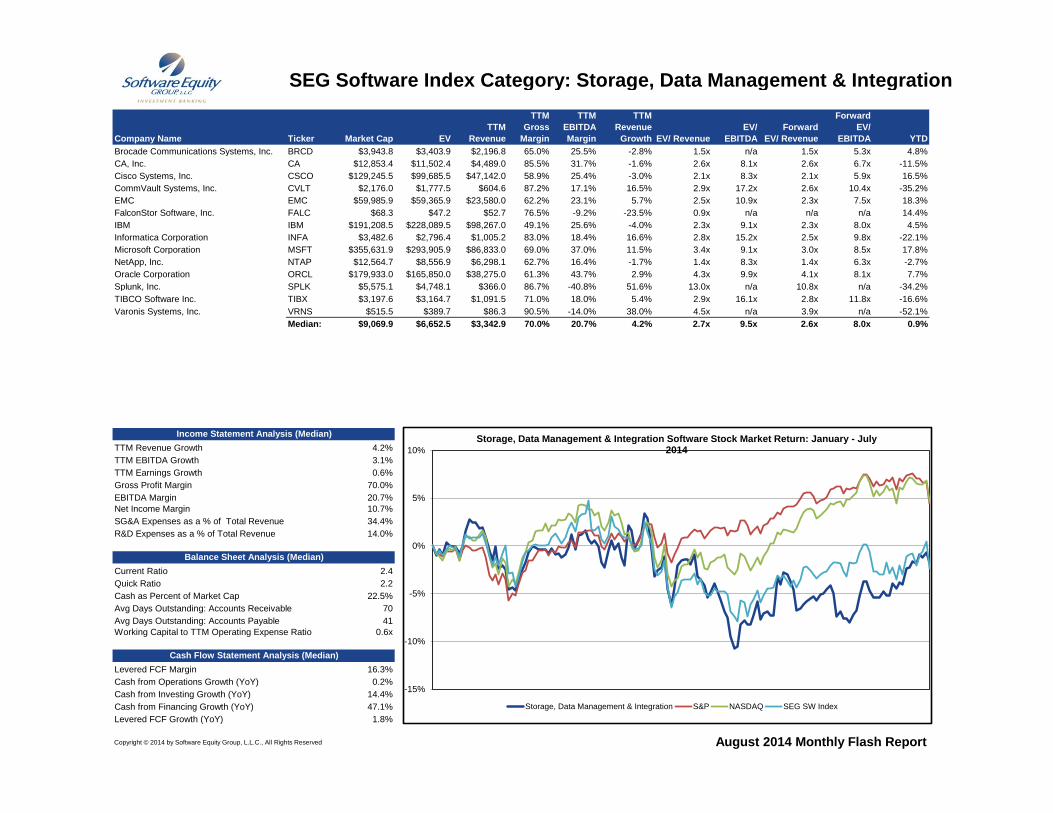
Storage, Data Mgmt & Integration $9,069.9 $6,652.5 $3,342.9 70.0% 20.7% 4.2% 2.7x 9.5x 2.6x 8.0x 0.9%
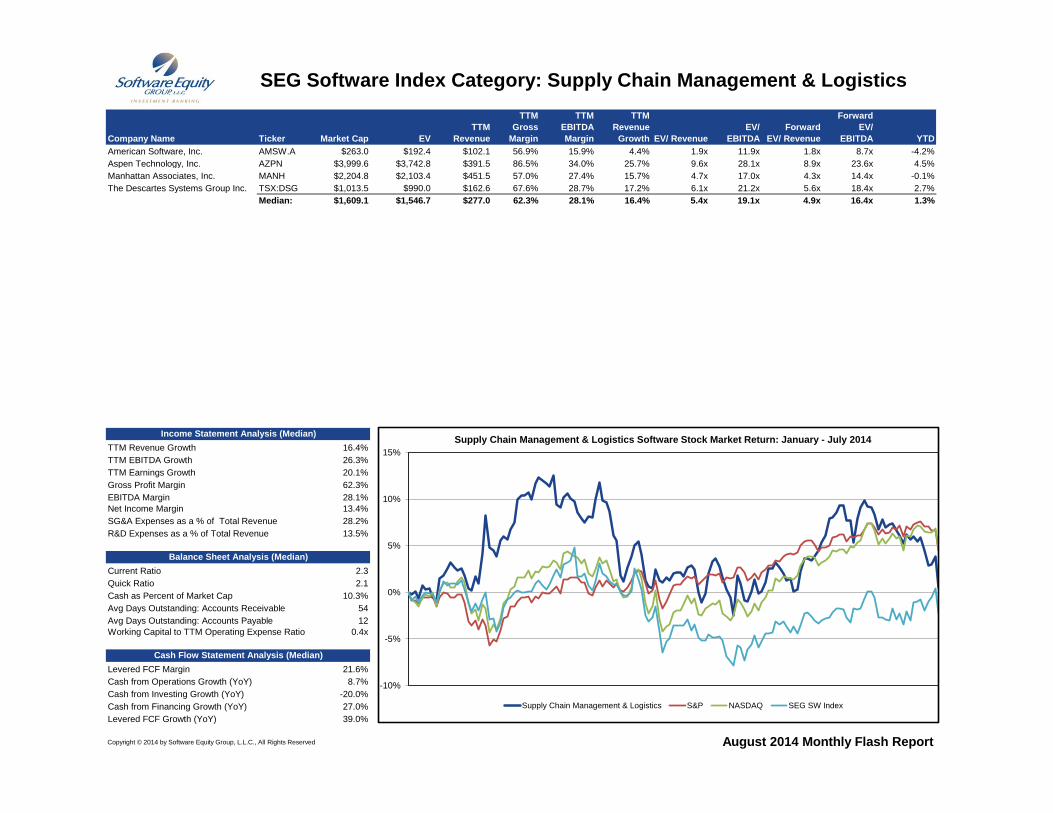
Supply Chain Management & Logistics $1,609.1 $1,546.7 $277.0 62.3% 28.1% 16.4% 5.4x 19.1x 4.9x 16.4x 1.3%
Systems Management $11,044.4 $10,844.7 $2,321.3 85.5% 25.3% 15.4% 5.1x 18.9x 4.5x 12.1x 8.6%
Vertical - Finance $4,231.2 $4,541.3 $909.1 44.4% 29.3% 6.3% 4.5x 13.3x 4.2x 11.8x -0.2%
Vertical - Other $1,199.4 $1,300.6 $402.5 49.3% 10.7% 16.9% 3.5x 24.2x 3.1x 18.5x -8.9%
TTM Revenue Growth 7.1%
TTM EBITDA Growth -24.8%
TTM Earnings Growth -35.9%
Gross Profit Margin 67.9%
EBITDA Margin 18.3%
Net Income Margin -16.6%
SG&A Expenses as a % of Total Revenue 58.4%
R&D Expenses as a % of Total Revenue 19.4%
Current Ratio 2.2
Quick Ratio 2.1
Cash as Percent of Market Cap 11.8%
Avg Days Outstanding: Accounts Receivable 65
Avg Days Outstanding: Accounts Payable 29
Working Capital to TTM Operating Expense Ratio 0.6x
Levered FCF Margin 6.5%
Cash from Operations Growth (YoY) 27.2%
Cash from Investing Growth (YoY) -38.0%
Cash from Financing Growth (YoY) 82.0%
Levered FCF Growth (YoY) 33.1%
Copyright © 2014 by Software Equity Group, L.L.C., All Rights Reserved August 2014 Monthly Flash Report
Category Name
Income Statement Analysis (Median)
Balance Sheet Analysis (Median)
Cash Flow Statement Analysis (Median)
-10%
-8%
-6%
-4%
-2%
0%
2%
4%
6%
8%
10%
SEG SW Index Software Stock Market Return: January - July 2014
DOW S&P NASDAQ SEG SW Index
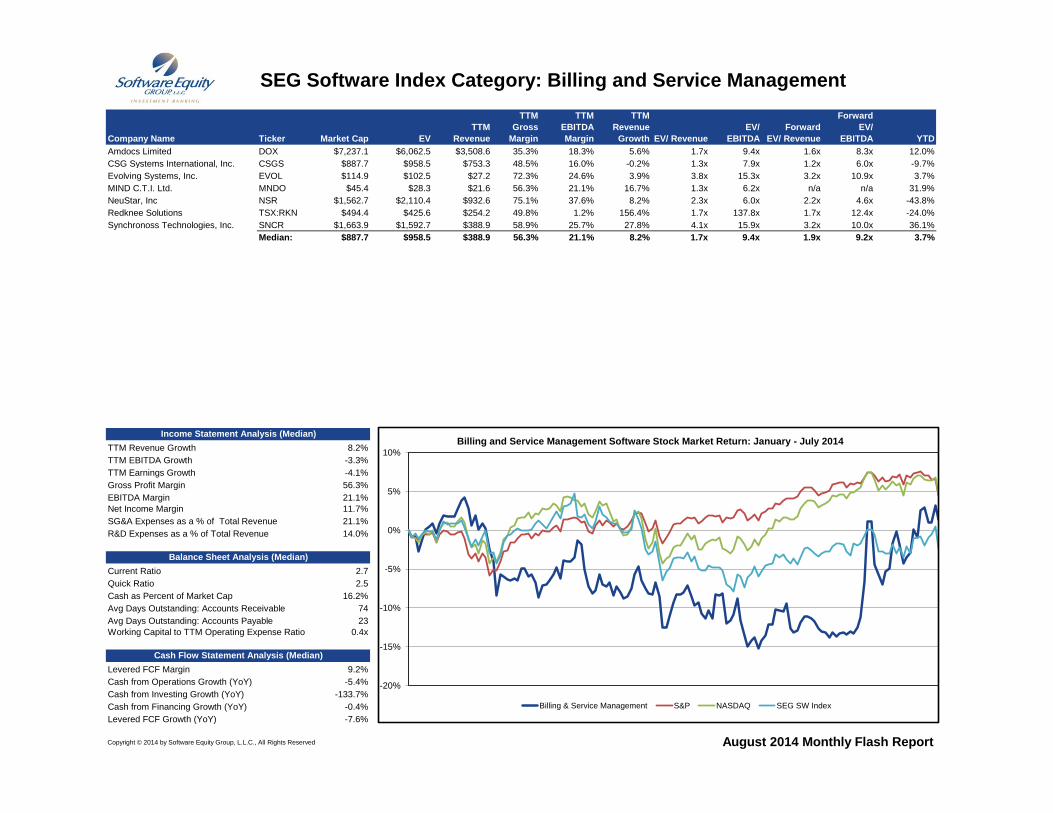
SEG Software Index Category: Billing and Service Management
Company Name Ticker Market Cap EV
TTM
Revenue
TTM
Gross
Margin
TTM
EBITDA
Margin
TTM
Revenue
Growth EV/ Revenue
EV/
EBITDA
Forward
EV/ Revenue
Forward
EV/
EBITDA YTD
Amdocs Limited DOX $7,237.1 $6,062.5 $3,508.6 35.3% 18.3% 5.6% 1.7x 9.4x 1.6x 8.3x 12.0%
CSG Systems International, Inc. CSGS $887.7 $958.5 $753.3 48.5% 16.0% -0.2% 1.3x 7.9x 1.2x 6.0x -9.7%
Evolving Systems, Inc. EVOL $114.9 $102.5 $27.2 72.3% 24.6% 3.9% 3.8x 15.3x 3.2x 10.9x 3.7%
MIND C.T.I. Ltd. MNDO $45.4 $28.3 $21.6 56.3% 21.1% 16.7% 1.3x 6.2x n/a n/a 31.9%
NeuStar, Inc NSR $1,562.7 $2,110.4 $932.6 75.1% 37.6% 8.2% 2.3x 6.0x 2.2x 4.6x -43.8%
Redknee Solutions TSX:RKN $494.4 $425.6 $254.2 49.8% 1.2% 156.4% 1.7x 137.8x 1.7x 12.4x -24.0%
Synchronoss Technologies, Inc. SNCR $1,663.9 $1,592.7 $388.9 58.9% 25.7% 27.8% 4.1x 15.9x 3.2x 10.0x 36.1%
Median: $887.7 $958.5 $388.9 56.3% 21.1% 8.2% 1.7x 9.4x 1.9x 9.2x 3.7%
TTM Revenue Growth 8.2%
TTM EBITDA Growth -3.3%
TTM Earnings Growth -4.1%
Gross Profit Margin 56.3%
EBITDA Margin 21.1%
Net Income Margin 11.7%
SG&A Expenses as a % of Total Revenue 21.1%
R&D Expenses as a % of Total Revenue 14.0%
Current Ratio 2.7
Quick Ratio 2.5
Cash as Percent of Market Cap 16.2%
Avg Days Outstanding: Accounts Receivable 74
Avg Days Outstanding: Accounts Payable 23
Working Capital to TTM Operating Expense Ratio 0.4x
Levered FCF Margin 9.2%
Cash from Operations Growth (YoY) -5.4%
Cash from Investing Growth (YoY) -133.7%
Cash from Financing Growth (YoY) -0.4%
Levered FCF Growth (YoY) -7.6%
Copyright © 2014 by Software Equity Group, L.L.C., All Rights Reserved August 2014 Monthly Flash Report
Income Statement Analysis (Median)
Balance Sheet Analysis (Median)
Cash Flow Statement Analysis (Median)
-20%
-15%
-10%
-5%
0%
5%
10%
Billing and Service Management Software Stock Market Return: January - July 2014
Billing & Service Management S&P NASDAQ SEG SW Index
SEG Software Index Category: Business Intelligence
Company Name Ticker Market Cap EV
TTM
Revenue
TTM
Gross
Margin
TTM
EBITDA
Margin
TTM
Revenue
Growth EV/ Revenue
EV/
EBITDA
Forward
EV/ Revenue
Forward
EV/
EBITDA YTD
Actuate Corporation BIRT $194.4 $130.3 $115.3 85.0% 2.2% -16.2% 1.1x 52.3x 1.3x 19.9x -44.6%
MicroStrategy Incorporated MSTR $1,617.5 $1,250.0 $587.6 77.1% 5.1% 4.9% 2.1x 41.8x 2.0x 24.8x 15.9%
Pegasystems Inc. PEGA $1,629.2 $1,408.2 $558.8 68.8% 14.4% 16.7% 2.5x 17.5x 2.4x 14.5x -12.5%
Progress Software Corporation PRGS $1,174.3 $947.7 $323.9 90.8% 29.3% -0.8% 2.9x 10.0x 2.8x 7.8x -9.2%
PROS Holdings PRO $741.5 $697.5 $161.0 69.0% -0.6% 22.1% 4.3x n/a 3.5x 23.5x -34.8%
Qlik Technologies QLIK $2,371.9 $2,116.8 $508.6 86.3% 1.7% 18.8% 4.2x 250.3x 3.6x 47.4x 5.3%
Varonis Systems, Inc. VRNS $515.5 $389.7 $86.3 90.5% -14.0% 38.0% 4.5x n/a 3.9x n/a -52.1%
Verisk VRSK $9,995.2 $10,847.3 $1,661.8 59.8% 45.4% 14.2% 6.5x 14.4x 5.8x 12.5x -7.8%
Teradata NYSE:TDC $6,648.6 $5,966.6 $2,739.0 54.5% 23.2% 3.6% 2.2x 9.4x 2.1x 7.2x -5.7%
Median: $1,617.5 $1,250.0 $508.6 77.1% 5.1% 14.2% 2.9x 17.5x 2.8x 17.2x -9.2%
TTM Revenue Growth 14.2%
TTM EBITDA Growth 5.3%
TTM Earnings Growth -73.9%
Gross Profit Margin 77.1%
EBITDA Margin 5.1%
Net Income Margin 2.8%
SG&A Expenses as a % of Total Revenue 49.7%
R&D Expenses as a % of Total Revenue 18.5%
Current Ratio 1.9
Quick Ratio 1.8
Cash as Percent of Market Cap 14.0%
Avg Days Outstanding: Accounts Receivable 93
Avg Days Outstanding: Accounts Payable 61
Working Capital to TTM Operating Expense Ratio 0.4x
Levered FCF Margin 13.2%
Cash from Operations Growth (YoY) 3.7%
Cash from Investing Growth (YoY) -70.1%
Cash from Financing Growth (YoY) -39.7%
Levered FCF Growth (YoY) 34.4%
Copyright © 2014 by Software Equity Group, L.L.C., All Rights Reserved August 2014 Monthly Flash Report
Income Statement Analysis (Median)
Balance Sheet Analysis (Median)
Cash Flow Statement Analysis (Median)
-25%
-20%
-15%
-10%
-5%
0%
5%
10%
Business Intelligence Software Stock Market Return: January - July 2014
Business Intelligence S&P NASDAQ SEG SW Index
SEG Software Index Category: Development Platforms
Company Name Ticker Market Cap EV
TTM
Revenue
TTM
Gross
Margin
TTM
EBITDA
Margin
TTM
Revenue
Growth EV/ Revenue
EV/
EBITDA
Forward
EV/ Revenue
Forward
EV/
EBITDA YTD
Actuate Corporation BIRT $194.4 $130.3 $115.3 85.0% 2.2% -16.2% 1.1x 52.3x 1.3x 19.9x -44.6%
Adobe Systems Incorporated ADBE $34,443.2 $32,619.3 $4,105.1 85.4% 18.2% -3.5% 7.9x 43.6x 7.4x 25.2x 16.8%
BSQUARE Corporation BSQR $36.5 $13.5 $95.2 16.6% 0.3% 1.2% 0.1x 56.5x n/a n/a -12.2%
Compuware Corporation CPWR $1,999.1 $1,739.5 $714.5 67.7% 12.0% 6.9% 2.4x 20.3x 2.4x 8.3x -16.4%
Magic Software Enterprises Ltd. MGIC $305.0 $224.2 $158.4 40.4% 19.2% 16.0% 1.4x 7.4x 1.3x n/a -1.7%
Microsoft Corporation MSFT $355,631.9 $293,905.9 $86,833.0 69.0% 37.0% 11.5% 3.4x 9.1x 3.0x 8.5x 17.8%
Oracle Corporation ORCL $179,933.0 $165,850.0 $38,275.0 61.3% 43.7% 2.9% 4.3x 9.9x 4.1x 8.1x 7.7%
Progress Software Corporation PRGS $1,174.3 $947.7 $323.9 90.8% 29.3% -0.8% 2.9x 10.0x 2.8x 7.8x -9.2%
Red Hat, Inc. RHT $10,990.3 $10,187.1 $1,595.1 84.9% 19.2% 15.8% 6.4x 33.3x 5.6x 20.3x 4.1%
Software AG XTRA:SOW $1,982.6 $2,154.5 $1,252.5 69.8% 23.6% -8.2% 1.7x 7.3x 1.9x 6.9x -24.8%
Median: $1,990.8 $1,947.0 $983.5 69.4% 19.2% 2.1% 2.7x 15.1x 2.8x 8.4x -5.5%
TTM Revenue Growth 2.1%
TTM EBITDA Growth 0.3%
TTM Earnings Growth -8.4%
Gross Profit Margin 69.4%
EBITDA Margin 19.2%
Net Income Margin 10.9%
SG&A Expenses as a % of Total Revenue 42.9%
R&D Expenses as a % of Total Revenue 13.3%
Current Ratio 2.0
Quick Ratio 1.9
Cash as Percent of Market Cap 21.5%
Avg Days Outstanding: Accounts Receivable 77
Avg Days Outstanding: Accounts Payable 29
Working Capital to TTM Operating Expense Ratio 0.4x
Levered FCF Margin 20.7%
Cash from Operations Growth (YoY) 8.4%
Cash from Investing Growth (YoY) -68.1%
Cash from Financing Growth (YoY) 39.2%
Levered FCF Growth (YoY) 29.2%
Copyright © 2014 by Software Equity Group, L.L.C., All Rights Reserved August 2014 Monthly Flash Report
Income Statement Analysis (Median)
Balance Sheet Analysis (Median)
Cash Flow Statement Analysis (Median)
-10%
-8%
-6%
-4%
-2%
0%
2%
4%
6%
8%
10%
Development Platforms Software Stock Market Return: January - July 2014
Development Platforms S&P NASDAQ SEG SW Index
SEG Software Index Category: Engineering & PLM
Company Name Ticker Market Cap EV
TTM
Revenue
TTM
Gross
Margin
TTM
EBITDA
Margin
TTM
Revenue
Growth EV/ Revenue
EV/
EBITDA
Forward
EV/ Revenue
Forward
EV/
EBITDA YTD
ANSYS, Inc. ANSS $7,129.5 $6,271.9 $896.3 87.4% 46.5% 8.0% 7.0x 15.1x 6.5x 13.1x -10.5%
Autodesk, Inc. ADSK $12,156.7 $10,783.6 $2,371.4 87.1% 15.3% 3.7% 4.5x 29.7x 4.4x 23.0x 8.3%
Cadence Design Systems, Inc CDNS $4,881.4 $4,659.4 $1,500.7 85.3% 19.0% 7.1% 3.1x 16.4x 2.8x 8.5x 20.1%
Cimatron Ltd. CIMT $61.1 $45.0 $45.8 86.7% 15.2% 6.4% 1.0x 6.5x 1.0x n/a -38.3%
Dassault Systèmes DSY $16,938.2 $15,671.2 $2,899.4 86.8% 28.6% 2.3% 5.4x 18.9x 4.8x 14.9x 10.0%
GSE Systems Inc. GVP $29.5 $8.8 $41.1 28.1% -10.4% -16.2% 0.2x n/a n/a n/a 1.9%
Mentor Graphics Corp MENT $2,249.8 $2,315.7 $1,189.0 82.9% 19.1% 10.1% 1.9x 10.2x 1.8x 7.4x -16.3%
Parametric Technology Corporation PTC $4,265.5 $4,276.4 $1,335.1 72.3% 23.7% 4.8% 3.2x 13.5x 3.1x 10.9x 3.6%
PDF Solutions Inc PDFS $584.8 $477.9 $104.3 63.0% 35.4% 9.5% 4.6x 13.0x 4.0x 8.8x -23.5%
Stratasys, Inc. SSYS $4,969.8 $4,362.3 $610.1 50.5% 14.6% 88.0% 7.1x 48.9x 6.0x 20.7x -24.9%
Synopsys Inc SNPS $5,844.3 $5,312.7 $2,023.3 82.5% 17.8% 5.8% 2.6x 14.8x 2.5x 8.3x -6.6%
Median: $4,881.4 $4,362.3 $1,189.0 82.9% 19.0% 6.4% 3.2x 14.9x 3.5x 10.9x -6.6%
TTM Revenue Growth 6.4%
TTM EBITDA Growth 7.4%
TTM Earnings Growth 20.2%
Gross Profit Margin 82.9%
EBITDA Margin 19.0%
Net Income Margin 12.0%
SG&A Expenses as a % of Total Revenue 36.2%
R&D Expenses as a % of Total Revenue 17.8%
Current Ratio 2.0
Quick Ratio 1.9
Cash as Percent of Market Cap 13.4%
Avg Days Outstanding: Accounts Receivable 82
Avg Days Outstanding: Accounts Payable 40
Working Capital to TTM Operating Expense Ratio 0.5x
Levered FCF Margin 19.2%
Cash from Operations Growth (YoY) 12.2%
Cash from Investing Growth (YoY) -97.5%
Cash from Financing Growth (YoY) -120.7%
Levered FCF Growth (YoY) 28.8%
Copyright © 2014 by Software Equity Group, L.L.C., All Rights Reserved August 2014 Monthly Flash Report
Income Statement Analysis (Median)
Balance Sheet Analysis (Median)
Cash Flow Statement Analysis (Median)
-12%
-10%
-8%
-6%
-4%
-2%
0%
2%
4%
6%
8%
10%Engineering & PLM Software Stock Market Return: January - July 2014
Engineering & PLM S&P NASDAQ SEG SW Index
SEG Software Index Category: Enterprise Resource Planning
Company Name Ticker Market Cap EV
TTM
Revenue
TTM
Gross
Margin
TTM
EBITDA
Margin
TTM
Revenue
Growth EV/ Revenue
EV/
EBITDA
Forward
EV/ Revenue
Forward
EV/
EBITDA YTD
American Software, Inc. AMSW.A $263.0 $192.4 $102.1 56.9% 15.9% 4.4% 1.9x 11.9x 1.8x 8.7x -4.2%
Oracle Corporation ORCL $179,933.0 $165,850.0 $38,275.0 61.3% 43.7% 2.9% 4.3x 9.9x 4.1x 8.1x 7.7%
QAD Inc. QADA $290.4 $227.5 $280.7 55.7% 5.7% 10.3% 0.8x 14.2x 0.8x 11.1x 12.7%
Sage Group plc LSE:SGE $6,730.9 $7,340.0 $2,207.7 94.3% 29.5% -3.7% 3.3x 11.3x 3.2x 10.7x -1.1%
SAP DB:SAP $94,231.8 $95,706.7 $23,274.7 72.4% 34.5% 2.2% 4.1x 11.9x 4.0x 10.6x -4.7%
Median: $6,730.9 $7,340.0 $2,207.7 61.3% 29.5% 2.9% 3.3x 11.9x 3.2x 10.6x -1.1%
TTM Revenue Growth 2.9%
TTM EBITDA Growth 14.5%
TTM Earnings Growth 13.5%
Gross Profit Margin 61.3%
EBITDA Margin 29.5%
Net Income Margin 18.0%
SG&A Expenses as a % of Total Revenue 32.3%
R&D Expenses as a % of Total Revenue 13.3%
Current Ratio 1.2
Quick Ratio 1.0
Cash as Percent of Market Cap 21.6%
Avg Days Outstanding: Accounts Receivable 72
Avg Days Outstanding: Accounts Payable 18
Working Capital to TTM Operating Expense Ratio 0.1x
Levered FCF Margin 20.4%
Cash from Operations Growth (YoY) -6.5%
Cash from Investing Growth (YoY) 35.8%
Cash from Financing Growth (YoY) 44.8%
Levered FCF Growth (YoY) 8.3%
Copyright © 2014 by Software Equity Group, L.L.C., All Rights Reserved August 2014 Monthly Flash Report
Income Statement Analysis (Median)
Balance Sheet Analysis (Median)
Cash Flow Statement Analysis (Median)
-10%
-8%
-6%
-4%
-2%
0%
2%
4%
6%
8%
10%Enterprise Resource Planning Software Stock Market Return: January - July 2014
Enterprise Resource Planning S&P NASDAQ SEG SW Index
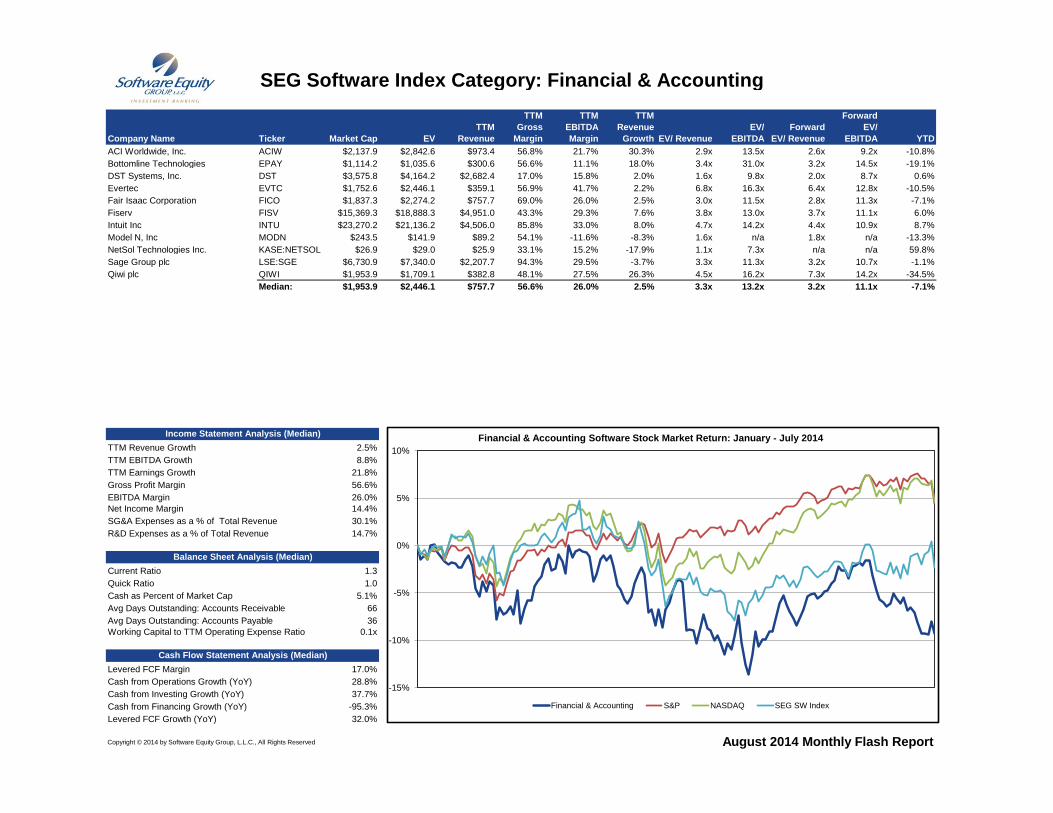
SEG Software Index Category: Financial & Accounting
Company Name Ticker Market Cap EV
TTM
Revenue
TTM
Gross
Margin
TTM
EBITDA
Margin
TTM
Revenue
Growth EV/ Revenue
EV/
EBITDA
Forward
EV/ Revenue
Forward
EV/
EBITDA YTD
ACI Worldwide, Inc. ACIW $2,137.9 $2,842.6 $973.4 56.8% 21.7% 30.3% 2.9x 13.5x 2.6x 9.2x -10.8%
Bottomline Technologies EPAY $1,114.2 $1,035.6 $300.6 56.6% 11.1% 18.0% 3.4x 31.0x 3.2x 14.5x -19.1%
DST Systems, Inc. DST $3,575.8 $4,164.2 $2,682.4 17.0% 15.8% 2.0% 1.6x 9.8x 2.0x 8.7x 0.6%
Evertec EVTC $1,752.6 $2,446.1 $359.1 56.9% 41.7% 2.2% 6.8x 16.3x 6.4x 12.8x -10.5%
Fair Isaac Corporation FICO $1,837.3 $2,274.2 $757.7 69.0% 26.0% 2.5% 3.0x 11.5x 2.8x 11.3x -7.1%
Fiserv FISV $15,369.3 $18,888.3 $4,951.0 43.3% 29.3% 7.6% 3.8x 13.0x 3.7x 11.1x 6.0%
Intuit Inc INTU $23,270.2 $21,136.2 $4,506.0 85.8% 33.0% 8.0% 4.7x 14.2x 4.4x 10.9x 8.7%
Model N, Inc MODN $243.5 $141.9 $89.2 54.1% -11.6% -8.3% 1.6x n/a 1.8x n/a -13.3%
NetSol Technologies Inc. KASE:NETSOL $26.9 $29.0 $25.9 33.1% 15.2% -17.9% 1.1x 7.3x n/a n/a 59.8%
Sage Group plc LSE:SGE $6,730.9 $7,340.0 $2,207.7 94.3% 29.5% -3.7% 3.3x 11.3x 3.2x 10.7x -1.1%
Qiwi plc QIWI $1,953.9 $1,709.1 $382.8 48.1% 27.5% 26.3% 4.5x 16.2x 7.3x 14.2x -34.5%
Median: $1,953.9 $2,446.1 $757.7 56.6% 26.0% 2.5% 3.3x 13.2x 3.2x 11.1x -7.1%
TTM Revenue Growth 2.5%
TTM EBITDA Growth 8.8%
TTM Earnings Growth 21.8%
Gross Profit Margin 56.6%
EBITDA Margin 26.0%
Net Income Margin 14.4%
SG&A Expenses as a % of Total Revenue 30.1%
R&D Expenses as a % of Total Revenue 14.7%
Current Ratio 1.3
Quick Ratio 1.0
Cash as Percent of Market Cap 5.1%
Avg Days Outstanding: Accounts Receivable 66
Avg Days Outstanding: Accounts Payable 36
Working Capital to TTM Operating Expense Ratio 0.1x
Levered FCF Margin 17.0%
Cash from Operations Growth (YoY) 28.8%
Cash from Investing Growth (YoY) 37.7%
Cash from Financing Growth (YoY) -95.3%
Levered FCF Growth (YoY) 32.0%
Copyright © 2014 by Software Equity Group, L.L.C., All Rights Reserved August 2014 Monthly Flash Report
Income Statement Analysis (Median)
Balance Sheet Analysis (Median)
Cash Flow Statement Analysis (Median)
-15%
-10%
-5%
0%
5%
10%
Financial & Accounting Software Stock Market Return: January - July 2014
Financial & Accounting S&P NASDAQ SEG SW Index
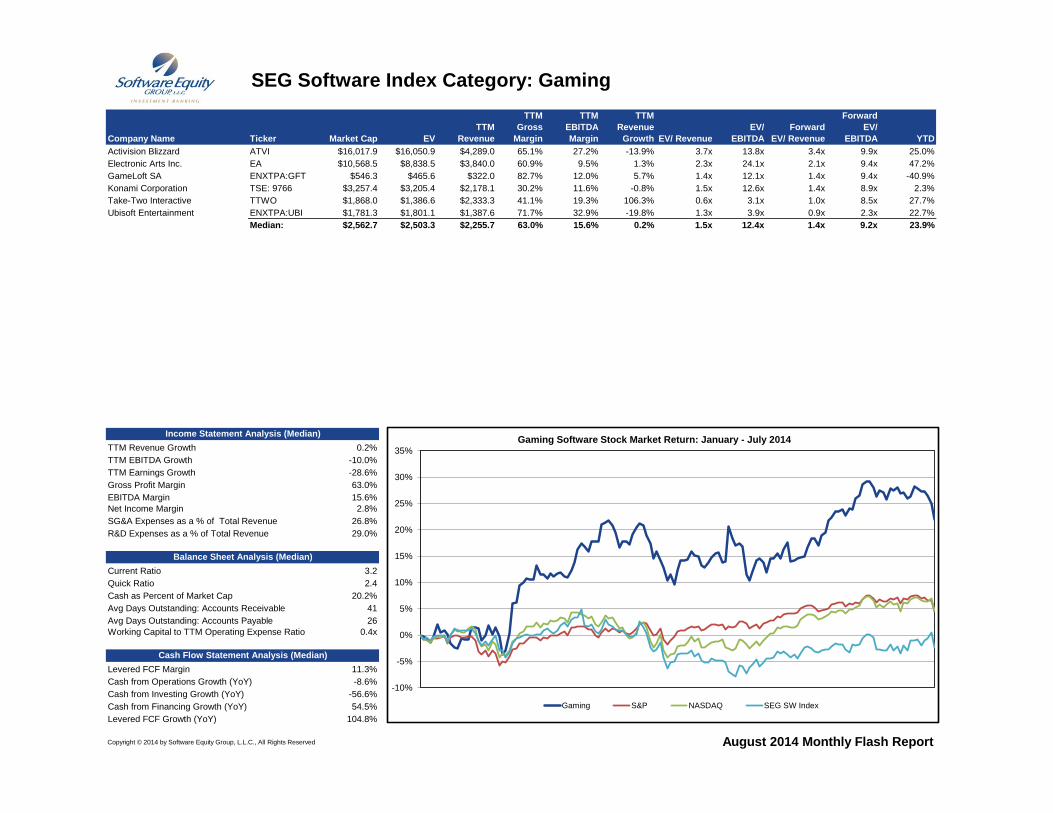
SEG Software Index Category: Gaming
Company Name Ticker Market Cap EV
TTM
Revenue
TTM
Gross
Margin
TTM
EBITDA
Margin
TTM
Revenue
Growth EV/ Revenue
EV/
EBITDA
Forward
EV/ Revenue
Forward
EV/
EBITDA YTD
Activision Blizzard ATVI $16,017.9 $16,050.9 $4,289.0 65.1% 27.2% -13.9% 3.7x 13.8x 3.4x 9.9x 25.0%
Electronic Arts Inc. EA $10,568.5 $8,838.5 $3,840.0 60.9% 9.5% 1.3% 2.3x 24.1x 2.1x 9.4x 47.2%
GameLoft SA ENXTPA:GFT $546.3 $465.6 $322.0 82.7% 12.0% 5.7% 1.4x 12.1x 1.4x 9.4x -40.9%
Konami Corporation TSE: 9766 $3,257.4 $3,205.4 $2,178.1 30.2% 11.6% -0.8% 1.5x 12.6x 1.4x 8.9x 2.3%
Take-Two Interactive TTWO $1,868.0 $1,386.6 $2,333.3 41.1% 19.3% 106.3% 0.6x 3.1x 1.0x 8.5x 27.7%
Ubisoft Entertainment ENXTPA:UBI $1,781.3 $1,801.1 $1,387.6 71.7% 32.9% -19.8% 1.3x 3.9x 0.9x 2.3x 22.7%
Median: $2,562.7 $2,503.3 $2,255.7 63.0% 15.6% 0.2% 1.5x 12.4x 1.4x 9.2x 23.9%
TTM Revenue Growth 0.2%
TTM EBITDA Growth -10.0%
TTM Earnings Growth -28.6%
Gross Profit Margin 63.0%
EBITDA Margin 15.6%
Net Income Margin 2.8%
SG&A Expenses as a % of Total Revenue 26.8%
R&D Expenses as a % of Total Revenue 29.0%
Current Ratio 3.2
Quick Ratio 2.4
Cash as Percent of Market Cap 20.2%
Avg Days Outstanding: Accounts Receivable 41
Avg Days Outstanding: Accounts Payable 26
Working Capital to TTM Operating Expense Ratio 0.4x
Levered FCF Margin 11.3%
Cash from Operations Growth (YoY) -8.6%
Cash from Investing Growth (YoY) -56.6%
Cash from Financing Growth (YoY) 54.5%
Levered FCF Growth (YoY) 104.8%
Copyright © 2014 by Software Equity Group, L.L.C., All Rights Reserved August 2014 Monthly Flash Report
Income Statement Analysis (Median)
Balance Sheet Analysis (Median)
Cash Flow Statement Analysis (Median)
-10%
-5%
0%
5%
10%
15%
20%
25%
30%
35%
Gaming Software Stock Market Return: January - July 2014
Gaming S&P NASDAQ SEG SW Index

SEG Software Index Category: Healthcare
Company Name Ticker Market Cap EV
TTM
Revenue
TTM
Gross
Margin
TTM
EBITDA
Margin
TTM
Revenue
Growth EV/ Revenue
EV/
EBITDA
Forward
EV/ Revenue
Forward
EV/
EBITDA YTD
Accretive Health AH $15,479.9 $15,782.4 $43,570.6 26.6% 6.5% -3.1% 0.4x 5.5x 0.4x 5.5x 2.6%
Allscripts Healthcare Solutions Inc. MDRX $2,857.4 $3,365.0 $1,372.7 46.0% 2.1% -2.2% 2.5x 114.3x 2.3x 14.4x 3.4%
Cerner Corporation CERN $18,826.2 $17,992.8 $3,074.9 84.8% 26.2% 13.4% 5.9x 22.3x 5.0x 14.4x 0.2%
Computer Programs and Sys, Inc. CPSI $734.8 $710.8 $203.2 47.1% 27.9% 3.7% 3.5x 12.6x 3.3x 11.4x 10.5%
MedAssets MDAS $1,276.3 $2,065.9 $683.1 76.9% 29.6% 1.8% 3.0x 10.2x 2.9x 8.5x 8.5%
Merge Healthcare MRGE $235.4 $443.2 $215.6 59.4% 13.4% -12.3% 2.1x 15.4x 2.0x 10.5x -2.8%
Omnicell, Inc. OMCL $1,003.0 $876.6 $406.6 53.9% 14.7% 14.4% 2.2x 14.6x 2.0x 10.1x 9.3%
Quality Systems, Inc. QSII $934.0 $817.6 $453.0 54.0% 11.3% 0.3% 1.8x 16.0x 1.7x 10.6x -23.6%
Median: $1,139.6 $1,471.3 $568.1 54.0% 14.1% 1.1% 2.3x 15.0x 2.2x 10.6x 3.0%
TTM Revenue Growth 1.1%
TTM EBITDA Growth 1.1%
TTM Earnings Growth 3.1%
Gross Profit Margin 54.0%
EBITDA Margin 14.1%
Net Income Margin 3.0%
SG&A Expenses as a % of Total Revenue 31.3%
R&D Expenses as a % of Total Revenue 11.7%
Current Ratio 1.6
Quick Ratio 1.4
Cash as Percent of Market Cap 7.7%
Avg Days Outstanding: Accounts Receivable 69
Avg Days Outstanding: Accounts Payable 36
Working Capital to TTM Operating Expense Ratio 0.2x
Levered FCF Margin 8.8%
Cash from Operations Growth (YoY) 4.3%
Cash from Investing Growth (YoY) -11.9%
Cash from Financing Growth (YoY) -29.0%
Levered FCF Growth (YoY) 32.2%
Copyright © 2014 by Software Equity Group, L.L.C., All Rights Reserved August 2014 Monthly Flash Report
Income Statement Analysis (Median)
Balance Sheet Analysis (Median)
Cash Flow Statement Analysis (Median)
-10%
-5%
0%
5%
10%
15%
20%
Healthcare Software Stock Market Return: January - July 2014
Healthcare S&P NASDAQ SEG SW Index
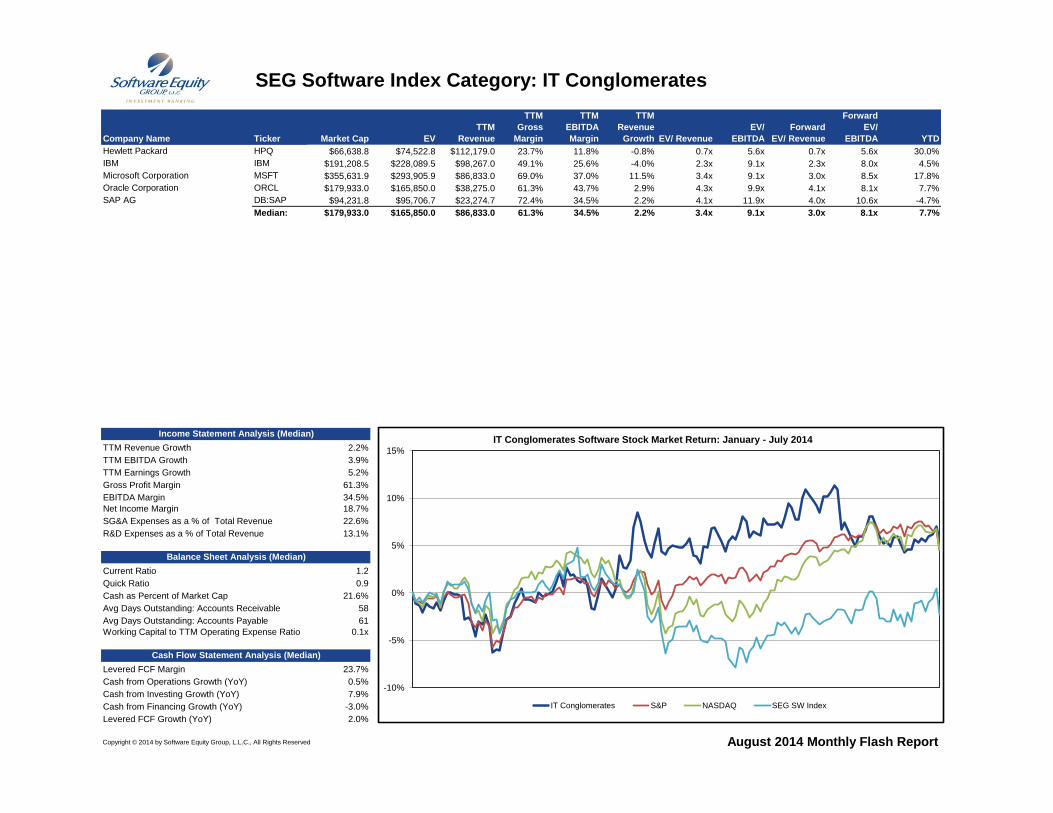
SEG Software Index Category: IT Conglomerates
Company Name Ticker Market Cap EV
TTM
Revenue
TTM
Gross
Margin
TTM
EBITDA
Margin
TTM
Revenue
Growth EV/ Revenue
EV/
EBITDA
Forward
EV/ Revenue
Forward
EV/
EBITDA YTD
Hewlett Packard HPQ $66,638.8 $74,522.8 $112,179.0 23.7% 11.8% -0.8% 0.7x 5.6x 0.7x 5.6x 30.0%
IBM IBM $191,208.5 $228,089.5 $98,267.0 49.1% 25.6% -4.0% 2.3x 9.1x 2.3x 8.0x 4.5%
Microsoft Corporation MSFT $355,631.9 $293,905.9 $86,833.0 69.0% 37.0% 11.5% 3.4x 9.1x 3.0x 8.5x 17.8%
Oracle Corporation ORCL $179,933.0 $165,850.0 $38,275.0 61.3% 43.7% 2.9% 4.3x 9.9x 4.1x 8.1x 7.7%
SAP AG DB:SAP $94,231.8 $95,706.7 $23,274.7 72.4% 34.5% 2.2% 4.1x 11.9x 4.0x 10.6x -4.7%
Median: $179,933.0 $165,850.0 $86,833.0 61.3% 34.5% 2.2% 3.4x 9.1x 3.0x 8.1x 7.7%
TTM Revenue Growth 2.2%
TTM EBITDA Growth 3.9%
TTM Earnings Growth 5.2%
Gross Profit Margin 61.3%
EBITDA Margin 34.5%
Net Income Margin 18.7%
SG&A Expenses as a % of Total Revenue 22.6%
R&D Expenses as a % of Total Revenue 13.1%
Current Ratio 1.2
Quick Ratio 0.9
Cash as Percent of Market Cap 21.6%
Avg Days Outstanding: Accounts Receivable 58
Avg Days Outstanding: Accounts Payable 61
Working Capital to TTM Operating Expense Ratio 0.1x
Levered FCF Margin 23.7%
Cash from Operations Growth (YoY) 0.5%
Cash from Investing Growth (YoY) 7.9%
Cash from Financing Growth (YoY) -3.0%
Levered FCF Growth (YoY) 2.0%
Copyright © 2014 by Software Equity Group, L.L.C., All Rights Reserved August 2014 Monthly Flash Report
Income Statement Analysis (Median)
Balance Sheet Analysis (Median)
Cash Flow Statement Analysis (Median)
-10%
-5%
0%
5%
10%
15%
IT Conglomerates Software Stock Market Return: January - July 2014
IT Conglomerates S&P NASDAQ SEG SW Index
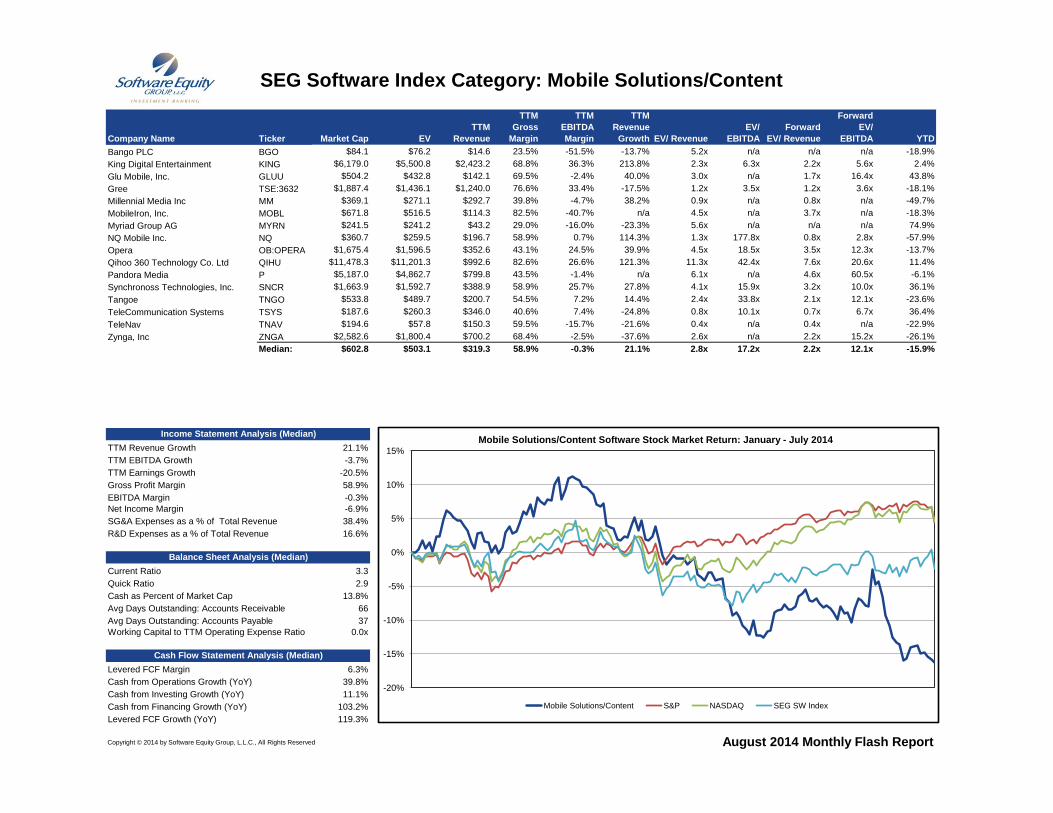
SEG Software Index Category: Mobile Solutions/Content
Company Name Ticker Market Cap EV
TTM
Revenue
TTM
Gross
Margin
TTM
EBITDA
Margin
TTM
Revenue
Growth EV/ Revenue
EV/
EBITDA
Forward
EV/ Revenue
Forward
EV/
EBITDA YTD
Bango PLC BGO $84.1 $76.2 $14.6 23.5% -51.5% -13.7% 5.2x n/a n/a n/a -18.9%
King Digital Entertainment KING $6,179.0 $5,500.8 $2,423.2 68.8% 36.3% 213.8% 2.3x 6.3x 2.2x 5.6x 2.4%
Glu Mobile, Inc. GLUU $504.2 $432.8 $142.1 69.5% -2.4% 40.0% 3.0x n/a 1.7x 16.4x 43.8%
Gree TSE:3632 $1,887.4 $1,436.1 $1,240.0 76.6% 33.4% -17.5% 1.2x 3.5x 1.2x 3.6x -18.1%
Millennial Media Inc MM $369.1 $271.1 $292.7 39.8% -4.7% 38.2% 0.9x n/a 0.8x n/a -49.7%
MobileIron, Inc. MOBL $671.8 $516.5 $114.3 82.5% -40.7% n/a 4.5x n/a 3.7x n/a -18.3%
Myriad Group AG MYRN $241.5 $241.2 $43.2 29.0% -16.0% -23.3% 5.6x n/a n/a n/a 74.9%
NQ Mobile Inc. NQ $360.7 $259.5 $196.7 58.9% 0.7% 114.3% 1.3x 177.8x 0.8x 2.8x -57.9%
Opera OB:OPERA $1,675.4 $1,596.5 $352.6 43.1% 24.5% 39.9% 4.5x 18.5x 3.5x 12.3x -13.7%
Qihoo 360 Technology Co. Ltd QIHU $11,478.3 $11,201.3 $992.6 82.6% 26.6% 121.3% 11.3x 42.4x 7.6x 20.6x 11.4%
Pandora Media P $5,187.0 $4,862.7 $799.8 43.5% -1.4% n/a 6.1x n/a 4.6x 60.5x -6.1%
Synchronoss Technologies, Inc. SNCR $1,663.9 $1,592.7 $388.9 58.9% 25.7% 27.8% 4.1x 15.9x 3.2x 10.0x 36.1%
Tangoe TNGO $533.8 $489.7 $200.7 54.5% 7.2% 14.4% 2.4x 33.8x 2.1x 12.1x -23.6%
TeleCommunication Systems TSYS $187.6 $260.3 $346.0 40.6% 7.4% -24.8% 0.8x 10.1x 0.7x 6.7x 36.4%
TeleNav TNAV $194.6 $57.8 $150.3 59.5% -15.7% -21.6% 0.4x n/a 0.4x n/a -22.9%
Zynga, Inc ZNGA $2,582.6 $1,800.4 $700.2 68.4% -2.5% -37.6% 2.6x n/a 2.2x 15.2x -26.1%
Median: $602.8 $503.1 $319.3 58.9% -0.3% 21.1% 2.8x 17.2x 2.2x 12.1x -15.9%
TTM Revenue Growth 21.1%
TTM EBITDA Growth -3.7%
TTM Earnings Growth -20.5%
Gross Profit Margin 58.9%
EBITDA Margin -0.3%
Net Income Margin -6.9%
SG&A Expenses as a % of Total Revenue 38.4%
R&D Expenses as a % of Total Revenue 16.6%
Current Ratio 3.3
Quick Ratio 2.9
Cash as Percent of Market Cap 13.8%
Avg Days Outstanding: Accounts Receivable 66
Avg Days Outstanding: Accounts Payable 37
Working Capital to TTM Operating Expense Ratio 0.0x
Levered FCF Margin 6.3%
Cash from Operations Growth (YoY) 39.8%
Cash from Investing Growth (YoY) 11.1%
Cash from Financing Growth (YoY) 103.2%
Levered FCF Growth (YoY) 119.3%
Copyright © 2014 by Software Equity Group, L.L.C., All Rights Reserved August 2014 Monthly Flash Report
Income Statement Analysis (Median)
Balance Sheet Analysis (Median)
Cash Flow Statement Analysis (Median)
-20%
-15%
-10%
-5%
0%
5%
10%
15%
Mobile Solutions/Content Software Stock Market Return: January - July 2014
Mobile Solutions/Content S&P NASDAQ SEG SW Index
SEG Software Index Category: Networking/Network Performance Mgmt
Company Name Ticker Market Cap EV
TTM
Revenue
TTM
Gross
Margin
TTM
EBITDA
Margin
TTM
Revenue
Growth EV/ Revenue
EV/
EBITDA
Forward
EV/ Revenue
Forward
EV/
EBITDA YTD
A10 Networks, Inc. ATEN $648.6 $536.5 $172.9 76.7% -1.7% n/a 3.1x n/a 2.5x n/a -33.4%
Allot Communications Ltd. ALLT $426.7 $304.5 $107.7 71.6% 3.4% 8.3% 2.8x 82.6x 2.5x 17.8x -13.5%
Aruba Networks, Inc. ARUN $1,942.0 $1,641.8 $728.9 69.2% 4.0% 21.5% 2.3x 55.7x 2.0x 9.0x 3.2%
Barracuda Networks, Inc. CUDA $1,429.7 $1,292.9 $243.7 77.4% 1.6% 16.5% 5.3x 327.1x 4.6x 17.4x -25.3%
Brocade Communications Systems, Inc. BRCD $3,943.8 $3,403.9 $2,196.8 65.0% 25.5% -2.8% 1.5x 6.1x 1.5x 5.3x 4.8%
Cisco Systems, Inc. CSCO $129,245.5 $99,685.5 $47,142.0 58.9% 25.4% -3.0% 2.1x 8.3x 2.1x 5.9x 16.5%
Cyan, Inc. CYNI $180.1 $137.9 $102.0 40.3% -49.9% -12.5% 1.4x n/a 1.3x n/a -26.2%
Compuware Corporation CPWR $1,999.1 $1,739.5 $714.5 67.7% 12.0% 6.9% 2.4x 20.3x 2.4x 8.3x -16.4%
F5 Networks, Inc. FFIV $8,378.4 $7,767.0 $1,662.1 82.3% 30.8% 14.7% 4.7x 15.2x 4.1x 10.9x 40.8%
Gigamon, LLC GIMO $368.1 $233.3 $148.7 77.6% -22.2% 28.4% 1.6x n/a 1.6x n/a -58.5%
Juniper Networks, Inc. JNPR $11,152.4 $9,881.0 $4,858.8 62.7% 17.6% 8.7% 2.0x 11.5x 2.0x 7.4x 4.7%
Mavenir Systems, Inc. MVNR $278.8 $278.9 $115.1 54.4% -4.1% 40.3% 2.4x n/a 2.0x 58.3x 1.6%
Radware Ltd. RDWR $741.2 $576.4 $205.1 81.3% 13.5% 8.4% 2.8x 20.8x 2.5x 12.3x -8.0%
Riverbed Technology, Inc. RVBD $2,858.9 $2,951.6 $1,074.4 73.6% 16.2% 12.9% 2.7x 17.0x 2.5x 8.7x -0.7%
Median: $1,685.8 $1,467.4 $479.1 70.4% 8.0% 8.7% 2.4x 18.7x 2.2x 9.0x -4.3%
TTM Revenue Growth 8.7%
TTM EBITDA Growth 4.6%
TTM Earnings Growth 20.2%
Gross Profit Margin 70.4%
EBITDA Margin 8.0%
Net Income Margin 0.8%
SG&A Expenses as a % of Total Revenue 48.5%
R&D Expenses as a % of Total Revenue 21.0%
Current Ratio 2.7
Quick Ratio 2.2
Cash as Percent of Market Cap 19.4%
Avg Days Outstanding: Accounts Receivable 51
Avg Days Outstanding: Accounts Payable 46
Working Capital to TTM Operating Expense Ratio 0.4x
Levered FCF Margin 15.6%
Cash from Operations Growth (YoY) 5.4%
Cash from Investing Growth (YoY) 43.6%
Cash from Financing Growth (YoY) -68.4%
Levered FCF Growth (YoY) 3.6%
Copyright © 2014 by Software Equity Group, L.L.C., All Rights Reserved
Income Statement Analysis (Median)
Balance Sheet Analysis (Median)
Cash Flow Statement Analysis (Median)
August 2014 Monthly Flash Report
-15%
-10%
-5%
0%
5%
10%
15%
Networking/Network Performance Mgmt Software Stock Market Return: January - July 2014
Networking & Network Performance Management S&P NASDAQ SEG SW Index
SEG Software Index Category: Security
Company Name Ticker Market Cap EV
TTM
Revenue
TTM
Gross
Margin
TTM
EBITDA
Margin
TTM
Revenue
Growth EV/ Revenue
EV/
EBITDA
Forward
EV/ Revenue
Forward
EV/
EBITDA YTD
AVG Technologies N.V. AVG $891.1 $846.0 $383.6 83.1% 33.6% -3.0% 2.2x 6.6x 2.2x 5.9x -16.6%
Barracuda Networks, Inc. CUDA $1,429.7 $1,292.9 $243.7 77.4% 1.6% 16.5% 5.3x 327.1x 4.6x 17.4x -25.3%
Check Point Software Tech Ltd. CHKP $12,948.9 $11,715.4 $1,436.0 88.4% 54.7% 5.3% 8.2x 14.9x 7.7x 13.2x 5.4%
A10 Networks, Inc. ATEN $648.6 $536.5 $172.9 76.7% -1.7% n/a 3.1x n/a 2.5x n/a -33.4%
Cyren CYRN $73.1 $75.0 $32.6 76.2% -13.7% 15.2% 2.3x n/a 2.1x n/a -21.8%
Fortinet Inc. FTNT $4,003.4 $3,445.2 $685.1 70.3% 12.5% 20.0% 5.0x 40.3x 4.4x 21.8x 29.1%
Guidance Software, Inc. GUID $223.4 $202.3 $108.8 67.0% -9.2% -14.1% 1.9x n/a 1.7x 29.9x -22.7%
Imperva IMPV $583.1 $483.6 $147.8 77.9% -28.7% 25.2% 3.3x n/a 2.8x n/a -54.4%
Palo Alto Networks, Inc PANW $6,232.4 $5,864.5 $598.2 73.3% -9.2% 51.0% 9.8x n/a 8.1x 61.0x 45.3%
Proofpoint, Inc. PFPT $1,315.5 $1,247.4 $164.4 68.4% -14.8% 39.0% 7.6x n/a 6.1x n/a 8.9%
Sourcefire, Inc. FIRE $24.0 $22.9 $20.7 36.2% 12.7% 43.9% 1.1x 8.7x n/a n/a 8.2%
Symantec Corporation SYMC $16,388.6 $14,399.6 $6,702.0 83.5% 29.0% -3.5% 2.1x 7.4x 2.2x 6.6x 2.3%
Trend Micro TSE:4704 $4,824.2 $3,848.9 $1,094.2 83.0% 35.1% 9.8% 3.5x 10.0x 3.5x 10.4x 2.7%
VASCO Data Security International VDSI $532.5 $409.2 $168.9 65.0% 13.3% 14.3% 2.4x 18.2x 2.3x 11.3x 78.8%
Median: $1,103.3 $1,046.7 $208.3 76.5% 7.0% 15.2% 3.2x 12.5x 2.8x 13.2x 2.5%
TTM Revenue Growth 15.2%
TTM EBITDA Growth -16.6%
TTM Earnings Growth -29.7%
Gross Profit Margin 76.5%
EBITDA Margin 7.0%
Net Income Margin -0.4%
SG&A Expenses as a % of Total Revenue 52.5%
R&D Expenses as a % of Total Revenue 18.6%
Current Ratio 1.9
Quick Ratio 1.6
Cash as Percent of Market Cap 12.4%
Avg Days Outstanding: Accounts Receivable 66
Avg Days Outstanding: Accounts Payable 50
Working Capital to TTM Operating Expense Ratio 0.4x
Levered FCF Margin 13.1%
Cash from Operations Growth (YoY) -19.4%
Cash from Investing Growth (YoY) -15.1%
Cash from Financing Growth (YoY) 117.4%
Levered FCF Growth (YoY) 33.4%
Copyright © 2014 by Software Equity Group, L.L.C., All Rights Reserved August 2014 Monthly Flash Report
Income Statement Analysis (Median)
Balance Sheet Analysis (Median)
Cash Flow Statement Analysis (Median)
-10%
-5%
0%
5%
10%
15%
Security Software Stock Market Return: January - July 2014
Security S&P NASDAQ SEG SW Index
SEG Software Index Category: Storage, Data Management & Integration
Company Name Ticker Market Cap EV
TTM
Revenue
TTM
Gross
Margin
TTM
EBITDA
Margin
TTM
Revenue
Growth EV/ Revenue
EV/
EBITDA
Forward
EV/ Revenue
Forward
EV/
EBITDA YTD
Brocade Communications Systems, Inc. BRCD $3,943.8 $3,403.9 $2,196.8 65.0% 25.5% -2.8% 1.5x n/a 1.5x 5.3x 4.8%
CA, Inc. CA $12,853.4 $11,502.4 $4,489.0 85.5% 31.7% -1.6% 2.6x 8.1x 2.6x 6.7x -11.5%
Cisco Systems, Inc. CSCO $129,245.5 $99,685.5 $47,142.0 58.9% 25.4% -3.0% 2.1x 8.3x 2.1x 5.9x 16.5%
CommVault Systems, Inc. CVLT $2,176.0 $1,777.5 $604.6 87.2% 17.1% 16.5% 2.9x 17.2x 2.6x 10.4x -35.2%
EMC EMC $59,985.9 $59,365.9 $23,580.0 62.2% 23.1% 5.7% 2.5x 10.9x 2.3x 7.5x 18.3%
FalconStor Software, Inc. FALC $68.3 $47.2 $52.7 76.5% -9.2% -23.5% 0.9x n/a n/a n/a 14.4%
IBM IBM $191,208.5 $228,089.5 $98,267.0 49.1% 25.6% -4.0% 2.3x 9.1x 2.3x 8.0x 4.5%
Informatica Corporation INFA $3,482.6 $2,796.4 $1,005.2 83.0% 18.4% 16.6% 2.8x 15.2x 2.5x 9.8x -22.1%
Microsoft Corporation MSFT $355,631.9 $293,905.9 $86,833.0 69.0% 37.0% 11.5% 3.4x 9.1x 3.0x 8.5x 17.8%
NetApp, Inc. NTAP $12,564.7 $8,556.9 $6,298.1 62.7% 16.4% -1.7% 1.4x 8.3x 1.4x 6.3x -2.7%
Oracle Corporation ORCL $179,933.0 $165,850.0 $38,275.0 61.3% 43.7% 2.9% 4.3x 9.9x 4.1x 8.1x 7.7%
Splunk, Inc. SPLK $5,575.1 $4,748.1 $366.0 86.7% -40.8% 51.6% 13.0x n/a 10.8x n/a -34.2%
TIBCO Software Inc. TIBX $3,197.6 $3,164.7 $1,091.5 71.0% 18.0% 5.4% 2.9x 16.1x 2.8x 11.8x -16.6%
Varonis Systems, Inc. VRNS $515.5 $389.7 $86.3 90.5% -14.0% 38.0% 4.5x n/a 3.9x n/a -52.1%
Median: $9,069.9 $6,652.5 $3,342.9 70.0% 20.7% 4.2% 2.7x 9.5x 2.6x 8.0x 0.9%
TTM Revenue Growth 4.2%
TTM EBITDA Growth 3.1%
TTM Earnings Growth 0.6%
Gross Profit Margin 70.0%
EBITDA Margin 20.7%
Net Income Margin 10.7%
SG&A Expenses as a % of Total Revenue 34.4%
R&D Expenses as a % of Total Revenue 14.0%
Current Ratio 2.4
Quick Ratio 2.2
Cash as Percent of Market Cap 22.5%
Avg Days Outstanding: Accounts Receivable 70
Avg Days Outstanding: Accounts Payable 41
Working Capital to TTM Operating Expense Ratio 0.6x
Levered FCF Margin 16.3%
Cash from Operations Growth (YoY) 0.2%
Cash from Investing Growth (YoY) 14.4%
Cash from Financing Growth (YoY) 47.1%
Levered FCF Growth (YoY) 1.8%
Copyright © 2014 by Software Equity Group, L.L.C., All Rights Reserved
Income Statement Analysis (Median)
Balance Sheet Analysis (Median)
Cash Flow Statement Analysis (Median)
August 2014 Monthly Flash Report
-15%
-10%
-5%
0%
5%
10%
Storage, Data Management & Integration Software Stock Market Return: January - July 2014
Storage, Data Management & Integration S&P NASDAQ SEG SW Index
SEG Software Index Category: Supply Chain Management & Logistics
Company Name Ticker Market Cap EV
TTM
Revenue
TTM
Gross
Margin
TTM
EBITDA
Margin
TTM
Revenue
Growth EV/ Revenue
EV/
EBITDA
Forward
EV/ Revenue
Forward
EV/
EBITDA YTD
American Software, Inc. AMSW.A $263.0 $192.4 $102.1 56.9% 15.9% 4.4% 1.9x 11.9x 1.8x 8.7x -4.2%
Aspen Technology, Inc. AZPN $3,999.6 $3,742.8 $391.5 86.5% 34.0% 25.7% 9.6x 28.1x 8.9x 23.6x 4.5%
Manhattan Associates, Inc. MANH $2,204.8 $2,103.4 $451.5 57.0% 27.4% 15.7% 4.7x 17.0x 4.3x 14.4x -0.1%
The Descartes Systems Group Inc. TSX:DSG $1,013.5 $990.0 $162.6 67.6% 28.7% 17.2% 6.1x 21.2x 5.6x 18.4x 2.7%
Median: $1,609.1 $1,546.7 $277.0 62.3% 28.1% 16.4% 5.4x 19.1x 4.9x 16.4x 1.3%
TTM Revenue Growth 16.4%
TTM EBITDA Growth 26.3%
TTM Earnings Growth 20.1%
Gross Profit Margin 62.3%
EBITDA Margin 28.1%
Net Income Margin 13.4%
SG&A Expenses as a % of Total Revenue 28.2%
R&D Expenses as a % of Total Revenue 13.5%
Current Ratio 2.3
Quick Ratio 2.1
Cash as Percent of Market Cap 10.3%
Avg Days Outstanding: Accounts Receivable 54
Avg Days Outstanding: Accounts Payable 12
Working Capital to TTM Operating Expense Ratio 0.4x
Levered FCF Margin 21.6%
Cash from Operations Growth (YoY) 8.7%
Cash from Investing Growth (YoY) -20.0%
Cash from Financing Growth (YoY) 27.0%
Levered FCF Growth (YoY) 39.0%
Copyright © 2014 by Software Equity Group, L.L.C., All Rights Reserved August 2014 Monthly Flash Report
Income Statement Analysis (Median)
Balance Sheet Analysis (Median)
Cash Flow Statement Analysis (Median)
-10%
-5%
0%
5%
10%
15%
Supply Chain Management & Logistics Software Stock Market Return: January - July 2014
Supply Chain Management & Logistics S&P NASDAQ SEG SW Index

SEG Software Index Category: Systems Management
Company Name Ticker Market Cap EV
TTM
Revenue
TTM
Gross
Margin
TTM
EBITDA
Margin
TTM
Revenue
Growth EV/ Revenue
EV/
EBITDA
Forward
EV/ Revenue
Forward
EV/
EBITDA YTD
CA Technologies CA $12,853.4 $11,502.4 $4,489.0 85.5% 31.7% -1.6% 2.6x 8.1x 2.6x 6.7x -11.5%
Citrix Systems, Inc. CTXS $11,098.4 $11,555.3 $3,047.5 85.5% 23.8% 9.4% 3.8x 15.9x 3.5x 11.3x 8.4%
Netscout Systems, Inc. NTCT $1,745.9 $1,568.1 $422.7 78.7% 24.6% 18.7% 3.7x 15.1x 3.4x 11.6x 47.5%
Red Hat, Inc. RHT $10,990.3 $10,187.1 $1,595.1 84.9% 19.2% 15.8% 6.4x 33.3x 5.6x 20.3x 4.1%
SolarWinds, Inc. SWI $3,103.0 $2,940.9 $382.4 90.3% 35.2% 29.3% 7.7x 21.9x 6.3x 12.6x 8.8%
VMWare, Inc. VMW $42,723.1 $37,586.1 $5,589.0 85.8% 26.0% 15.0% 6.7x 25.9x 5.8x 16.0x 11.0%
Median: $11,044.4 $10,844.7 $2,321.3 85.5% 25.3% 15.4% 5.1x 18.9x 4.5x 12.1x 8.6%
TTM Revenue Growth 15.4%
TTM EBITDA Growth 14.5%
TTM Earnings Growth 8.6%
Gross Profit Margin 85.5%
EBITDA Margin 25.3%
Net Income Margin 15.2%
SG&A Expenses as a % of Total Revenue 46.2%
R&D Expenses as a % of Total Revenue 16.6%
Current Ratio 1.2
Quick Ratio 1.1
Cash as Percent of Market Cap 8.8%
Avg Days Outstanding: Accounts Receivable 73
Avg Days Outstanding: Accounts Payable 52
Working Capital to TTM Operating Expense Ratio 0.2x
Levered FCF Margin 25.3%
Cash from Operations Growth (YoY) 16.4%
Cash from Investing Growth (YoY) -19.4%
Cash from Financing Growth (YoY) 45.9%
Levered FCF Growth (YoY) 28.1%
Copyright © 2014 by Software Equity Group, L.L.C., All Rights Reserved August 2014 Monthly Flash Report
Income Statement Analysis (Median)
Balance Sheet Analysis (Median)
Cash Flow Statement Analysis (Median)
-10%
-5%
0%
5%
10%
15%
Systems Management Software Stock Market Return: January - July 2014
Systems Management S&P NASDAQ SEG SW Index
SEG Software Index Category: Vertical - Finance
Company Name Ticker Market Cap EV
TTM
Revenue
TTM
Gross
Margin
TTM
EBITDA
Margin
TTM
Revenue
Growth EV/ Revenue
EV/
EBITDA
Forward
EV/ Revenue
Forward
EV/
EBITDA YTD
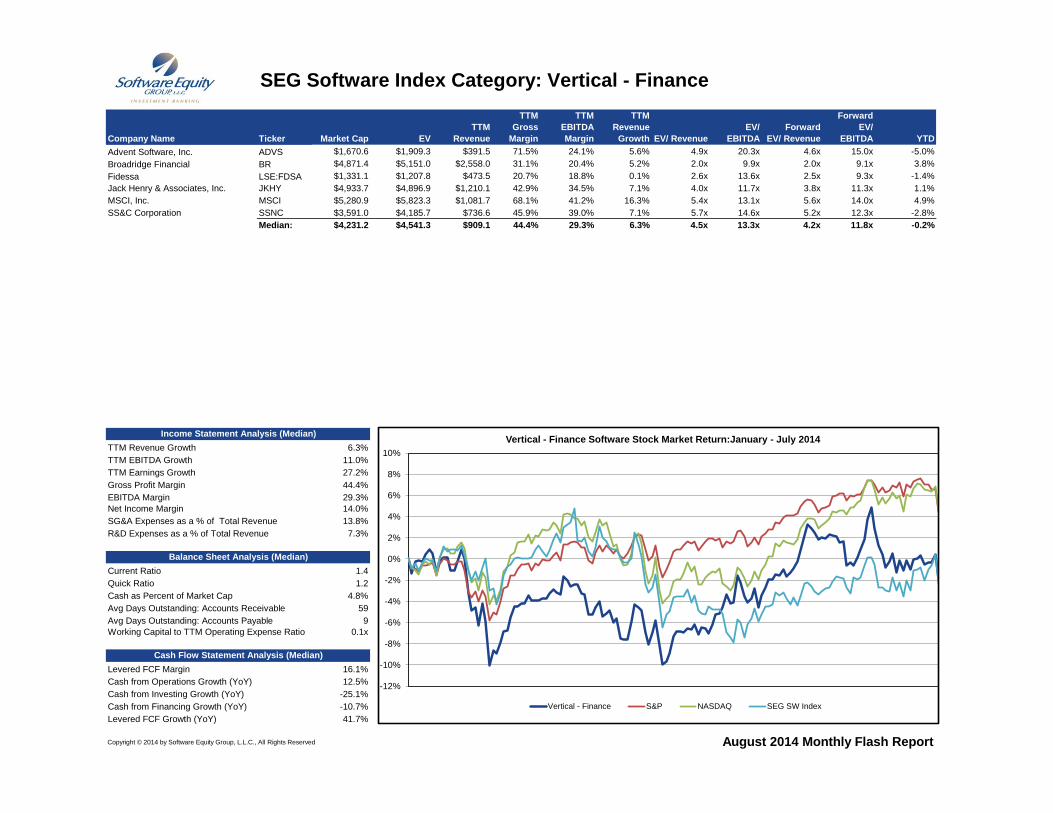
Advent Software, Inc. ADVS $1,670.6 $1,909.3 $391.5 71.5% 24.1% 5.6% 4.9x 20.3x 4.6x 15.0x -5.0%
Broadridge Financial BR $4,871.4 $5,151.0 $2,558.0 31.1% 20.4% 5.2% 2.0x 9.9x 2.0x 9.1x 3.8%
Fidessa LSE:FDSA $1,331.1 $1,207.8 $473.5 20.7% 18.8% 0.1% 2.6x 13.6x 2.5x 9.3x -1.4%
Jack Henry & Associates, Inc. JKHY $4,933.7 $4,896.9 $1,210.1 42.9% 34.5% 7.1% 4.0x 11.7x 3.8x 11.3x 1.1%
MSCI, Inc. MSCI $5,280.9 $5,823.3 $1,081.7 68.1% 41.2% 16.3% 5.4x 13.1x 5.6x 14.0x 4.9%
SS&C Corporation SSNC $3,591.0 $4,185.7 $736.6 45.9% 39.0% 7.1% 5.7x 14.6x 5.2x 12.3x -2.8%
Median: $4,231.2 $4,541.3 $909.1 44.4% 29.3% 6.3% 4.5x 13.3x 4.2x 11.8x -0.2%
TTM Revenue Growth 6.3%
TTM EBITDA Growth 11.0%
TTM Earnings Growth 27.2%
Gross Profit Margin 44.4%
EBITDA Margin 29.3%
Net Income Margin 14.0%
SG&A Expenses as a % of Total Revenue 13.8%
R&D Expenses as a % of Total Revenue 7.3%
Current Ratio 1.4
Quick Ratio 1.2
Cash as Percent of Market Cap 4.8%
Avg Days Outstanding: Accounts Receivable 59
Avg Days Outstanding: Accounts Payable 9
Working Capital to TTM Operating Expense Ratio 0.1x
Levered FCF Margin 16.1%
Cash from Operations Growth (YoY) 12.5%
Cash from Investing Growth (YoY) -25.1%
Cash from Financing Growth (YoY) -10.7%
Levered FCF Growth (YoY) 41.7%
Copyright © 2014 by Software Equity Group, L.L.C., All Rights Reserved
Cash Flow Statement Analysis (Median)
August 2014 Monthly Flash Report
Income Statement Analysis (Median)
Balance Sheet Analysis (Median)
-12%
-10%
-8%
-6%
-4%
-2%
0%
2%
4%
6%
8%
10%
Vertical - Finance Software Stock Market Return:January - July 2014
Vertical - Finance S&P NASDAQ SEG SW Index
SEG Software Index Category: Vertical - Other
Company Name Ticker Market Cap EV
TTM
Revenue
TTM
Gross
Margin
TTM
EBITDA
Margin
TTM
Revenue
Growth EV/ Revenue
EV/
EBITDA
Forward
EV/ Revenue
Forward
EV/
EBITDA YTD
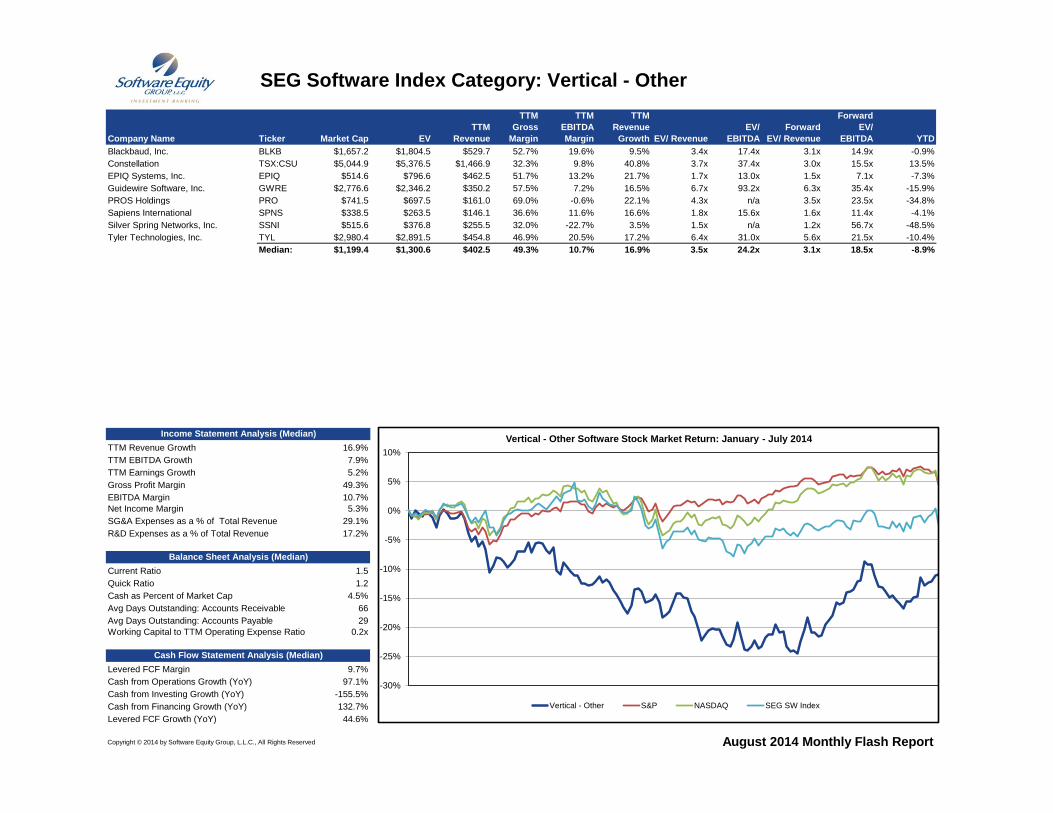
Blackbaud, Inc. BLKB $1,657.2 $1,804.5 $529.7 52.7% 19.6% 9.5% 3.4x 17.4x 3.1x 14.9x -0.9%
Constellation TSX:CSU $5,044.9 $5,376.5 $1,466.9 32.3% 9.8% 40.8% 3.7x 37.4x 3.0x 15.5x 13.5%
EPIQ Systems, Inc. EPIQ $514.6 $796.6 $462.5 51.7% 13.2% 21.7% 1.7x 13.0x 1.5x 7.1x -7.3%
Guidewire Software, Inc. GWRE $2,776.6 $2,346.2 $350.2 57.5% 7.2% 16.5% 6.7x 93.2x 6.3x 35.4x -15.9%
PROS Holdings PRO $741.5 $697.5 $161.0 69.0% -0.6% 22.1% 4.3x n/a 3.5x 23.5x -34.8%
Sapiens International SPNS $338.5 $263.5 $146.1 36.6% 11.6% 16.6% 1.8x 15.6x 1.6x 11.4x -4.1%
Silver Spring Networks, Inc. SSNI $515.6 $376.8 $255.5 32.0% -22.7% 3.5% 1.5x n/a 1.2x 56.7x -48.5%
Tyler Technologies, Inc. TYL $2,980.4 $2,891.5 $454.8 46.9% 20.5% 17.2% 6.4x 31.0x 5.6x 21.5x -10.4%
Median: $1,199.4 $1,300.6 $402.5 49.3% 10.7% 16.9% 3.5x 24.2x 3.1x 18.5x -8.9%
TTM Revenue Growth 16.9%
TTM EBITDA Growth 7.9%
TTM Earnings Growth 5.2%
Gross Profit Margin 49.3%
EBITDA Margin 10.7%
Net Income Margin 5.3%
SG&A Expenses as a % of Total Revenue 29.1%
R&D Expenses as a % of Total Revenue 17.2%
Current Ratio 1.5
Quick Ratio 1.2
Cash as Percent of Market Cap 4.5%
Avg Days Outstanding: Accounts Receivable 66
Avg Days Outstanding: Accounts Payable 29
Working Capital to TTM Operating Expense Ratio 0.2x
Levered FCF Margin 9.7%
Cash from Operations Growth (YoY) 97.1%
Cash from Investing Growth (YoY) -155.5%
Cash from Financing Growth (YoY) 132.7%
Levered FCF Growth (YoY) 44.6%
Copyright © 2014 by Software Equity Group, L.L.C., All Rights Reserved August 2014 Monthly Flash Report
Balance Sheet Analysis (Median)
Cash Flow Statement Analysis (Median)
Income Statement Analysis (Median)
-30%
-25%
-20%
-15%
-10%
-5%
0%
5%
10%
Vertical - Other Software Stock Market Return: January - July 2014
Vertical - Other S&P NASDAQ SEG SW Index
Copyright © 2014 by Software Equity Group, L.L.C., All Rights Reserved
SEG Software Index
Select Software Industry M&A Transactions
SEG SaaS Index
SEG Internet Index
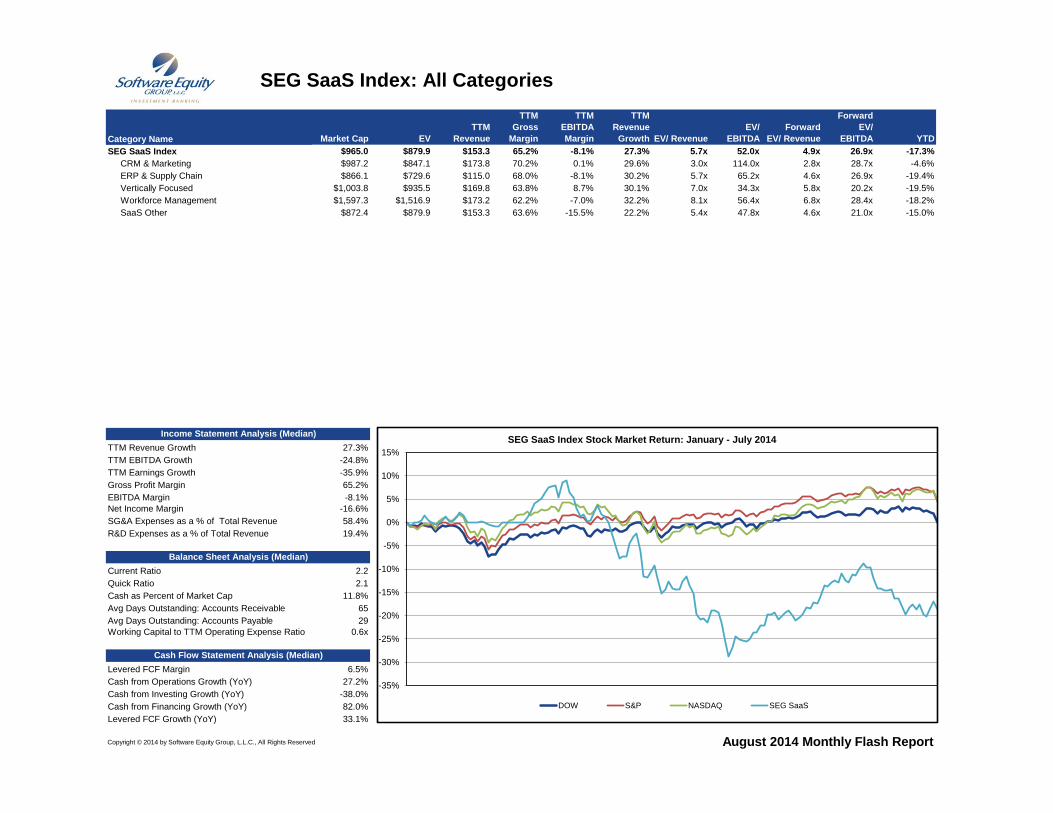
SEG SaaS Index: All Categories
Market Cap EV
TTM
Revenue
TTM
Gross
Margin
TTM
EBITDA
Margin
TTM
Revenue
Growth EV/ Revenue
EV/
EBITDA
Forward
EV/ Revenue
Forward
EV/
EBITDA YTD
SEG SaaS Index $965.0 $879.9 $153.3 65.2% -8.1% 27.3% 5.7x 52.0x 4.9x 26.9x -17.3%
CRM & Marketing $987.2 $847.1 $173.8 70.2% 0.1% 29.6% 3.0x 114.0x 2.8x 28.7x -4.6%
ERP & Supply Chain $866.1 $729.6 $115.0 68.0% -8.1% 30.2% 5.7x 65.2x 4.6x 26.9x -19.4%
Vertically Focused $1,003.8 $935.5 $169.8 63.8% 8.7% 30.1% 7.0x 34.3x 5.8x 20.2x -19.5%
Workforce Management $1,597.3 $1,516.9 $173.2 62.2% -7.0% 32.2% 8.1x 56.4x 6.8x 28.4x -18.2%
SaaS Other $872.4 $879.9 $153.3 63.6% -15.5% 22.2% 5.4x 47.8x 4.6x 21.0x -15.0%
TTM Revenue Growth 27.3%
TTM EBITDA Growth -24.8%
TTM Earnings Growth -35.9%
Gross Profit Margin 65.2%
EBITDA Margin -8.1%
Net Income Margin -16.6%
SG&A Expenses as a % of Total Revenue 58.4%
R&D Expenses as a % of Total Revenue 19.4%
Current Ratio 2.2
Quick Ratio 2.1
Cash as Percent of Market Cap 11.8%
Avg Days Outstanding: Accounts Receivable 65
Avg Days Outstanding: Accounts Payable 29
Working Capital to TTM Operating Expense Ratio 0.6x
Levered FCF Margin 6.5%
Cash from Operations Growth (YoY) 27.2%
Cash from Investing Growth (YoY) -38.0%
Cash from Financing Growth (YoY) 82.0%
Levered FCF Growth (YoY) 33.1%
Copyright © 2014 by Software Equity Group, L.L.C., All Rights Reserved August 2014 Monthly Flash Report
Category Name
Income Statement Analysis (Median)
Balance Sheet Analysis (Median)
Cash Flow Statement Analysis (Median)
-35%
-30%
-25%
-20%
-15%
-10%
-5%
0%
5%
10%
15%
SEG SaaS Index Stock Market Return: January - July 2014
DOW S&P NASDAQ SEG SaaS
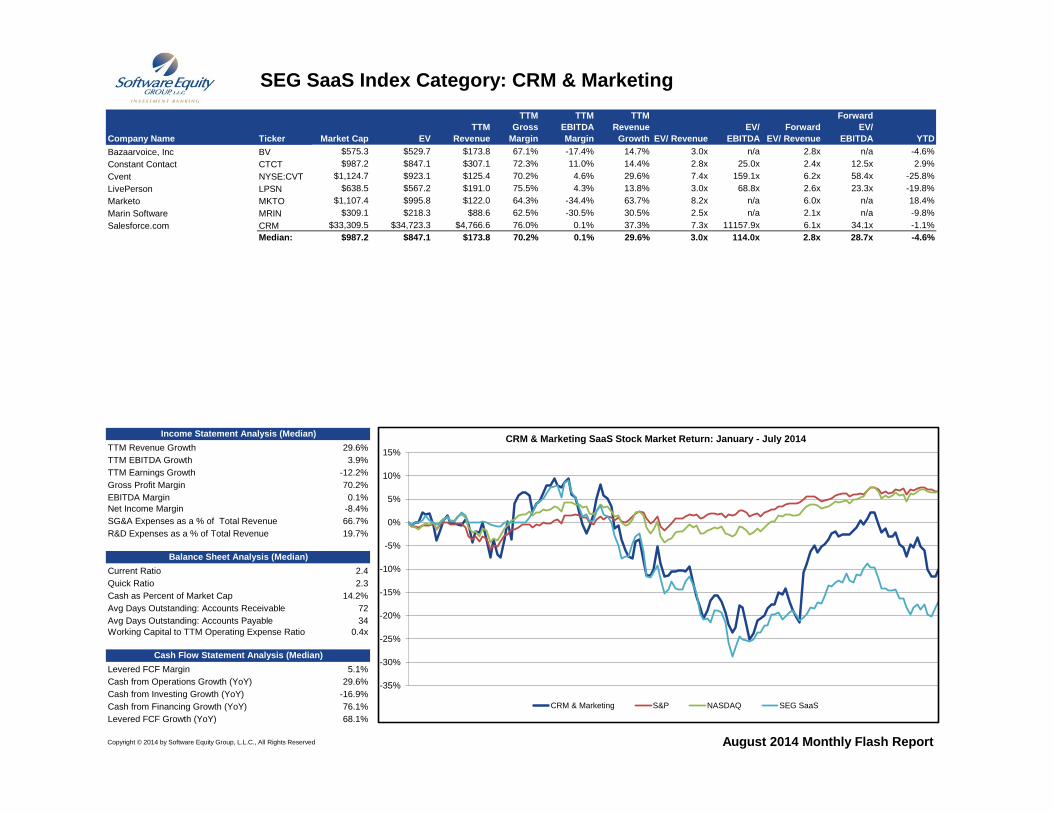
SEG SaaS Index Category: CRM & Marketing
Company Name Ticker Market Cap EV
TTM
Revenue
TTM
Gross
Margin
TTM
EBITDA
Margin
TTM
Revenue
Growth EV/ Revenue
EV/
EBITDA
Forward
EV/ Revenue
Forward
EV/
EBITDA YTD
Bazaarvoice, Inc BV $575.3 $529.7 $173.8 67.1% -17.4% 14.7% 3.0x n/a 2.8x n/a -4.6%
Constant Contact CTCT $987.2 $847.1 $307.1 72.3% 11.0% 14.4% 2.8x 25.0x 2.4x 12.5x 2.9%
Cvent NYSE:CVT $1,124.7 $923.1 $125.4 70.2% 4.6% 29.6% 7.4x 159.1x 6.2x 58.4x -25.8%
LivePerson LPSN $638.5 $567.2 $191.0 75.5% 4.3% 13.8% 3.0x 68.8x 2.6x 23.3x -19.8%
Marketo MKTO $1,107.4 $995.8 $122.0 64.3% -34.4% 63.7% 8.2x n/a 6.0x n/a 18.4%
Marin Software MRIN $309.1 $218.3 $88.6 62.5% -30.5% 30.5% 2.5x n/a 2.1x n/a -9.8%
Salesforce.com CRM $33,309.5 $34,723.3 $4,766.6 76.0% 0.1% 37.3% 7.3x 11157.9x 6.1x 34.1x -1.1%
Median: $987.2 $847.1 $173.8 70.2% 0.1% 29.6% 3.0x 114.0x 2.8x 28.7x -4.6%
TTM Revenue Growth 29.6%
TTM EBITDA Growth 3.9%
TTM Earnings Growth -12.2%
Gross Profit Margin 70.2%
EBITDA Margin 0.1%
Net Income Margin -8.4%
SG&A Expenses as a % of Total Revenue 66.7%
R&D Expenses as a % of Total Revenue 19.7%
Current Ratio 2.4
Quick Ratio 2.3
Cash as Percent of Market Cap 14.2%
Avg Days Outstanding: Accounts Receivable 72
Avg Days Outstanding: Accounts Payable 34
Working Capital to TTM Operating Expense Ratio 0.4x
Levered FCF Margin 5.1%
Cash from Operations Growth (YoY) 29.6%
Cash from Investing Growth (YoY) -16.9%
Cash from Financing Growth (YoY) 76.1%
Levered FCF Growth (YoY) 68.1%
Copyright © 2014 by Software Equity Group, L.L.C., All Rights Reserved
Cash Flow Statement Analysis (Median)
August 2014 Monthly Flash Report
Income Statement Analysis (Median)
Balance Sheet Analysis (Median)
-35%
-30%
-25%
-20%
-15%
-10%
-5%
0%
5%
10%
15%
CRM & Marketing SaaS Stock Market Return: January - July 2014
CRM & Marketing S&P NASDAQ SEG SaaS
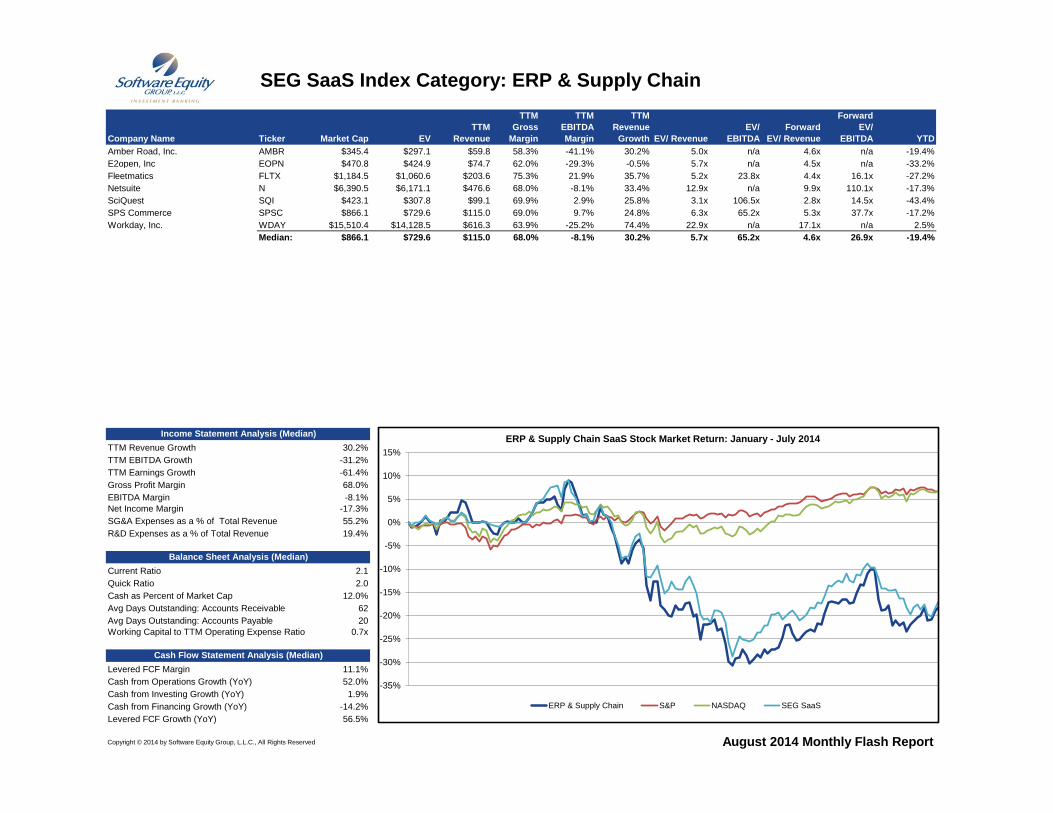
SEG SaaS Index Category: ERP & Supply Chain
Company Name Ticker Market Cap EV
TTM
Revenue
TTM
Gross
Margin
TTM
EBITDA
Margin
TTM
Revenue
Growth EV/ Revenue
EV/
EBITDA
Forward
EV/ Revenue
Forward
EV/
EBITDA YTD
Amber Road, Inc. AMBR $345.4 $297.1 $59.8 58.3% -41.1% 30.2% 5.0x n/a 4.6x n/a -19.4%
E2open, Inc EOPN $470.8 $424.9 $74.7 62.0% -29.3% -0.5% 5.7x n/a 4.5x n/a -33.2%
Fleetmatics FLTX $1,184.5 $1,060.6 $203.6 75.3% 21.9% 35.7% 5.2x 23.8x 4.4x 16.1x -27.2%
Netsuite N $6,390.5 $6,171.1 $476.6 68.0% -8.1% 33.4% 12.9x n/a 9.9x 110.1x -17.3%
SciQuest SQI $423.1 $307.8 $99.1 69.9% 2.9% 25.8% 3.1x 106.5x 2.8x 14.5x -43.4%
SPS Commerce SPSC $866.1 $729.6 $115.0 69.0% 9.7% 24.8% 6.3x 65.2x 5.3x 37.7x -17.2%
Workday, Inc. WDAY $15,510.4 $14,128.5 $616.3 63.9% -25.2% 74.4% 22.9x n/a 17.1x n/a 2.5%
Median: $866.1 $729.6 $115.0 68.0% -8.1% 30.2% 5.7x 65.2x 4.6x 26.9x -19.4%
TTM Revenue Growth 30.2%
TTM EBITDA Growth -31.2%
TTM Earnings Growth -61.4%
Gross Profit Margin 68.0%
EBITDA Margin -8.1%
Net Income Margin -17.3%
SG&A Expenses as a % of Total Revenue 55.2%
R&D Expenses as a % of Total Revenue 19.4%
Current Ratio 2.1
Quick Ratio 2.0
Cash as Percent of Market Cap 12.0%
Avg Days Outstanding: Accounts Receivable 62
Avg Days Outstanding: Accounts Payable 20
Working Capital to TTM Operating Expense Ratio 0.7x
Levered FCF Margin 11.1%
Cash from Operations Growth (YoY) 52.0%
Cash from Investing Growth (YoY) 1.9%
Cash from Financing Growth (YoY) -14.2%
Levered FCF Growth (YoY) 56.5%
Copyright © 2014 by Software Equity Group, L.L.C., All Rights Reserved
Cash Flow Statement Analysis (Median)
August 2014 Monthly Flash Report
Income Statement Analysis (Median)
Balance Sheet Analysis (Median)
-35%
-30%
-25%
-20%
-15%
-10%
-5%
0%
5%
10%
15%
ERP & Supply Chain SaaS Stock Market Return: January - July 2014
ERP & Supply Chain S&P NASDAQ SEG SaaS
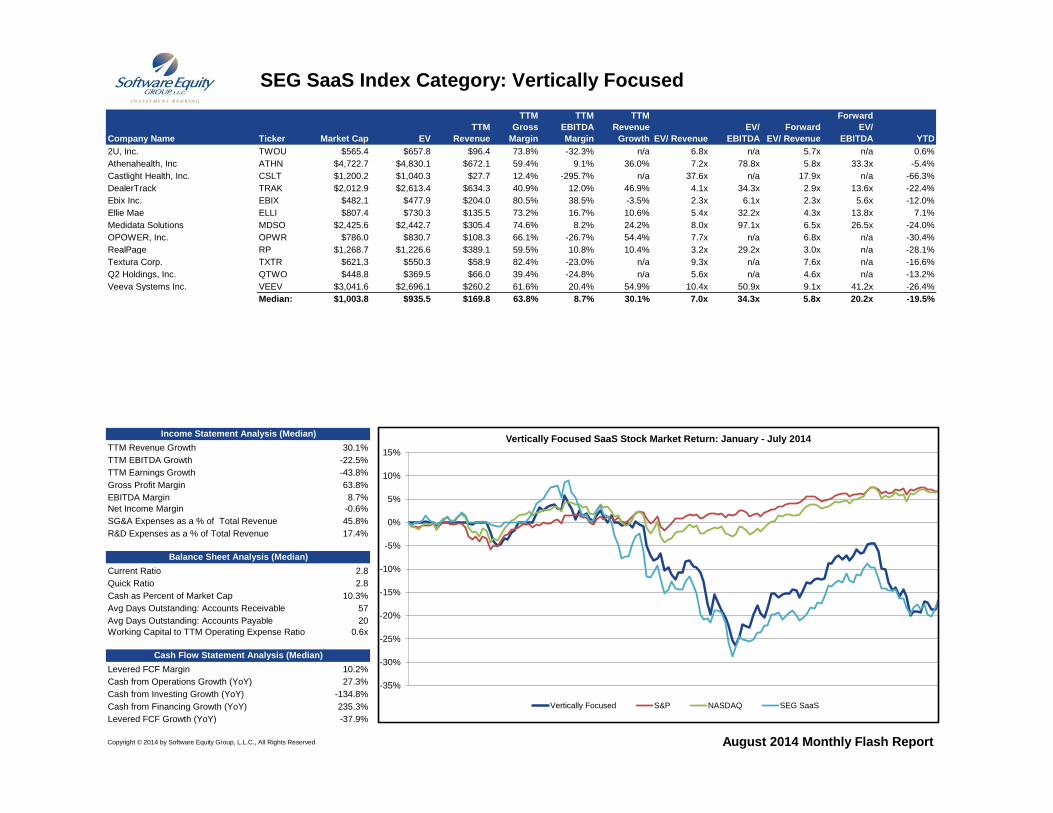
SEG SaaS Index Category: Vertically Focused
Company Name Ticker Market Cap EV
TTM
Revenue
TTM
Gross
Margin
TTM
EBITDA
Margin
TTM
Revenue
Growth EV/ Revenue
EV/
EBITDA
Forward
EV/ Revenue
Forward
EV/
EBITDA YTD
2U, Inc. TWOU $565.4 $657.8 $96.4 73.8% -32.3% n/a 6.8x n/a 5.7x n/a 0.6%
Athenahealth, Inc ATHN $4,722.7 $4,830.1 $672.1 59.4% 9.1% 36.0% 7.2x 78.8x 5.8x 33.3x -5.4%
Castlight Health, Inc. CSLT $1,200.2 $1,040.3 $27.7 12.4% -295.7% n/a 37.6x n/a 17.9x n/a -66.3%
DealerTrack TRAK $2,012.9 $2,613.4 $634.3 40.9% 12.0% 46.9% 4.1x 34.3x 2.9x 13.6x -22.4%
Ebix Inc. EBIX $482.1 $477.9 $204.0 80.5% 38.5% -3.5% 2.3x 6.1x 2.3x 5.6x -12.0%
Ellie Mae ELLI $807.4 $730.3 $135.5 73.2% 16.7% 10.6% 5.4x 32.2x 4.3x 13.8x 7.1%
Medidata Solutions MDSO $2,425.6 $2,442.7 $305.4 74.6% 8.2% 24.2% 8.0x 97.1x 6.5x 26.5x -24.0%
OPOWER, Inc. OPWR $786.0 $830.7 $108.3 66.1% -26.7% 54.4% 7.7x n/a 6.8x n/a -30.4%
RealPage RP $1,268.7 $1,226.6 $389.1 59.5% 10.8% 10.4% 3.2x 29.2x 3.0x n/a -28.1%
Textura Corp. TXTR $621.3 $550.3 $58.9 82.4% -23.0% n/a 9.3x n/a 7.6x n/a -16.6%
Q2 Holdings, Inc. QTWO $448.8 $369.5 $66.0 39.4% -24.8% n/a 5.6x n/a 4.6x n/a -13.2%
Veeva Systems Inc. VEEV $3,041.6 $2,696.1 $260.2 61.6% 20.4% 54.9% 10.4x 50.9x 9.1x 41.2x -26.4%
Median: $1,003.8 $935.5 $169.8 63.8% 8.7% 30.1% 7.0x 34.3x 5.8x 20.2x -19.5%
TTM Revenue Growth 30.1%
TTM EBITDA Growth -22.5%
TTM Earnings Growth -43.8%
Gross Profit Margin 63.8%
EBITDA Margin 8.7%
Net Income Margin -0.6%
SG&A Expenses as a % of Total Revenue 45.8%
R&D Expenses as a % of Total Revenue 17.4%
Current Ratio 2.8
Quick Ratio 2.8
Cash as Percent of Market Cap 10.3%
Avg Days Outstanding: Accounts Receivable 57
Avg Days Outstanding: Accounts Payable 20
Working Capital to TTM Operating Expense Ratio 0.6x
Levered FCF Margin 10.2%
Cash from Operations Growth (YoY) 27.3%
Cash from Investing Growth (YoY) -134.8%
Cash from Financing Growth (YoY) 235.3%
Levered FCF Growth (YoY) -37.9%
Copyright © 2014 by Software Equity Group, L.L.C., All Rights Reserved
Cash Flow Statement Analysis (Median)
August 2014 Monthly Flash Report
Income Statement Analysis (Median)
Balance Sheet Analysis (Median)
-35%
-30%
-25%
-20%
-15%
-10%
-5%
0%
5%
10%
15%
Vertically Focused SaaS Stock Market Return: January - July 2014
Vertically Focused S&P NASDAQ SEG SaaS
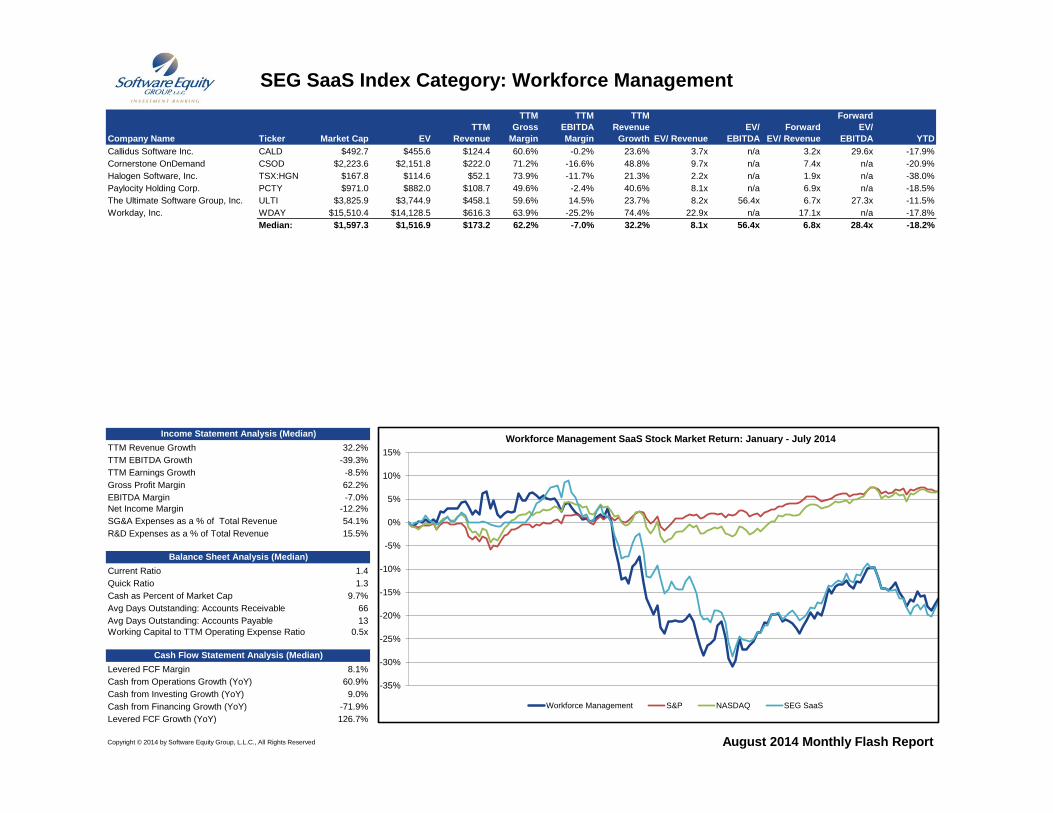
SEG SaaS Index Category: Workforce Management
Company Name Ticker Market Cap EV
TTM
Revenue
TTM
Gross
Margin
TTM
EBITDA
Margin
TTM
Revenue
Growth EV/ Revenue
EV/
EBITDA
Forward
EV/ Revenue
Forward
EV/
EBITDA YTD
Callidus Software Inc. CALD $492.7 $455.6 $124.4 60.6% -0.2% 23.6% 3.7x n/a 3.2x 29.6x -17.9%
Cornerstone OnDemand CSOD $2,223.6 $2,151.8 $222.0 71.2% -16.6% 48.8% 9.7x n/a 7.4x n/a -20.9%
Halogen Software, Inc. TSX:HGN $167.8 $114.6 $52.1 73.9% -11.7% 21.3% 2.2x n/a 1.9x n/a -38.0%
Paylocity Holding Corp. PCTY $971.0 $882.0 $108.7 49.6% -2.4% 40.6% 8.1x n/a 6.9x n/a -18.5%
The Ultimate Software Group, Inc. ULTI $3,825.9 $3,744.9 $458.1 59.6% 14.5% 23.7% 8.2x 56.4x 6.7x 27.3x -11.5%
Workday, Inc. WDAY $15,510.4 $14,128.5 $616.3 63.9% -25.2% 74.4% 22.9x n/a 17.1x n/a -17.8%
Median: $1,597.3 $1,516.9 $173.2 62.2% -7.0% 32.2% 8.1x 56.4x 6.8x 28.4x -18.2%
TTM Revenue Growth 32.2%
TTM EBITDA Growth -39.3%
TTM Earnings Growth -8.5%
Gross Profit Margin 62.2%
EBITDA Margin -7.0%
Net Income Margin -12.2%
SG&A Expenses as a % of Total Revenue 54.1%
R&D Expenses as a % of Total Revenue 15.5%
Current Ratio 1.4
Quick Ratio 1.3
Cash as Percent of Market Cap 9.7%
Avg Days Outstanding: Accounts Receivable 66
Avg Days Outstanding: Accounts Payable 13
Working Capital to TTM Operating Expense Ratio 0.5x
Levered FCF Margin 8.1%
Cash from Operations Growth (YoY) 60.9%
Cash from Investing Growth (YoY) 9.0%
Cash from Financing Growth (YoY) -71.9%
Levered FCF Growth (YoY) 126.7%
Copyright © 2014 by Software Equity Group, L.L.C., All Rights Reserved
Cash Flow Statement Analysis (Median)
August 2014 Monthly Flash Report
Income Statement Analysis (Median)
Balance Sheet Analysis (Median)
-35%
-30%
-25%
-20%
-15%
-10%
-5%
0%
5%
10%
15%
Workforce Management SaaS Stock Market Return: January - July 2014
Workforce Management S&P NASDAQ SEG SaaS
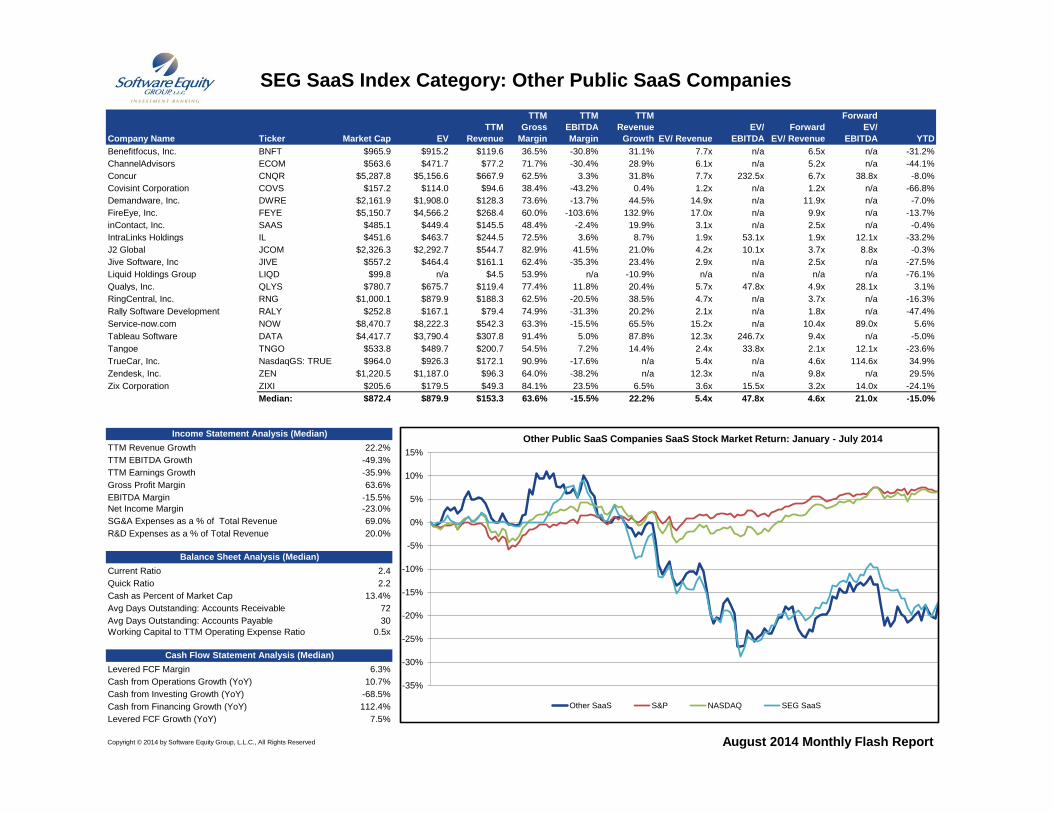
SEG SaaS Index Category: Other Public SaaS Companies
Company Name Ticker Market Cap EV
TTM
Revenue
TTM
Gross
Margin
TTM
EBITDA
Margin
TTM
Revenue
Growth EV/ Revenue
EV/
EBITDA
Forward
EV/ Revenue
Forward
EV/
EBITDA YTD
Benefitfocus, Inc. BNFT $965.9 $915.2 $119.6 36.5% -30.8% 31.1% 7.7x n/a 6.5x n/a -31.2%
ChannelAdvisors ECOM $563.6 $471.7 $77.2 71.7% -30.4% 28.9% 6.1x n/a 5.2x n/a -44.1%
Concur CNQR $5,287.8 $5,156.6 $667.9 62.5% 3.3% 31.8% 7.7x 232.5x 6.7x 38.8x -8.0%
Covisint Corporation COVS $157.2 $114.0 $94.6 38.4% -43.2% 0.4% 1.2x n/a 1.2x n/a -66.8%
Demandware, Inc. DWRE $2,161.9 $1,908.0 $128.3 73.6% -13.7% 44.5% 14.9x n/a 11.9x n/a -7.0%
FireEye, Inc. FEYE $5,150.7 $4,566.2 $268.4 60.0% -103.6% 132.9% 17.0x n/a 9.9x n/a -13.7%
inContact, Inc. SAAS $485.1 $449.4 $145.5 48.4% -2.4% 19.9% 3.1x n/a 2.5x n/a -0.4%
IntraLinks Holdings IL $451.6 $463.7 $244.5 72.5% 3.6% 8.7% 1.9x 53.1x 1.9x 12.1x -33.2%
J2 Global JCOM $2,326.3 $2,292.7 $544.7 82.9% 41.5% 21.0% 4.2x 10.1x 3.7x 8.8x -0.3%
Jive Software, Inc JIVE $557.2 $464.4 $161.1 62.4% -35.3% 23.4% 2.9x n/a 2.5x n/a -27.5%
Liquid Holdings Group LIQD $99.8 n/a $4.5 53.9% n/a -10.9% n/a n/a n/a n/a -76.1%
Qualys, Inc. QLYS $780.7 $675.7 $119.4 77.4% 11.8% 20.4% 5.7x 47.8x 4.9x 28.1x 3.1%
RingCentral, Inc. RNG $1,000.1 $879.9 $188.3 62.5% -20.5% 38.5% 4.7x n/a 3.7x n/a -16.3%
Rally Software Development RALY $252.8 $167.1 $79.4 74.9% -31.3% 20.2% 2.1x n/a 1.8x n/a -47.4%
Service-now.com NOW $8,470.7 $8,222.3 $542.3 63.3% -15.5% 65.5% 15.2x n/a 10.4x 89.0x 5.6%
Tableau Software DATA $4,417.7 $3,790.4 $307.8 91.4% 5.0% 87.8% 12.3x 246.7x 9.4x n/a -5.0%
Tangoe TNGO $533.8 $489.7 $200.7 54.5% 7.2% 14.4% 2.4x 33.8x 2.1x 12.1x -23.6%
TrueCar, Inc. NasdaqGS: TRUE $964.0 $926.3 $172.1 90.9% -17.6% n/a 5.4x n/a 4.6x 114.6x 34.9%
Zendesk, Inc. ZEN $1,220.5 $1,187.0 $96.3 64.0% -38.2% n/a 12.3x n/a 9.8x n/a 29.5%
Zix Corporation ZIXI $205.6 $179.5 $49.3 84.1% 23.5% 6.5% 3.6x 15.5x 3.2x 14.0x -24.1%
Median: $872.4 $879.9 $153.3 63.6% -15.5% 22.2% 5.4x 47.8x 4.6x 21.0x -15.0%
TTM Revenue Growth 22.2%
TTM EBITDA Growth -49.3%
TTM Earnings Growth -35.9%
Gross Profit Margin 63.6%
EBITDA Margin -15.5%
Net Income Margin -23.0%
SG&A Expenses as a % of Total Revenue 69.0%
R&D Expenses as a % of Total Revenue 20.0%
Current Ratio 2.4
Quick Ratio 2.2
Cash as Percent of Market Cap 13.4%
Avg Days Outstanding: Accounts Receivable 72
Avg Days Outstanding: Accounts Payable 30
Working Capital to TTM Operating Expense Ratio 0.5x
Levered FCF Margin 6.3%
Cash from Operations Growth (YoY) 10.7%
Cash from Investing Growth (YoY) -68.5%
Cash from Financing Growth (YoY) 112.4%
Levered FCF Growth (YoY) 7.5%
Copyright © 2014 by Software Equity Group, L.L.C., All Rights Reserved
Cash Flow Statement Analysis (Median)
August 2014 Monthly Flash Report
Income Statement Analysis (Median)
Balance Sheet Analysis (Median)
-35%
-30%
-25%
-20%
-15%
-10%
-5%
0%
5%
10%
15%
Other Public SaaS Companies SaaS Stock Market Return: January - July 2014
Other SaaS S&P NASDAQ SEG SaaS
Copyright © 2014 by Software Equity Group, L.L.C., All Rights Reserved
SEG Software Index
Select Software Industry M&A Transactions
SEG SaaS Index
SEG Internet Index
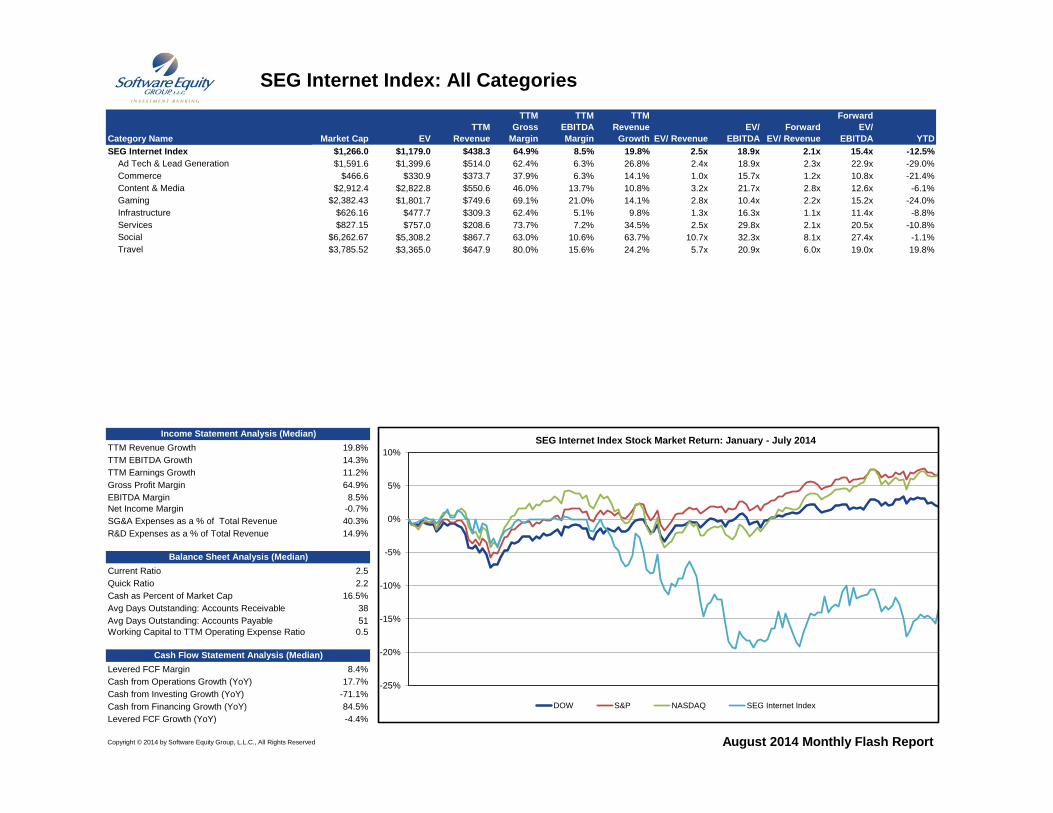
SEG Internet Index: All Categories
Category Name Market Cap EV
TTM
Revenue
TTM
Gross
Margin
TTM
EBITDA
Margin
TTM
Revenue
Growth EV/ Revenue
EV/
EBITDA
Forward
EV/ Revenue
Forward
EV/
EBITDA YTD
SEG Internet Index $1,266.0 $1,179.0 $438.3 64.9% 8.5% 19.8% 2.5x 18.9x 2.1x 15.4x -12.5%
Ad Tech & Lead Generation $1,591.6 $1,399.6 $514.0 62.4% 6.3% 26.8% 2.4x 18.9x 2.3x 22.9x -29.0%
Commerce $466.6 $330.9 $373.7 37.9% 6.3% 14.1% 1.0x 15.7x 1.2x 10.8x -21.4%
Content & Media $2,912.4 $2,822.8 $550.6 46.0% 13.7% 10.8% 3.2x 21.7x 2.8x 12.6x -6.1%
Gaming $2,382.43 $1,801.7 $749.6 69.1% 21.0% 14.1% 2.8x 10.4x 2.2x 15.2x -24.0%
Infrastructure $626.16 $477.7 $309.3 62.4% 5.1% 9.8% 1.3x 16.3x 1.1x 11.4x -8.8%
Services $827.15 $757.0 $208.6 73.7% 7.2% 34.5% 2.5x 29.8x 2.1x 20.5x -10.8%
Social $6,262.67 $5,308.2 $867.7 63.0% 10.6% 63.7% 10.7x 32.3x 8.1x 27.4x -1.1%
Travel $3,785.52 $3,365.0 $647.9 80.0% 15.6% 24.2% 5.7x 20.9x 6.0x 19.0x 19.8%
TTM Revenue Growth 19.8%
TTM EBITDA Growth 14.3%
TTM Earnings Growth 11.2%
Gross Profit Margin 64.9%
EBITDA Margin 8.5%
Net Income Margin -0.7%
SG&A Expenses as a % of Total Revenue 40.3%
R&D Expenses as a % of Total Revenue 14.9%
Current Ratio 2.5
Quick Ratio 2.2
Cash as Percent of Market Cap 16.5%
Avg Days Outstanding: Accounts Receivable 38
Avg Days Outstanding: Accounts Payable 51
Working Capital to TTM Operating Expense Ratio 0.5
Levered FCF Margin 8.4%
Cash from Operations Growth (YoY) 17.7%
Cash from Investing Growth (YoY) -71.1%
Cash from Financing Growth (YoY) 84.5%
Levered FCF Growth (YoY) -4.4%
Copyright © 2014 by Software Equity Group, L.L.C., All Rights Reserved August 2014 Monthly Flash Report
Income Statement Analysis (Median)
Balance Sheet Analysis (Median)
Cash Flow Statement Analysis (Median)
-25%
-20%
-15%
-10%
-5%
0%
5%
10%
SEG Internet Index Stock Market Return: January - July 2014
DOW S&P NASDAQ SEG Internet Index
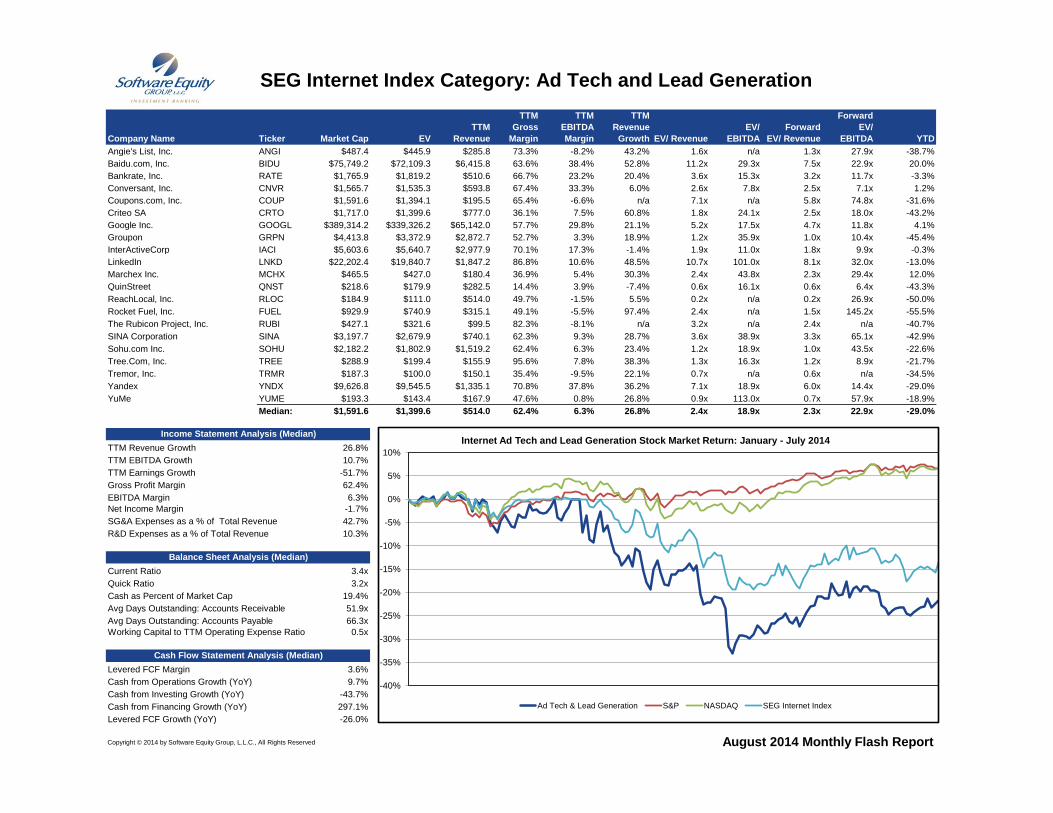
SEG Internet Index Category: Ad Tech and Lead Generation
Company Name Ticker Market Cap EV
TTM
Revenue
TTM
Gross
Margin
TTM
EBITDA
Margin
TTM
Revenue
Growth EV/ Revenue
EV/
EBITDA
Forward
EV/ Revenue
Forward
EV/
EBITDA YTD
Angie's List, Inc. ANGI $487.4 $445.9 $285.8 73.3% -8.2% 43.2% 1.6x n/a 1.3x 27.9x -38.7%
Baidu.com, Inc. BIDU $75,749.2 $72,109.3 $6,415.8 63.6% 38.4% 52.8% 11.2x 29.3x 7.5x 22.9x 20.0%
Bankrate, Inc. RATE $1,765.9 $1,819.2 $510.6 66.7% 23.2% 20.4% 3.6x 15.3x 3.2x 11.7x -3.3%
Conversant, Inc. CNVR $1,565.7 $1,535.3 $593.8 67.4% 33.3% 6.0% 2.6x 7.8x 2.5x 7.1x 1.2%
Coupons.com, Inc. COUP $1,591.6 $1,394.1 $195.5 65.4% -6.6% n/a 7.1x n/a 5.8x 74.8x -31.6%
Criteo SA CRTO $1,717.0 $1,399.6 $777.0 36.1% 7.5% 60.8% 1.8x 24.1x 2.5x 18.0x -43.2%
Google Inc. GOOGL $389,314.2 $339,326.2 $65,142.0 57.7% 29.8% 21.1% 5.2x 17.5x 4.7x 11.8x 4.1%
Groupon GRPN $4,413.8 $3,372.9 $2,872.7 52.7% 3.3% 18.9% 1.2x 35.9x 1.0x 10.4x -45.4%
InterActiveCorp IACI $5,603.6 $5,640.7 $2,977.9 70.1% 17.3% -1.4% 1.9x 11.0x 1.8x 9.9x -0.3%
LinkedIn LNKD $22,202.4 $19,840.7 $1,847.2 86.8% 10.6% 48.5% 10.7x 101.0x 8.1x 32.0x -13.0%
Marchex Inc. MCHX $465.5 $427.0 $180.4 36.9% 5.4% 30.3% 2.4x 43.8x 2.3x 29.4x 12.0%
QuinStreet QNST $218.6 $179.9 $282.5 14.4% 3.9% -7.4% 0.6x 16.1x 0.6x 6.4x -43.3%
ReachLocal, Inc. RLOC $184.9 $111.0 $514.0 49.7% -1.5% 5.5% 0.2x n/a 0.2x 26.9x -50.0%
Rocket Fuel, Inc. FUEL $929.9 $740.9 $315.1 49.1% -5.5% 97.4% 2.4x n/a 1.5x 145.2x -55.5%
The Rubicon Project, Inc. RUBI $427.1 $321.6 $99.5 82.3% -8.1% n/a 3.2x n/a 2.4x n/a -40.7%
SINA Corporation SINA $3,197.7 $2,679.9 $740.1 62.3% 9.3% 28.7% 3.6x 38.9x 3.3x 65.1x -42.9%
Sohu.com Inc. SOHU $2,182.2 $1,802.9 $1,519.2 62.4% 6.3% 23.4% 1.2x 18.9x 1.0x 43.5x -22.6%
Tree.Com, Inc. TREE $288.9 $199.4 $155.9 95.6% 7.8% 38.3% 1.3x 16.3x 1.2x 8.9x -21.7%
Tremor, Inc. TRMR $187.3 $100.0 $150.1 35.4% -9.5% 22.1% 0.7x n/a 0.6x n/a -34.5%
Yandex YNDX $9,626.8 $9,545.5 $1,335.1 70.8% 37.8% 36.2% 7.1x 18.9x 6.0x 14.4x -29.0%
YuMe YUME $193.3 $143.4 $167.9 47.6% 0.8% 26.8% 0.9x 113.0x 0.7x 57.9x -18.9%
Median: $1,591.6 $1,399.6 $514.0 62.4% 6.3% 26.8% 2.4x 18.9x 2.3x 22.9x -29.0%
TTM Revenue Growth 26.8%
TTM EBITDA Growth 10.7%
TTM Earnings Growth -51.7%
Gross Profit Margin 62.4%
EBITDA Margin 6.3%
Net Income Margin -1.7%
SG&A Expenses as a % of Total Revenue 42.7%
R&D Expenses as a % of Total Revenue 10.3%
Current Ratio 3.4x
Quick Ratio 3.2x
Cash as Percent of Market Cap 19.4%
Avg Days Outstanding: Accounts Receivable 51.9x
Avg Days Outstanding: Accounts Payable 66.3x
Working Capital to TTM Operating Expense Ratio 0.5x
Levered FCF Margin 3.6%
Cash from Operations Growth (YoY) 9.7%
Cash from Investing Growth (YoY) -43.7%
Cash from Financing Growth (YoY) 297.1%
Levered FCF Growth (YoY) -26.0%
Copyright © 2014 by Software Equity Group, L.L.C., All Rights Reserved August 2014 Monthly Flash Report
Income Statement Analysis (Median)
Balance Sheet Analysis (Median)
Cash Flow Statement Analysis (Median)
-40%
-35%
-30%
-25%
-20%
-15%
-10%
-5%
0%
5%
10%
Internet Ad Tech and Lead Generation Stock Market Return: January - July 2014
Ad Tech & Lead Generation S&P NASDAQ SEG Internet Index
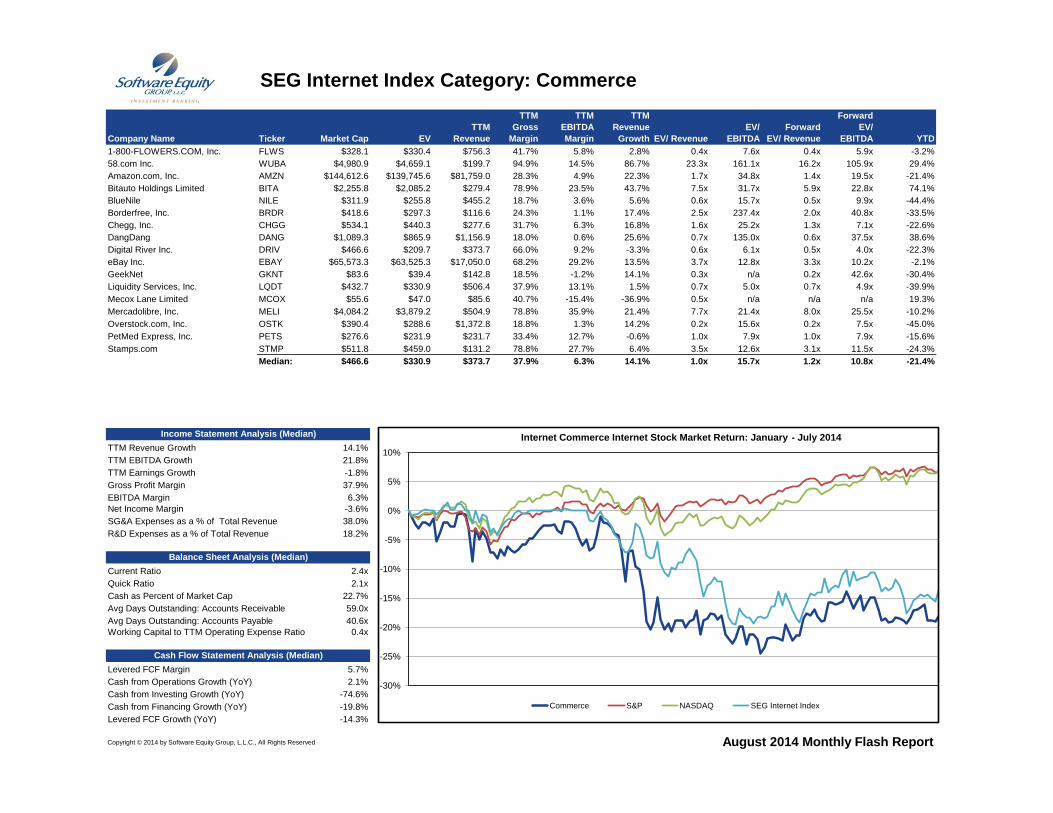
SEG Internet Index Category: Commerce
Company Name Ticker Market Cap EV
TTM
Revenue
TTM
Gross
Margin
TTM
EBITDA
Margin
TTM
Revenue
Growth EV/ Revenue
EV/
EBITDA
Forward
EV/ Revenue
Forward
EV/
EBITDA YTD
1-800-FLOWERS.COM, Inc. FLWS $328.1 $330.4 $756.3 41.7% 5.8% 2.8% 0.4x 7.6x 0.4x 5.9x -3.2%
58.com Inc. WUBA $4,980.9 $4,659.1 $199.7 94.9% 14.5% 86.7% 23.3x 161.1x 16.2x 105.9x 29.4%
Amazon.com, Inc. AMZN $144,612.6 $139,745.6 $81,759.0 28.3% 4.9% 22.3% 1.7x 34.8x 1.4x 19.5x -21.4%
Bitauto Holdings Limited BITA $2,255.8 $2,085.2 $279.4 78.9% 23.5% 43.7% 7.5x 31.7x 5.9x 22.8x 74.1%
BlueNile NILE $311.9 $255.8 $455.2 18.7% 3.6% 5.6% 0.6x 15.7x 0.5x 9.9x -44.4%
Borderfree, Inc. BRDR $418.6 $297.3 $116.6 24.3% 1.1% 17.4% 2.5x 237.4x 2.0x 40.8x -33.5%
Chegg, Inc. CHGG $534.1 $440.3 $277.6 31.7% 6.3% 16.8% 1.6x 25.2x 1.3x 7.1x -22.6%
DangDang DANG $1,089.3 $865.9 $1,156.9 18.0% 0.6% 25.6% 0.7x 135.0x 0.6x 37.5x 38.6%
Digital River Inc. DRIV $466.6 $209.7 $373.7 66.0% 9.2% -3.3% 0.6x 6.1x 0.5x 4.0x -22.3%
eBay Inc. EBAY $65,573.3 $63,525.3 $17,050.0 68.2% 29.2% 13.5% 3.7x 12.8x 3.3x 10.2x -2.1%
GeekNet GKNT $83.6 $39.4 $142.8 18.5% -1.2% 14.1% 0.3x n/a 0.2x 42.6x -30.4%
Liquidity Services, Inc. LQDT $432.7 $330.9 $506.4 37.9% 13.1% 1.5% 0.7x 5.0x 0.7x 4.9x -39.9%
Mecox Lane Limited MCOX $55.6 $47.0 $85.6 40.7% -15.4% -36.9% 0.5x n/a n/a n/a 19.3%
Mercadolibre, Inc. MELI $4,084.2 $3,879.2 $504.9 78.8% 35.9% 21.4% 7.7x 21.4x 8.0x 25.5x -10.2%
Overstock.com, Inc. OSTK $390.4 $288.6 $1,372.8 18.8% 1.3% 14.2% 0.2x 15.6x 0.2x 7.5x -45.0%
PetMed Express, Inc. PETS $276.6 $231.9 $231.7 33.4% 12.7% -0.6% 1.0x 7.9x 1.0x 7.9x -15.6%
Stamps.com STMP $511.8 $459.0 $131.2 78.8% 27.7% 6.4% 3.5x 12.6x 3.1x 11.5x -24.3%
Median: $466.6 $330.9 $373.7 37.9% 6.3% 14.1% 1.0x 15.7x 1.2x 10.8x -21.4%
TTM Revenue Growth 14.1%
TTM EBITDA Growth 21.8%
TTM Earnings Growth -1.8%
Gross Profit Margin 37.9%
EBITDA Margin 6.3%
Net Income Margin -3.6%
SG&A Expenses as a % of Total Revenue 38.0%
R&D Expenses as a % of Total Revenue 18.2%
Current Ratio 2.4x
Quick Ratio 2.1x
Cash as Percent of Market Cap 22.7%
Avg Days Outstanding: Accounts Receivable 59.0x
Avg Days Outstanding: Accounts Payable 40.6x
Working Capital to TTM Operating Expense Ratio 0.4x
Levered FCF Margin 5.7%
Cash from Operations Growth (YoY) 2.1%
Cash from Investing Growth (YoY) -74.6%
Cash from Financing Growth (YoY) -19.8%
Levered FCF Growth (YoY) -14.3%
Copyright © 2014 by Software Equity Group, L.L.C., All Rights Reserved August 2014 Monthly Flash Report
Income Statement Analysis (Median)
Balance Sheet Analysis (Median)
Cash Flow Statement Analysis (Median)
-30%
-25%
-20%
-15%
-10%
-5%
0%
5%
10%
Internet Commerce Internet Stock Market Return: January - July 2014
Commerce S&P NASDAQ SEG Internet Index
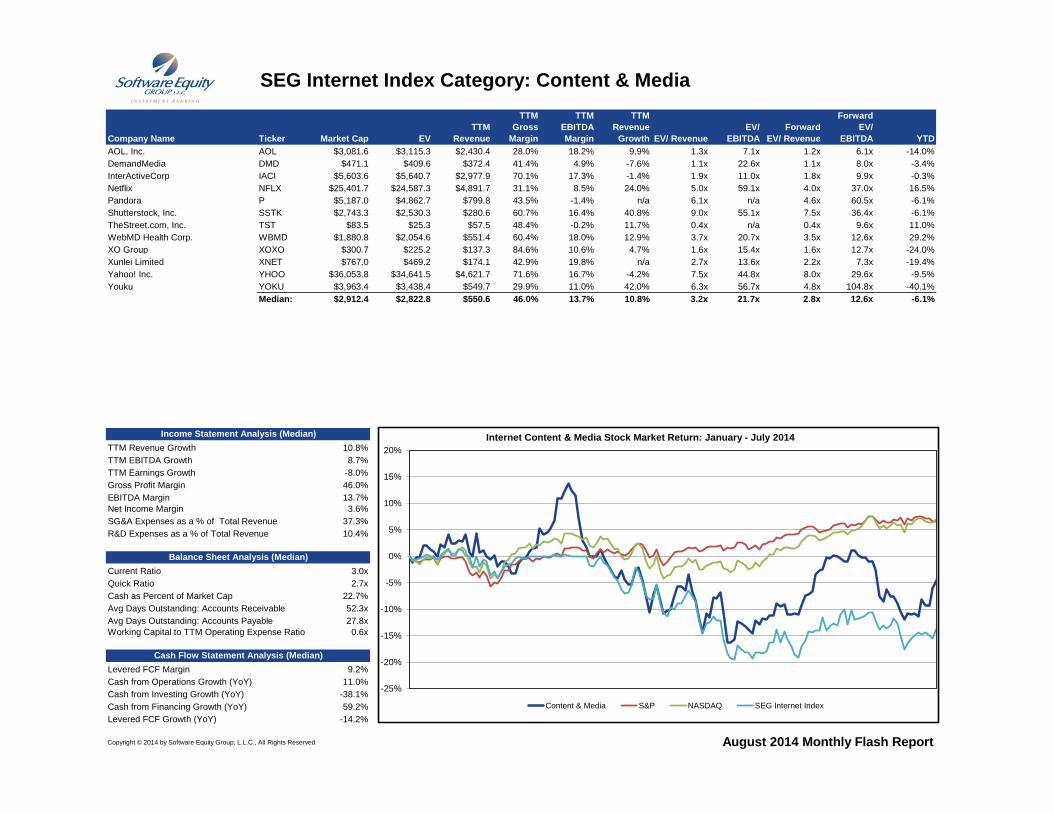
SEG Internet Index Category: Content & Media
Company Name Ticker Market Cap EV
TTM
Revenue
TTM
Gross
Margin
TTM
EBITDA
Margin
TTM
Revenue
Growth EV/ Revenue
EV/
EBITDA
Forward
EV/ Revenue
Forward
EV/
EBITDA YTD
AOL, Inc. AOL $3,081.6 $3,115.3 $2,430.4 28.0% 18.2% 9.9% 1.3x 7.1x 1.2x 6.1x -14.0%
DemandMedia DMD $471.1 $409.6 $372.4 41.4% 4.9% -7.6% 1.1x 22.6x 1.1x 8.0x -3.4%
InterActiveCorp IACI $5,603.6 $5,640.7 $2,977.9 70.1% 17.3% -1.4% 1.9x 11.0x 1.8x 9.9x -0.3%
Netflix NFLX $25,401.7 $24,587.3 $4,891.7 31.1% 8.5% 24.0% 5.0x 59.1x 4.0x 37.0x 16.5%
Pandora P $5,187.0 $4,862.7 $799.8 43.5% -1.4% n/a 6.1x n/a 4.6x 60.5x -6.1%
Shutterstock, Inc. SSTK $2,743.3 $2,530.3 $280.6 60.7% 16.4% 40.8% 9.0x 55.1x 7.5x 36.4x -6.1%
TheStreet.com, Inc. TST $83.5 $25.3 $57.5 48.4% -0.2% 11.7% 0.4x n/a 0.4x 9.6x 11.0%
WebMD Health Corp. WBMD $1,880.8 $2,054.6 $551.4 60.4% 18.0% 12.9% 3.7x 20.7x 3.5x 12.6x 29.2%
XO Group XOXO $300.7 $225.2 $137.3 84.6% 10.6% 4.7% 1.6x 15.4x 1.6x 12.7x -24.0%
Xunlei Limited XNET $767.0 $469.2 $174.1 42.9% 19.8% n/a 2.7x 13.6x 2.2x 7.3x -19.4%
Yahoo! Inc. YHOO $36,053.8 $34,641.5 $4,621.7 71.6% 16.7% -4.2% 7.5x 44.8x 8.0x 29.6x -9.5%
Youku YOKU $3,963.4 $3,438.4 $549.7 29.9% 11.0% 42.0% 6.3x 56.7x 4.8x 104.8x -40.1%
Median: $2,912.4 $2,822.8 $550.6 46.0% 13.7% 10.8% 3.2x 21.7x 2.8x 12.6x -6.1%
TTM Revenue Growth 10.8%
TTM EBITDA Growth 8.7%
TTM Earnings Growth -8.0%
Gross Profit Margin 46.0%
EBITDA Margin 13.7%
Net Income Margin 3.6%
SG&A Expenses as a % of Total Revenue 37.3%
R&D Expenses as a % of Total Revenue 10.4%
Current Ratio 3.0x
Quick Ratio 2.7x
Cash as Percent of Market Cap 22.7%
Avg Days Outstanding: Accounts Receivable 52.3x
Avg Days Outstanding: Accounts Payable 27.8x
Working Capital to TTM Operating Expense Ratio 0.6x
Levered FCF Margin 9.2%
Cash from Operations Growth (YoY) 11.0%
Cash from Investing Growth (YoY) -38.1%
Cash from Financing Growth (YoY) 59.2%
Levered FCF Growth (YoY) -14.2%
Copyright © 2014 by Software Equity Group, L.L.C., All Rights Reserved
Income Statement Analysis (Median)
Balance Sheet Analysis (Median)
Cash Flow Statement Analysis (Median)
August 2014 Monthly Flash Report
-25%
-20%
-15%
-10%
-5%
0%
5%
10%
15%
20%
Internet Content & Media Stock Market Return: January - July 2014
Content & Media S&P NASDAQ SEG Internet Index
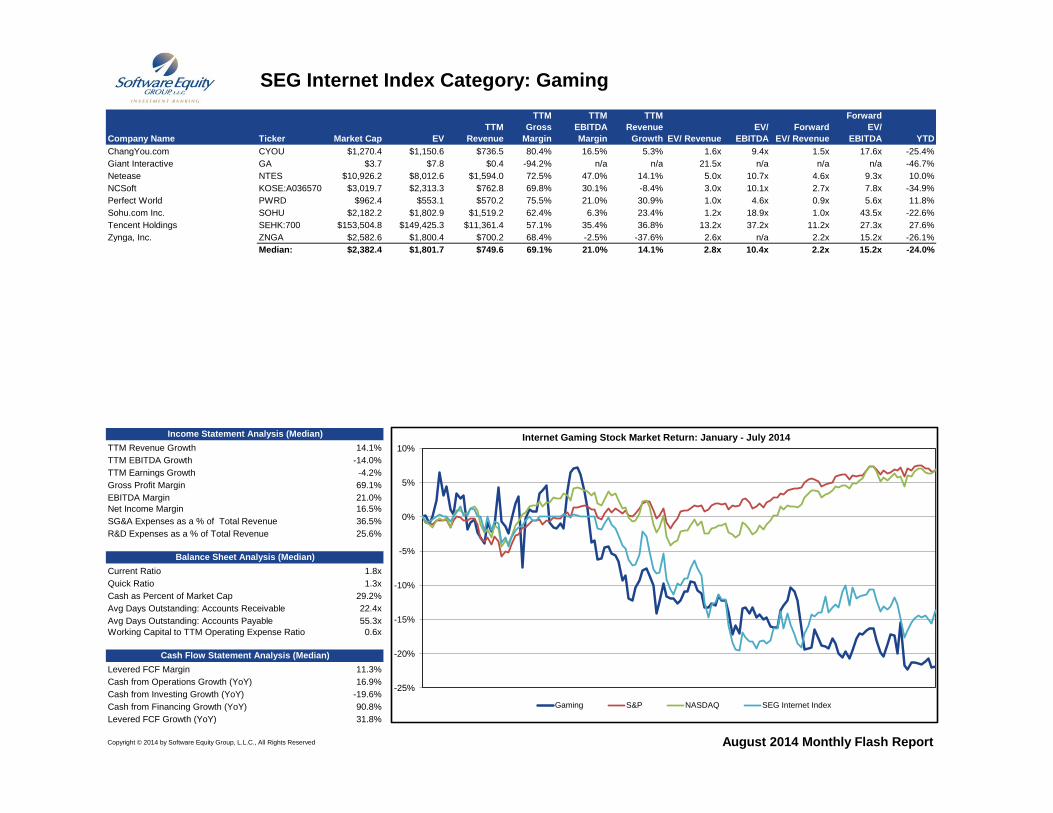
SEG Internet Index Category: Gaming
Company Name Ticker Market Cap EV
TTM
Revenue
TTM
Gross
Margin
TTM
EBITDA
Margin
TTM
Revenue
Growth EV/ Revenue
EV/
EBITDA
Forward
EV/ Revenue
Forward
EV/
EBITDA YTD
ChangYou.com CYOU $1,270.4 $1,150.6 $736.5 80.4% 16.5% 5.3% 1.6x 9.4x 1.5x 17.6x -25.4%
Giant Interactive GA $3.7 $7.8 $0.4 -94.2% n/a n/a 21.5x n/a n/a n/a -46.7%
Netease NTES $10,926.2 $8,012.6 $1,594.0 72.5% 47.0% 14.1% 5.0x 10.7x 4.6x 9.3x 10.0%
NCSoft KOSE:A036570 $3,019.7 $2,313.3 $762.8 69.8% 30.1% -8.4% 3.0x 10.1x 2.7x 7.8x -34.9%
Perfect World PWRD $962.4 $553.1 $570.2 75.5% 21.0% 30.9% 1.0x 4.6x 0.9x 5.6x 11.8%
Sohu.com Inc. SOHU $2,182.2 $1,802.9 $1,519.2 62.4% 6.3% 23.4% 1.2x 18.9x 1.0x 43.5x -22.6%
Tencent Holdings SEHK:700 $153,504.8 $149,425.3 $11,361.4 57.1% 35.4% 36.8% 13.2x 37.2x 11.2x 27.3x 27.6%
Zynga, Inc. ZNGA $2,582.6 $1,800.4 $700.2 68.4% -2.5% -37.6% 2.6x n/a 2.2x 15.2x -26.1%
Median: $2,382.4 $1,801.7 $749.6 69.1% 21.0% 14.1% 2.8x 10.4x 2.2x 15.2x -24.0%
TTM Revenue Growth 14.1%
TTM EBITDA Growth -14.0%
TTM Earnings Growth -4.2%
Gross Profit Margin 69.1%
EBITDA Margin 21.0%
Net Income Margin 16.5%
SG&A Expenses as a % of Total Revenue 36.5%
R&D Expenses as a % of Total Revenue 25.6%
Current Ratio 1.8x
Quick Ratio 1.3x
Cash as Percent of Market Cap 29.2%
Avg Days Outstanding: Accounts Receivable 22.4x
Avg Days Outstanding: Accounts Payable 55.3x
Working Capital to TTM Operating Expense Ratio 0.6x
Levered FCF Margin 11.3%
Cash from Operations Growth (YoY) 16.9%
Cash from Investing Growth (YoY) -19.6%
Cash from Financing Growth (YoY) 90.8%
Levered FCF Growth (YoY) 31.8%
Copyright © 2014 by Software Equity Group, L.L.C., All Rights Reserved August 2014 Monthly Flash Report
Income Statement Analysis (Median)
Balance Sheet Analysis (Median)
Cash Flow Statement Analysis (Median)
-25%
-20%
-15%
-10%
-5%
0%
5%
10%
Internet Gaming Stock Market Return: January - July 2014
Gaming S&P NASDAQ SEG Internet Index
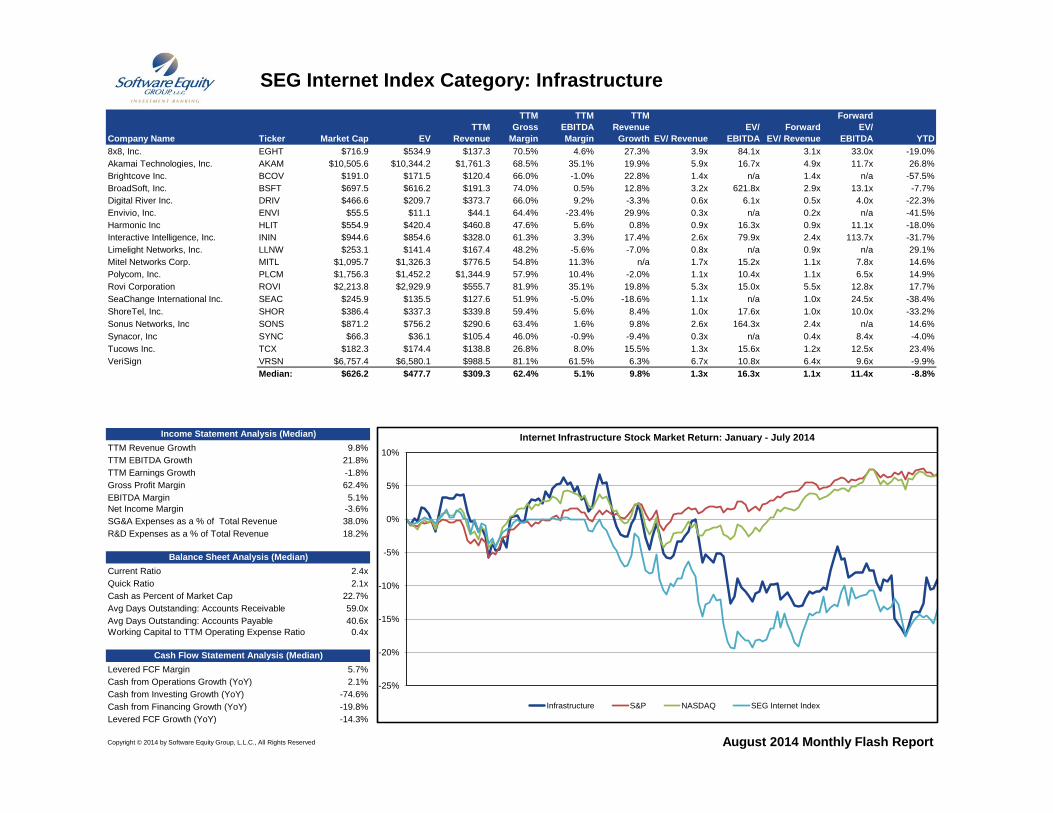
SEG Internet Index Category: Infrastructure
Company Name Ticker Market Cap EV
TTM
Revenue
TTM
Gross
Margin
TTM
EBITDA
Margin
TTM
Revenue
Growth EV/ Revenue
EV/
EBITDA
Forward
EV/ Revenue
Forward
EV/
EBITDA YTD
8x8, Inc. EGHT $716.9 $534.9 $137.3 70.5% 4.6% 27.3% 3.9x 84.1x 3.1x 33.0x -19.0%
Akamai Technologies, Inc. AKAM $10,505.6 $10,344.2 $1,761.3 68.5% 35.1% 19.9% 5.9x 16.7x 4.9x 11.7x 26.8%
Brightcove Inc. BCOV $191.0 $171.5 $120.4 66.0% -1.0% 22.8% 1.4x n/a 1.4x n/a -57.5%
BroadSoft, Inc. BSFT $697.5 $616.2 $191.3 74.0% 0.5% 12.8% 3.2x 621.8x 2.9x 13.1x -7.7%
Digital River Inc. DRIV $466.6 $209.7 $373.7 66.0% 9.2% -3.3% 0.6x 6.1x 0.5x 4.0x -22.3%
Envivio, Inc. ENVI $55.5 $11.1 $44.1 64.4% -23.4% 29.9% 0.3x n/a 0.2x n/a -41.5%
Harmonic Inc HLIT $554.9 $420.4 $460.8 47.6% 5.6% 0.8% 0.9x 16.3x 0.9x 11.1x -18.0%
Interactive Intelligence, Inc. ININ $944.6 $854.6 $328.0 61.3% 3.3% 17.4% 2.6x 79.9x 2.4x 113.7x -31.7%
Limelight Networks, Inc. LLNW $253.1 $141.4 $167.4 48.2% -5.6% -7.0% 0.8x n/a 0.9x n/a 29.1%
Mitel Networks Corp. MITL $1,095.7 $1,326.3 $776.5 54.8% 11.3% n/a 1.7x 15.2x 1.1x 7.8x 14.6%
Polycom, Inc. PLCM $1,756.3 $1,452.2 $1,344.9 57.9% 10.4% -2.0% 1.1x 10.4x 1.1x 6.5x 14.9%
Rovi Corporation ROVI $2,213.8 $2,929.9 $555.7 81.9% 35.1% 19.8% 5.3x 15.0x 5.5x 12.8x 17.7%
SeaChange International Inc. SEAC $245.9 $135.5 $127.6 51.9% -5.0% -18.6% 1.1x n/a 1.0x 24.5x -38.4%
ShoreTel, Inc. SHOR $386.4 $337.3 $339.8 59.4% 5.6% 8.4% 1.0x 17.6x 1.0x 10.0x -33.2%
Sonus Networks, Inc SONS $871.2 $756.2 $290.6 63.4% 1.6% 9.8% 2.6x 164.3x 2.4x n/a 14.6%
Synacor, Inc SYNC $66.3 $36.1 $105.4 46.0% -0.9% -9.4% 0.3x n/a 0.4x 8.4x -4.0%
Tucows Inc. TCX $182.3 $174.4 $138.8 26.8% 8.0% 15.5% 1.3x 15.6x 1.2x 12.5x 23.4%
VeriSign VRSN $6,757.4 $6,580.1 $988.5 81.1% 61.5% 6.3% 6.7x 10.8x 6.4x 9.6x -9.9%
Median: $626.2 $477.7 $309.3 62.4% 5.1% 9.8% 1.3x 16.3x 1.1x 11.4x -8.8%
TTM Revenue Growth 9.8%
TTM EBITDA Growth 21.8%
TTM Earnings Growth -1.8%
Gross Profit Margin 62.4%
EBITDA Margin 5.1%
Net Income Margin -3.6%
SG&A Expenses as a % of Total Revenue 38.0%
R&D Expenses as a % of Total Revenue 18.2%
Current Ratio 2.4x
Quick Ratio 2.1x
Cash as Percent of Market Cap 22.7%
Avg Days Outstanding: Accounts Receivable 59.0x
Avg Days Outstanding: Accounts Payable 40.6x
Working Capital to TTM Operating Expense Ratio 0.4x
Levered FCF Margin 5.7%
Cash from Operations Growth (YoY) 2.1%
Cash from Investing Growth (YoY) -74.6%
Cash from Financing Growth (YoY) -19.8%
Levered FCF Growth (YoY) -14.3%
Copyright © 2014 by Software Equity Group, L.L.C., All Rights Reserved August 2014 Monthly Flash Report
Income Statement Analysis (Median)
Balance Sheet Analysis (Median)
Cash Flow Statement Analysis (Median)
-25%
-20%
-15%
-10%
-5%
0%
5%
10%
Internet Infrastructure Stock Market Return: January - July 2014
Infrastructure S&P NASDAQ SEG Internet Index
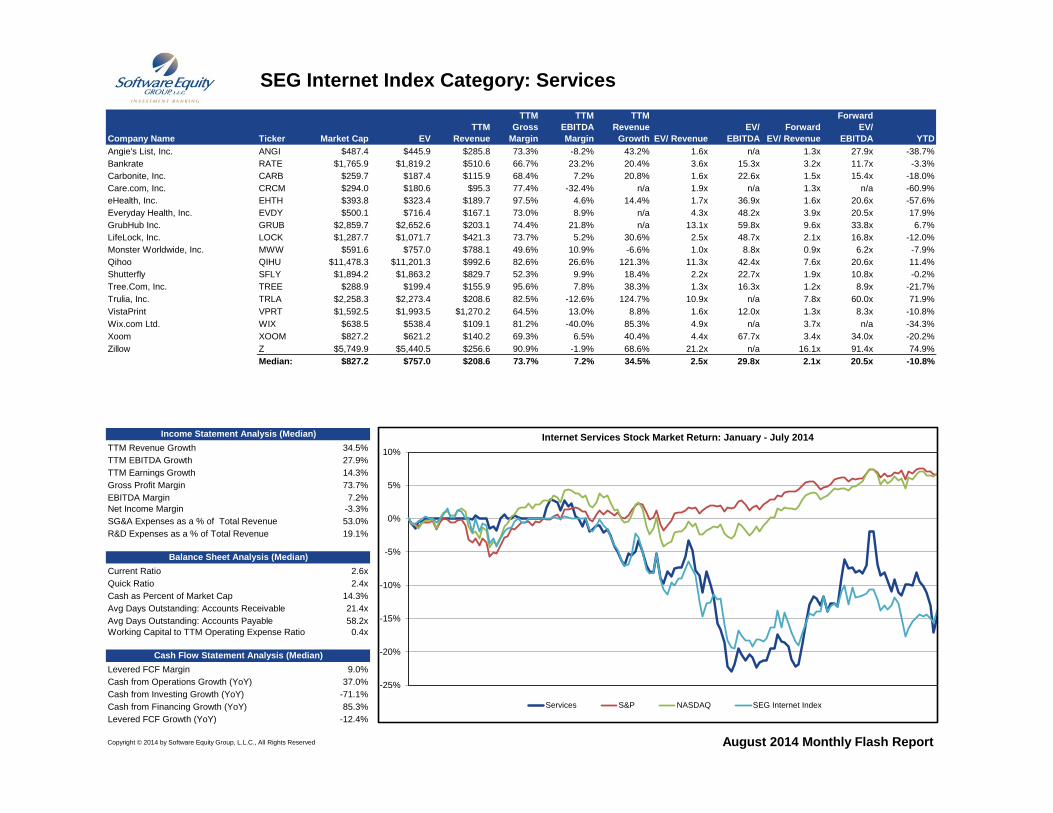
SEG Internet Index Category: Services
Company Name Ticker Market Cap EV
TTM
Revenue
TTM
Gross
Margin
TTM
EBITDA
Margin
TTM
Revenue
Growth EV/ Revenue
EV/
EBITDA
Forward
EV/ Revenue
Forward
EV/
EBITDA YTD
Angie's List, Inc. ANGI $487.4 $445.9 $285.8 73.3% -8.2% 43.2% 1.6x n/a 1.3x 27.9x -38.7%
Bankrate RATE $1,765.9 $1,819.2 $510.6 66.7% 23.2% 20.4% 3.6x 15.3x 3.2x 11.7x -3.3%
Carbonite, Inc. CARB $259.7 $187.4 $115.9 68.4% 7.2% 20.8% 1.6x 22.6x 1.5x 15.4x -18.0%
Care.com, Inc. CRCM $294.0 $180.6 $95.3 77.4% -32.4% n/a 1.9x n/a 1.3x n/a -60.9%
eHealth, Inc. EHTH $393.8 $323.4 $189.7 97.5% 4.6% 14.4% 1.7x 36.9x 1.6x 20.6x -57.6%
Everyday Health, Inc. EVDY $500.1 $716.4 $167.1 73.0% 8.9% n/a 4.3x 48.2x 3.9x 20.5x 17.9%
GrubHub Inc. GRUB $2,859.7 $2,652.6 $203.1 74.4% 21.8% n/a 13.1x 59.8x 9.6x 33.8x 6.7%
LifeLock, Inc. LOCK $1,287.7 $1,071.7 $421.3 73.7% 5.2% 30.6% 2.5x 48.7x 2.1x 16.8x -12.0%
Monster Worldwide, Inc. MWW $591.6 $757.0 $788.1 49.6% 10.9% -6.6% 1.0x 8.8x 0.9x 6.2x -7.9%
Qihoo QIHU $11,478.3 $11,201.3 $992.6 82.6% 26.6% 121.3% 11.3x 42.4x 7.6x 20.6x 11.4%
Shutterfly SFLY $1,894.2 $1,863.2 $829.7 52.3% 9.9% 18.4% 2.2x 22.7x 1.9x 10.8x -0.2%
Tree.Com, Inc. TREE $288.9 $199.4 $155.9 95.6% 7.8% 38.3% 1.3x 16.3x 1.2x 8.9x -21.7%
Trulia, Inc. TRLA $2,258.3 $2,273.4 $208.6 82.5% -12.6% 124.7% 10.9x n/a 7.8x 60.0x 71.9%
VistaPrint VPRT $1,592.5 $1,993.5 $1,270.2 64.5% 13.0% 8.8% 1.6x 12.0x 1.3x 8.3x -10.8%
Wix.com Ltd. WIX $638.5 $538.4 $109.1 81.2% -40.0% 85.3% 4.9x n/a 3.7x n/a -34.3%
Xoom XOOM $827.2 $621.2 $140.2 69.3% 6.5% 40.4% 4.4x 67.7x 3.4x 34.0x -20.2%
Zillow Z $5,749.9 $5,440.5 $256.6 90.9% -1.9% 68.6% 21.2x n/a 16.1x 91.4x 74.9%
Median: $827.2 $757.0 $208.6 73.7% 7.2% 34.5% 2.5x 29.8x 2.1x 20.5x -10.8%
TTM Revenue Growth 34.5%
TTM EBITDA Growth 27.9%
TTM Earnings Growth 14.3%
Gross Profit Margin 73.7%
EBITDA Margin 7.2%
Net Income Margin -3.3%
SG&A Expenses as a % of Total Revenue 53.0%
R&D Expenses as a % of Total Revenue 19.1%
Current Ratio 2.6x
Quick Ratio 2.4x
Cash as Percent of Market Cap 14.3%
Avg Days Outstanding: Accounts Receivable 21.4x
Avg Days Outstanding: Accounts Payable 58.2x
Working Capital to TTM Operating Expense Ratio 0.4x
Levered FCF Margin 9.0%
Cash from Operations Growth (YoY) 37.0%
Cash from Investing Growth (YoY) -71.1%
Cash from Financing Growth (YoY) 85.3%
Levered FCF Growth (YoY) -12.4%
Copyright © 2014 by Software Equity Group, L.L.C., All Rights Reserved August 2014 Monthly Flash Report
Income Statement Analysis (Median)
Balance Sheet Analysis (Median)
Cash Flow Statement Analysis (Median)
-25%
-20%
-15%
-10%
-5%
0%
5%
10%
Internet Services Stock Market Return: January - July 2014
Services S&P NASDAQ SEG Internet Index
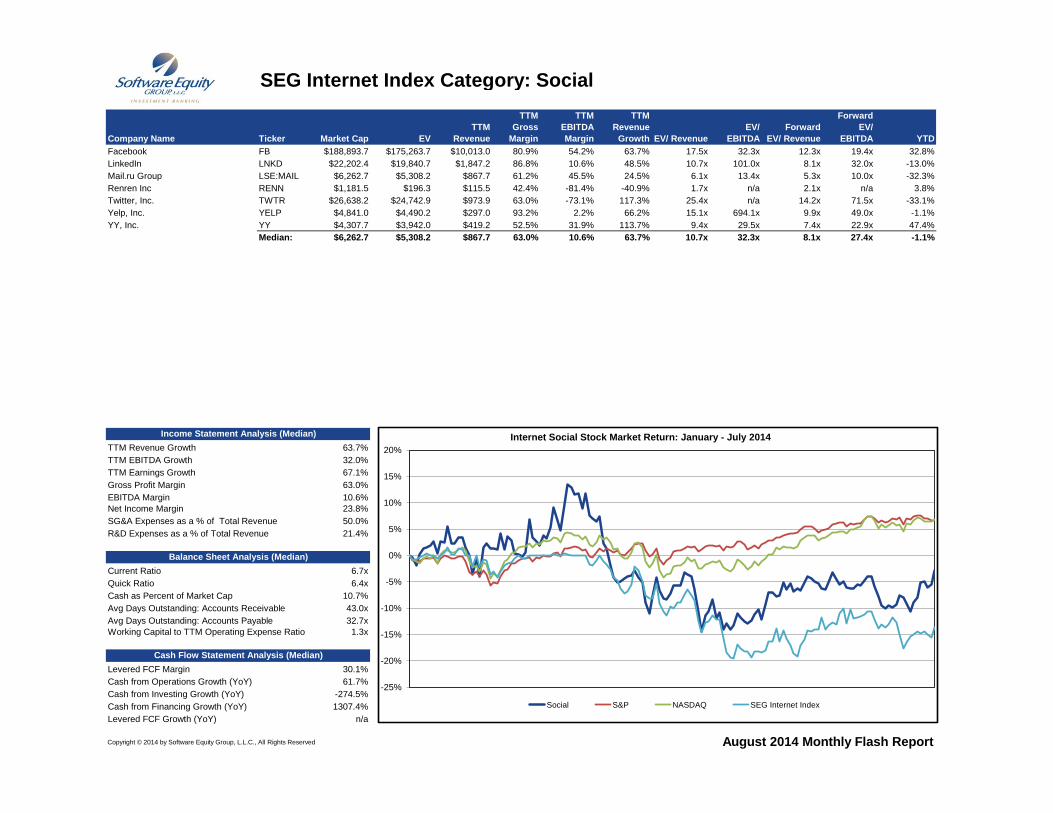
SEG Internet Index Category: Social
Company Name Ticker Market Cap EV
TTM
Revenue
TTM
Gross
Margin
TTM
EBITDA
Margin
TTM
Revenue
Growth EV/ Revenue
EV/
EBITDA
Forward
EV/ Revenue
Forward
EV/
EBITDA YTD
Facebook FB $188,893.7 $175,263.7 $10,013.0 80.9% 54.2% 63.7% 17.5x 32.3x 12.3x 19.4x 32.8%
LinkedIn LNKD $22,202.4 $19,840.7 $1,847.2 86.8% 10.6% 48.5% 10.7x 101.0x 8.1x 32.0x -13.0%
Mail.ru Group LSE:MAIL $6,262.7 $5,308.2 $867.7 61.2% 45.5% 24.5% 6.1x 13.4x 5.3x 10.0x -32.3%
Renren Inc RENN $1,181.5 $196.3 $115.5 42.4% -81.4% -40.9% 1.7x n/a 2.1x n/a 3.8%
Twitter, Inc. TWTR $26,638.2 $24,742.9 $973.9 63.0% -73.1% 117.3% 25.4x n/a 14.2x 71.5x -33.1%
Yelp, Inc. YELP $4,841.0 $4,490.2 $297.0 93.2% 2.2% 66.2% 15.1x 694.1x 9.9x 49.0x -1.1%
YY, Inc. YY $4,307.7 $3,942.0 $419.2 52.5% 31.9% 113.7% 9.4x 29.5x 7.4x 22.9x 47.4%
Median: $6,262.7 $5,308.2 $867.7 63.0% 10.6% 63.7% 10.7x 32.3x 8.1x 27.4x -1.1%
TTM Revenue Growth 63.7%
TTM EBITDA Growth 32.0%
TTM Earnings Growth 67.1%
Gross Profit Margin 63.0%
EBITDA Margin 10.6%
Net Income Margin 23.8%
SG&A Expenses as a % of Total Revenue 50.0%
R&D Expenses as a % of Total Revenue 21.4%
Current Ratio 6.7x
Quick Ratio 6.4x
Cash as Percent of Market Cap 10.7%
Avg Days Outstanding: Accounts Receivable 43.0x
Avg Days Outstanding: Accounts Payable 32.7x
Working Capital to TTM Operating Expense Ratio 1.3x
Levered FCF Margin 30.1%
Cash from Operations Growth (YoY) 61.7%
Cash from Investing Growth (YoY) -274.5%
Cash from Financing Growth (YoY) 1307.4%
Levered FCF Growth (YoY) n/a
Copyright © 2014 by Software Equity Group, L.L.C., All Rights Reserved
Balance Sheet Analysis (Median)
Cash Flow Statement Analysis (Median)
August 2014 Monthly Flash Report
Income Statement Analysis (Median)
-25%
-20%
-15%
-10%
-5%
0%
5%
10%
15%
20%
Internet Social Stock Market Return: January - July 2014
Social S&P NASDAQ SEG Internet Index
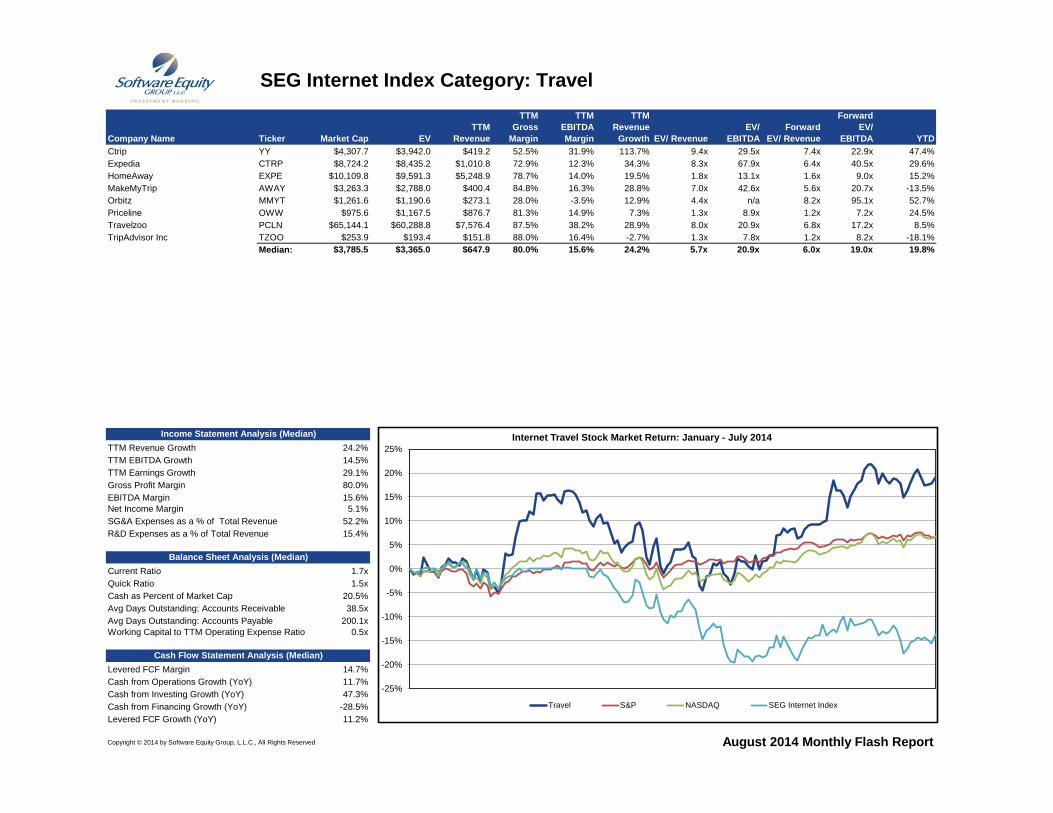
SEG Internet Index Category: Travel
Company Name Ticker Market Cap EV
TTM
Revenue
TTM
Gross
Margin
TTM
EBITDA
Margin
TTM
Revenue
Growth EV/ Revenue
EV/
EBITDA
Forward
EV/ Revenue
Forward
EV/
EBITDA YTD
Ctrip YY $4,307.7 $3,942.0 $419.2 52.5% 31.9% 113.7% 9.4x 29.5x 7.4x 22.9x 47.4%
Expedia CTRP $8,724.2 $8,435.2 $1,010.8 72.9% 12.3% 34.3% 8.3x 67.9x 6.4x 40.5x 29.6%
HomeAway EXPE $10,109.8 $9,591.3 $5,248.9 78.7% 14.0% 19.5% 1.8x 13.1x 1.6x 9.0x 15.2%
MakeMyTrip AWAY $3,263.3 $2,788.0 $400.4 84.8% 16.3% 28.8% 7.0x 42.6x 5.6x 20.7x -13.5%
Orbitz MMYT $1,261.6 $1,190.6 $273.1 28.0% -3.5% 12.9% 4.4x n/a 8.2x 95.1x 52.7%
Priceline OWW $975.6 $1,167.5 $876.7 81.3% 14.9% 7.3% 1.3x 8.9x 1.2x 7.2x 24.5%
Travelzoo PCLN $65,144.1 $60,288.8 $7,576.4 87.5% 38.2% 28.9% 8.0x 20.9x 6.8x 17.2x 8.5%
TripAdvisor Inc TZOO $253.9 $193.4 $151.8 88.0% 16.4% -2.7% 1.3x 7.8x 1.2x 8.2x -18.1%
Median: $3,785.5 $3,365.0 $647.9 80.0% 15.6% 24.2% 5.7x 20.9x 6.0x 19.0x 19.8%
TTM Revenue Growth 24.2%
TTM EBITDA Growth 14.5%
TTM Earnings Growth 29.1%
Gross Profit Margin 80.0%
EBITDA Margin 15.6%
Net Income Margin 5.1%
SG&A Expenses as a % of Total Revenue 52.2%
R&D Expenses as a % of Total Revenue 15.4%
Current Ratio 1.7x
Quick Ratio 1.5x
Cash as Percent of Market Cap 20.5%
Avg Days Outstanding: Accounts Receivable 38.5x
Avg Days Outstanding: Accounts Payable 200.1x
Working Capital to TTM Operating Expense Ratio 0.5x
Levered FCF Margin 14.7%
Cash from Operations Growth (YoY) 11.7%
Cash from Investing Growth (YoY) 47.3%
Cash from Financing Growth (YoY) -28.5%
Levered FCF Growth (YoY) 11.2%
Copyright © 2014 by Software Equity Group, L.L.C., All Rights Reserved August 2014 Monthly Flash Report
Income Statement Analysis (Median)
Balance Sheet Analysis (Median)
Cash Flow Statement Analysis (Median)
-25%
-20%
-15%
-10%
-5%
0%
5%
10%
15%
20%
25%
Internet Travel Stock Market Return: January - July 2014
Travel S&P NASDAQ SEG Internet Index