Embed Size (px)
Citation preview

1
Soft Crabs in Closed Systems: A Virginia Success Story
Michael J. OesterlingCommercial Fisheries Specialist
Virginia Institute of Marine ScienceCollege of William and Mary
INTRODUCTION
Soft-shell crabs have been produced commercially in Virginia for well over 100 years and may beone of the earliest forms of aquaculture in the United States (Oesterling, 1993). Soft-shell crabsare not a separate species of crab, but are blue crabs (Callinectes sapidus) that have shed (molted)their hard outer shells in preparation for growth. The hard exoskeleton of blue crabs do not allowfor continual size increases associated with fishes and other animals. In order for a crab to grow,this hard shell must be shed; a soft, pliable crab emerges, expands its soft new shell, and "growsinto" its new body. At this time, when the crab emerges from its old shell, it is known as a soft-shell crab or, more simply, a "soft crab." Within hours the crab will again return to its previoushardened state. However, if the crab is removed from the water shortly after molting, it willremain soft and can be sold as a soft crabs. Today, the soft crab represents a major Virginianfishery; in 1993, more than 1.7 million pounds of soft-shelled crabs were commercially producedwith a dockside value of $3.5 million (Oesterling and Moore, 1995).
Initially, soft crabs were probably caught in a very haphazard manner, being readily scooped up byforaging Indians and later by English settlers. It was not until hundreds of years after the arrivalof the white man that the mass production of soft crabs was attempted. The soft crab industrybegan in Crisfield, Maryland, and quickly spread to Virginia.
The loosely controlled shedding of crabs began in the 1850s when wire enclosures were 461staked out in the shallows of the tidal zone. These pens were filled with hard crabs which werefed and watched closely for molting. This method was difficult to manage; numerous crabs werelost to cannibalism or died as a result of wide variations in temperature, salinity or water quality.
As these early crab shedders handled more and more crabs, they learned to examine hard crabs forunique signs which indicated a pre-molt condition (peeler crab). Experienced producers began toequip their crab pens with floating boxes to house and protect those crabs nearer to shedding. These floating boxes ("floats") were successful in decreasing mortality and increasing soft crabproduction. In time, producers used more floating boxes and became less dependent on crab penswhich required extra care. Soft crab production began to be more dependent upon a selectiveharvest of peeler crabs.
Of the methods used to produce soft crabs, floats are the least expensive to construct, maintainand operate; however, disadvantages outweigh advantages in a float operation. To begin, there is

2
the need for expensive waterfront property conducive to the siting of many moored floats. Due tothe very nature of float construction, crabs are confined to the upper few inches of water; at thesedepths, crab mortalities in floats can occur from rapid temperature and salinity shifts as the resultof heavy rainfall. Additionally, many float operations are located in protected areas where,unfortunately, water circulation may be poor. Without proper circulation, dissolved oxygen canbe depleted and water temperatures can rise to lethal levels. Crabs held in floats also are exposedto predation by animals both in (eels, bull minnows, etc) and out (raccoons, herons, otters) of thewater. Essentially, there is no control over environmental factors.
However, perhaps the greatest drawback to a float operation is the physical difficulty anddiscomfort associated with tending a group of moored floats. Removal of soft crabs, dead peelersand empty shells from the floats, as well as culling crabs generally has to be done from a skiff,with the operator bending over the gunnel; in other words, back-breaking work.
The desire for convenience, more than any other factor, led to the next major development inshedding facilities - the shore-based float or tank. It was not until the 1950s, almost 100 yearsafter the inception of the soft crab industry, that crab shedders began to "leave the water" andinvestigate shore-based tanks as a better and easier method to produce soft crabs.
These shedding tanks were simple troughs or shallow tables used to hold running water pumpedfrom an adjacent brackish water supply and then returned overboard. These flow-throughsystems were easier to manage than floats. Initially just sited in the open along the shore, theysoon were housed to provide shade and protection from rain and predators. The foremostadvantage, however, is the ease with which they can be worked; no more hanging over the gunnelof a boat. In many cases, shedding tanks are at waist level where little bending is required. Onshore, soft crabs are better protected from predators; no more eels or bull minnows, and tanksthat are housed are safe from raccoons, birds and poachers. Finally, there is some limited controlover the environment. More stable temperature and salinity can be achieved by drawing waterfrom greater depths. Also, housing keeps tanks out of direct sunlight and protects them fromrainfall.
Unfortunately, these flow-through systems still require waterfront property and water of goodquality and depth. There is also an increase in both construction costs and operational expensesover an in-water float system.
Up to this point, soft-shelled crab production, in reality, should be considered short-term farmingwhich consists of holding crabs for molting and not feeding or holding crabs for extended periodsof time. Soft crab production relies entirely on the capture of pre-molt crabs. However, with theadvent of the closed system (water recirculation) 20 years ago, soft crab production could now beconsidered "aquaculture". Closed systems offer several advantages over traditional methods. They provide the opportunity to shed crabs completely away from the waterfront or, in areas ofreduced water quality, they offer a viable method for producing soft crabs. Foremost among theadvantages is better control over environmental factors: salinity can be maintained at a constantlevel; water temperatures may be manipulated as the season dictates; there are no dangers from

3
waterborne pollutants or silt; water clarity can be increased; and tanks can be maintained and keptcleaner easier.
However, a closed system has disadvantages as well. They are more complex and costly to buildand maintain than a flow-through system. Unlike flow-through systems, production cannot bereadily stopped and restarted. And, with no overboard discharge, constant attention is requiredfor the control of potentially toxic wastes added to the system by the normal bodily functions ofthe crabs. The buildup of toxic substances resulting from these waste products is the primarylimiting factor in a closed system.
VIRGINIA CLOSED SYSTEM DESCRIPTION
As with any recirculating system, water filtration methods are paramount for the maintenance ofproper water quality in a closed system for soft crab production. The filtration systems in use inVirginia may differ dramatically from those in other regions. However, they have proven to besuccessful for the conditions in Virginia. The prudent person, however, will seek out othersources of information on soft crab production in order to identify the most appropriate systemfor their own situation (see: Haetner and Garten, 1974; Bearden, et al., 1979; Ogle, Perry andNicholson, 1982; Perry and Malone, 1985; Malone and Burden, 1988; Oesterling, 1995).
Work done in Louisiana during the early 1980s documented the critical operational parameters forclosed system crab shedding facilities (Manthe, Malone and Perry, 1983; Manthe, Malone andKumar, 1984). These parameters were summarized by Malone and Burden (1988). Dissolvedoxygen levels in both the shedding tanks and within biological filters should be kept as close tosaturation as possible. As dissolved oxygen levels drop below 5.0 milligrams of oxygen per literboth crabs and filter bacteria may be adversely affected. Below 3.0 mg-oxygen/l few moltingcrabs will survive and filter bacteria functioning slows. Under 2.0 mg-oxygen/l there will be nosuccessful molting and filter bacteria functioning ceases. Levels of potentially toxic nitrogencompounds, ammonia and nitrite, were also identified. Ammonia toxicity is directly related to thepH of the culture water. At pH levels over 8.0 ammonia toxicity can become problematic. Anammonia level above 4.0 mg/l is considered to be a sign of potential problems (Oesterling, 1995). Nitrite affects shedding crabs at much lower concentrations than ammonia, irregardless of thewater pH. Nitrite interferes with the ability of the crab's blood to carry oxygen, causing the crabto die of suffocation. Levels of nitrite as low as 0.5 mg/l can cause mortalities within a crabshedding system. Once nitrite levels exceed 3.0 mg/l significant mortalities can occur. The finalnitrogen compound, nitrate, does not appear to cause any problems within a closed systems, evenwhen present in high concentrations. As mentioned previously, pH levels over 8.0 increase thepotential for ammonia toxicity. Normal operating pH for closed shedding systems should bebetween 7.0 and 8.0. The final operational parameter of concern is the salinity of the water. There is no "correct" salinity for shedding crabs. The salinity of the water in the shedding systemshould approximate the salinity of the water from which the peelers are harvested.

4
Closed systems in Virginia employ all three types of filtration, mechanical, biological andchemical. However, of the three, biological filtration is by far the most important.
The Chesapeake Bay biological filter is a downflow submerged filter, that may also incorporatesome aspects of a trickle filter (Oesterling, 1995). Water enters from the top, passes through thefilter material and is removed (pumped) from the bottom of the filter box. The filter materials arealways kept moist or covered with water. While most any kind of box will hold the filter material,the most prevalent type is the bottom half of a concrete septic tank. To increase filtrationcapabilities, many times additional filter boxes are linked together in series. The filter materialbeing used in Virginia is mostly oyster shell; however, some clam shell is also used. Oyster shellis readily available at reasonable prices and provides the necessary buffering and surface arearequirements for a biological filter.
Prior to adding filter material to the biological filter tank, a solid partition approximately 30 cmfrom an end wall and extending from the top to within several centimeters of the bottom isinstalled inside the tank. This creates a head chamber within the biological filter. Oyster shells areput into the large compartment of the biological filter. Water is introduced to the filter over theshells and is pumped out from the small head chamber. This forces the water to be drawn downthrough the oyster shell and pass under the partition prior to being returned to the shedding tanksor sent to another filtering device.
In the Virginia closed system, following biological filtration in importance to a closed system ischemical filtration. Chemical filtration in a shedding system refers not to a chemical reaction. butto the chemical process of adsorption, the concentration of dissolved substances at an interface. In this instance, the interface is between air and water, bubbles in the water. Bubbles passedthrough a column of water will accumulate dissolved substances on their surface, resulting in afoam. This process is called foam fractionation, air-stripping or protein skimming. Besidesbenefits derived from direct removal of dissolved organic materials, protein skimmers haveadditional value. Since much of the organic material being removed is acidic in nature, skimmersare an additional aid in maintaining a stable pH (Dwivedy, 1973). Also, because of the wayskimmers function, they are excellent means of ensuring a well aerated water supply to sheddingtanks.
Typical protein skimmers employed by Virginia crab shedders are constructed entirely of PVCpipe; the main portion is formed by an upright length (6 meters) of PVC pipe with an internaldiameter of 25 - 30 cm. The bottom end of the pipe is capped to hold a column of water. Waterwill enter the skimmer approximately 30 cm from the bottom and will leave via a pipe insertedthrough the center of the bottom cap. A valve in the pipe leaving the skimmer will help regulatethe height of water in the skimmer. An orifice venturi is used to supply the air necessary to createbubbles within the main body of the skimmer. The orifice is placed in the water delivery lineoutside the main skimmer body and elevated above the top of the skimmer. In order for thisfiltration unit to work, it must be elevated above the crab shedding tanks so than water can bedistributed to the shedding tanks by gravity flow.

5
The final type of filtration, mechanical, is a strainer to catch large pieces of debris and trap siltbefore they enter the biological filter. Although to some degree the biological filter acts as amechanical filter, a separate mechanical filter is included within the Chesapeake Bay closedsystem. The most common mechanical filter is nothing more that fiberglass insulation material,held in some manner in the water flow of the system. Generally, these filters are placed at thepoint where water enters the biological filter. As the surface of the fiberglass accumulatessediments or other debris, the operator can either peel off a part of the top insulation or justdiscard the entire fiberglass section and replace it with new clean material.
CONCLUDING STATEMENT
Virginia is consistently a leader in the production of soft shell blue crabs. In 1993, the VirginiaMarine Resources Commission estimated soft crab production to be in excess of 1.7 millionpounds, with a dockside value of over $3.5 million (Sonya Davis, pers. comm., 1994). It was not,however, until 1994 that the Marine Resources Commission initiated licensing of soft crabproducers. A total of 407 soft crab producers were identified in 1994. The implementation oflicensing provided the opportunity to characterize the soft crab fishery. Oesterling and Moore(1995) developed a profile of production technology, along with other demographics of the softcrab industry.
Of importance to this paper, was the fact that 28.2% (62 individuals) of the respondents reportedusing recirculating water technology to produce soft crabs. As many as 132 shedding tanks werebeing used by one individual, although the average number being used was 15. The most frequentresponse to number of tanks being used was either 2 or 20. Almost 87% of the individuals usinga closed system operated under some protection. This is a reflection of the better control overenvironmental factors afforded by the closed system design. Additionally, 37% of the respondentsreported that they employed some sort of water heating device in their closed system. The abilityto heat water during the early shedding season can enable the closed system producer to initiatesoft crab production earlier when prices are higher than with other production methods.
The production of soft-shell blue crab continues to increase within Virginia. The greatest portionof this expansion is in the construction of new recirculating water shedding systems. As theavailability of waterfront property decreases or water quality declines, the use of closed systemsto shed blue crabs will continue to grow and contribute to the Virginia seafood industry.
LITERATURE CITED
Bearden, Charles M., David M. Cupka, Charles H. Farmer, 111, J. David Whitaker and SteveHopkins. "Information on Establishing a Soft Shell Crab Operation in South Carolina", SouthCarolina Wildlife and Marine Resources Department, Division of Marine Resources, 1979.

6
Dwivedy, Ramesh C. "Removal of Dissolved Organics Through Foam Fractionation in ClosedCycle Systems for Oyster Production", American Society of Agricultural Engineers, Paper No.73-561, 1973.
Haefner, Paul A., Jr. and David Garten. "Methods of Handling and Shedding Blue Crabs,Callinectes sapidus", Virginia Institute of Marine Science, Special Report in Applied MarineScience and Ocean Engineering, No. 52, 1974.
Malone, Ronald F. and Daniel G. Burden. "Design of Recirculating Blue Crab SheddingSystems", Louisiana Sea Grant College Program, 1988.
Manthe, Don P., Ronald F. Malone and Sunil Kumar. "Limiting Factors Associated withNitrification in Closed Blue Crab Shedding Systems", Aquacultural Engineering, 3(1984):119-140.
Manthe, Don P., Ronald F. Malone and Harriet M. Perry. "Water Quality Fluctuations inResponse to Variable Loading in a Commercial, Closed Shedding Facility for Blue Crabs",Journal of Shellfish Research, 3:2(1983):175-182.
Oesterling, Michael. "Marine Aquaculture in the Commonwealth of Virginia", Virginia Instituteof Marine Science, Educational Series No. 39, 1993.
Oesterling, Michael. "Manual for Handling and Shedding Blue Crabs (Callinectes sapidus)",Virginia Institute of Marine Science, Special Report in Applied Marine Science and OceanEngineering, No. 271, 1995.
Oesterling, Mike and Niels Moore. "Characterization of the Virginia Soft Crab/Peeler Industry",Virginia Sea Grant Marine Resource Advisory No. 61, 1995.
Ogle, John T., Harriet M. Perry and Larry Nicholson. "Closed Recirculating Seawater Systemsfor Holding Intermolt Blue Crabs: Literature Review, Systems Design and Construction", GulfCoast Research laboratory, Technical Report Series No. 3, 1982.
Perry, Harriet M. and Ronald F. Malone (editors). "Proceedings of the National Symposium onthe Soft-Shelled Blue Crab Fishery", Gulf Coast Research Laboratory, 1985.

1
Design of Recirculating Crawfish Systems Employing Expandable Granular Biofilters
Ronald F. MaloneChevron USA Professor
Department of Civil and Environmental EngineeringLouisiana State University
Kelly A. RuschAssistant Professor-Research
Department of Civil andEnvironmental EngineeringLouisiana State University
J. Michael ChristensenResearch Associate
Department of Civil andEnvironmental EngineeringLouisiana State University
Introduction
Hard-shell crawfish production in Louisiana for 1995 totaled 96.6 million lb from 111,090 acresand grossed $57 million (LCES, 1995). Farm production contributed 57% of this total. Due tothe modest price/lb, which averaged $0.60 in 1995, the majority of farm production occursextensively in outdoor ponds (LCES, 1995). However, there are two areas of crawfish culturewhere recirculating systems are used; purging and soft-shell production. Roughly 3% of the totalcatch is held in purging systems for forty-eight to seventy-two hours prior to live shipping toremove unwanted waste products. By doing this, the producer can gain as much as $0.10 per lbin certain markets (pers. comm., J. Avery, Louisiana Cooperative Extension Service).
Concerns about influent water quality have led a number of crawfish producers to switch fromflow-through to recirculating purging systems. In our experience, the most commonly observedwater quality problem is turbidity (or high suspended solids), which is most often caused by rainand wind that can muddy large ponds and bayous. Attempts to convert systems to groundwater isoften thwarted by high iron levels in the water, which can cause mortality and staining of thepurged crawfish. Recirculating systems maximize the level of control by the operator, allowingtighter quality control of the end product.
Soft-shell crawfish production has been around since the mid-1970's (Huner and Avault, 1976). In the early 1980s, flow-through technologies became popular, but, these systems requiredtremendous amounts of good quality water. Additionally, the molting and mortality rates ofcrawfish in shedding systems are temperature dependent (Chen et al., 1995). Thus, consistenttemperature maintenance between 20 and 30°C is necessary for optimum production. Maintenance of flow-through systems at these temperatures during the winter months results inextremely high heating costs, and can become cost prohibitive (Malone and Burden, 1988a). Justas with purging systems, the need for more efficient and cost-effective soft-shell productionmethodologies dictated the movement to recirculating systems.

2
The movement to recirculating systems for soft-shell red swamp (Procambarus clarkii) and whiteriver (Procambarus zonangulus) crawfish production has taken place only within the last decadefollowing the development of standardized design criteria (Malone and Burden, 1988a) andoperational guidelines (Culley and Duobinis-Gray, 1990). Currently, there are no official annualproduction records for soft-shell crawfish; but, we estimate there to be 5 to 6 operators inLouisiana producing soft-shells for approximately $8-9/lb (pers. comm., T. Gerald, Ralph andKacoo's Restaurant, Baton Rouge, La.). These operations are based on stocking, holding, andfeeding intermolt crawfish for up to 45 days prior to molting, although, Chen and co-workers(1993) found that ablation of the eyestalk reduces the holding time to 7-10 days, thus dramaticallyincreasing the seasonal capacity of the system. The systems are constantly checked and themolted crawfish removed immediately and placed on ice to prevent hardening of the shell. Whilethe technology developed in the late 1980s is still currently being used successfully, recentadvances in filtration and recirculating design may facilitate a resurgence of the soft-shell crawfishindustry in Louisiana.
This paper discusses updated design criteria and operational guidelines for recirculating purgingand soft-shell production systems, and presents a design example of a typical soft-shell crawfishsystem.
Design Strategy
The design strategy presented here reflects an update of design criteria (Malone and Burden1988a) developed and widely tested in the late 1980's and early 1990's in Louisiana. Originally,these systems were modeled after the highly successful soft crab designs (Malone and Burden,1988b); but, separate designs evolved as the differences between the unfed saltwater and fedfreshwater systems became apparent. The submerged rock (or shell) filters, popular with the crabshedders, were abandoned by the crawfish industry because of a tendency to biofoul (Manthe etal, 1988) due to the organic loading associated with feeding. Instead, the more stable upflowsand/fluidized bed filters became the backbone of the recirculating system, providing reliablesolids capture and robust nitrification ability. Tray height was lowered, reflecting the reducedstature of the crawfish in comparison to the crab, and water levels became shallower as operatorslearned to maximize the ability of the crawfish to "dip" the gills out of the water to obtain oxygen. Recent successes in the application of floating bead filters for finfish growout systems has ledsome operators to replace the reliable upflow sand filter, simplifying operations while dramaticallyreducing waterloss associated with backwashing operations.
System Components
The system design illustrated here contains six major structural components (Figure 1). Waterdrains from the shallow holding trays (#1) downward through static screens (#2) to a sump (#3)used as a pick up point for the recirculation pump (#4), which passes the water through thegranular bead filter (#5) for reconditioning before returning to the trays by spray heads orbypassing to the reservoir (#6). Successful implementation of the design, however, requires that

3
attention be given to the design (Table 1) and operational (Table 2) details.
Figure 1. Recirculating crawfish systems are frequently configured with parallel flow between thefilter, sump, and trays.
Trays. Trays for soft crawfish operations are typically three feet by eight feet, which facilitateseasier handling of the animals. A tray height of four inches is sufficient to assure retention of theexploratory crawfish, provided the sidewalls are slick. Cambering or capping of corners is anabsolute necessity because the crawfish can climb virtually any right angled corner with ease. Fiberglass, fiberglass coated plywood, and PVC formed trays have all been used successfully.
Loading densities for soft crawfish production should be limited to about 1 pound of crawfish persquare foot of tray area (24 pounds for a three foot by eight foot tray). At these densities, waterdepths of 2 - 4 inches are permissible, provided the stand pipe allows the water level to drain toabout 0.75 inches during power failures. Spray heads should deliver 0.07 gpm/lb-crawfish as afine water spray so as not to induce a strong current in the tray.

4
Table 1: Basic design criteria for crawfish recirculating facilities.
Critical Process Point of Control Criteria CommentHolding Shallow trays 1 ft2/lb-crawfish for
shedding
0.33 ft2/lb-crawfish forpurging
Rectangular tanks withside walls of at least 4"with blocked or cappedcorners to prevent crawl-out.
Spray heads in tanks 0.07 gpm/lb-crawfish Spray heads shouldassure circulation in thetank
Aeration &Degasification
"Dipping" Water depth <0.75" Allow crawfish to raisegills above water foroxygenation
Circulation Water pump 0.12 gpm/lb-crawfish Assumes parallel flowbetween trays and filter
Static screens 0.006 ft2/lb-crawfish forprimary screens
Units should be designedto allow for bypass flowto secondary screenswhen clogged
Floating bead filter 0.005 ft3/lb-crawfish forshedding
0.004 ft3/lb-crawfish forpurging
Backwashing frequencyof once to twice per daymay be required
Solids Capture& Biofiltration
Upflow sand filter 0.0067 ft3/lb-crawfishfor purging and shedding
Backflushing frequencyof once to twice per daymaybe required
Heating In-line gas heater Sizing varies withlocality
Sump 0.7 gal/lb-crawfish Facilities watermanagement
Stabilization Reservoir 4.3 gal/lb-crawfish(excluding sump)
Provides for dilutionfollowing shock loading
Sodium bicarbonateaddition
Maintain at 150 mg-CaCO3/l
Check twice a weekAlkalinity Replenishment
Water exchange >3% day Tap water may be usedfor daily waterreplacement
Nitrite Removal Water exchange >3% dayColor Removal Water exchange >3% day
Purging system trays are loaded at much higher densities, approximately 3 pounds of crawfish persquare foot of tray area. Flow through spray heads should be increased proportionally to thedensity to maintain 0.07 gpm/lb-crawfish. Tray sides should be higher (6-8 inches) as crayfish willshow a tendency to stack up at these densities; and the water depth should be kept at about 0.5inches to prevent suffocation of crawfish trapped at the bottom of stacks.

5
Table 2: Operational criteria for recirculating soft-crawfish production and crawfish purgingsystems.
Parameter Soft-Crawfish Purging CommentspH 7.5-8.0 7.5-8.0
Total Alkalinity (mg-CaCO3/l)
100-200 100-200If pH target cannot be achievedwithin alkalinity range, increaserecirculation flows or aeratesump to strip more CO2
TAN (mg-N/l) <0.5 (unablated)<0.3 (ablated)
<2.0
NO2 (mg-N/l) <0.3 <1.0
Nitrite levels are more criticalthan TAN levels
Dissolved Oxygen(mg-O2/l)
>4.0 in trays>3.0 in filtereffluent
>2.0 in trays>2.0 in filtereffluent.
No backup aeration systemrequired as crawfish can survivefor extended periods by "dipping"above the water level.
Temperature (°C) 25-30 (unablated)<20 (ablated)
<20 Mortalities increase withtemperatures
Salinity <3 ppt <10 ppt
Recirculation Pumps. The recirculation rates recommended for soft crawfish production arebased on the need to supply oxygen to the crawfish (0.07 gpm/lb-crawfish) and to the biofilters(0.05 gpm/lb-crawfish). All aeration and degasification are assumed to occur in the spray heads. The efficiency of these operations is dependent on the flowrate.
The biofilters may be operated in series with or in parallel to the circulation between the sump andtrays. Parallel flow is often employed in systems using the flow sensitive, open topped, upflowsand filters. This practice facilitates better management of the upflow sand filter and allows forpressurized return flow to the trays. Floating bead filters, which are pressurized and less sensitiveto high flowrates, are more frequently plumbed in series with flow to the sump and spray heads. Proper plumbing in either case can enhance aeration rates in the sump, thus improving the overalldissolved oxygen levels in the system.
Low-head, centrifugal pumps commonly available for pools are typically used to provide waterrecirculation in purging and shedding systems. Most systems use two pumps to provide a back-up in case a mechanical failure occurs. In systems configured for parallel flow, the mainrecirculation pump servicing the trays should be sized to operate at a pressure of about 10 psi,which is adequate to provide a spray head pressure of about 5 psi after accounting for frictionaland head losses in the piping system. Pumps servicing upflow sand filters only can be expected tooperate at a much lower pressure range, typically only 2-3 psi. Pumps circulating water seriallythrough a floating bead filter and the spray heads should be capable of delivering the design flowat a pressure of about 15 psi, which allows for backpressure development across the bead bed asthe filtration cycle is extended to optimize nitrification.

6
Selection of a pump with an in-line filter basket (mesh size of about 1/8 inch) will preventclogging of the spray heads by particles that have bypassed the initial screens. Clearing of sprayheads clogged by bits of crawfish shell, snails, or sloughed biofloc is a time consuming processand can become a serious labor issue in systems not properly protected.
Screens. Crawfish are well known for their cannibalistic tendencies. This habit generates a largeamount of debris, principally in the form of claws and shell material that can cause seriousclogging problems. This material can also contribute to BOD buildup as the attached fleshdecays. The first step in the reconditioning of the water is simple screening using screens withmesh openings in the range of 1/8 to 1/4 inch. Rapid clogging can be anticipated. Thus, it isdesirable to have a bypass line that diverts water to a secondary screen when the primary screenhas become fouled. Screen systems should be designed for once or twice a day cleaning.
Granular filters. Expandable granular filters utilizing coarse sand or floating beads in an upflowconfiguration are now the most commonly recommended devices for performing the critical solidscapture and biofiltration functions in recirculating crawfish systems. Although a number ofsystems have been configured with a combination of upflow sand and fluidized bed filters (Maloneand Burden 1988a), Burden's (1988) analysis of a commercial soft crawfish shedding systemclearly showed that the majority of the nitrification occurred in the upflow sand filter. The coarsesand fluidized beds provided significant biofiltration only during peak loading periods when theoxygen delivery capacity of the upflow sand filter was overwhelmed due to inherently poorhydraulic capacity. Floating bead filters, with pressurized flow through the biofiltration bed, canbe operated at fluxrates that eliminate concerns of oxygen supply during peak loading periods. Additionally, their nitrification capacities are sufficient to eliminate the need for fluidized beds inmost applications.
Upflow sand filters (Figure 2) fall into the class of hydraulically washed expandable granularbiofilters. Filled with coarse river sand (#8/16 mesh, 1.19-2.38 mm diameter) underlain by aretaining layer of coarse gravel, the filters are designed to pass flow from the distribution plateupwards through the gravel and sand layers to the outlet. Upflow configurations are notsusceptible to the caking problems that plague pressurized, downflow sand filters. As the filterclogs due to biofilm development and solids accumulation, the flow channelizes, fluidizing a smallsection of the bed. This fluidization releases pressure that would otherwise compact the bed. Theexistence of localized "sand boils" provides a clear visual signal that backwashing is necessary. Upflow sand filters can be constructed out of locally available wood, fiberglass, or plasticmaterials or are available commercially. Design details are provided in Malone and Burden(1988a).

7
Figure 2. Recirculating crawfish systems commonly use unpressured upflow sand filters for solidscapture and biofiltration.
The application of upflow sand filters to recirculating soft-shell crawfish systems was highlysuccessful. The filters provided excellent solids control with nitrification problems occurring onlyduring periods of transition or excessive loading. The capabilities of the filter, however, areinherently limited by an operational fluxrate of approximately 9 gpm/ft2. Operational fluxratesabove this maximum cause premature fluidization, which quickly undermines the solids captureability of the filter. These low fluxrates limit the oxygen delivery to the filter, and in turn limitsthe nitrification ability, primarily with respect to the oxygen-sensitive nitrite conversion step. Volumetric nitrification conversions in the range of 4 gm/ft3-day can be steadily provided, withpeak capacities of about 8 gm/ft3-day. System cost is aggravated by the need for a backwashpump capable of delivering fluxrates of 65 gpm/ft2 . This cost could be offset by the use ofmultiple units; however, this approach increases space and labor requirements for backwashing. However, upflow sand filters remain an excellent technology for those that choose to build theirown filters.
Floating bead filters were developed specifically to retain the best features of the upflow sandfilter while eliminating the less desirable fluxrate and waterless aspects. The plastic beads float,allowing water to pass upward through the bed at higher fluxrates (10-30 gpm/ft2), virtuallyeliminating oxygen limitation as a concern. The caking problem is avoided by either aggressivelymixing the bed with motor-driven propellers (Figure 3) or by using a frequent

8
Figure 3. Propeller-washed floating bead filters are favored for large facilities because of thesmall footprint and large capacities.
Figure 4. Bead filters are operated as packed filtration beds most of the time. They mustperiodically be backwashed to remove captured solids and biofloc.

9
backwashing regime for the more gently washed units (Figure 4). Waterloss for units withinternal settling (Cooley, 1979; Wimberly, 1990; Chitta, 1993) is 1 - 5 percent of that required forupflow sand filters. Volumetric total ammonia nitrogen (TAN) conversion under typicaloperational conditions is about 8 gm/ft3 -day, with peak conversions in excess of 12 gm/ft3 -dayachievable under the light organic loading regime exhibited in soft-crawfish are shedding systems. The empirical sizing criteria reflects a high in-situ nitrification rate (Mia, 1996) that is observed inthese systems.
Optimization of floating bead filters, particularly the propeller-washed systems, requires a clearunderstanding of the biofilm growth and harvesting process. These aggressively washed units aresensitive to agitation time differences on the order of seconds. Many operators tend toinstinctively overwash the units, undermining their superior nitrification capacity. Principallyavailable through commercial outlets, floating bead filters appear costly, particularly incomparison to home constructed sand units. The difference in capital cost is counter-balanced bythe increased nitrification capacity and decreased water loss of the bead filters.
Sump. The principal function of the sump is water management. The sump provides a turbulent(to prevent settling) junction for returning waters and the pump intake(s). The sump is designedto have a retention time of approximately 5 minutes based on the capacity of the pump. Surgeprotection is provided, as well as compensation for variations in water level in the trays asconditions change due to pump interruptions or changes in flow distribution. Sumps are usuallybelow ground to facilitate screening of waters returning from the waist high trays.
Reservoir. The reservoir is an off-line pool of water that provides dilution capacity for the system. Essentially a stabilizer, TAN and nitrite peaks are dampened when a new batch of crawfish isadded. Crawfish are protected from short-term biofilter disruptions. Finally, the large volume ofwater tends to stabilize temperatures in the system.
The reservoir is usually buried outside the building for purging systems, but, may be placedindoors for shedding systems where heating is an important issue. The reservoir is plumbed tooverflow into the sump. A small amount of filtered water is continually fed into the reservoirinducing a slow mixing with the sump water. The flow to the reservoir should be set to aretention time of twelve hours.
Sludge buildup in the reservoir must be avoided. Large tanks fed by a low flow make excellentsettling basins. Settled solids quickly degrade, creating anoxic blankets that continually producenitrite. Two steps are normally taken to overcome this tendency. First, all the water entering thereservoir is prefiltered through the upflow sand or bead filter. This dramatically reduces the solidsloading. Secondly, a few carp or ornamental koi could be placed in the reservoir. These fish arenot fed and live by grazing on biofloc and sludge deposits. Their feeding activities keep the solidssuspended for eventual return to the sump.

10
Operational Guidelines
Culley and Duobinis-Gray (1990) presented detailed management strategies for recirculating soft-shelled crawfish systems. This section will focus on major management issues related tomaintenance of water quality. Generally, water quality is less critical for crawfish purging wherethe animals are only held for 48 -72 hours under cool water conditions than for crawfish sheddingduring which the animals are held for over a month. The use of feeds and high temperaturesincrease the importance of water quality for the shedding operations. Shedding systems thatemploy ablation to accelerate the molting process should adhere to the highest water qualitystandards. Specific issues of concern are addressed in the following subsections.
Loading. Loading in a shedding system is loosely defined by the pounds of crawfish held in thesystem under the assumption that they are fed about 0.5% of their body weight on a daily basis. More precisely, the loading should be defined in terms of organic loading (excreted BOD), solidsloading (suspended solids), and TAN loading. As a practical basis, the operator has only twovariables to adjust: 1) the total biomass of crawfish and 2) the feed rate. The latter can be usedfor short-term adjustments. Recirculating soft-shell crawfish systems work best when the loadinglevel is held steady. Two to three days are required for the nitrifying bacteria to adjust to anincrease in loading induced by introduction of a new batch of crawfish. During this transitoryperiod, TAN or nitrite levels will buildup. If the level of shock loading is small (<20 percent ofcurrent density), the reservoir should provide enough dilution to prevent serious harm to theanimals. The operator can help by reducing feed rates whenever elevated (>0.5 ppm-N) TAN ornitrite levels exist.
Purging systems, in contrast, are not fed; thus, increased loading levels are permissible. Sincepurging systems have a short turnover time between batches, shock loading is inevitable. However, this can be minimized by: 1) restocking the system the same day the previous batch washarvested or 2) stagger the loading of the system to maintain steady biomass levels.
pH Control. The pH should be kept in the range of 7.5-8.0. This range promotes the activities ofthe nitrifiying bacteria and minimizes the prospects for ammonia toxicity. The pH range is alsoreasonably compatible with field pH values which usually fall in the range of 7.0-9.0. The higherpH levels can occur in green water ponds. Low pH values (less than 7.0) are sometimes observedin wild harvested swamps.
The ratio of bicarbonate ions to the dissolved carbon dioxide concentration controls the pH of thesystem. As the system is loaded up, the carbon dioxide produced by crawfish and bacterialrespiration tends to accumulate. This carbon dioxide accumulation will cause a drop in the pH. At the same time, the nitrification process consumes bicarbonate ions. The combination of highdissolved carbon dioxide and low bicarbonates can create a radically low pH in the range of 4-5,which can shock newly stocked animals and severely inhibit the nitrifying bacteria required forTAN and nitrite control.

11
The first step in pH control is maintenance of total alkalinity levels by the addition of sodiumbicarbonate (NaHCO3) (Allain, 1988). Food grade sodium bicarbonate is commonly called"baking soda". This chemical dissociates in water to release inert sodium ions and bicarbonateions. In the pH range of 4.5-8.3, bicarbonate ions are the only significant contributor to totalalkalinity; and thus, their level can be estimated directly from a total alkalinity measurement. Whenever the total alkalinity falls below 150 mg-CaCO3/L, sodium bicarbonate should be added. Industrial grade sodium bicarbonate is widely available in fifty pound bags. Generally, a moderatesized system will require the addition of a few pounds of sodium bicarbonate every two to threedays.
If the pH falls below the target range of 7.5-8.0 after the alkalinity has been adjusted to a valueabove 150 mg-CaCO3/L, the system is probably suffering from excessively high dissolved carbondioxide levels. This can be verified by aerating a sample of water for an hour with an aquariumairstone. If the pH rises significantly, carbon dioxide is the problem. Carbon dioxide levels can belowered by increasing flow rates to spray heads and to the sump. Also, increasing ventilationaround air-water interfaces will help.
Dissolved Oxygen. Dissolved oxygen levels should be maintained above 4.0 mg/L in sheddingsystem trays to minimize stress on molting crawfish. Purging systems, on the other hand, can beoperated with a little more leniency because of the short holding time of the crawfish and shallowwater levels in the trays (which allows for "dipping").
The dissolved oxygen levels of the effluent from the filters should be maintained above 2.0 mg/L(purging) or 3.0 mg/L (shedding) to assure adequate oxygen in the filter for the biologicalconversion of organic and nitrogenous wastes.
Temperature Management. Increasing temperatures will increase the metabolism of the crawfishand bacteria. From a water quality perspective, the system can be operated at any temperaturedesired. Thus, temperature selection should be controlled by the production objectives. Moltingrates and mortalities increase with temperature (Chen et al., 1995). Traditional molting systemsare usually operated at elevated temperatures (>25°C) to assure reasonable molting rates. Carefulhandling and strict adherence to water quality guidelines are used to control mortalities. Coolerwaters (<20°C) appear to be the optimum for ablated systems where the molt is artificiallyaccelerated, but, consistent temperature and excellent water quality are required to controlmortalities. There is little or no benefit to accelerating the metabolism of crawfish for purging;and ambient or cooled temperatures below 20°C would appear to result in lower mortality.
Water Exchange. Water will be lost on a regular basis from a recirculating crawfish system as aresult of the backwashing of upflow sand filters and bubble-washed filters. Propeller-washedsystems lose very little water. The daily water loss and replacement rate should be about 3-5% ofthe total volume of the system. If less than 3% is lost per day, water exchange should be inducedby a fresh water addition every few days so that the average turnover ranges from 20-30 days (3-5% per day). This water exchange prevents the long term buildup of nitrates and other ions thatcan adversely impact the health of the crawfish.

12
Design Example
Table 3 presents sizing criteria for the major components of a 600 lb soft-shell crawfish sheddingsystem. The system is comprised of 25 shallow, 3' x 8' trays, each serviced by two sprayheadsdelivering a total flow of approximately 1.7 gpm. A single, 3 ft3 bead filter (or alternatively two 2ft3 upflow sand filters) provide for solids capture and nitrification within the system. The sump issized at roughly 500 gallons and the reservoir at 2,500 gallons, providing a system volume of 5gallons per pound of crawfish in the system. The system was designed to operate with parallelflow between the filter and trays, thus, a pump with a discharge capacity of 72 gpm @ 15 psi isrequired. Flow to the filter is 30 gpm with 26 gpm returning directly to the sump and 4 gpmdischarged to the reservoir to assure a turnover rate of twice a day. Water losses associated withbackwashing a bubble-washed bead filter (once or twice a day) bracket the target freshwaterexchange rate of 90-150 gal/day. Backwashing losses associated with the upflow sand filterwould exceed this minimum, whereas, a propeller-washed bead filter would only lose about 5-10gallons a day requiring additional exchange. Sodium bicarbonate additions should be less thantwo pounds per week with the actual rate being dependent on alkalinity levels of the source water.
Table 3: A design example for a 25 tray shedding system with a holding capacity of 600 lb.
Component No. Size CommentTrays 25 3' x 8'x 4"Spray heads 50 3/4" Plastic garden hose shutoff valves work well hereScreens 2 2' x 2' A second screen is provided to backup the primary
in case of clogging1 3 ft3Biofilter (Options)*2 2 ft3 Upflow sand filter volume requirement split to
facilitate backwashingPump 1 72 gpm Assumes parallel flow for trays (42 gpm) and
biofilter (30 gpm). Reservoir is served by biofiltereffluent.
Sump 1 500 galReservoir 1 2,500 gal
Sump contains 7 minutes of pump flow and thetotal volume of the sump/reservoir combinationpermits system drawdown without spillage
*Either the upflow sand filter or the bead filter can be used.
The design example for the 25 tray purging system (Table 4) illustrates the dramatic effect ofincreased tray density on the carrying capacity of the system. The 1,800 pound system must befortified with additional biofiltration capacity, flowrates, and system volume to assure stableperformance. The number of spray heads is increased from 2 to 4 per tray to assure good flowdistribution over the densely packed crawfish. The flow rate is tripled in comparison to theshedding system. The organic loading rate drops in the unfed purging system allowing anadjustment to the floating bead filter sizing criteria. The difference in the sizing of the upflowsand filters (12 ft3 ) and the bead filter (8 ft3 ) reflects differences in oxygen transport capabilities

13
of the two filters. The sump/reservoir combination volume of 9,000 gallons is particularlyimportant for purging systems that maybe erratically loaded due to weather induced harvestingfluctuations.
Table 4: A design example for a 25 tray crawfish purging system with a 1800 lb capacity.
Component No. Size CommentTrays 25 3' x 8'x 4"Spray heads 100 3/4" Four sprayheads per tray to facilitate increased
flowsScreens 4 3' x 2' 2 backup screens are stacked under the primaries as
backup for clogging2 4 ft3 Bead filter volume rounded up to the next highest
cubic footBiofilter (Options)*
4 3 ft3 Upflow sand filter volume requirement split tofacilitate backwashing
Pump 1 216 gpm Assumes parallel flow for trays (126 gpm) andbiofilter (90 gpm). Reservoir is served by biofiltereffluent.
Sump 1 1,500 galReservoir 1 7,500 gal
Sump contains 7 minutes of pump flow and thetotal volume of the sump/reservoir combinationpermits system drawdown without spillage
* Either the upflow sand filter or the bead filter can be used.
Acknowledgements
This research was supported by the Louisiana Sea Grant College Program, a part of the NationalSea Grant College Program maintained by the National Oceanic and Atmospheric Administration,U.S. Department of Commerce and the National Coastal Resources and Research DevelopmentInstitute.
Literature Cited
Allain, P.A. Ion Shifts and pH Management in High Density Shedding Systems for Blue Crab(Callinectes sapidus) and Red Swamp Crawfish (Procambarus clarkii). Master's Thesis,Louisiana State University, Baton Rouge, Louisiana, 74 pp., 1988.
Burden, D.G. Development and Design of a Fluidized Bed/Upflow Sand Filter Configuration forUse in Recirculating Aquaculture Systems. Ph.D. Dissertation, Louisiana State University, BatonRouge, Louisiana, 140 pp., 1988.
Chen, S., R.F. Malone and J.V. Huner. "Molting and Mortality of Red Swamp and White RiverCrawfish Subjected to Eyestalk Ablation: A Preliminary Study for Commercial Soft-ShellCrawfish Production". J. of World Aqua. Soc. (1993):24:148-57.

14
Chen, S., J. Wu, and R.F. Malone. "Effects of temperature on mean molt interval, molting andmortality of red swamp crawfish (Procambarus clarkii)". Aquaculture (1995):131:205-217.
Chitta, B.S. Effects of Backwash Frequency on Nitrification in Plastic Bead Media Biofiltersused in Recirculating Finfish Culture Systems. Master's Thesis, Louisiana State University,Baton Rouge, Louisiana, 129 pp, 1993.
Cooley. P.E. Nitrification in Fish-hatchery Reuse Water Utilizing Low-density PolyethyleneBeads as a Fixed-film Media Type. Master's Thesis, University of Idaho, Moscow, Idaho, 1979.
Culley, D. and L. Duobinis-Gray. Culture of Louisiana Soft Crawfish. Sea Grant PublicationNo. LSU-T-90-002, Center for Wetland Resources, Louisiana State University, Baton Rouge,Louisiana, USA. 1990.
Huner, J.V. and J.W. Avault. "The Molt Cycle of Subadult Red Swamp Crawfish, Procambarusclarkii (Girard)". Proceedings of the World Mariculture Society (1976):7:267-273.
LCES, Louisiana Cooperative Extension Service. Louisiana Summary: Agricultural and NaturalResources 1995. Publication No. 2382, 1995.
Malone, R.F and D.G. Burden. Design of Recirculating Soft Crawfish Shedding Systems. Louisiana Sea Grant College Program Publication, Louisiana State University, Baton Rouge,Louisiana, 74 pp., 1988a.
Malone, R.F. and D.G. Burden. Design of Recirculating Blue Crab Shedding Systems. Louisiana Sea Grant college Program Publication, Louisiana State University, Baton Rouge,Louisiana, 76 pp., 1988b.
Manthe, D.P., R.F. Malone and S. Kumar. "Submerged Rock Filter Evaluation Using an OxygenConsumption Criterion for Closed Recirculating Systems". J. of Aqua. Eng. (1988): 7:97-111.
Mia, R.I. In Situ Nitrification on High Density Recirculating Aquaculture Production Systems. Master's Thesis, Louisiana State University, Baton Rouge, Louisiana, 90 pp., 1996.
Wimberly. D.M. Development and Evaluation of a Low Density Media Biofiltration Unit for usein Recirculating Culture Systems. Master's Thesis, Louisiana State University, Baton Rouge,Louisiana, 162 pp., 1990

1
Measurements of Metabolic Rates of Sturgeon and Striped Bass underCommercial Culture Conditions
Steven L. ThomasGraduate Research AssistantDepartment of Biological and
Agricultural EngineeringUniversity of California, Davis
Dr. Raul H. PiedrahitaAssociate Professor
Department of Biological andAgricultural Engineering
University of California, Davis
Introduction
Modeling intensive aquaculture systems can aid in farm design and management. Models can beused to optimize farm operations, and predict water usage, energy consumption, fish growth andprofits. A necessary component of modeling aquaculture systems is predicting metabolic rates(oxygen consumption, and carbon dioxide and ammonia production), as determined by feeding,stocking densities, and other variables.
Most studies of metabolic rates are conducted under laboratory conditions. Usually, a single fishis studied in a respirometer where environmental parameters can be controlled by the researcher. Often, the fish is starved so that a routine metabolic rate can be determined. Such measuredvalues are of little use to an aquaculturist for many reason. First, many authors have foundmetabolic rates of schooling fish to decrease when in groups, whereas metabolic rates ofterritorial species can increase under the same conditions (Ruer et al., 1986). Secondly, feedingbehavior and circadian rhythms can have a dramatic effect on metabolic rates. It is normal for fishto have diurnal activity patterns in addition to increased activity associated with feeding. Suchpatters are important to the aquaculturist to know when the greatest demands on the systems willoccur. And finally, under commercial culture conditions many environmental factors may affectmetabolic rates and the concentrations of metabolites in the system.
In this study, oxygen consumption, and CO2 , and ammonia production rates of white sturgeon(Acipenser transmontanus) and striped bass (Morones saxatilis) were measured in commercialscale aquaculture facilities. By using an entire fish tank as an open respirometer the net effects ofall factors contributing to oxygen consumption and CO2 and ammonia production can bemeasured. However, using a whole fish tank as a respirometer may result in values heavilydependent on specific conditions of a tank that are difficult to measure, such as stream velocities,stagnant zones, and the activity of microbial populations in suspension in the water column, andliving in slime layers within the tank.
Goal of Study
The main goal of this research was to create models for predicting metabolic rates of striped bass(Morones saxatilis) and white sturgeon (Acipenser transmontanus) for use in a larger project

2
modeling intensive aquaculture production facilities. The larger project has created a modelingsystem to predict water quality in recirculating aquaculture production systems that include avariety of water treatment units. The modeling system is based on the creation of a "library" ofsub-models for different water treatment processes and units. These sub-models can be combinedto create a model representing a particular aquaculture system. Each sub-model, or block, has adialog box into which the user can enter values for independent variables significant for thatblock. One such sub-model is for a fish tank. Production variables set by the user include influentwater flow rate, various influent water quality parameters, and the species, number and size of fishbeing cultured. The metabolic rates for the fish are determined in the fish tank sub-model basedon the production and water quality data supplied.
Materials and Methods
Automated Water Monitoring System
A continuous, automated water monitoring system was designed to measure dissolved oxygen,pH, and temperature of up to three water streams entering and exiting a fish tank. From thesedata, and alkalinity data taken from grab samples, it was possible to calculate oxygen consumptionrates and carbon dioxide production rates. A schematic of the automated water monitoringsystem is shown in Figure 1.
Monitoring Manifold
The manifold was made of 3/4 inch clear PVC pipe to allow observations of water flow throughthe manifold. Ports for a DO probe, a pH probe, an automatic temperature compensator (ATC)thermistor, a thermocouple, and ground wire were made using standard 3/4 inch clear PVC pipefittings. Additional tee fittings were inserted in the manifold to facilitate easy cleaning.
Three influent ports to the manifold allowed monitoring of up to three water sources. Eachinfluent port had a check valve to prevent back flow, and a Red Hat 8210, 12 volt DC, normallyclosed solenoid valve with 3/4 inch pipe fittings. Each port also had an in line screen with 40mesh stainless steel screen material to limit fouling of the solenoid valves.
Adapters were fashioned from PVC pipe fittings to tap into influent lines to the tanks, and hoseswere fixed in the tank's effluent stream for collecting effluent water samples. Siphons wereestablished to deliver water from influent, effluent, and oxygenation (if present) water streams bygravity to prevent changes in dissolved gas concentrations that could occur with pumping ofwater samples. Effluent from the manifold was discharged with tank effluents. Hoses wereflushed periodically by backwashing with high pressure, clean water. All equipment coming incontact with water flows was disinfected between tests with chlorine bleach and rinsed.

3
Figure 1: Schematic diagram of components in the automated water monitoring system.1
Instrumentation
A Campbell Scientific, Inc. CR10 micrologger was used to energize solenoid valves controllingwater flow through the manifold, to collect data from sensors and modify the signals if necessary,and to store DO, pH and temperature data with a time stamp. A laptop computer was used tointerface with the micrologger for programming and downloading of data.
Dissolved oxygen was measured using a Royce Instruments Model 900 dissolved oxygen analyzerequipped with a model 95 sensor. A 2 mil membrane was used in all data collection runs to allowfor DO concentrations of up to 40 mg L-1.
An Omega Model PHB 52 pH meter was used to monitor the pH of water flowing through thesystem. A Sensorex S200C pH probe, and a thermistor for automatic temperature compensationwere used.
Temperature data were recorded using a copper-constantan type thermocouple. A model1OTCRT thermocouple reference was used as indicated in the literature from Campbell Scientific,Inc. to record a reference temperature.
1 Mention of a specific product or trade name does not constitute an endorsement by the University of California norimply its approval to the exclusion of other suitable products.

4
Automatic Water Sampler
An ISCO model 2900 autosampler was used to take water samples from the effluent stream oftanks being monitored. The autosampler consisted of a peristaltic pump, a base for holding 24,500 ml sample bottles, and a controller that could be programmed to take periodic samples of ameasured volume of water from a single water source. A normal sampling process involvedpurging the sampling line, drawing a water sample, and again purging water from the samplingline.
In this study, the autosampler was programmed to collect a water sample of 50 - 100 ml every 15minutes and to store 4 water samples in each of the 24 bottles. The composite samplesrepresented an average of an hour's water quality. Ice was packed around the sample bottles inthe base of the autosampler to cool water samples and limit ammonia volatilization. During thecooler months the volume of ice that the autosampler could hold was sufficient to keep watersamples cold for 24 hours. In the cooler months, water samples were collected once per day andtaken to the laboratory for analysis of ammonia concentration using a Hach DR 2000spectrophotometer. During the warmer months water samples were collected twice each day andammonia concentrations were measured in the field using the same method.
Alkalinity was measured from selected samples collected by the autosampler and in grab samplesof influent and effluent waters on the farm. Measurements were made using a LaMotte field testkit with a resolution of 4 mg L-1 as CaCO3. Alkalinity measurements were determined to bereasonably constant over a diurnal period for each test tank.
Flow rates were measured using an Omega ultrasonic velocity meter or by measuring the timerequired to fill a known volume of water. The velocity meter measured the average watervelocity in the pipe, with a resolution of 0.1 ft s-1. Flow rates were calculated by multiplying theaverage velocity determined with the velocity meter by the cross sectional area of the pipe. Useof the velocity meter required that the water had either suspended particulates or bubbles to give asteady, accurate reading, and water velocities had to be greater than 1.0 foot per second (0.305 ms-1). When possible, both methods of measuring water flow rates were used as a cross check.
Feeds and Feeding
Two different feeds were used at the three farms where this research was carried out. Data sets inTable 1 identified with the letter F used a pelleted diet with 40% protein and 10% lipid. Data setsidentified with an L used a pelleted diet with 44% protein and 20% lipid. Because the researchershad limited control over the parameters to be tested, the two diets could not be compared forperformance.
Feeding was done by the regular farm workers. Feed amounts were measured by volume in allcases. Accuracy of feed amounts were not determined. In most cases, a morning feeding wasgiven at approximately the same time each day. Afternoon and evening feedings may have variedsomewhat between days. Precise records of feed times were not kept by farm workers and were
5
out of the control of the researchers.
Fish Tank Configurations
Tanks at all three farms were set up as flow through systems during the testing periods, i.e. theinfluent water streams for all tanks were degassed well water and tank effluents were notrecirculated through the farms. Therefore, no water treatment units were required to remove CO2
or ammonia, and as a result, all influent water streams remain unchanged during the tests.
In an effort to record the best data possible, fish tanks chosen to for the study had to meet certainrequirements. Fish had to be in good health and acclimated to the feeding regime to be used inthe study to avoid effects due to changing feeding rates. Fish also could not have been subjectedto unusual amounts of stress, such as being moved recently or having a portion of the tankharvested soon before recording data.
Tanks chosen to be studied used no aerators, diffusers, or other equipment that added oxygen in away that could not be quantified with the monitoring equipment used in this study. At one farm,tank water was pumped through a U-tube oxygenator and returned to the tank. In this case, therate of oxygen addition to the system was determined by measuring the water flow rate to the U-tube, and the dissolved oxygen concentration in the flow entering and exiting the U-tube.
Mass Balance Analysis
Metabolic rates were calculated using mass balance analyses on reference materials and modelingtanks as continuous flow stirred tank reactors (CFSTR). The CFSTR model sets in assumeswater in the tank is uniform, thus the effluent stream has the same water quality as the water atany point in the tank. The general mass balance equation is:
ACCUMULATION = INPUT - OUTPUT + PRODUCTION - CONSUMPTION (1)
where ACCUMULATION is the change in concentration of the reference material in the tankover a given period of time multiplied by the tank volume (assuming that the tank volume remainsunchanged), INPUT and OUTPUT are the rates at which the reference material flows into andout of the tank, respectively, and PRODUCTION and CONSUMPTION are the production andconsumption rates of the reference material within the tank, respectively. Each term has units ofmass per unit time, e.g. mg h-1. The equation can be rewritten as,
VrVrCQCQVt
CXcXpeeii −+Σ−Σ=
∆∆
)()( (2)
where,∆C/∆t = the change in concentration of the reference material in the tank over a period oftime (mg L-1 min-1),Qi = the flow rate of water entering the tank (L min-1)

6
Qc = the flow rate of water exiting the tank (L min-1),Ci = the concentration of the reference material in an influent flow stream (mg L-1)Cc = the concentration of the reference material in an effluent stream (mg L-1)V = the tank volume (L),rXp = the production rate of the reference material (mg L-1 min-1), andrXc = the consumption rate of the reference material (mg L-1 min-1).
By measuring the concentration of a reference material over time, it is possible to use Eq. 2 tosolve for the net rate of production or consumption of that material. Oxygen consumption rateswere calculated using dissolved oxygen (DO) as the reference material. DO values weremeasured directly in units of mg L-1 in the automated water monitoring system. CO2 productionrates were calculated using total carbonate carbon (CtCO3) as the reference material. It wasassumed that any change in CtCO3 between influent and effluent streams was due to CO2
production. CtCO3 concentrations were calculated from pH and temperature data collected withthe automated water monitoring system, and alkalinity values measured as described above. Ammonia production rates were calculated using total ammonia nitrogen (TAN) as the referencematerial. TAN concentrations were measured in water samples from the ISCO autosampler. Spot check monitoring of TAN concentrations in influent waters were consistently undetectableand did not need to be measured continuously.
Results and Discussion
Because data collected as part of this study were from working fish farms, researchers werelimited in the variables they could control. Problems with integrating data recording equipment,maintaining water monitoring equipment, requirements of farm operation such as harvesting,treatment, etc., all limited the quantity of data collected. Data are being analyzed by multipleregression analysis to determine regression equations describing metabolic rates as functions ofvarious independent variables. Principal component analysis is also being used to look at the datafrom another perspective. Results from multiple regression analysis and principal componentanalysis are not available at the time of printing. The most useful results to date are thequalitative trends identified in the data which could guide future research.
Summary of Data
Summaries of calculated metabolic rates for sturgeon and striped bass are presented in Tables 1and 2, respectively. Rates are expressed in units of milligrams substance per kilogram fish perhour (mg kgFish-1 h-1 ), and kilograms substance per kilograms feed fed (kg kgFeed-1). Each dataset represents one or more 24 hour periods with identical values for the variables listed in Tables 3and 4. Data sets are identified by letter/number combinations identifying the farm and the tanknumber tested. Tanks identified with an L were 7.3 m in diameter and 1.6 m deep and had waterexchange rates of 9.6 to 11.6 tank volumes per day. Those labeled with an F were 6.1 m indiameter and 0.89 m deep and had water exchange rates of 11.0 to 12.7 tank volumes per day.

7
Table 1: Calculated metabolic rates for white sturgeon.
ID L5 L5a* L5b* L5c* L5d*‡ L5e L7 L9 F12 F19 F06RO2 310 329 323 307 261 295 73 64 90 75 118RCO2 514 658 488 585 430 576 187 189 315 179 393RNH3 9.91 - 26.1 27.6 17.8 18.9 1.514 2.103 3.48 3.45 5.65
O2 CON 0.368 0.318 0.298 0.286 0.712 0.273 0.996 0.697 0.232 0.304 0.466CO2 PRO 0.540 0.633 0.457 0.545 1.156 0.538 2.60 2.10 0.842 0.721 1.59NH3 PRO 0.0133 - 0.0213 0.0264 0.0514 0.0182 0.0206 0.0505 0.0095 0.0161 0.0221
n 2 1 1 3 1 1 4 2 3 2 1
RO2 = oxygen consumption rates (mg kgFish-1 h-1)RCO2 = CO2 production rates (mg kgFish-1 h-1)RNH3 = ammonia-N production rates (mg kgFish-1 h-1)O2 CON = oxygen consumption rates (kgO2 kgFeed-1)CO2PRO = CO2 production rates (kgCO2 kgFeed-1)NH3PRO = ammonia-N production rate (kg TAN kgFeed-1)n= the number of days over which data were collected for each data set
*Data sets L5a through L5e are sequential data sets. During this period the feed ration variedslightly over the first three days (L5a through L5c); all three days of test L5c had the same feedration. On the sixth day, the first two feeding times were skipped so that only about one third ofthe regular ration was fed. Data set L5e is data from the day following L5d and has the sameindependent variables as in L5c, but these data were treated separately to determine if there wereany effects from the low feeding rate of the previous day.
‡ Four hours of DO, pH, and water temperature data collected on this day were lost due to thefailure of a valve in the automated water monitoring system. No data for ammonia productionrates was lost. Oxygen consumption and CO2 production rates reported are values measuredexcluding the four hours of missing data. The missing data were from 1200 to 1600 on this day.
Table 2: Measured metabolic rate values of striped bass in production scale facilities. Terms areas defined in Table 1.
L5 L6RO2 388 320RCO2 733 775RNH3 15.75 17.53
O2CON 0.311 0.520CO2PRO 0.586 1.264NH3PRO 0.0148 0.0300
N 2 1
8
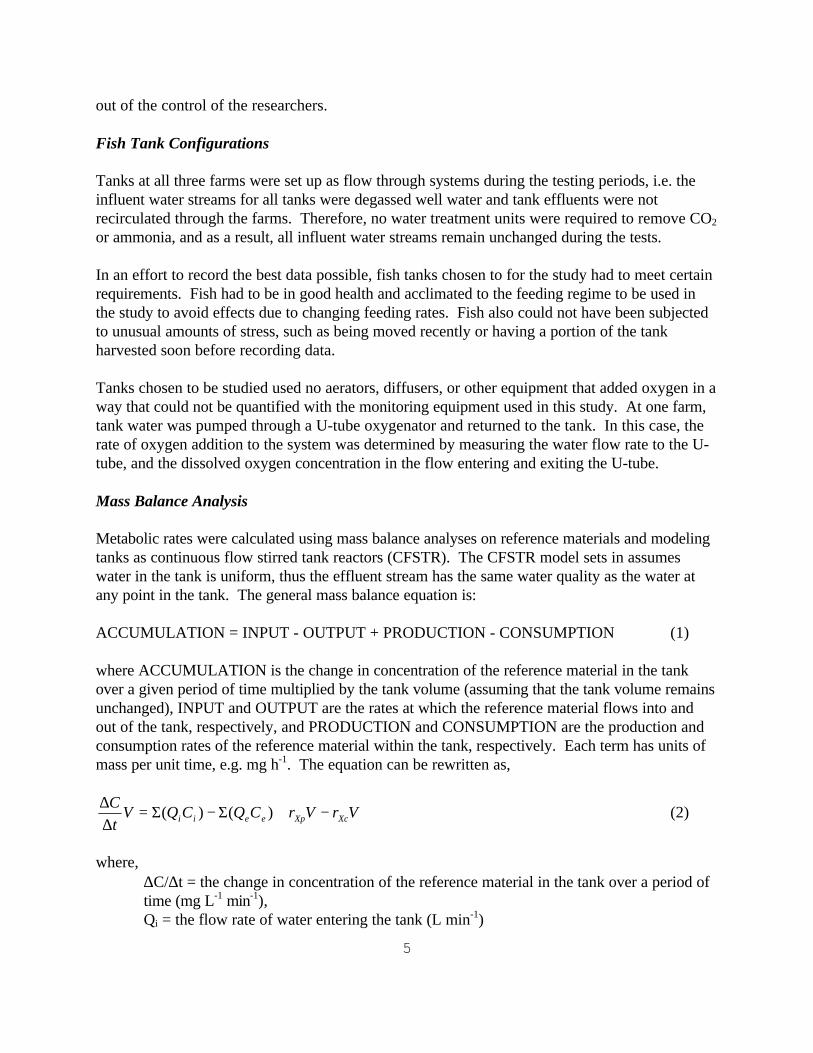
Table 3: Independent variables in white sturgeon data sets. Tank identification are as defined inTable 1.
ID L5 L5a L5b L5c L5d L5e L7 L9 F12 F19 F06RATION 2 2.5 3.0 2.6 0.87 2.6 0.18 0.22 0.93 0.64 0.6SIZE 0.505 0.545 0.545 0.545 0.545 0.545 2.5 3.81 0.429 0.415 0.088DENSITY† 48.12 49.7 49.7 49.7 49.7 49.7 202 162 20.2 17.1 13DO ave 13.3 13.6 12.3 10.9 15.2 14.4 14.0 13.6 3.67 4.3 3.9TEMP ave 22.8 20.3 20.4 20.4 19.9 20.3 19.2 20.1 20.0 21.3 21.1
RATION = feed ration as a percentage of body massSIZE = the average mass of fish in the data set (kg)DENSITY = the stocking density, (kg m-2) for sturgeon, (kg m-3) for striped bassDO ave = the mean DO concentration measured in the effluent stream (mg L-1)TEMP ave = the mean effluent water temperature
† For sturgeon, density measurements were derived in terms of fish biomass per square meter oftank bottom (kg m-2) because of the demersal behavior of sturgeon and because these units havebeen used by other authors in previous studies.
Table 4: Independent variables in striped bass data sets. Terms are as defined in Table 3.
ID L5 L6RATION 3.26 1.48SIZE 0.236 0.227DENSITY 30.2 54DO ave 12.1 10.4TEMP ave 20.7 21.1
The data are incomplete in that it was not possible to hold variables constant in an effort to studythe effects of only one independent variable. Limitations in the data collection equipment usedand the availability of fish to study severely limited the data that could be collected. Therefore,the data leave questions unanswered. As an example, the largest fish sizes used in the study (datasets L7 and L9) corresponded to the greatest stocking densities and the lowest feed rations,making it impossible to isolate the effects of the a single factor.
Data Analysis
Calculated metabolic rate values (RO2, RCO2, and RNH3) were plotted against feed ration, fishmass, density, and low, mean, and average values of tank DO concentrations and temperature. From these plots, feed ration, fish mass, and stocking density showed possible relationships withthe metabolic rates.

9
Effects of Feed Ration
A strong, direct relationship was seen between metabolic rates and the amount of feed given(Figure 2). The relationship seemed to be linear for RO2 and RCO2 values in the range offeeding rates seen in this study. RNH3 values were also directly proportional to the feeding rateraised to the 1.5 power. Values of RNH3 in Figure 2 do not take into account the amounts ofprotein in the feeds. Kaushik (1980), found the amount of ammonia excreted by fish to be linearlydependent on the amount of protein consumed by the fish, but the quality of the protein had agreater impact.
RO2 and RCO2 values for the data set with a feed ration of 0.87% (L5d) are noticeably greaterthan other values in that feed ration range. As described above, the day these data were recordedwas an anomaly in that the fish in this tank were acclimated to receiving about three times theamount of feed that they received on this day. Unfortunately, four hours of data were lost for thisday. The values for RO2 and RCO2 reported for this day in Table 1 are averages for this dayexcluding the four hours of missing data. The trends in RO2 and RCO2 for the time just prior to,and just after the missing data implied the metabolic rates rates may be slightly higher than thetrue mean values. Interestingly, the reported values are higher than those seen for the previousfive days when feeding rates were about three times greater. Ammonia data were not lost for thisday. Ammonia production rates were lower on during this time may have been slightly lower thanaverage for the day, thus the reported this day and the following day when normal feeding ratesresumed, by 35.5% and 31.5%, respectively. This implies that when subjected to a one dayreduction in feed, sturgeon acclimated to a feed ration of approximately 2.0% appeared to
Figure 2: Calculated metabolic rate values plotted against feed ration.Data are from Tables 1 and 3.

10
maintain normal respiration rates, probably in anticipation of being fed. The energy to maintainrespiration rates came from the catabolism of body proteins and fats which should releasenitrogenous products mainly in the form of unionized ammonia. However, ammonia productionrates decreased significantly for not only the day that the feeding ration was reduced, but also forthe following day when the "normal" feed ration was resumed.
Effects of Fish Mass and Stocking Density
From Figures 3 and 4, it appears that there may be an inverse relationship between metabolic ratesand stocking density and fish mass, although not enough data are available to make a conclusivestatement. The two largest fish sizes used in this study (data sets L7 and L9) corresponded to thegreatest stocking densities and the lowest feed rations. Therefore, it can not be said with certaintythat the low metabolic rates measured in data sets L7 and L9 were due to a low feed ration alone,or if fish size and stocking densities contributed to the low metabolic rates. Ruer et al.(1986), in astudy on white sturgeon, found a strong positive relationship between routine oxygenconsumption rates and stocking density within the range of 5.4 and 23.9 kg m-2. Although fishsize, stocking density, and feed ration may be independent of each other, in practice thesevariables are related. A single lumped parameter including these three variables may be able toexplain a large proportion of the variance in the data using principal component analysis.
Figure 3: Plots of metabolic rates plotted against fish mass. Data are from Tables 1 and 3.

11
Figure 4: Calculated metabolic rates plotted against stocking density. Data are from Tables 1 and 3.
Effects of Temperature
The range of temperatures encountered in this study was not broad enough to show anycorrelation with metabolic rates. Previous work with modeling growth rates have shown thattemperature has a strong effect on metabolic rates. The ideal temperature for sturgeon fishgrowth has been reported to be approximately 21°C, very near the average temperature for watersseen in all tests of this study.
Conclusion
Results of the tests conducted at California farms revealed interesting patterns and relationships. The rates of oxygen consumption, and of ammonia and carbon dioxide production vary widely fordifferent fish sizes, stocking densities, feeding rates, and feed qualities. Accurate prediction ofmetabolic rates under production conditions may need to be based on measurements taken underconditions similar to those used in the production system.
A high respiratory quotient was calculated for all tests with sturgeon. Further measurementsshould be taken to confirm the values calculated, but all indications are that carbon dioxideincreases in sturgeon culture water are substantially higher than could be expected from estimatesof oxygen consumption. Kutty (1968) suggested that an RQ above unity is an indication ofanaerobiosis and that the magnitude of the RQ above unity is an index of intensity of anaerobiosis. However, DO concentrations were near saturation for all tests except in data sets F06, F12, andF19, where hypoxic conditions existed over night. In these three tests, RQ values were indeedhigher than in most other data sets, but in no data set was the RQ as low as unity. Respiratoryquotient values measured by Kutty (1968) in goldfish and rainbow trout in waters with DOconcentrations of about 8.5 were 0.93 and 1.05, respectively. Decreasing DO concentrationsincreased RQ values to as high as 2.43 in gold fish, and 2.75 in rainbow trout at DO levels of 1.4

12
and 1.6 mg L-1, respectively. RQ values measured in this study ranged from 1.10 to 2.15 forsturgeon in well oxygenated waters, and rose as high as 2.55 in data set F12 where the mean DOconcentration was 3.7 mg L-1.
Oxygen consumption rates measured in this study where in the range of values measured in otherstudies. Burggren and Randall (1978) measured values of 730 mg kgFish-1 h-1, for A.transmontanus weighing 0.82 - 1.06 kg at 15°C, and values of 152 mg kgFish-1 h-1, weremeasured by Randall et al. (1992) at 25°C in a respirometer for 0.784 kg cobice sturgeon (A.naccarii) fed to satiation. Ruer et al. measured routine oxygen consumption rate values of 94.3mg kgFish-0.66 h-1 at 18°C for white sturgeon fed a ration of 0.65% prior to testing.
Ammonia production rates measured in this study varied up to 18 fold, ranging from 1.514 to27.6 mg kgFish-1 h-1. These values where in the range of rates measured by Dabrowski (1986)who measured values of 12.28 to 18.08 mg kgFish-1 h-1 for 0.142 kg A. baeri fed a commercialsalmon fry diet. In the same study, ammonia production rates were greater (19.78 to 30.53 mgkgFish-1 h-1) for larger fish (0.339 kg) receiving a diet of live Tubifex.
Acknowledgments
This work is funded by a grant from the National Sea Grant College Program, National Oceanicand Atmospheric Administration, U.S. Department of Commerce, under grant numberNA36RG0537, Project number 75-A-N through the California Sea Grant College System. Theviews expressed herein are those of the authors and do not necessarily reflect the views of NOAAor any of its sub-agencies. The U.S. Government is authorized to reproduce and distribute forgovernmental purposes. The collaboration of the following farms is gratefully acknowledged:Laguna Creek Fish Company, Stolt Sea Farms, The Fishery.
Literature Cited
Burggen, W.W., and Randall, D.J. "Oxygen uptake and transport during hypoxic exposure in thesturgeon (Acipenser transmontanus)". Respir. Physiol. 34: 171-183. 1978.
Dabrowski, K., Kaushik, S.J., and Fauconneau, B. "Rearing of Sturgeon (Acipenser baeriBrandt) Larvae. III. Nitrogen and Energy Metabolism and Amino Acid Absorption".Aquaculture, 65: 31-41. 1986.
Kaushik, S.J. "Influence of nutritional status on the nitrogen excretion in the carp and the rainbowtrout". Reprod. Nutr. Dev., 20: 1751-1765. 1980.
Kutty, M.N. "Respiratory Quotients in Goldfish and Rainbow Trout.” J Fish. Res, Bd. Canada.25(8): 1689-1728. 1968.

13
Randall, D.J., McKenzie, D.J., Abrami, G., Bondiolotti, G.P., Natiello, F., Bronzi, P., Bolis, L.,and Agradi, E. "Effects of Diet on Response to Hypoxia in Sturgeon (Acipenser naccarii)". JExp. Biol. 170: 113-125. 1992.
Ruer, P. M., Cech, J. J. Jr., and Doroshov, S. I. "Routine Metabolism of the White Sturgeon,Acipenser transmontanus: Effect of Population Density and Hypoxia". Aquaculture, 62: 45-52.1986.

1
Energy Conservation and Environmental Improvement in an Intensive RecirculatingAlligator Production System
Aurelio A. Delos Reyes, Jr., Ph.D.Research Associate
Department of Civil andEnvironmental Engineering
Louisiana State University and A & M
Jay V. Huner, Ph.D.Director
Crawfish Research CenterUniversity of Southwestern Louisiana
Ronald F. Malone, Ph.D., P.E.Chevron USA ProfessorDepartment of Civil and
Environmental EngineeringLouisiana State University and A & M
Rita SoileauGraduate Assistant
Department of Chemical EngineeringUniversity of Southwestern Louisiana
Stephen J. Langlinais, P.E., P.L.S.Associate Professor
Department of Renewable ResourcesUniversity of Southwestern Louisiana
Kelly A. Rusch, Ph.D.Assistant Professor--Research
Department of Civil andEnvironmental EngineeringLouisiana State University
Introduction
Alligator farming in the United States is concentrated in southeastern areas, with Louisianaleading national production for hides and meat (Brannan et al., 1991). Farming of alligators inLouisiana began around 1972 with only 35 alligators sold (Joanen and McNease, 1990), andexpanded to 128,300 alligators in 1992, with hide and meat valued at nearly $ 9M (Joanen, et al.,1996). The industry's rapid growth rate, expanding from 14 farms in 1983 to 134 in 1991(Joanen, et al., 1996), can be attributed to the availability of technology for environmentallycontrolled production coupled with high prices for alligator hides. In 1990, alligator farmingpractices began to change. Farmers were faced with new regulations regarding the minimumsquare footage requirements per alligator produced in confinement, and discharge of wastewaterfrom farms (Brannan et al., 1991). Additionally, the surplus of hides and uncertainty of marketstrength, coupled with falling hide prices, led to a decline in the number of producers in the 1990s(Masser, 1993a). Only 89 farms were estimated in 1994 (Joanen, et al., 1996).
Using current culture techniques, growth rates of farm-raised alligators are generally two to threetimes faster than that of wild alligators. Farm-raised alligators can grow from hatchling to 4 ft orlonger in 14-18 months, compared to 3-4 years in the wild. The search for better methods iscontinuing, with farmers experimenting with alligator house design, feeding regimes, equipment,water heating and waste treatment to develop farms that are based on efficient technology(Brannan et al., 1991). Reducing heating costs, labor requirements, and waste discharges, and

2
improving water and air quality, are areas of production that alligator farmers are greatlyconcerned with. In conventional systems, alligators are grown in pens in heavily insulated houses,where temperatures are maintained between 86-88°F (Masser, 1993b). The houses arecompletely closed, with no air circulation, and high humidity. The water sits stagnantaccumulating waste excrement from the alligators, exposing them to poor water quality. Airquality deteriorates rapidly, and most alligator houses have a consistent, very unpleasant ammoniastench unless the houses are cleaned thoroughly. The pens are generally flushed daily to replacethe waste-laden water with fresh, tempered 90°F water. Cleaning is an unpleasant, labor intensiveprocess that regularly disturbs the alligators, wastes plenty of water and energy, and discharges aconsiderable volume of wastewater. The application of recirculating aquaculture technology,particularly using bead filters for both clarification and biological filtration, is anticipated toalleviate these problems. This study was conducted to evaluate and compare the energy use, andthe water and air quality conditions in a conventional, batch-flushed alligator house and arecirculating system employing a 100 ft3 bead filter.
Materials and Methods
Alligator Facility
The project site is the Alagri, Inc. alligator farm located in Denham Springs, LA, approximately20 miles from LSU. The farm has five concrete culture houses with a total capacity of about3,000 grown (4 ft) alligators. Each well-insulated house has 12 rectangular pens, each measuring9.8 ft x 14.2 ft inside (Figure 1 and 2). Each house has a heat exchanger (with heated waterflowing in at 140°F) built into the concrete floors to maintain culture water temperature at 86-90°F. The A-House is used for alligator hatchlings which are cultured for 6-8 months before theyare redistributed for grow-out in the B-, C-, D-, and E-houses. The Alagri, Inc. alligator farmuses a management regime that differs somewhat from traditional alligator farms. Dry, pelletedfeeds are used exclusively, and alligators are fed every other day.
Under conventional operation, approximately 5,000 gallons of heated water per house are wasteddaily or every other day when the houses are flushed. This, coupled with the water required tohose down and clean the houses, is a costly drain on the water and energy (for heating andpumping) resources required to operate the facility, and represents a considerable wastewaterdischarge. Alagri, Inc. utilizes an anaerobic sludge pit which overflows into a facultative lagoonfor wastewater treatment.
Recirculating System
Three of the alligator houses (A, C, and E) were retrofitted for recirculation using a 100 ft3
paddle-washed bead filter for water clarification and biological filtration. An influent pipe wasinstalled in each half of the houses at one end, with two effluent pipes at the other end convergingto a common 6 inch diameter pipe leading to a 1,500 gallon sump. Pen partitions were fitted withtwo short, grated pipes (4 or 6 inch dia.) to allow water to flow serially through the six pens ineach half. Two float switch-controlled 0.75 submersible pumps are used for water circulation. A

3
1.0 hp regenerative blower provided aeration within the sump. A schematic diagram of therecirculating system showing connections to the E-house only is shown in Figure 1, and aschematic diagram of pens in a section of the E-house is shown in Figure 2. The original floordrains (Figure 2) were eventually used to improve water movement between pens to facilitatesolids transport.
Figure 1. Schematic diagram of the recirculating alligator system showing the E-house.
Figure 2. Schematic diagram of a section of the E-house.

4
The recirculating system was in operation since January 1995 until the alligators were harvested inMarch 1996. The 100 ft3 bead filter was originally designed and operated as a downflow filter,but was later reconfigured to operate in an upflow mode. Table 1 shows the mode of operation,and alligator houses connected to the recirculation system during the study period.
Table 1. Operation of the recirculating system at the alligator farm.
Date Mode Houses ConnectedJanuary 1, 1995 - June 23, 1995 * Downflow A, EJune 24, 1995 - July 26, 1995 Downflow A, C, EJuly 27, 1995 - September 15, 1995 Upflow A, C, ESeptember 16, 1995 – March 10, 1996 Upflow E* A 20 ft3 bead filter was operated in parallel with the 100 ft3 from March 24, 1995 - July 26,1995.
Energy Monitoring
Energy utilization in the D-house, a conventional, batch-flushed alligator house, and the E-house,a recirculating house, were evaluated and compared. The energy input to D-house consisted ofthe heated water that is replaced daily (for purposes of this study, ideal control house conditionsentail daily flushing), and the energy required to keep the water temperature through the built-infloor heating system. The energy input to the recirculating E-house consisted of the energyutilized by the water pumps, the air blower, the paddle-wash motor during backwashing, and theenergy required to keep the water temperature through the built-in floor heating system. Akilowatt-hour meter was installed to monitor the total electrical requirements of the recirculatingsystem. The built-in floor heating systems in both houses were monitored by measuring hot waterflow (through a water meter) and temperatures at both the hot water influent and effluent throughtemperature sensors installed at appropriate locations. The data collection system was designedto utilize an Analog to Digital Converter (ADC) box linked to a notebook PC, with a programwritten in quick BASIC programming language to effectuate data collection through the ADCbox, and data storage to a computer disk in a file format exportable to a spreadsheet for analysis(Golz and Langlinais, 1995). The system was equipped with a remote monitoring software thatenabled the researchers to remotely check on the functionality of the data collection system on adaily basis, make necessary corrections or changes in the host PC file management system, anddownload the monthly data files.
Air and Water Quality Analyses
Gaseous ammonia was monitored in the control and test houses by two methods. First, allpersons associated with the study provided continuous qualitative input about the ammonia odorin the two houses. Second, a MSA Deluxe Kwik-Draw Air Monitor was used to monitor gaseousammonia in the conventional D-house and the recirculating E-house on a monthly basis. Regularmonitoring for gaseous hydrogen sulfide was also conducted, but was discontinued when readingsof zero were consistently obtained.

5
Water quality was monitored weekly in the D- and the E-houses. The conventional housesamples were collected from the pens themselves, while the recirculating system samples werecollected at the filter influent and effluent. The samples were collected and analyzed according toStandard Methods (APHA, 1995) for total ammonia nitrogen (TAN), nitrite nitrogen (NO2-N),dissolved oxygen (DO), biochemical oxygen demand (BOD5), total suspended solids (TSS),turbidity, pH, and alkalinity. Water quality data were normalized and analyzed to identifyrelationships between filter performance, loading, and other variables.
Alligator Performance
Alligator growth performance was evaluated primarily in terms of total length. Alligators withlengths ranging from 24-36 inches were redistributed evenly among the 12 pens in each of thefour houses (B, C, D, and E) in June 1995 when initial measurements were made. Final lengthmeasurements were made in March 1996 when the alligators were harvested. Skin condition ofalligators from each house was also examined and compared.
Results and Discussion
Energy Comparisons
The energy input required to replace the water in the conventional D-house after flushing wascomputed using the equation: Q = M x Cp x (90°F - 70°F). The mass flow rate (M) is the volumeof the water replaced (1,305 ft3/24 hrs) times the density of water (62.4 lb/ft3), or 3,393 lb/hr. The specific heat of water (Cp) is 1 BTU/lb-°F. The 70°F is the initial well water temperature,which is heated to 90°F, the temperature of tempered water. The computed value for Q was67,860 BTU/hr or 1,630,000 BTU/day. This constituted the bulk of the energy input in theconventional house.
The total electrical energy input was computed using the relationship of 3,412 BTU/kW-hr. There was a consistent pattern of energy conserved in the recirculation system with the downflowbead filter as shown in Figure 3. The energy requirement for the recirculating E-House rangedfrom 32-59 percent of that of the conventional D-house. The electrical energy consumption wasconsiderably higher than the preceding year as was expected. The extra electricity required to runthe recirculating system's electrical components and miscellaneous equipment (e.g., computer forenergy data collection) accounted for the extra energy. However, this increased electrical energyconsumption was small when compared to the natural gas energy required for tempered waterreplacement in the conventional houses.
There were indications of higher heating requirements in the recirculating system in the upflowmode, however, much of the upflow heating temperature data were deemed unreliable due torecirculating system shutdowns, and monitoring system malfunction (electrical and hardwareproblems detected late) as a result of a number of severe thunderstorms and tornado activity.

6
Figure 3. Average daily total energy consumption in the conventional D-house and therecirculating E-house, with the downflow bead filter.
A hard freeze in December also busted a pipe which soaked the computer monitoring systemresulting to lost, unrecoverable data. It was also discovered that the E-house was leaking waterafter half of the house emptied when the water refill line was closed. However, the reduction inmanpower (time and cost) to operate the recirculating system more than offsets the increase inenergy costs.
Figure 4 shows the differences in daily electrical consumption of the recirculating system when thefilter was operated in the downflow mode and the upflow mode. The daily electrical consumptionin the upflow mode increased by an average of 85 percent of that in the downflow mode, from42.7±12.2 to 79.1±4.4 kW-hr/day. The intermittent use of only one pump in the downflow modedue to bead fluidization problems can partly explain the lower electrical energy usage. Theelectrical energy increase is only equivalent to about 126,244 BTU/day, which is less than 10percent of the energy to replace tempered water in the conventional D-house.
Air Quality
The dissolved ammonia levels in the conventional houses reach very high levels under normaloperational conditions with daily or every other day pen cleaning. As a result, gaseous ammoniadissipates into the warm humid air within the alligator houses and can generate a very unpleasantstench. The odors observed were categorized as none, musty-stale, and distinct ammonia. Thesecorrelated with Air Monitor values of 0 (undetectable), 1-2 ppm, and 3-5 ppm gaseous ammonia,respectively. Gaseous ammonia was constantly detectable in the control house. This occurred

7
whenever the dissolved ammonia levels in the water were in excess of 20-30 mg/L. Gaseousammonia could not be detected qualitatively or with the Air Monitor when aqueous ammonialevels were lower than 20 mg/L. The distinct ammonia odor was present before house cleaning,with the stale-musty odor detectable following house cleaning. As previously mentioned, Alagri,Inc. uses dry pelleted feeds exclusively, and alligators are fed every other day. As a result, theobnoxious stench associated with alligator farms where meat is being fed is absent as long as thehouses are cleaned daily, or at least every other day.
Figure 4. Average daily electrical consumption of the recirculating system, with the bead filteroperated in downflow and upflow mode.
Gaseous ammonia did not exceed 1-2 ppm (musty-stale odor) in the recirculating E-house. Apositive improvement in the air quality in the recirculating E-house was observed as compared tothe conventional alligator houses in the farm, and in farms visited elsewhere. Further, there wasno lingering ammonia odor on clothing following work in the E-house, a definite problem in theconventional houses within several hours after cleaning.
Conventional House Water Quality
Depending on feeding rate and time of sample collection after flushing, TAN, TSS, BOD5 andturbidity ranged from 2.2-113.4 mg/L, 5.3-1,220.0 mg/L, 2.2-560.0 mg/L and 6.8-85.1 NTU,respectively in the D-house. Waste levels were generally higher at higher feeding rates, andobviously at longer periods after flushing due to waste accumulation. The every other day feedingof entirely pelleted feed enables Alagri, Inc. to flush conventional houses every 2 days at feeding

8
rates of up to about 100 lbs feed every 2 days, although flushing everyday is preferred. Theculture water, which is eventually flushed, represents a significant volume of waste load. DO ispractically zero; and the TAN concentration is way above the treatment effluent standard of 3mg/L. The BOD5 and the TSS content are also substantially higher than the generally accepted 30mg/L effluent standard for both. Results from the present study are within range, and arecomparable to values obtained for a number of the parameters in a previous study done by Branch(1990) involving 7 alligator farms in Louisiana. In his study, Branch (1990) noted that results ofwastewater analyses indicated that variation between and within facilities, with feeding andflushing frequencies, and time of sampling, contributed significantly to the variable results.
Recirculating System Performance
The 100 ft3 prototype paddle-washed bead filter was originally designed and operated as adownflow filter; but due to bead fluidization, channelization, and water quality problems, it waslater reconfigured to operate in an upflow mode. Figures 5, 6, 7, and 8 show the levels offeeding, TAN, TSS, and turbidity attained in the recirculating system when the filter was operatedin downflow and upflow mode. The week number refers to the number of weeks from the start ofbead filter operation at that mode. Better water quality conditions and bead filter performancewere obtained when the filter was converted to the upflow mode, as can be deduced from Figures5 to 8. There was initial concern for noise disturbance that no aeration was provided until week 9in the downflow mode, where Figure 6 shows considerable improvement in TAN. A 20 ft3
propeller-washed bead filter was connected in parallel with the downflow filter for 4 months withno significant improvement in water quality, which prompted the conversion of the bead filter toan upflow mode.
There was considerable variation in the upflow bead filter volumetric TAN conversion, whichaveraged 9.0 g TAN/ft3 beads-day, compatible with results reported by Chitta (1993) andWimberly (1990). With backwashing done every 2 days in the recirculating house, the upflowbead filter has proven capable of handling up to 125 lbs of 40% protein feed every two days,which was the highest attained prior to harvest. TAN, TSS, and turbidity were maintained at1.4±0.6 mg/L, 37.6±7.7 mg/L, and 12.2±2.4 NTU, respectively, at 100 lbs feed every 2 days. However, at 125 lbs feed every 2 days, the respective levels of TAN, TSS, and turbidity were7.2±2.3 mg/L, 28.7±13.2 mg/L, and 8.3±2.6 NTU. The higher TAN level is believed transitory,in response to the increase in feeding rate, and the addition of salt to 2 ppt (week 25) inpreparation for the sale of alligators, which quite possible affected the bacterial population in thebead filter. Likewise, at the high feeding rate, the bead filter tends to operate at a higher pressurewhich consequently reduced water flow.

9
Figure 5. Feeding rates attained in the recirculating system with the bead filter in downflow andupflow mode. Week number refers to the number of weeks from the start of bead filter operation
at that mode.
Figure 6. Total ammonia nitrogen (TAN) in the recirculating E-house with the bead filteroperated in downflow and upflow mode. Week number refers to the number of weeks from the
start of bead filter operation at that mode.

10
Figure 7. Total suspended solids in the E-house with the bead filter operated in downflow andupflow mode. Week number refers to the number of weeks from the start of the bead filter
operation at that mode.
Figure 8. Water turbidity in the E-house with the bead filter operated in downflow and upflowmode. Week number refers to the number of weeks from the start of the bead filter operation at
that mode.

11
A lot of system disruptions occurred (e.g., several power outages as a result of severethunderstorms; loss of beads due to improper backwashing; hard freezes), which can partlyexplain sudden changes in water quality conditions and filter performance. Of foremostimportance is the hydraulics problem associated with the retrofitted alligator houses. When twoor three houses were connected to the recirculating system, it was very difficult to maintainsimilar flow to the houses. There was considerable lag in flow between pens in a house, returnflow to the sump lagged the pumping capacity resulting to on and off pump operation, and it tooka long time to attain steady system hydraulics after backwashing. Even with only the E-houseconnected to the bead filter (beginning week 6), several changes had to be undertaken before therecirculating system performed satisfactorily. System hydraulics improved when the filter effluentwas vented, the original floor drains were used for additional flow between pens, and whenelbows in pipes between pens (originally thought to create a circular flow pattern that would tendto converge the solids) were removed. The increased flow through the E-house facilitated bettersolids movement and faster turnaround time, which contributed to the improvement in waterquality thereafter (Figure 6). A significant impact was achieved, however, with a change inbackwashing procedure. During backwashing, the filter is flushed continuously with freshwater todrain the sludge while continuously paddle mixing at 20 rpm. The original flushing rate of 35 gpmwas observed inadequate to push the sludge down, and the 45 minutes of paddle activation wasoverscouring the beads. Backwashing every 2 days before feeding at a flushing rate of 50 gpmand 20 minutes of paddle mixing was found adequate up to 125 lbs feed every 2 days. For the12,000 gallon recirculating system with only the E-house connected, the 1,000 gallons isequivalent to a daily water exchange rate of 4.2 percent.
Table 2. Summary harvest data for the alligator farm (there were no rejects from any of thehouses).
House Number ofAlligators
Average Length (inches) Percent NumberTwo's
Percent Sold MoreThan 48 inches
B 442 50.1 9 79C 385 50.2 36 80D 396 52.5 21 95E* 398 51.6 29 96
* Recirculating house.
Alligator Behavior, Size, and Skin Condition
In a conventional alligator house, alligators respond to intrusions by thrashing about, often wildly,and crowding into the comers of the pens farthest from the intruder. This reaction was constantlyobserved in the three conventional houses at the Alagri, Inc. alligator farm. In the test house,however, the alligators merely submerged and showed little, if any, signs of distress. Thebehavior of alligators in the deeper water in the recirculating house was of special interest. Skinscarification that leads to rejection of alligators at harvest is the result of social interaction. It wasfelt that the deeper water might have calmed the alligators and reduce social interaction and skinscarification.

12
Length of alligators from all houses ranged from 40-60 inches at the time of harvest in March1996. Average lengths and skin condition are summarized in Table 2. During harvest, alligatorswere examined by the buyer and placed into one of three categories; Number One, Number Two,and Reject based on the condition of the belly skin. Number One alligators have no damage. Number Two alligators have some damage, and command a lower price. Reject alligators haveexcessive scarification and/or discolored fungal lesions referred to as "brown spot." Thoseaccepted by the buyer are then measured to the nearest inch. Alligator farmers are currently paida significantly higher price for alligators exceeding 48 inches in total length. The Number Twoand Reject alligators are usually retained by the farmer to clear skin defects, and for the statemandated return program. The program involves the return of 17% of the cultured alligators tothe habitat from which the original wild alligator eggs were removed.
Replication required to conduct conventional statistical analyses of alligator data was not possiblein this project. However, it is very clear that the alligators in the recirculating house did notoutperform those in any of the conventional houses. Growth was somewhat better in both thetest E-House and control D-House than the other two conventional houses. This was attributedto the stocking of somewhat larger alligators in these two houses when alligators wereredistributed for grow-out the previous year. Although alligator behavior in the presence ofintruders was decidedly calmer in the recirculating house than in the conventional houses, this didnot translate into improved skin quality. Social behavior that generates scarification wasapparently not changed with the use of deeper water in the recirculating house. It cannot beexplained why the percentage of Number Two alligators in one conventional house, the B-House,was roughly three times less than that of the other houses.
Summary and Conclusions
The benefits of using the bead filter to improve air and water quality in a recirculating alligatorculture system has been clearly demonstrated. The bead filter used in this study was originallydesigned and operated as a downflow filter; but due to bead fluidization, channelization, andwater quality problems, the filter was later reconfigured to operate in an upflow mode. Greatlyimproved water quality conditions and bead filter performance were obtained when the filter wasconverted to the upflow mode. Sensory and chemical analyses of air demonstrated significantreductions in stale odors and gaseous ammonia in the recirculating house. However, the studyillustrates the difficulty in retrofitting existing alligator houses for water recirculation.
The energy required to operate the recirculating house in the downflow mode ranged from 32-59percent of the conventional, depending on the time and month of the year. There were indicationsof increased energy requirements in the upflow mode, however, the reduction in manpower (timeand cost) to operate the recirculating system more than offsets the increase in energy costs.
Although alligator behavior in the presence of intruders was decidedly calmer in the recirculatinghouse than in the conventional houses, and water quality was significantly better, this did nottranslate into improved growth and skin quality, and no conclusive differences were obtained

13
between alligators in the recirculating house and those in any of the conventional houses.
Acknowledgments
This work is funded by the Louisiana Department of Natural Resources Energy Division asProject Number PVE40-94-01. The project is implemented in close collaboration with Dr.Charles L. Shilling, president of Alagri, Inc. Alligator Farm, Denham Springs, LA who continuesto provide much appreciated technical and physical support to the research team. We appreciatethe dedicated support Mr. Vernon Rodrigue of Armant Aquaculture, Inc., Vacherie, LA for hisinvolvement in the design, fabrication, installation, and reconfiguration of the bead filter used. Thanks to Mr. William Golz and Mr. Marcus Bamardez for their contributions to the project, andto Ms. Christy Higginbotham, Mr. Will Gentry, Mr. Helal Ahmed, and Mr. Riazul Mia for theirhelp in sample collection and water quality analysis.
References
APHA. Standard Methods for the Examination of Water and Wastewater. ]9th edition.Washington, DC: American Public Health Association. 1995.
Branch, J. W. Aquaculture/marine fisheries process wastewater. Project Completion Report. Baton Rouge: Louisiana Water Resources Research Institute, Louisiana State University. 1990.
Brannan, D., K. Roberts, and W. Keithley. Louisiana Alligator Farming. 1991 EconomicImpact. Baton Rouge: Louisiana Sea Grant College Program, Louisiana State University. 1991.
Chitta, B. S. Effects of Backwash Frequency on Nitrification in Plastic Bead Media BiofiltersUsed in Recirculating Finfish Culture Systems. M.S. Thesis. Baton Rouge: Louisiana StateUniversity. 1993.
Golz, W. and S. J. Langlinais. "Data Remote - A Computer Software System for Collectingand Storing Environmental Data for Remote Access." (unpublished). 1995.
Joanen, T. and L. McNease. Alligator production volume and trends in the USA. Baton Rouge:Louisiana Cooperative Extension Service, Louisiana State University. 1990.
Joanen, T., L. McNease, R. Elsey, and G. Perry. "U.S. Alligator Farming; A Dynamic GrowthIndustry in Louisiana." Gator Tales: The Alligator Newsletter 4 (1996): 7.
Malone, R. F., B. S. Chitta, and D. G. Drennan. "Optimizing Nitrification in Bead Filters forWarmwater Recirculating Aquaculture Systems." in Wang, J. K. (Ed.). Techniques for ModemAquaculture. Michigan: American Society of Agricultural Engineers. 1993. 315-325.

14
Masser, M. P. Alligator Production An Introduction. Southern Regional Aquaculture CenterPublication No. 230. 1993a.
Masser, M. P. Alligator Production Grow-out and Harvest. Southern Regional AquacultureCenter Publication No. 232. 1993b.
Wimberly, D.M. Development and Evaluation of a Low-Density Media Biofiltration Unit for Usein Recirculating Finfish Culture Systems. M.S. Thesis. Baton Rouge: Louisiana StateUniversity. 1990.

1
Conversion Efficiency, Growth, and Mortality of White Crappie (Pomoxis annularis)in a Recirculation System
James R. TriplettProfessor and Chair
Department of BiologyPittsburg State University
Troy AmspackerFish Culturist
Kansas Department of Wildlife and ParksPratt, Kansas
George ThomasResearch Technician
COOP Fish Research UnitOklahoma State University
Introduction
Feeding trials in open ponds, cages and laboratory aquaria have yielded critical informationnecessary for the development of the aquaculture industry. However, it is nearly impossible toobserve feeding activity and interspecific competition in order to determine the role they play infood conversion efficiency and subsequent growth in open pond or cage culture systems. At thesame time, the use of aquaria in laboratories for feeding trials, while maximizing observability,may produce uncharacteristic behavior as a result of reduced volumes and fish densities. Recirculating systems offer a compromise between the open production systems and the highlyaltered laboratory approach. In recirculating systems, the rearing environment can be controlledto the same level possible in the laboratory, yet fish densities and feeding levels can approachthose of open production systems. While the observation of individual behavior is not possible inthe recirculating system, general levels of activity, spatial segregation and interactions betweensize groups can be monitored. The fish are also far more accessible for routine sampling and fortracking disease and mortality.
In the north central region, recirculating systems are becoming increasingly important ascommercial production units. Increased demand for quality water supplies, a substantiallyreduced growing season and widely varying environmental conditions have made thecontrollability of recirculating systems far more attractive. New technological developments inmonitoring, logging, decision processing and adjusting rearing environments using computerizedprocess control systems have permitted year-round production under optimal conditions. Although recirculating systems are inherently more expensive to operate than open systems, theability to tightly control the rearing environment, eliminate growing, season limitations, reducewater consumption requirements and increase the number of locations possible for fish productionhave also opened the door for the commercial production of higher valued species previouslyconsidered not suitable for open production.
2
Sunfish in general, and crappie (Pomoxis spp.) in particular, are among the most popular sportfishin the United States, especially in terms of numbers caught. Their wide distribution andabundance along with their excellent taste, put them high on the list with most anglers. As aresult, wild populations are protected from commercial exploitation except in special areas, suchas Canada and the Indian Reservations in Minnesota and Wisconsin (Thomas 1995). The ChicagoFish House, a major seafood supplier purchases 136-227 kg (300-500 lbs) per week from thosesources in the fall and spring. A June 1992 price provided by the Chicago Fish House of $4.41-5.51/kg ($2.00-2.50/lb) to producers, was nearly twice that paid for rainbow trout and channelcatfish. Because the demand for crappie always exceeds the supply for the Midwest market,representatives of the Chicago Fish House have indicated a strong interest during meetings of theNorth Central Aquaculture Center in a dependable, aquaculturally produced supply of sunfish(Sheehan 1995).
Efforts to use crappie as an aquaculture species have had limited success (Leary 1908 and 1909,Harper 1938). Mortalities related to handling stress and difficulty in training crappie tocommercial diets have thwarted efforts to use traditional production approaches (Smeltzer 1981). Smeltzer and Flickinger (1991) were most successful in handling fingerling black crappies(Pomoxis nigromaculatus) at night and at water temperatures less than 21 degrees C. They alsowere able to train these fingerlings to Biodiet (Bioproducts, Warrenton, Oregon) with a successrate as high as 85 - 95% in raceways. These accomplishments along with the artificialpropagation successes by Buck and Hooe (1986) in their evaluation of F1 hybrid crappie, haveprovided the foundation for further investigation of the potential for commercial culture ofcrappie.
Based on these findings, we initiated two projects to further explore the possibility of culturingcrappie in the more controlled, intensive setting of a recirculating system. Our first project ranfrom November of 1989 to December 1990 and included 5 feeding trials (Amspacker 1991). Thesecond project ran from November of 1993 to April of 1995 and included 6 feeding trials(Thomas 1995). The primary objectives of our work were to determine: (1) if white crappiecould be captured, handled and maintained in captivity without excessive mortality, (2) if whitecrappie would switch to an artificial diet and grow on that diet in a recirculating system, and(3) whether temperature, fish size or feeding frequency impacted trainability, conversion efficiencyand growth.
First Project
Recirculating System
During the fall of 1989, we fabricated a simple recirculating system from materials we were ableto acquire locally and without significant expense. It consisted of two fish culture vessels,designated as Tank A and Tank B, which were 378.5 liter (100 gal.), stainless steel, insulatedtanks used on farms to store milk, and a 863 liter (228 gal.) treatment vessel which was a vinylwading pool. Water was picked up out of the treatment pool and circulated by a 1/6 hp "Teel"submersible fountain pump. A half-inch garden hose with a diverter valve was used to carry the

3
water to each of the culture tanks. Closure of the valves allowed flow to be maintained at 12.11/min. (3.2 gal./min.) per tank. The culture tanks were elevated above the height of the treatmentpool and water returned by gravity flow through the drains in the bottom of the culture tanks. The water in the culture tanks was maintained at desired levels by connecting the drains to verticalstandpipes in the treatment pool. This also allowed the water to be aerated as it spilled out of thetop of the standpipes and splashed on a series of flanges around the pipe, which were designed toincrease aeration. Water quality was maintained by siphoning out wasted feed daily and replacingthe water in the treatment pool with fresh, dechlorinated tap water every two or three days. There was no separate biofilter unit.
Water Quality
Throughout the five trials, temperature, pH, dissolved oxygen (DO), total ammonia (NH4+), and
nitrites (NO2) were measured to monitor water quality. Temperature was checked with a glasspocket thermometer. Dissolved oxygen and pH were measured with YSI and Fisher meters,respectively. Total ammonia and nitrite were measured using Hach chemistry and a calibratedspectrophotometer (Spec 20). Un-ionized ammonia (NH3) was calculated from NH4
+, pH andtemperature values.
Based on the work of others, we established lower and upper limits, as appropriate, for the waterquality parameters measured. These were: DO above 5.0 mg/l (Swingle 1969), pH between 6.5and 9.0 (Piper et al. 1982), nitrite less than 1.0 mg/l and unionized ammonia less than 0.10 mg/l.The latter two parameters were based on values intermediate for those reported for channelcatfish (Ictalurus punctalus) and rainbow trout (Oncorhynchus mykiss) (Robinette 1976 and Piperet al. 1982).
Lengths, Weights and Data Analysis
Prior to handling or collection of measurements, fish were anesthetized with tricane methanesulfonate (MS222) or quinaldine sulfate. Total lengths were measured in millimeters, and totalweights were measured in grams. Differences in lengths and weights between tanks wereevaluated using single classification analysis of variance (Sokal and Rohlf 1970).
Condition factors were calculated from individual fish length and weight using the formula: K(TL)= Weight(g)/Length3(mm) x 105 (Nielsen and Johnson 1983). Growth was calculated from totalweight and length increases as the average weight gain and length increase per fish per day. Conversion efficiency was calculated as: Total Biomass of Feed Offered/Total Biomass Increase(Piper et al. 1982).
Feeding Trials
During this project, we ran five independent feeding trials. All feeding trials, except for theSummer of 1990, when fish were moved to the Milford Fish Hatchery, were conducted in thebasement of Heckert-Wells Hall, the Biology/Chemistry building at Pittsburg State University.

4
Trial 1. In November of 1989, 19 white crappie were collected from a local lake by electrofishing. Following acclimation, they were divided into two size ranges (168 - 195 mm and 200 - 233 mm)and placed in the culture tanks. They were trained to accept an artificial diet by graduallyreplacing a starter diet of krill with #4 Mesa Crumbles (Mesa Feed and Farm Supply, GrandJunction, Colorado). Based on visual observations and individual condition, it appeared that allfish were accepting the artificial diet. Over the 23-day culture period, the smaller size group hadthe best growth at 0.07 mm and 0.53 g per fish per day, with a conversion efficiency of 2.2:1. Thelarger size group grew less at 0.07 mm and 0.36 g per fish per day, with a conversion efficiency of5.6:1. Water quality remained within desirable limits during the culture period except that watertemperature dropped below 15.5°C on two occasions. Feeding activity was visibly reduced at11.1°C, but picked up again when temperatures ranged between 15.5°C and 20.0°C.
Trial 2. In February of 1990, 16 white crappie were collected, acclimated and trained to anartificial diet as in Trial 1. This time, the fish were divided evenly over the full size range of 171 -210 mm and placed in the two culture tanks. Although it again appeared as all of the fish weresuccessfully trained to the artificial diet, virtually no growth was apparent at the end of the 23-dayculture period. While fish in Tank A averaged an increase of 0.05 mm and 0.09 g per fish per dayand a conversion efficiency of 14.9:1, fish in Tank B averaged a decrease of 0.01 mm and 0.08 gper fish per day. There was no significant difference in the growth between tanks. The lack ofgrowth, in spite of active feeding, in this trial may have resulted from a loss of the vitamin pack inthe Mesa Crumbles or from the time of the year relative to growth patterns in these fish. Allwater quality parameters remained within desirable limits during the culture period.
Trial 3. In April of 1990, 76 smaller crappie, ranging from 75 - 126 mm were obtained from acommercial grower in Texas. These fish were divided into two equal size ranges and placed intothe two culture tanks. Attempts to train these fish to the #4 Mesa Crumbles as in Trials 1 and 2were unsuccessful, with 100% rejection of the artificial diet. A second training effort using 2.5mm Biodiet in place of the 94 Mesa Crumbles was also relatively unsuccessful. Fish were kept onthe Biodiet for a 21 -day culture period in an effort to force them to utilize the feed, but at the endonly one fish in Tank A and four fish in Tank B were observed feeding and had distendedabdomens. As a result, calculations of average growth and conversion efficiency were not useful. Water quality during this culture period remained within desirable limits.
Trial 4. In May of 1990, 73 crappie from Trial 3 were transported to the Kansas Department ofWildlife and Parks, Milford Fish Hatchery in Junction City, Kansas. At this facility, the fish wereplaced in two, 378.5 liter (100 gal.) cylindrical vats with a flow-through system of unfilteredwater from a borrow lake. Crappie were offered 2.5 mm Biodiet for a 56-day culture period,which was rejected by all of the fish for the entire period. Although growth was substantial andranged from 0.11 mm and 0.04 g to 0.29 mm and 0.14 g per fish per day, there was no evidencethey had consumed the Biodiet. The unfiltered, flow-through water supply containedzooplankton which were found in 100% of the fish following stomach analysis.
Trial 5. In August of 1990, 750 white crappie were donated by the Kansas Department of Wildlife

5
and Parks, Farlington Hatchery. These fish ranged from 48 to 89 mm and were divided betweenthe two culture tanks to provide similar size ranges and densities. The water level in the systemwas lowered to create a density of 4 kg/m3 following the recommendation of Simco et al. (1986)for training juvenile largemouth bass. This was 1.3 to 4.5 times greater than the density used inprevious training efforts. Because of their small size, these fish were gradually switched over to1.5 mm Biodiet. Based on a bimodal frequency distribution of condition, it was decided that aK(TL) of greater than or equal to 0.90 indicated the fish was a "feeder" for the purpose ofdetermining the number of individuals that successfully switched to the artificial diet. Using thiscriterion, trainability was between 46 and 65%. This trial included two culture periods. The firstone lasted 28 days and produced growth increases in Tank A of 0.26 mm and 0.05 g per fish perday, with a conversion efficiency of 2.05:1. In Tank B, growth was 0.19 mm and 0.03 g per fishper day, with a conversion efficiency of 2.73:1. The second culture period lasted 27 days andproduced growth increases in Tank A of 0.43 mm and 0.11 g per fish per day, with a conversionefficiency of 1.71:1. In Tank B, growth was 0.36 mm and 0.09 g per fish per day, with aconversion efficiency of 2.10:1. Water quality parameters remained within desirable rangesexcept that dissolved oxygen dropped below 3.0 mg/l on a few occasions during the last portionof the last culture period.
Discussion and Conclusions
Throughout the five trials, no fish mortalities were associated with collection, transportation orhandling. During most culture periods, mortality remained at, or much below 10%, with theexception of the last period when it approached 17% in one tank. In almost every case,mortalities were fish that were emaciated and classified as "nonfeeders". This re-enforced ourcontention that crappie can be handled in a culture situation without unreasonable mortalities.
These results also showed that crappie could be trained to a commercially prepared, artificial dietand grow with a reasonable conversion efficiency. While the first two trials indicated that largercrappie would switch and potentially grow on a dry, pelleted ration at low densities, it wasevident in successive trials that smaller fish trained better at higher densities and to a semi-moistdiet. Additional work to determine the optimal temperature for feeding and growth would seemuseful. Our observations suggest fish may reduce their feeding activity at temperatures below15.5°C. The highest growth rates of 0.53 and 0.36 g per fish per day were observed during thefirst trial, but most of the weight increases in other trials were less than 0.20 g per fish per day. Inorder to grow a crappie to a marketable size of 227 g (0.5 lb) in two years, a growth rate ofaround 0.35 g per day would need to be maintained. These results suggest this is achievable withsome improvements in feeding strategies and growth potential.

6
Second Project
Recirculating System
Between the end of 1990 and the fall of 1993, we substantially remodeled the recirculatingsystem. The treatment (wading) pool was eliminated and two, circular 567.8 liter (150 gal.)stainless steel milk vats were acquired for use as the culture tanks. One of the 378.5 liter (100gal.) tanks used in the previous project as a culture tank was elevated on a stand and filled with25.4 mm (1 inch) plastic Koch Flexirings to serve as a biofiltration unit. The other 378.5 liter(100 gal.) tank was converted to a water handling and treatment tank.
A common water level was maintained between the two culture tanks and the treatment tank byconnecting the drains at the bottom of all three tanks, Water circulation was created by a 1/6 hpsubmersible pump that picked water up from the treatment tank and sprayed it over the Flexiringsin the biofilter. Through gravity flow, the water collected at the bottom of the biofilter, exitedthrough the drain, and was divided evenly before emptying into the two culture tanks. The waterwas dropped from about .75 in above the surface of the culture water on the left side of eachtank. This increased the level of aeration and caused the water in the culture tank to spin in aclockwise direction. The rotation of the water in the tank caused solids from wasted feed andfecal material to collect in the center of the vat. This allowed the installation of a solids removalsystem that consisted of an inverted funnel suspended about 6.4 mm (0.25 inch) above the bottomof the tank. The funnels in each culture tank were piped to a pump controlled by a timer thatturned the pump on 10 times a day for the time necessary to remove about 10% of the totalsystem volume each day. A dump valve was installed below the pump to prevent siphoning ordewatering of the line. The water lost during solids removal and evaporation was replaced by amake-up system. A float-ball connected to a relay detected low water levels in the treatment tankand would open a water control valve connected to the municipal water supply. That water wasforced up through a 208.2 liter (55 gal.) plastic drum 3/4 full of granulated anthracite coal. Thissystem removed most of the chlorine before the water was piped to the treatment tank. When thewater level in the treatment tank reached its upper limit, the relay would cut off the make-upwater supply. In addition to water-level control, the treatment tank was used for supplementalaeration and temperature control.
Timed automatic feeders were constructed that consisted of a sliding bar with an adjustable cavitythat moved back and forth under a hopper full of food. When the bar was retracted, a meteredamount of food dropped through a feeder tube into the culture tank. The programmable timerallowed multiple feedings through the day. The fish were isolated from external distractions by ablack plastic shroud that was suspended over the culture tanks. A florescent light was suspendedabove the culture tanks and connected to a timer to provide a 12 hr photoperiod.
The completed system consisted of rearing tanks, a water make-up tank, a biofiltration unit, adechlorination unit, automatic feeders, and a solids removal system (Figure 1).

7
Figure 1. Diagram of completed recirculating system in basement of Heckert-Wells Hall, PittsburgState University. 5-1-95.
Water Quality
In order to monitor the effectiveness of the biofiltration and dechlorination units, we analyzedtotal ammonia, nitrite, nitrate and chlorine using Hach chemistry (Model DR-2000Spectrophotometer). Un-ionized ammonia was calculated as before. Dissolved oxygen andtemperature was measured with an Otterbine Sentry II unit. A hand held Hanna pHep2 pH testerwas used to measure pH. Desirable ranges and limits that were established earlier in the firstproject were also used in this one. Throughout the six trials, water quality parameters stayedwithin these desirable ranges, with the exception of temperature, which reached elevated levelsduring trials three and four. Also, a chlorine excursion at the end of trial 2 resulted in thetermination of that feeding trial and the mortality of 16 fish.
Lengths, Weights and Data Analysis
Fish handling and measurement, as well as, calculation of growth, condition and conversionefficiency were performed as described in the first project. The standard deviation was calculatedto evaluate dispersion, and the coefficient of variation was used to compare relative amounts ofvariation (Sokal and Rohlf 1981). The difference in the coefficient of variation from the beginningto the end of each trial indicated the amount of variation from the mean for that parameter.
Feeding Trials
Seventy-one white crappie were divided among the two rearing tanks and studied during feedingtrials from November 17, 1993 to April 18, 1995. A total of 6 feeding trials were conducted atfish densities between 4 and 5 k g/m3. To establish a baseline for this system and to prevent tankfouling and overloading the system, Trials 1 and 2 entailed feeding the crappie once/day the

8
amount of food (2.5 mm Biodiet) they would consume in 15-minutes (0.7 % body weightfed/day). In Trials 3 and 4, we looked at a feeding strategy of multiple, small feedings in anattempt to get the fish to grow faster, yet minimize the chance of fouling the system. To do this,we increased the percent body weight fed/day to 3 percent and spread it over 20 feedings per day.Trials 5 and 6 were repeats of Trials 3 and 4 at water temperatures experienced during Trials 1and 2.
Results
Fish grew in all trials; however there was a disparity between the means for growth. Observationsduring feeding coupled with other, ongoing research suggested a feeding hierarchy existed amongfish in each tank. Water temperature varied with season and could have also contributed to thegrowth patterns. Trials 5 and 6 (repeat of Trials 3 and 4 at water temperatures experiencedduring Trials 1 and 2) suggest that water temperature played a large role in the disparity betweenthe means for growth. Growth was better and more evenly distributed over the full size range atlower water temperatures (around 20°C /68°F.) (Table 1).
Table 1. Mean temperature, change in coefficient of variation in length and weight, and feedconversion efficiency between rearing tanks during feeding trials.
Trial Mean temp. °C/°F Tank Length Weight Feed Conversion1 20.2/68 north
south-1.0-0.6
-4.6-3.4
6.94.6
2 20.5/69 northsouth
-1.9-2.6
-8.6-7.7
10.514.7
3 24.2/75 northsouth
(+0.6)-0.5
(+1.7)-1.2
6.012.5
4 23.7/75 northsouth
(+0.4)(+1.7)
(+1.4)(+7.2)
16.635.1
5 20.0/68 northsouth
-1.5-0.2
-2.2-1.6
6.56.9
6 19.9/68 northsouth
-0.0-0.2
-3.0-2.0
14.78.0
Fish mortality over the 17 months of this project was low (26 fish, 36.6%). Of the 17 fish lostduring trials 1 and 2, 16 were a direct result of the chlorine incident. Dead fish were examinedand found to have fatty livers, suggesting that Biodiet may not be the optimal diet for whitecrappie culture. This was consistent with the findings of Read (1994) and her work using Biodietto culture crappie in cages. However, making a conservative assumption that the largest fishremained the largest fish from the beginning to the end of each trial, maximum growth potentialwas determined for each tank during each trial (Table 2).
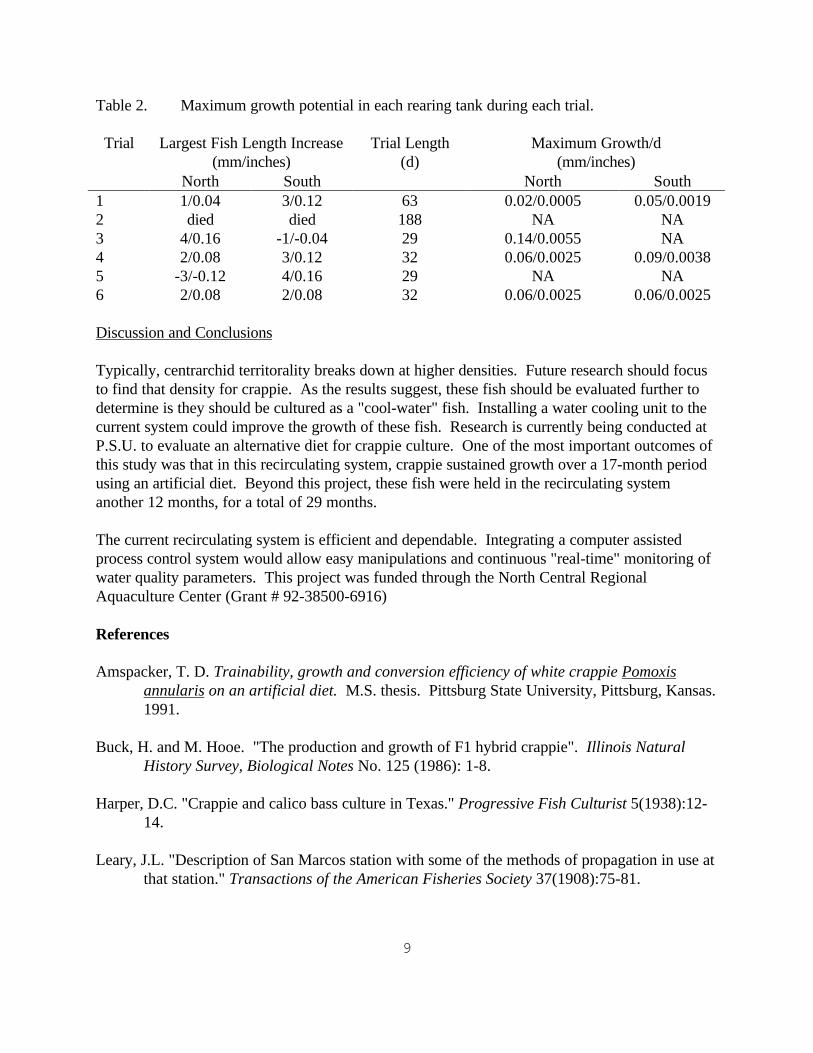
9
Table 2. Maximum growth potential in each rearing tank during each trial.
Largest Fish Length Increase(mm/inches)
Maximum Growth/d(mm/inches)
Trial
North South
Trial Length(d)
North South1 1/0.04 3/0.12 63 0.02/0.0005 0.05/0.00192 died died 188 NA NA3 4/0.16 -1/-0.04 29 0.14/0.0055 NA4 2/0.08 3/0.12 32 0.06/0.0025 0.09/0.00385 -3/-0.12 4/0.16 29 NA NA6 2/0.08 2/0.08 32 0.06/0.0025 0.06/0.0025
Discussion and Conclusions
Typically, centrarchid territorality breaks down at higher densities. Future research should focusto find that density for crappie. As the results suggest, these fish should be evaluated further todetermine is they should be cultured as a "cool-water" fish. Installing a water cooling unit to thecurrent system could improve the growth of these fish. Research is currently being conducted atP.S.U. to evaluate an alternative diet for crappie culture. One of the most important outcomes ofthis study was that in this recirculating system, crappie sustained growth over a 17-month periodusing an artificial diet. Beyond this project, these fish were held in the recirculating systemanother 12 months, for a total of 29 months.
The current recirculating system is efficient and dependable. Integrating a computer assistedprocess control system would allow easy manipulations and continuous "real-time" monitoring ofwater quality parameters. This project was funded through the North Central RegionalAquaculture Center (Grant # 92-38500-6916)
References
Amspacker, T. D. Trainability, growth and conversion efficiency of white crappie Pomoxisannularis on an artificial diet. M.S. thesis. Pittsburg State University, Pittsburg, Kansas.1991.
Buck, H. and M. Hooe. "The production and growth of F1 hybrid crappie". Illinois NaturalHistory Survey, Biological Notes No. 125 (1986): 1-8.
Harper, D.C. "Crappie and calico bass culture in Texas." Progressive Fish Culturist 5(1938):12-14.
Leary, J.L. "Description of San Marcos station with some of the methods of propagation in use atthat station." Transactions of the American Fisheries Society 37(1908):75-81.

10
Leary, J.L. "Propagation of crappie and catfish." Transactions of the American Fisheries Society38(1909):143-148.
Nielsen, L. and D. Johnson (ed). Fisheries Techniques. Bethesda, Maryland: American FisheriesSociety. 1983.
Piper, R., I. McElwain, L. Orme, J. McCraren, L. Fowler, and J. Leonard (ed). Fish HatcheryManagement. Washington, D.C.: American Fisheries Society and U. S. Fish and WildlifeService. 1982.
Read, E.R. Cage culture of black, white, and F1 hybrid crappie (Pomoxis species). M.S. thesis. Pittsburg State University, Pittsburg, Kansas. 1994.
Robinette, H. "Effect of selected sublethal levels of ammonia on the growth of channel catfish(Ictalurus punctatus)". Progressive Fish Culturist. 38(1976): 26-29.
Sheehan, R. Culture Technology of Bluegill and Crappie for Food Fish. Sunfish WorkgroupPlan of Work. North Central Regional Aquaculture Center, Lansing, Michigan. 1995.
Simco, B.A., J.H. Williamson, G.J. Carmichael, and J.R. Tomasso. Centrarchids. Pages 73-89 inR.R. Stinckney, editor. Culture of Nonsalmonid Freshwater Fishes. CRC Press, Inc.,Boca Raton, Florida, U.S.A. 1986.
Smeltzer, J.F. and S.A. Flickinger. "Culture, Handling, and Feeding Techniques for BlackCrappie Fingerlings." North American Journal of Fisheries Management 11(1991):485-491.
Sokal, R. and F. Rohlf. Biometry. New York, New York: W. H. Freeman and Company. 1981.
Swingle, H. Methods of Analysis for Water, Organic Matter, and Pond Bottom Soils Used inFisheries Research. Auburn, Alabama: Auburn University. 1969.
Thomas, G.L. Culture of White Crappie (Pomoxis annularis) in a Recirculating System. M.S.thesis. Pittsburg State University, Pittsburg, Kansas. 1995.