Embed Size (px)
Citation preview
Soe Win Maung
Food Security Policyin Myanmar

Outline
• Agricultural Policy• Food Policy Development• Factors Related to Food Security
– Population– Food Production– Import & Export– Food Availability– Prices– Poverty & Hunger
• Food Security Issues• Food Security Policy Directions

Agricultural Policy …• To emphasize production and utilization of high yielding and good quality
seeds• To conduct training and education activities for farmers and extension staff
to provide advanced agricultural techniques• To inculcate agricultural knowledge into primary and secondary level
students• To spawn qualified agricultural technicians from State Agricultural Institutes
and Yezin Agricultural University• To implement research and development activities for sustainable
agricultural development• To protect farmers' rights and benefits • To assist farmers to get fair price on their produce• To assist in reduction of production cost, increasing high quality crop
production, strengthening and developing the market infrastructure
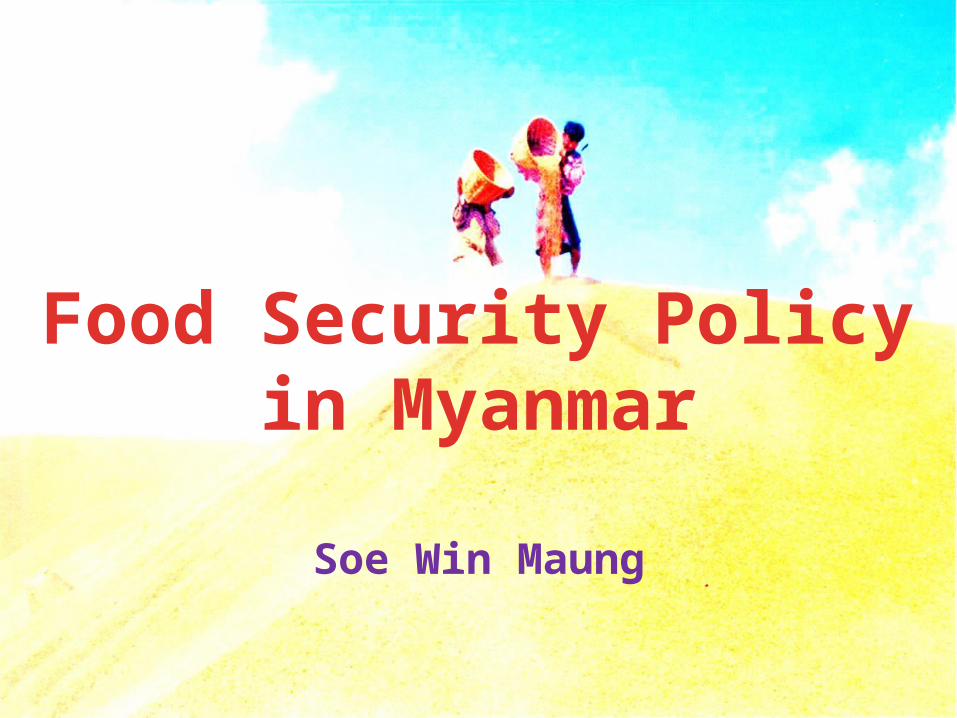
Agricultural Policy
• To encourage transformation from conventional agriculture to mechanized agriculture
• To undertake renovation and maintenance works for old irrigation, pumping and underground water systems
• To support rural development and poverty reduction activities through development of agriculture sector
• To help strengthen the market and allow the farmers freedom of choice in crop cultivation
• To encourage local and international investment in agriculture sector
• To appropriate and amend the existing agricultural laws and regulations in line with current situation
Source: DAP (2012), “Myanma Agriculture in Brief 2012”
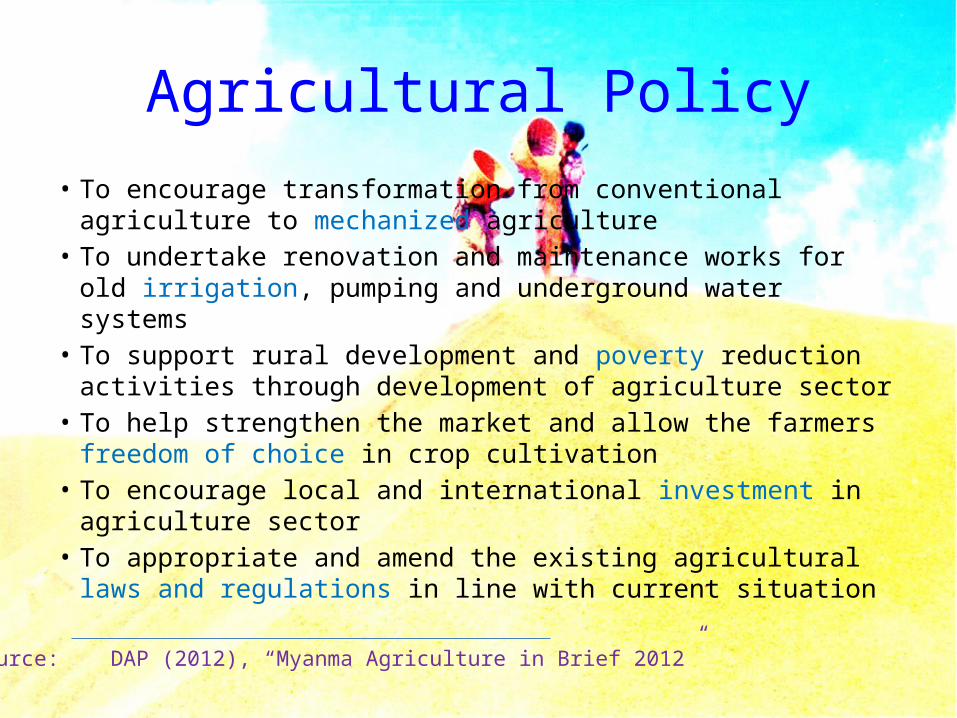
Food Policy Development • Food: Basic human right• Millennium Development Goals (MDGs) (MDG-1)• Rice, national crop • Summer rice (1992/93)• Regional self-sufficiency• Export marketable surplus• Rice organization (MRF, MAPCO)• Rice reserve (ASEAN)• ASEAN Food Security Information
System (AFSIS)• Cyclone Nargis (2008) • Land: Non-transferable from rice to other crops• Transformation from “Ya” to “Le”

Millennium Development Goal-1
Target 1A: Halve, between 1990 and 2015, the proportion of people whose income is less than one dollar a day
Target 1B: Achieve full and productive employment and decent work for all, including women and young people
Target 1C: Halve, between 1990 and 2015, the Proportion of People who suffer from hunger

Myanmar: MDG-1 AchievementTgt Indi Indicator 1995 2000 2015
Target
1.A
1 National Poverty Incidence 32.1 25.6 16.0
2 Poverty Gap Ratio 0.064 0.041
3 Share of Poorest Quintile in National Consumption 11.1 12.0
1.B 4 Growth rate of GDP per person employed - -
5 Employment/Population Ratio 54.3 57.1
6 Proportion of Employed People Living below the National Poverty Line
32.3 25.5
7 Proportion of Own-account and Contributing Family Workers in Total Employment
51.8 54.3
1.C 8 Prevalence of Moderate Underweight Children under Five Years of Age
34.3 32.0 19.3
9 Proportion of the Population below the Minimum Level of Dietary Energy Consumption
10 5
Source: IHLCA Survey (2009/10)
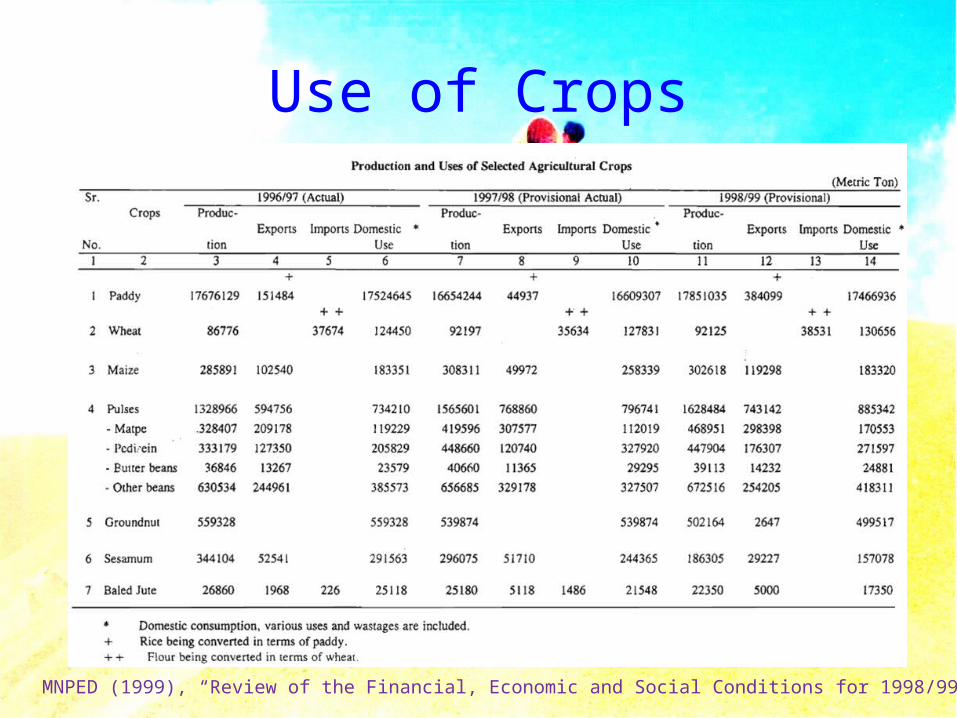
Use of Crops
Source: MNPED (1999), “Review of the Financial, Economic and Social Conditions for 1998/99”

Rice Sufficiency
Source: MOAI (2011), “Review on Rice Sufficiency”
• Per capita consumption rate– Rice (Urban: 12 bsk/ Rural: 15 bsk)– Oil (6 viss) – Pulses (6.5 pyi)
• Seed rate– Rice (2 bsk/ac)
• Waste– Rice (3 bsk/ac)
• Other use– Rice (15 % of Production)
• Processing Outturn– 1 mt of rice/ 100 bsk of paddy– 2 viss of oil/ 1 bsk of groundnut– 6 “ / “ sesamum
Norm

Food Security (4 dimensions)
“Food security exists when all people, at all times, have physical and economic access to sufficient, safe and nutritious food to meet their dietary needs and food preferences for an active and healthy life.”
World Food Summit (Oct, 1996)• Availability• Access• Utilization• Stability

Food Security Studies2006

Urban31%
Rural69%
Population
2001-02
2002-03
2003-04
2004-05
2005-06
2006-07
2007-08
2008-09
2009-10
2010-11
0
10000
20000
30000
40000
50000
60000
70000
0.0
0.5
1.0
1.5
2.0
2.5
RuralUrbangrowth
Gro
wth
Rat
e

Population
KCN
KYH
KYN
CHN
SGI
TNY
BGO
MGW
MDY
MON
RKH
YGN
SHT
AWD
18
30
59
15
69
39
151
124
220
253
89
676
36
227
Population Density per sq.km.Young Population

Food Production
2000-01
2001-02
2002-03
2003-04
2004-05
2005-06
2006-07
2007-08
2008-09
2009-10
0
500
1000
1500
2000
2500
Production of Fish
Fresh Water FisheriesMarine Fisheries
000 MT
2001-02
2002-03
2003-04
2004-05
2005-06
2006-07
2007-08
2008-09
2009-100
100200300400500600700800900
1000
Production of MeatBeef
Mutton
Pork
Fowl
Duck
Turkey, Geese, Muscovy Duck and Bar-rock
000'
MT

Food Import
2008/09 2009/10 2010/11 2011/12Edible vegetable oil and other hydrogenated oils 295.4 178.9 202.4 394.6Milk, Condensed 35.5 40.6 31.0 42.5Milk Powder 6.6 7.2 12.0 16.6Milk and evaporated 1.3 1.1 6.9 9.0Spices 1.4 2.1 2.1 2.4Wheat Flour * 0.3 * 0.2
(USD Million)
Source: CSO (2012), “Statistical Yearbook 2010”

Agri Export
2008-09 2009-10 2010-11 2011-12Rice 666.4 818.1 536.4 707.2 Maize 120.2 10.4 44.8 166.5 Pulses 1451.4 1231.9 829.4 1296.4
• Black gram 529.8 615.8 456.5 598.1
• Green gram 264.8 303.6 166.3 229.0
• Pigeon pea 471.8 193.9 146.2 319.5
• Gram 85.6 46.2 8.4 78.6
• Other pulses 99.4 72.4 52.0 71.2 Sesamum 19.5 24.4 29.5 35.5 Prawn 18.2 18.8 18.5 18.8
Fish & fish products 136.3 162 144.5 188.2Crab 3.0 7.3 1.7 4.5
(000 mt)
Source: CSO (2012), “Statistical Yearbook 2010”

Food Availability per Head (Kg)
1990/91
1991/92
1992/93
1993/94
1994/95
1995/96
1996/97
1997/98
1998/99
1999/00
2000/01
2001/02
2002/03
2003/04
2004/05
2005/06
2006/07
2007/08
2008/09
0
50
100
150
200
250
300
350
RiceEdible OilPulsesMeatFish

Food Price1
99
7-9
8
19
98
-99
19
99
-00
20
00
-01
20
01
-02
20
02
-03
20
03
-04
20
04
-05
20
05
-06
20
06
-07
20
07
-08
20
08
-09
100
300
500
700
900
1100
1300 Food Price Index(1) Rice
(2) Oil
(3) Fish, Meat & Eggs
(4) Others
General CPI
Food Index
2009-10 146.85 144.84
2010-11 158.93 157.21
2011-12 163.32 157.57
* 2006=100
*1997-98 = 100

Income
2006-07 2007-08 2008-09 2009-10 2010-110
100000
200000
300000
400000
500000
600000
700000
800000per Capita GDP
CurrentConstant
<ADB> ($, Current)
2007 351.0
2008 537.3
2009 595.7
2010 759.1
2011 856.8
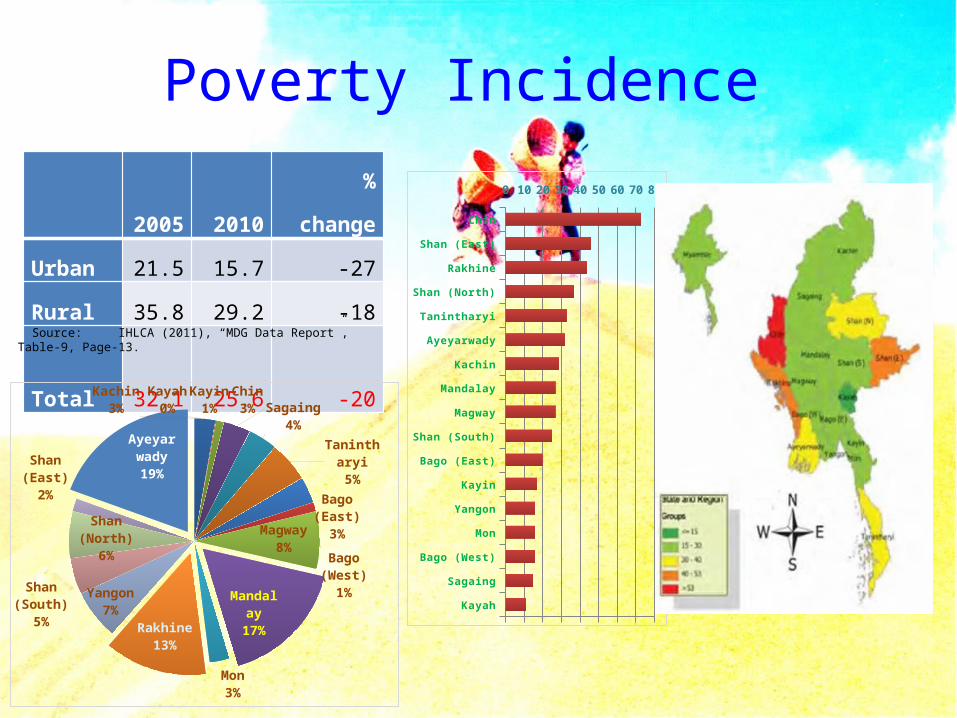
Poverty Incidence 2005 2010 % change
Urban 21.5 15.7 -27
Rural 35.8 29.2 -18
Total 32.1 25.6 -20 Source: IHLCA (2011), “MDG Data Report”, Table-9, Page-13.
Kayah
Sagaing
Bago (West)
Mon
Yangon
Kayin
Bago (East)
Shan (South)
Magway
Mandalay
Kachin
Ayeyarwady
Tanintharyi
Shan (North)
Rakhine
Shan (East)
Chin
0 10 20 30 40 50 60 70 80
Kachin3%
Kayah0%
Kayin1%
Chin3%
Sagaing4%
Tanintharyi
5%Bago (East)
3%Bago
(West)1%
Magway8%
Mandalay17%
Mon3%
Rakhine13%
Yangon7%
Shan (South)
5%
Shan (North)
6%
Shan (East)
2%
Ayeyarwady19%

Food ExpenditureS.N
.Particulars 1989 1997 2001 2006
I. SIZE OF HOUSEHOLD 5.27 5.25 5.37
4.72
II.HOUSEHOLD EXPENDITURE TOTAL 1795.50
13784.51
29309.73
97699.87
1.FOOD AND BEVERAGES TOTAL 1329.19 9779.45
21077.86
69170.71
Rice 540.49 2695.68 4634.8017891.4
5 Pulses 27.11 229.22 607.98 1842.16 Meat 109.91 1007.86 2874.21 7824.56 Eggs 23.09 210.42 692.45 2369.46 Fish and crustacea (fresh) 93.57 727.06 2588.65 5252.35 Fish and crustacea (dried) 42.29 310.83 531.53 2926.79 Ngapi and nganpyaye 52.41 264.48 475.00 1687.13 Cooking oil and fats 118.49 1248.43 2432.67 5536.11 Fruits and vegetables 57.43 955.55 2110.05 8826.45 Spices and condiments 79.55 563.33 1119.02 4727.99 Beverages 57.13 217.03 458.45 1444.26 Sugar and other food 49.84 276.56 422.82 1136.83 Milk and milk products 18.63 57.87 145.49 342.86 Other miscellaneous food 1/ 59.25 1015.14 1984.76 7362.31
2.NON-FOOD TOTAL 466.31 4005.06 8231.8828529.1
6
Food71%
Non-Food29%
Rice26%
Fruits13%
Meat11%
Oil8%
Others42%

Hunger (Food Poverty Incidence)
2005 2010%
change
Urban 6 2 -59Rural 11 6 -48
Total 10 5 -50

Global Hunger Index (GHI)Score Rank
1990 29.5
1996 25.4
2001 22.5
2009 19.6 53 (84)
2010 18.8 50 (84)
2011 16.3 41 (81)
Sour
ce:
IFPR
I (20
12),”
Glo
bal H
unge
r Ind
ex 2
011”
Source: ADB (2012), “Myanmar in Transition”
Comparison with ASEAN Neighbors

NutritionPer capita consumption (NNC 1997)• Per capita Calorie consumption = 92.4 % of RDA • Per capita Protein consumption = 115.7 % of RDAMalnutrition amongst children under 5 years of age (MICS 2009/10)• Prevalence of Underweight = 22.6 % • “ Overweight = 2%• Prevalence of Stunting (height for age) = 35.1 %• Prevalence of Wasting (weight for height) = 9.4 %Low birth weight (LBW) = 8.6 % (MICS 2009/10)20.5% men & 21.7 % women have a low body mass index (BMI) 7.2% men & 14.5 % women were overweight (BMI>25) 1.4 % men & 3.7 % women were obese (BMI>30) <NNC 2003>Iodine Deficiency Disorders (IDD), Vitamin A Deficiency (VAD), Iron Deficiency Anemia (IDA), Beriri (Thiamine/ Vitamin B1 deficiency)Water & Sanitation
RDA = Recommended Daily Allowance

Food Security Issues
• Household food security• Food safety• Emergency case• Food prices• Consumer preferences• Nutrition• Equity

Supporting for Food Security• Food Assistant/ Cash transfer• Promoting agricultural production• Income generation• Food outlook, Food balance sheet• Early warning system• Consumption survey, food security studies• Data and information system, Mapping system• Food storage facilities• Monitoring and Evaluation• Emergency management• Peoples’ awareness• Budget
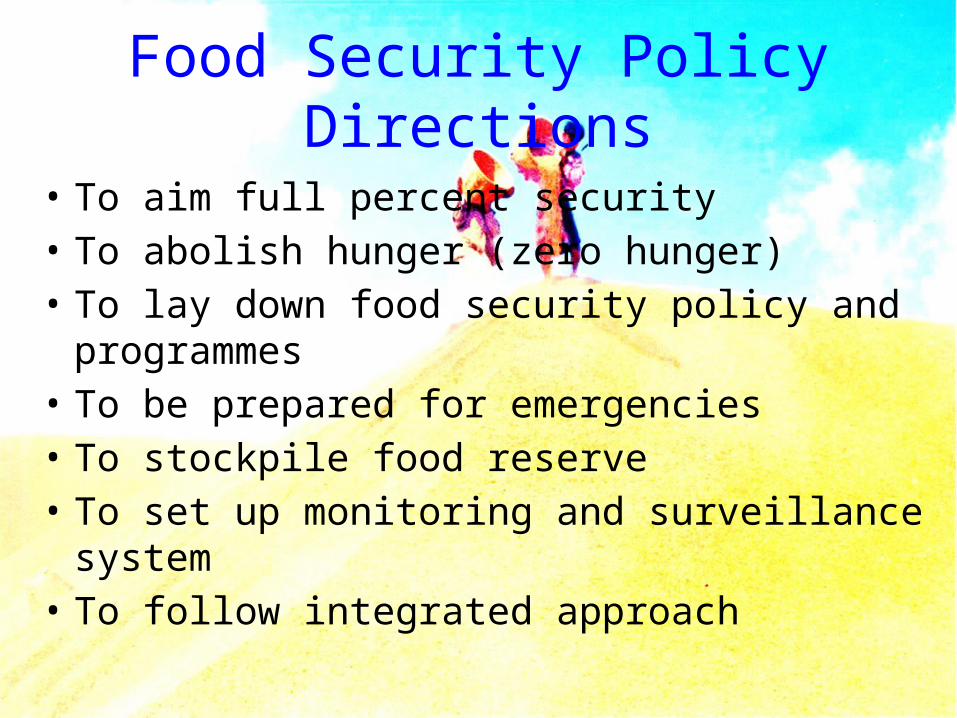
Food Security Policy Directions
• To aim full percent security• To abolish hunger (zero hunger)• To lay down food security policy and programmes• To be prepared for emergencies• To stockpile food reserve• To set up monitoring and surveillance system• To follow integrated approach

Thank You.