Embed Size (px)
Citation preview

National Toxicology Program Toxicity Report Series
Number 37
NTP Technical Report on Toxicity Studies of
Sodium Cyanide (CAS No. 143-33-9)
Administered in Drinking Water to F344/N Rats and B6C3F1 Mice
Charles D. Hébert, Ph.D., Study Scientist National Toxicology Program
Post Office Box 12233 Research Triangle Park, NC 27709
NIH Publication 94-3386 November 1993
These studies were supported in part by funds from the Comprehensive Environmental Response, Compensation, and Liability Act trust fund (Superfund) by an interagency agreement with the Agency for Toxic Substances and Disease Registry, U.S. Public Health Service.
United States Department of Health and Human Services Public Health Service
National Institutes of Health
TABLE OF CONTENTS
ABSTRACT 5
INTRODUCTION 7 Physical Properties, Production, Use, and Exposure 7 Biochemistry 9 Absorption, Disposition, Metabolism, and Excretion 9 Toxicity 11 Study Rationale and Design 16
M ATERIALS AND M ETHODS 17 Procurement and Characterization of Sodium Cyanide 17 Dose Formulations 17 Toxicity Study Designs 18 Genetic Toxicity Studies 23 Statistical Methods 24 Quality Assurance 25
RESULTS 27 13-Week Drinking Water Study in F344/N Rats 27 13-Week Drinking Water Study in B6C3F1 Mice 30
Genetic Toxicity Studies 32
DISCUSSION 33
REFERENCES 37
APPENDIXES Appendix A Organ Weights and Organ-Weight-to-Body-Weight Ratios A-1
Appendix B Hematology, Clinical Chemistry, and Urinalysis Results B-1
Appendix C Reproductive Tissue Evaluations and Estrous Cycle Characterization C-1
Appendix D Genetic Toxicology D-1
Note to the Reader
The National Toxicology Program (NTP) is made up of four charter agencies of the United States Department of Health and Human Services (DHHS):
• the National Cancer Institute (NCI) of the National Institutes of Health; • the National Institute of Environmental Health Sciences (NIEHS) of the National Institutes
of Health; • the National Center for Toxicological Research (NCTR) of the Food and Drug
Administration; and • the National Institute for Occupational Safety and Health (NIOSH) of the Centers for
Disease Control. In July 1981, the Carcinogenesis Bioassay Testing Program was transferred from NCI to NIEHS. NTP coordinates the relevant Public Health Service programs, staff, and resources that are concerned with basic and applied research and with biological assay development and validation.
NTP develops, evaluates, and disseminates scientific information about potentially toxic and hazardous chemicals. This knowledge is used for protecting the health of the American people and for the primary prevention of disease.
NTP designs and conducts studies to characterize and evaluate the toxicologic potential of selected chemicals in laboratory animals (usually two species, rats and mice). Chemicals selected for NTP toxicology studies are chosen primarily on the bases of human exposure, level of production, and chemical structure. Selection per se is not an indicator of a chemical's toxic potential.
The studies described in this toxicity study report were performed under the direction of NIEHS and were conducted in compliance with NTP laboratory health and safety requirements. These studies met or exceeded all applicable federal, state, and local health and safety regulations. Animal care and use were in accord and compliance with the Public Health Service Policy on Humane Care and Use of Animals.
Single copies of this report are available without charge, while supplies last, from the NTP Central Data Management (telephone number 919/541-1371).
NTP Central Data Management NIEHS
Post Office Box 12233 Research Triangle Park, NC 27709
National Toxicology Program Toxicity Report Series
Number 37
NTP Technical Report on Toxicity Studies of
Sodium Cyanide (CAS No. 143-33-9)
Administered in Drinking Water to F344/N Rats and B6C3F1 Mice
Charles D. Hébert, Ph.D., Study Scientist National Toxicology Program
Post Office Box 12233 Research Triangle Park, NC 27709
NIH Publication 94-3386 November 1993
These studies were supported in part by funds from the Comprehensive Environmental Response, Compensation, and Liability Act trust fund (Superfund) by an interagency agreement with the Agency for Toxic Substances and Disease Registry, U.S. Public Health Service.
United States Department of Health and Human Services Public Health Service
National Institutes of Health
SODIUM CYANIDE, NTP TOXICITY REPORT NUMBER 37
CONTRIBUTORS
This NTP report on the toxicity studies of sodium cyanide is based primarily on 13-week studies that took place from November1988 through March 1989.
National Toxicology Program Evaluated experiment, interpreted results, and reported findings Charles D. Hébert, Ph.D., Study Scientist
John R. Bucher, Ph.D. Leo T. Burka, Ph.D. Rajendra S. Chhabra, Ph.D. Robert E. Chapin, Ph.D. Michael R. Elwell, D.V.M., Ph.D. Joel Mahler, D.V.M. Bernard A. Schwetz, D.V.M., Ph.D. Gregory S. Travlos, D.V.M. Kristine L. Witt, M.S.
Oak Ridge Associated Universities
Southern Research Institute Principal contributors J. D. Prejean, Ph.D., Principal Investigator
H. D. Giles, D.V.M., Ph.D. Charles Lindamood III, Ph.D. R. B. Thompson, D.V.M., Ph.D.
Experimental Pathology Laboratories, Inc. Provided pathology quality assessment Jerry F. Hardisty, D.V.M. William F. MacKenzie, D.V.M., M.S. John Peckham, D.V.M., M.S., Ph.D. Gary Riley, M.V.Sc., Ph.D.
NTP Pathology Review Evaluated slides and prepared pathology report John C. Seely, D.V.M., Chair
Pathology Associates, Inc. Michael R. Elwell, D.V.M., Ph.D.
National Toxicology Program
Environmental Health Research and Testing, Inc. Provided sperm morphology and vaginal cytology evaluation Teresa Cocanougher, B.A. Dushant K. Gulati, Ph.D. Susan Russell, B.A.
Analytical Sciences, Inc. Provided statistical analyses Steven Seilkop, M.S. Janet L. Teague, M.S.
Biotechnical Services, Inc. Provided toxicity report preparation Janet L. Elledge, B.A., Principal Investigator
Waynette D. Sharp, B.A., B.S.
SODIUM CYANIDE, NTP TOXICITY REPORT NUMBER 37
PEER REVIEW
The draft report on the toxicity studies of sodium cyanide was evaluated in June 1993 by the reviewers listed below. These reviewers serve as independent scientists, not as representatives of any institution, company, or governmental agency. In this capacity, reviewers determine if the design and conditions of these NTP studies are appropriate and ensure that the toxicity study report presents the experimental results and conclusions fully and clearly. The comments of the peer reviewers were reviewed by the NTP staff and were addressed in this toxicity study report.
Paul T. Bailey, Ph.D. Environmental and Health Sciences James L. Way, Ph.D.
Laboratory Department of Pharmacology and Toxicology Mobil Oil Corporation Texas A&M University College of Medicine Princeton, NJ College Station TX
Harold Davis, D.V.M., Ph.D. Medical Research Division American Cyanamid Pearl River, NY
ABSTRACT
Sodium Cyanide
NaCN
CAS Number 143-33-9 Molecular Weight 49.02 Synonym Cyanogran
Cyanide and its salts are used extensively in industry and manufacturing and are found
in water and food consumed by humans. Chronic exposure to low levels of cyanide is
suspected to be responsible for various neuropathic and thyrotoxic conditions in
humans. Data in the literature indicate that long-term exposure to near-lethal
concentrations of cyanide may produce lesions in rodents similar to those linked to
chronic cyanide exposure in humans. However, few data are available on the effects of
subchronic exposure to cyanide concentrations that are not acutely toxic. To address
this lack of data, 13-week toxicity studies on cyanide were conducted with male and
female F344/N rats and B6C3F1 mice administered low doses of sodium cyanide in
drinking water. Animals were evaluated for histopathology, clinical chemistry,
hematology, urine chemistry, and reproductive toxicity. In addition, the mutagenicity of
sodium cyanide was assessed in Salmonella typhimurium.
Groups of 10 rats and 10 mice per sex were administered sodium cyanide in drinking
water at concentrations of 0, 3, 10, 30, 100, and 300ppm for 13weeks. No deaths
attributed to sodium cyanide administration occurred in either species. In animals
exposed to 300ppm, male rats had slightly lower final mean body weights and mean body
weight gains and female mice had slightly lower final mean body weights than the
respective controls. Water consumption by rats and mice in the 100 and 300ppm groups
was 10% to 30% lower than that by the controls; however, no clinical signs attributable
to sodium cyanide administration or to dehydration were observed. No gross or
microscopic changes specifically related to cyanide toxicity occurred at any site in males
or females of either species. In particular, no lesions were found in the brain or thyroid
gland. Differences between absolute and relative organ weights of exposed and control
animals were minor and sporadic and were not exposure concentration dependent;
these differences were not considered to be related to sodium cyanide administration.
Hematologic, clinical chemistry, and urinalysis evaluations of rats and mice revealed
minimal changes that were not considered biologically significant, although the
decreased urine volume and increased urine specific gravity observed in male rats in the
300ppm group of the supplemental clinical pathology study were consistent with the
observed decreases in water consumption. The concentration of urinary thiocyanate
(the primary metabolite of cyanide) increased with increasing exposure concentration at
all time points.
Sperm motility and vaginal cytology examinations were performed on rats and mice in
the 0, 30, 100, and 300 ppm groups. Sodium cyanide caused a slight reduction in cauda
epididymal weight in all groups of exposed male rats and in male mice exposed to 300-
ppm. In male rats, the number of spermatid heads per testis in the 300ppm group was
less than the number in the controls, and sperm motility in all exposed groups was
marginally lower than in the controls. Sodium cyanide produced no adverse effects on
estrous cyclicity in female mice, but at higher concentrations (100 and 300 ppm), sodium
cyanide caused a significant increase in the amount of time spent by female rats in
proestrus and diestrus relative to estrus and metestrus.
Sodium cyanide was not mutagenic in Salmonella typhimurium strain TA100, TA1535,
TA97, or TA98 with or without exogenous metabolic activation.
In summary, administration of low concentrations of sodium cyanide in drinking water to
rats and mice for 13 weeks resulted in no clinically significant body weight, organ weight,
histopathologic, or clinical pathology changes. The absorption of administered cyanide was
confirmed by increases in urinary thiocyanate excretion. Concentrations of 100 ppm and
greater resulted in reduced water consumption. Thus, higher concentrations of sodium
cyanide could not be administered by the drinking water route of administration.
Alterations in reproductive parameters indicate that subchronic exposure to low
concentrations of sodium cyanide may produce mild but significant adverse effects on rat
reproductive systems. These changes are probably insufficient to decrease fertility in rats;
however, humans are considered to be relatively more sensitive to such changes than rats,
and the potential for reproductive toxicity in humans from low concentrations of cyanide
warrants further investigation.
SODIUM CYANIDE, NTP TOXICITY REPORT NUMBER 37
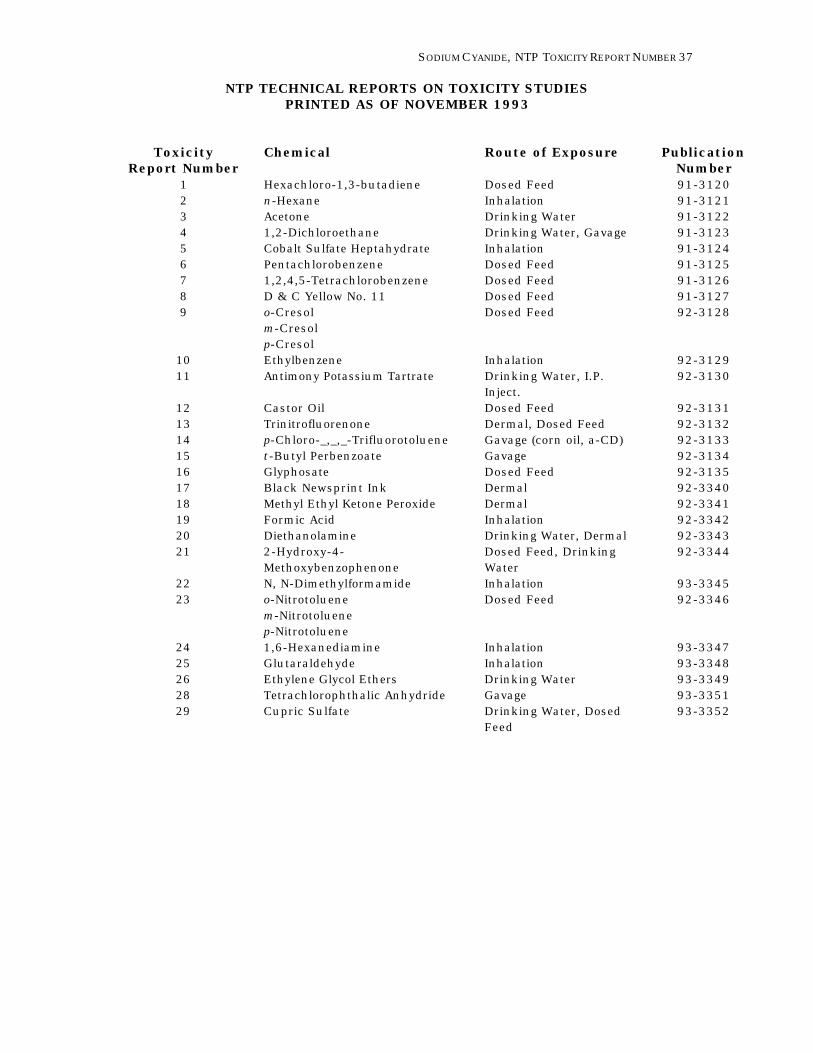
NTP TECHNICAL REPORTS ON TOXICITY STUDIES PRINTED AS OF NOVEMBER 1993
Toxicity Chemical Route of Exposure Publication Report Number Number
1 Hexachloro-1,3-butadiene Dosed Feed 91-3120 2 n-Hexane Inhalation 91-3121 3 Acetone Drinking Water 91-3122 4 1,2-Dichloroethane Drinking Water, Gavage 91-3123 5 Cobalt Sulfate Heptahydrate Inhalation 91-3124 6 Pentachlorobenzene Dosed Feed 91-3125 7 1,2,4,5-Tetrachlorobenzene Dosed Feed 91-3126 8 D & C Yellow No. 11 Dosed Feed 91-3127 9 o-Cresol Dosed Feed 92-3128
m-Cresol p-Cresol
10 Ethylbenzene Inhalation 92-3129 11 Antimony Potassium Tartrate Drinking Water, I.P. 92-3130
Inject. 12 Castor Oil Dosed Feed 92-3131 13 Trinitrofluorenone Dermal, Dosed Feed 92-3132 14 p-Chloro-_,_,_-Trifluorotoluene Gavage (corn oil, a-CD) 92-3133 15 t-Butyl Perbenzoate Gavage 92-3134 16 Glyphosate Dosed Feed 92-3135 17 Black Newsprint Ink Dermal 92-3340 18 Methyl Ethyl Ketone Peroxide Dermal 92-3341 19 Formic Acid Inhalation 92-3342 20 Diethanolamine Drinking Water, Dermal 92-3343 21 2-Hydroxy-4- Dosed Feed, Drinking 92-3344
Methoxybenzophenone Water 22 N, N-Dimethylformamide Inhalation 93-3345 23 o-Nitrotoluene Dosed Feed 92-3346
m-Nitrotoluene p-Nitrotoluene
24 1,6-Hexanediamine Inhalation 93-3347 25 Glutaraldehyde Inhalation 93-3348 26 Ethylene Glycol Ethers Drinking Water 93-3349 28 Tetrachlorophthalic Anhydride Gavage 93-3351 29 Cupric Sulfate Drinking Water, Dosed 93-3352
Feed
SODIUM CYANIDE, NTP TOXICITY REPORT NUMBER 37
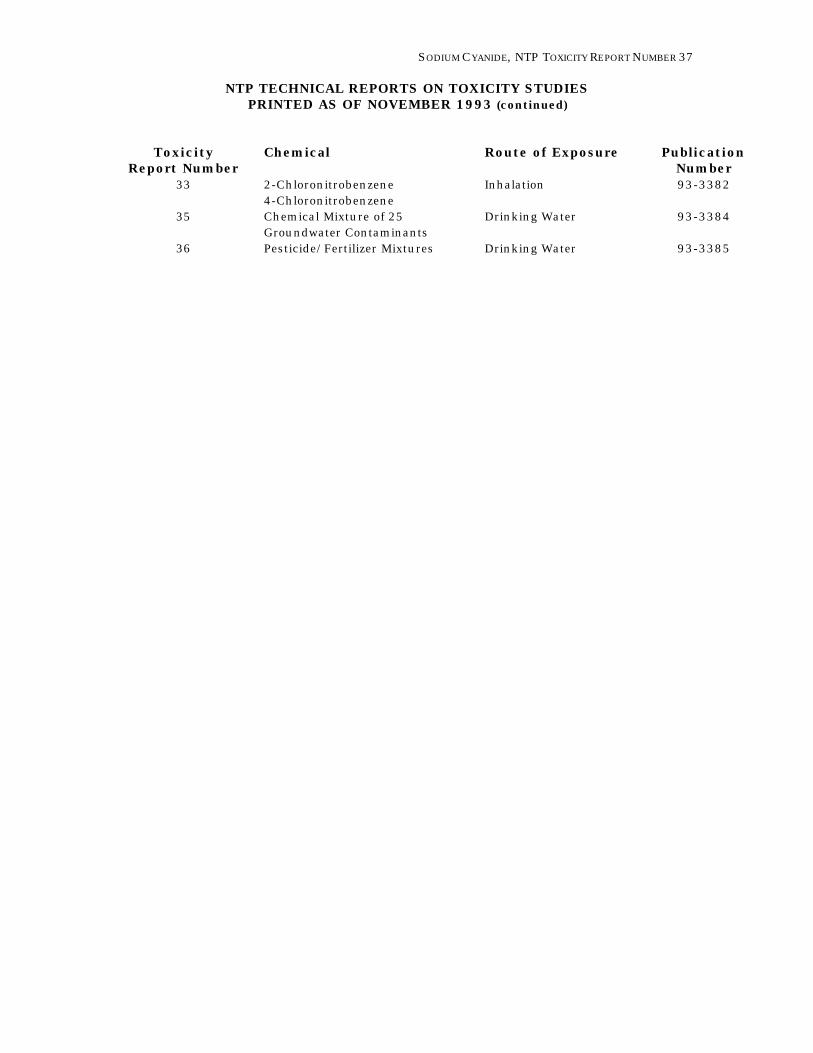
NTP TECHNICAL REPORTS ON TOXICITY STUDIES PRINTED AS OF NOVEMBER 1993 (continued)
Toxicity Chemical Route of Exposure Publication Report Number Number
33 2-Chloronitrobenzene Inhalation 93-3382 4-Chloronitrobenzene
35 Chemical Mixture of 25 Drinking Water 93-3384 Groundwater Contaminants
36 Pesticide/Fertilizer Mixtures Drinking Water 93-3385
INTRODUCTION
Physical Properties, Production, Use and Exposure Sodium cyanide and other cyanide salts are used extensively in a multitude of industrial
processes, including the production of dyes, pigments, nylon, and chelating agents; the
cleaning, electroplating, and case-hardening of metals; the extraction of gold and silver
from ore; the manufacture of adiponitrile; coal gasification; and the fumigation of ships,
buildings, and soil (Klaassen, 1980; Hartung, 1982). The estimated production capacity
for cyanide in the United States was approximately 202million kilograms in 1964 and
rose to approximately 616million kilograms in 1987 (Towill etal., 1978; ATSDR, 1988). An
estimated 454 million kilograms of sodium cyanide was produced in the U.S. in 1987, and
approximately 7.3million kilograms of cyanide salts were imported during 1982 and 1984.
Sodium cyanide is prepared by the direct reaction of hydrogen cyanide with alkali, by
melting sodium chloride with calcium cyanamide, or by heating sodium amide with
carbon (Hartung, 1982). Under dry conditions, the compound is a white, odorless,
crystalline powder that can absorb moisture from the atmosphere and, when moist, gives
off a faint odor of almonds. Sodium cyanide has a molecular weight of 49.02, a melting
point of 564°C (1,027°F), and a boiling point of 1,496°C (2,645°F). The compound is
readily soluble in aqueous solutions and slightly soluble in alcohol. The vapor pressure
of sodium cyanide is 1mm Hg at 817°C and 10mm Hg at 983°C; these temperatures are
frequently attained in metal-treatment processes using cyanide (Hartung, 1982). Upon
contact with water, steam, or acid, sodium cyanide gradually releases the highly toxic
and flammable gas hydrogen cyanide.
Exposure to cyanide can take place by a variety of routes, including oral, dermal, and
inhalation. In industries using cyanide, occupational exposures occur primarily by the
dermal and inhalation routes. Nonindustrial sources of cyanide in air include
malfunctioning catalytic converters on automobiles and residential and commercial fires
involving the burning of plastics (Way, 1982). Tobacco smoke contains significant levels
of cyanide, which has been associated with a nervous disorder known as tobacco
amblyopia (Chisholm et al., 1967). Oral exposure to cyanides in the environment can
take place through consumption of food bearing residual cyanide from insecticides or
drinking water contaminated by industrial effluents or insecticides. Other potential
sources of cyanide exposure include pharmaceutical preparations such as laetrile, a
controversial cancer medication which can be degraded to cyanide; nitroprusside, a
pharmaceutical agent used to treat hypertension and to control bleeding during surgery;
and succinonitrile, a commonly used antidepressant (Solomonson, 1982). Additionally, a
number of vegetables contain significant levels of cyanogenic compounds and can
contribute to cyanide-like poisoning. These vegetables include lima beans, sorghum,
sweet potatoes, maize, millet, bamboo shoots, and cassava, a staple foodstuff in many
regions of Africa (Solomonson, 1982).
Cyanide is produced as a waste component in a number of industries, including mining,
the steel industry, and paint manufacturing. Due to the well-known acute toxicity of
cyanide, waste management procedures in industry are usually quite rigorous, and a
relatively small fraction of the cyanide produced is believed to be discharged into the
environment. Nevertheless, it is estimated that, nationwide, paint manufacturing
accounts for approximately 355,000 pounds of cyanide released annually (Towill et al.,
1978). High levels of cyanide have been found in surface water at numerous sites,
including Denver, Colorado, where a number of ponds downstream from a landfill were
contaminated with high levels of cyanide; Oak Ridge, Tennessee, where cyanide in
effluent from a sewage facility was responsible for a large fish kill; and Byron, Illinois,
where leakage from stored drums containing cyanides resulted in cyanide
concentrations of up to 365ppm in surface water, causing environmental damage and
loss of livestock (USEPA, 1974, 1975; Towill etal., 1978). Data from the Nationwide Urban
Runoff Program revealed that 16% of urban runoff samples collected from cities across
the U.S. contained cyanide concentrations of 2 to 33 ppb (Cole etal., 1984). The
threshold limit value recommended by the American Conference of Governmental
Industrial Hygienists (ACGIH) and the standard recommended by the National Institute
for Occupational Safety and Health (NIOSH) for cyanide in air are 5 mg/m3, and the
ACGIH adds a skin notation to indicate the potential for dermal absorption of airborne
cyanide (ACGIH, 1991; Sittig, 1991). The U.S. Environmental Protection Agency (USEPA)
has recommended a maximum permissible concentration of 0.2mg/L for cyanide in water
for the protection of human health, and the World Health Organization has set a
drinking water standard of 0.05mg/L (Sitting, 1991).
Biochemistry The cyanide ion (CN-) forms stable but reversible complexes with biologically active metal
ions. Such complexation inhibits the activity of the enzymes containing the metal
atom(s). Cyanide inhibits the activity of numerous enzymes, including cytochrome
oxidase, catalase, peroxidase, nitrogenase, and nitrite and nitrate reductase (Hartung,
1982; Solomonson, 1982). In addition, cyanide can interact with and inhibit
nonmetalloenzymes such as ribulose diphosphate carboxylase. Such inhibition is
thought to involve a reaction between cyanide and a Schiff-base intermediate to form an
inhibitory compound. Isom etal. (1975) reported that potassium cyanide altered the
glucose metabolism of mice injected with sublethal doses, causing a change from aerobic
(Embden-Meyerhoff and tricarboxylic acid) to anaerobic (pentose phosphate shunt)
pathways.
Absorption, Disposition, Metabolism, and Excretion Absorption of cyanide occurs rapidly through the gastrointestinal tract, lungs, and skin.
While data on actual absorption rates are not available, the extremely rapid onset of
symptoms after exposure to cyanide occurs makes it clear that the compound is readily
taken up and distributed throughout the body. In some cases of human ingestion,
victims have become unconscious within seconds and died within minutes of exposure.
The rate of absorption of cyanide from the gastrointestinal tract depends on the
chemical form of the cyanide and the presence of food in the tract. Food in the stomach
significantly delays the absorption of cyanide, and experimental results have
demonstrated that dogs and cattle can be protected from the lethal effects of cyanide by
the presence of carbohydrates in the stomach (Couch, 1934; Liebowitz and Schwartz,
1948). Cyanide can be released in lethal concentrations from cyanogenic glycosides in
foodstuffs; however, the uptake of cyanide in such cases is usually slow, and the onset
of symptoms is often delayed (Towill etal., 1978). Cyanide inhaled as either vapor or dust
is rapidly absorbed and distributed within the body; in humans, inhalation of 220 to 270-
ppm hydrogen cyanide has resulted in immediate death (Towill et al., 1978; Way, 1982).
The absorption of cyanide after inhalation of low concentrations is demonstrated by the
increased levels of thiocyanate in the blood of smokers. However, because of the rapid
metabolism of cyanide to thiocyanate, plasma cyanide levels in such cases are usually
not elevated. Cyanide is also absorbed percutaneously by humans, and such absorption
can result in poisoning (Drinker, 1932; Potter, 1950).
Although the distribution of cyanide to the various tissues in the body is fairly uniform,
the highest levels are typically found in the liver, lungs, blood, and brain. Gettler and
Baine (1938) found that in dogs exposed to cyanide by inhalation or by stomach
intubation, the highest concentrations of cyanide were found in the lungs and blood
with either route of exposure, even though tissue distribution varied somewhat with the
route of administration. In several cases of human poisoning after ingestion of cyanide,
the compound was uniformly distributed throughout the body (Gettler and Baine, 1938).
Yamamoto et al. (1982) found that in rats dosed with cyanide by gavage, the highest
concentrations of cyanide were in the liver, followed by the lungs and blood. After
inhalation exposure, the highest concentrations of cyanide in rats were found in the
lungs, followed by the blood and the liver.
Some of the cyanide in blood can bind reversibly to the Fe3+ of methemoglobin and
become sequestered, and experimental results have shown that human erythrocytes
can concentrate cyanide from the surrounding fluid (McMillan and Svoboda, 1982). After
cessation of exposure, plasma cyanide in humans returns to baseline levels within 4 to
8hours (t = 20 minutes to 1 hour). Plasma thiocyanate is therefore a better marker of
cyanide exposure than cyanide itself.
Although cyanide can interact with substances such as methemoglobin in the
bloodstream, the majority of cyanide metabolism occurs within the tissues. Cyanide is
metabolized in mammalian systems by one major route and several minor routes. By far
the most important mechanism for cyanide metabolism is the conversion of the cyanide
ion to thiocyanate by the enzyme rhodanese. This enzyme catalyzes the transfer of the
sulfane sulfur of thiosulfate to the cyanide ion to form thiocyanate, which is then
excreted in the urine (Westley et al., 1983; Rutkowski et al., 1986). The highest
concentrations of rhodanese are found in the liver, kidney, brain, and muscle. In
addition to rhodanese, a number of other sulfurtransferases can metabolize cyanide,
and albumin, which carries elemental sulfur in the body in the sulfane form, may aid in
the catalysis of cyanide to thiocyanate as well (Westley et al., 1983). The carbon of
cyanide and thiocyanate can also be metabolized via several minor routes, including
conversion of hydroxocobalamin to cyanocobalamin (Boxer and Rickards, 1952),
conversion of cystine to cysteine and β-thiocyanoalanine (Wood and Cooley, 1956), and
conversion to carbon dioxide.
Absorbed cyanide is mainly excreted as thiocyanate in the urine; however, traces may
also be excreted unchanged or as a variety of metabolic products (e.g., carbon dioxide, β-
thiocyanoalanine) in expired air, saliva, and sweat (Friedberg and Schwarzkopf, 1969;
Hartung, 1982).
Toxicity The toxic effects of cyanide in humans and animals are generally similar. These effects,
whether acute or chronic, are thought to result from inhibition of cellular respiration
and consequent histotoxic anoxia. However, the syndromes resulting from acute and
chronic cyanide poisoning are distinctly different.
ACUTE TOXICITY
Cyanide is an extremely potent and fast-acting poison. In humans, inhalation of 110 to
135ppm cyanide results in death within a few hours, and inhalation of 220 to 270ppm is
immediately fatal (Towill etal., 1978; Way, 1982). While the lethal dose of cyanide
depends on many factors, including the form of cyanide used, the dosing regimen, the
route of administration, and the presence of food in the stomach, the LDLO and the
LD50 in mammals generally range from 1.3 to 10mg/kg body weight (Table1). The
minimum absorbed lethal dose in humans is estimated to be 1.4 to 3.0 mg/kg (Gettler
and Baine, 1938; Way, 1982). Typical signs of acute cyanide poisoning include
tachypnea, headache, vertigo, lack of motor coordination, weak pulse, cardiac
arrhythmias, vomiting, convulsion, coma, and death. No specific gross or histopathologic
lesions are seen following acute cyanide poisoning, and there are no autopsy
characteristics that are considered pathognomonic for death from cyanide poisoning.
Pathologic findings may include tracheal congestion with hemorrhage; cerebral and
pulmonary edema; gastric erosions; and petechiae of the brain, meninges, and
pericardium (Way, 1982; Ballantyne, 1983).
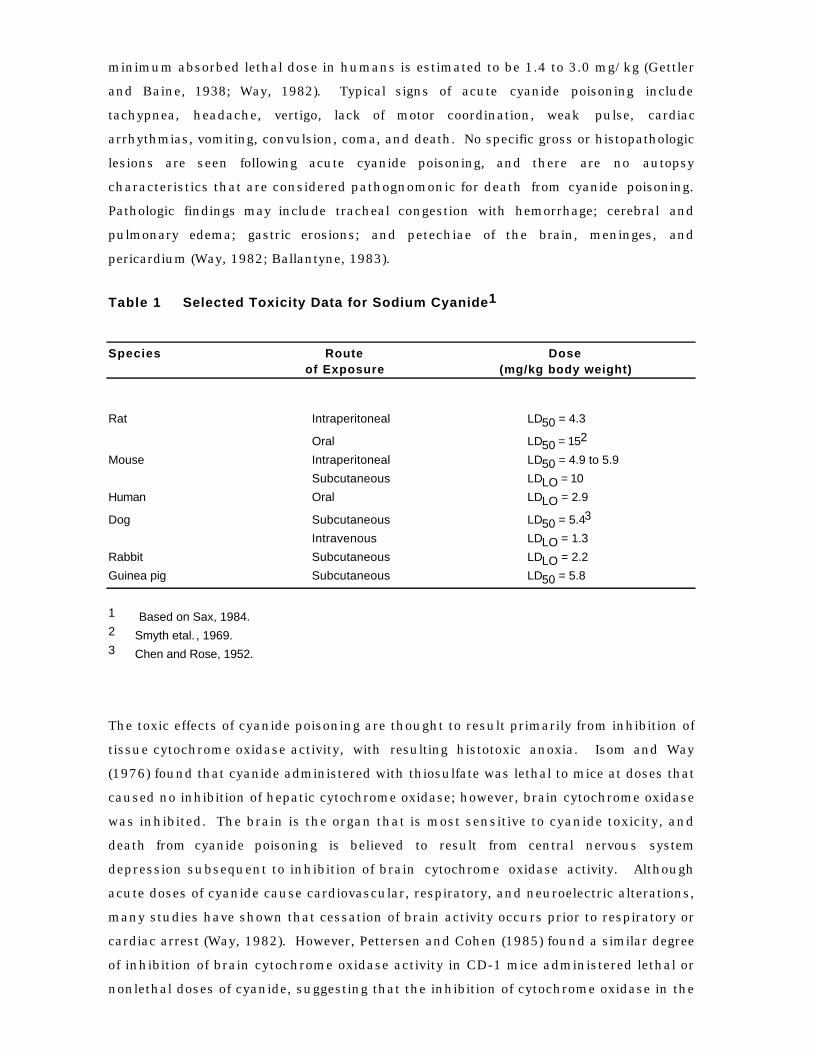
Table 1 Selected Toxicity Data for Sodium Cyanide1
Species Route Dose of Exposure (mg/kg body weight)
Rat Intraperitoneal LD50 = 4.3
Oral LD50 = 152
Mouse Intraperitoneal LD50 = 4.9 to 5.9
Subcutaneous LDLO = 10
Human Oral LDLO = 2.9
Dog Subcutaneous LD50 = 5.43
Intravenous LDLO = 1.3
Rabbit Subcutaneous LDLO = 2.2
Guinea pig Subcutaneous LD50 = 5.8
1 Based on Sax, 1984. 2 Smyth etal. , 1969. 3 Chen and Rose, 1952.
The toxic effects of cyanide poisoning are thought to result primarily from inhibition of
tissue cytochrome oxidase activity, with resulting histotoxic anoxia. Isom and Way
(1976) found that cyanide administered with thiosulfate was lethal to mice at doses that
caused no inhibition of hepatic cytochrome oxidase; however, brain cytochrome oxidase
was inhibited. The brain is the organ that is most sensitive to cyanide toxicity, and
death from cyanide poisoning is believed to result from central nervous system
depression subsequent to inhibition of brain cytochrome oxidase activity. Although
acute doses of cyanide cause cardiovascular, respiratory, and neuroelectric alterations,
many studies have shown that cessation of brain activity occurs prior to respiratory or
cardiac arrest (Way, 1982). However, Pettersen and Cohen (1985) found a similar degree
of inhibition of brain cytochrome oxidase activity in CD-1 mice administered lethal or
nonlethal doses of cyanide, suggesting that the inhibition of cytochrome oxidase in the
brain may not be responsible for the lethality of cyanide. Persson et al. (1985) described
rapid and fairly specific changes in the central dopaminergic and γ -aminobutyric acid-
ergic systems of rats and mice dosed intraperitoneally with sodium cyanide, and these
changes may contribute to central nervous system depression and to the lethality of
cyanide.
CHRONIC TOXICITY
While the acute toxicity of cyanide has been thoroughly investigated for many species,
relatively few experimental data exist on the effects of subchronic and chronic cyanide
exposure. However, the data that are available indicate that the same kinds of effects
occur in humans and experimental animals. In experiments with rats (Ibrahim et al.,
1963; Lessell, 1971; Lessell and Kuwabara, 1974; Philbrick et al., 1979), cats, and
monkeys (Ferraro, 1933; Hurst, 1940), selective destruction of white matter in the brain
was a striking and consistent feature of poisoning from prolonged exposure to cyanide.
In most of these experiments, animals were injected with increasing doses of sodium or
potassium cyanide for up to 132days, and the doses used were high enough to cause
significant death rates from acute toxicity. However, in the study by Philbrick et al.
(1979), weanling rats exposed to low concentrations of potassium cyanide in feed had a
marked decrease in weight gain, but no deaths or clinical signs of toxicity. Early necrosis
of gray and white matter was a common occurrence in rats and monkeys, but repeated
exposure appeared to selectively favor destruction of white matter. The histopathologic
lesions observed in all species consisted of demyelination, especially of the optic nerve
tracts and the corpus callosum. Swelling of astrocytes and myelin damage were
apparent within 2days in rats injected with sodium cyanide at doses sufficient to keep
the rats comatose for 225 to 260 minutes (Lessell and Kuwabara, 1974). Axonal damage,
with vacuolation and loss of microtubules, also occurred. Blindness was common in
cyanide-treated animals and was considered to be a result of persistent anoxia in the
brain.
Neurologic lesions attributed to subchronic cyanide poisoning in humans are similar to
those described for experimental animals. In rats, however, the corpus callosum
appears to be more sensitive than the optic nerves, whereas in humans, optic nerve
damage is frequently the only central nervous system lesion (Way, 1982). Numerous
studies have implicated cyanide as the etiologic agent in human neuropathies, including
Nigerian nutritional neuropathy, tobacco amblyopia, and Leber's optical atrophy
(reviewed in Towill etal., 1978). The syndrome of tropical ataxic neuropathy includes
bilateral optic atrophy, nerve deafness, sensory spinal ataxia, weakness of legs, and
numbness of feet (Osuntokun, 1968). This condition is believed to be due to cyanide-
induced demyelination in the brain and spinal cord and is attributed primarily to
consumption of the plant cassava, which contains high levels of cyanogenic glycosides
(Way, 1982). Elevated plasma and urinary thiocyanate levels and demyelination of
peripheral nerves, with decreased conduction velocity, were observed in patients from
Nigeria with tropical ataxic neuropathy (Osuntokun, 1968; Osuntokun et al., 1970).
Cyanide poisoning from tobacco smoke has also been implicated in the occurrence of
tobacco amblyopia, an optic disorder that is common in people who smoke tobacco.
Tobacco smoke is known to contain cyanide, and Wilson (1965) reported that smokers
have elevated levels of plasma and urinary thiocyanate. Hydroxocobalamin and
cyanocobalamin, which are capable of complexing cyanide in the bloodstream, have
been shown to be effective in treating tobacco amblyopia, suggesting that cyanide itself
is the etiologic agent in this disorder (Chisholm et al., 1967). Finally, an inborn error in
cyanide metabolism is thought to be the cause of Leber's hereditary optic atrophy, a
condition in which bilateral vision failure occurs. Low levels of plasma thiocyanate in
smokers with this condition suggests a hereditary deficiency in the ability to metabolize
cyanide to thiocyanate (Wilson, 1965). The neurologic lesions seen with all of these
neuropathies are thought to be the result of cyanide-induced histotoxic anoxia.
A second clinical feature observed in cases of subchronic cyanide poisoning is
disturbance of thyroid function. Significant decrements in thyroid function, reflected as
decreases in plasma thyroxine levels and thyroxine secretion and increases in thyroid
weight, were observed in weanling rats exposed to 1,500 ppm cyanide or 2,240 ppm
thiocyanate in feed for 11.5 months (Philbrick et al., 1979). No deaths, clinical signs of
toxicity, or histopathologic lesions in the eye, thyroid gland, or neural tissues were
observed. The effect of cyanide on the thyroid is believed to be indirect, occurring
through the action of thiocyanate, and to be exacerbated by nutritional deficiency.
Thiocyanate inhibits both the uptake and the utilization of iodine by the thyroid gland
(Solomonson, 1982).
Epidemiologic studies have demonstrated an increased incidence of goiter in workers
exposed to cyanide in case-hardening and electroplating factories (Hardy et al., 1950; El-
Ghawabi et al., 1975; Towill et al., 1978). Thyroid dysfunction in these men was often
accompanied by neurologic symptoms including headache, dizziness, confusion, and
"psychotic episodes" and was associated with increased urinary thiocyanate levels. This
neurologic and thyroid gland damage cannot be unequivocally ascribed to cyanide due to
the fact that exposures to other substances may have occurred; however, the similarity
of the lesions in humans in these factories to those produced in experimental animals
treated with cyanide and the cumulative epidemiologic evidence make a strong case for
the role of cyanide in these conditions.
REPRODUCTIVE AND DEVELOPMENTAL TOXICITY
Relatively few data are available on the reproductive and developmental toxicity of
cyanide. Tewe and Maner (1981a) fed pregnant rats diets of cassava containing 500 ppm
cyanide throughout gestation and lactation; no effects on the number or body weight of
offspring or weight gain of pups during lactation were observed. In similar experiments
with pregnant pigs, 250 to 500 ppm cyanide in the diet during gestation had no effect on
the number or weight of offspring or subsequent lactational performance (Tewe and
Maner, 1981b). At the 500 ppm concentration, pregnant sows had proliferative changes
in the kidney glomeruli and increased thyroid weights. However, no teratogenic effects
per se were reported. In contrast, when pregnant hamsters were dosed subcutaneously
with 6.125 to 6.517mmol/kg sodium cyanide per hour beginning on Day6 of gestation
through delivery (a period covering organogenesis in the hamster), severe fetal
malformations were observed at all doses greater than 6.125mmol/kg per hour, and a
dose of 6.517 mmol/kg per hour caused 100% fetal mortality and some maternal deaths
(Doherty et al., 1982). Malformations included exencephaly, encephalocele, nonclosure
of the neural tube, and microphthalmia. Maternal toxicity in these experiments did not
correlate with the incidence of malformations, and thiosulfate protected the dams and
fetuses from the toxic effects of cyanide.
CARCINOGENICITY
Cyanide and cyanogenic glycosides (e.g., amygdalin) have been employed as therapeutic
agents in cancer chemotherapy of humans and animals in the past (Stone et al., 1959;
Brown et al., 1960). Cyanide has been reported to be a selective inhibitor of some types
of neoplasms, such as the Ehrlich ascites tumor in mice (Brown et al., 1960), and several
laboratories have reported an anticancer effect of amygdalin (Morrone, 1962; Krebs,
1970). However, reports of anticancer activity of cyanide and cyanogenic glycosides have
been difficult to substantiate and have been refuted in a number of investigations
(Laster and Schnabel, 1975; Hill et al., 1976; Lewis, 1977). No thorough long-term
investigations into the carcinogenic or anticarcinogenic activity of cyanide were found in
the literature.
GENETIC TOXICITY
Investigations of the genetic toxicity of cyanide have yielded conflicting results, but overall,
cyanide does not appear to have significant mutagenic activity. Sodium cyanide was not
mutagenic in any of several strains of Salmonella typhimurium with or without S9 activation
(Kleinhofs and Smith, 1976; Rietveld et al., 1983; Owais et al., 1985), and it did not induce
DNA-strand breaks in cultured mouse lymphoma cells (Garberg et al., 1988). Potassium
cyanide was not mutagenic in five strains of S. typhimurium with or without S9 at any dose
level tested (DeFlora, 1981). Conversely, hydrogen cyanide was reported to induce
mutations in S. typhimurium strain TA100 in the absence of S9 activation (Kushi et al.,
1983).
Study Rationale and Design Cyanide is frequently found in chemical waste sites, and exposure of humans to cyanide
can take place through a variety of routes, including consumption of contaminated water
and foodstuffs, consumption of food containing cyanogenic glycosides, exposure to pesticide
sprays containing cyanide, and occupational exposure. The National Institute of
Environmental Health Sciences (NIEHS) selected cyanide for study from a preliminary list of
chemicals compiled by the USEPA under the Comprehensive Environmental Response,
Compensation, and Liability Act (Superfund) because the toxicologic data available in the
literature were considered by the USEPA to be inadequate for the calculation of an
acceptable intake level for subchronic exposure. Toxicity testing was undertaken by the
NIEHS to provide data for calculation of an acceptable daily intake level with regard to
groundwater contamination around dump sites. Sodium cyanide was selected as the form
of cyanide to be studied because it is relatively stable in water, the chosen exposure route.
Thirteen-week drinking water studies of sodium cyanide were performed with male and
female F344/N rats and B6C3F1 mice. Gross and histologic examinations, sperm motility
and vaginal cytology evaluations, and hematology, clinical chemistry, and urinalysis
evaluations were performed on both species. The mutagenicity of sodium cyanide was
assessed in four strains of S. typhimurium with and without S9 activation.
MATERIALS AND METHODS
Procurement and Characterization of Sodium Cyanide Sodium cyanide was obtained in one lot (Lot01410ML) from Aldrich Chemical Company
(Milwaukee, WI). Initial identity and purity analyses were performed by Midwest
Research Institute (MRI, Kansas City, MO). The chemical, a white powder, was identified
as sodium cyanide by infrared and ultraviolet/visible spectroscopy; spectra were
consistent with those expected for the structure of sodium cyanide. The results of
elemental analyses for carbon, nitrogen, and sodium were slightly lower than the
theoretical values; elemental analysis also indicated 0.15% potassium. Spark source
mass spectroscopy indicated 140ppm chlorine and 160ppm phosphorus; all other
impurities detected by spark source mass spectroscopy were present at a total
concentration of less than 132ppm. Karl Fischer analysis indicated 0.4% ± 0.1% water.
Functional group titration performed by adding ammonium hydroxide and 10%
potassium iodide to samples and then titrating the samples with 0.1N silver nitrate
indicated a purity of 99.9% ± 0.9%. The cumulative data indicated an overall purity of
approximately 98%.
Because literature references indicate that sodium cyanide is stable when kept dry and
protected from exposure to acids (Merck Index, 1983), no accelerated stability studies
were performed on the bulk chemical. Throughout the 13-week studies, the bulk
chemical was stored in the dark at room temperature; reanalyses performed by the study
laboratory with functional group titration and infrared or visible spectroscopy indicated
no decomposition of the bulk chemical.
Dose Formulations Drinking water solutions were prepared by mixing sodium cyanide with charcoal-filtered,
deionized water. The pH of the premix was adjusted to slightly above 8.5 with
hydrochloric acid, and the mixture was then further diluted with deionized water to the
desired final volume and stirred. The pH was readjusted, if necessary, to 8.5 with
hydrochloric acid.
Stability studies of the drinking water solutions with and without the pH adjusted to 8.5
were performed at MRI with visible light spectroscopy at 582nm. The results indicated
that aqueous solutions of 0.03 mg/mL (30ppm) sodium cyanide were stable for at least 3-
weeks when stored in the dark at room temperature; 0.03mg/mL solutions with the pH
adjusted to 8.5 were also stable for at least 3weeks when stored in the dark at 5°C.
Aqueous solutions of 0.3mg/mL (300ppm) sodium cyanide, with or without the pH
adjusted, were stable for 3weeks when stored in the dark at room temperature. All
solutions, with or without the pH adjusted, were stable for at least 4days under animal
room conditions.
During the 13-week studies, the drinking water formulations were stored in the dark at
5°C for up to 24days (rats) or 17days (mice). The study laboratory periodically analyzed
the drinking water formulations and animal room samples by visible light spectroscopy.
All formulations used for dosing were within 10% of the theoretical concentrations
when analyzed within 2days of preparation. Water bottles were changed at least once
every 4days, and the total storage and use time for any preparation did not exceed 24-
days (rats) or 17days (mice). For the first, middle, and last mixing periods, samples of
drinking water at each dose level were taken from the animal room water bottles on the
last day of use and analyzed for sodium cyanide. Five of 15animal room samples for rats
and 11 of 15animal room samples for mice were more than 10% lower than the
theoretical concentrations. The loss of sodium cyanide from preparations is probably
due to volatilization, because samples were not analyzed until 4 to 7days after removal
from the animal rooms, and the samples were stored in the water bottles with sipper
tubes in place prior to analysis. Results of referee analyses performed by MRI on the
drinking water solutions were in agreement with study laboratory results.
Toxicity Study Designs 13-WEEKBASE STUDIES
Male and female F344/N rats used in these studies were obtained from Taconic
Laboratory Animals and Services (Germantown, NY); male and female B6C3F1 mice were
obtained from Simonsen Laboratories (Gilroy, CA). Rats and mice were approximately
31days old at receipt and were quarantined 11days; the animals were approximately 6-
weeks old when the studies began. Blood samples were collected from five control rats
and five sentinel mice per sex at the end of the studies. The sera were analyzed for
antibody titers to rodent viruses (Boorman etal., 1986; Rao etal., 1989a,b); all results
were negative. Additional details concerning the study design are provided in Table2.
For the 13-week studies, groups of 10 rats and 10 mice of each sex were administered 0,-
3, 10, 30, 100, or 300 ppm sodium cyanide in drinking water. The exposure levels
selected for the 13-week studies were based on the results of 2-week drinking water
studies conducted by SRI, International (1987a,b). In these studies, male and female
rats and mice exposed to sodium cyanide at concentrations greater than 300ppm had
significantly depressed weight gains. Animals exposed to 1,000ppm sodium cyanide
gained 50% to 86% less weight than the controls; animals receiving 3,000ppm actually
lost weight over the course of the studies. These weight gain depressions were due to
decreases in water consumption by animals in the 1,000 and 3,000ppm groups.
During the 13-week studies, rats were housed five per cage by sex and mice were
housed individually. NIH-07 Open Formula Diet (Zeigler Brothers, Inc., Gardners, PA) in
pellet form was available ad libitum. Animal rooms were maintained at 71° to 74°F (rats)
or 69° to 76°F (mice) and 48% to 87% (rats) or 35% to 67% (mice) relative humidity, with
12hours of fluorescent light per day and at least 10room air changes per hour.
Complete necropsies were performed on all base-study animals. The heart, right kidney,
liver, lungs, right testis, and thymus were weighed. Organs and tissues were examined
for gross lesions and fixed in 10% neutral buffered formalin. Tissues to be examined
microscopically were trimmed, embedded in paraffin, sectioned, and stained with
hematoxylin and eosin. Complete histopathologic examinations were performed on all
animals in the 0 and 300ppm groups. Tissues examined microscopically are listed in
Table2.
Upon completion of the laboratory pathologist's histologic evaluation, the slides, paraffin
blocks, and residual wet tissues were sent to the NTP Archives for inventory, slide/block
match, and wet tissue audit. The slides, individual animal data records, and pathology
tables were sent to an independent pathology laboratory where quality assessment was
performed. Results were reviewed and evaluated by the NTP. Details of these review
procedures have been described by Maronpot and Boorman (1982) and Boorman etal.
(1985).
SUPPLEMENTAL EVALUATIONS
Clinical Pathology
Clinical pathology evaluations were performed on male rats designated for clinical
pathology supplemental studies and on base-study rats and mice of each sex after 13-
weeks of exposure. Ten animals per exposure group were evaluated. Blood for
hematology and clinical chemistry evaluations was collected from supplemental clinical
pathology study rats on Days5, 25, 45, and 92; blood was collected from base-study rats
on Days86 (males) and 93 (females). Urinalysis samples were collected from
supplemental study rats on Days 8, 22, 43, and 88. For mice, blood for hematology and
clinical chemistry evaluations was collected from base-study animals on Days89 (males)
and 93 (females). For the hematology and clinical chemistry evaluations, animals were
anesthetized with CO2, and blood samples were drawn from the retroorbital sinus.
Samples for hematology analysis were placed in tubes containing EDTA; samples for
clinical chemistry evaluations were placed in similar tubes devoid of anticoagulant. The
latter samples were allowed to clot at room temperature; the samples were then
centrifuged and serum was removed.
Hematologic determinations were made on an Ortho ELT-8 hematology analyzer (Ortho
Instruments, Westwood, MA). The parameters that were evaluated are listed in Table2.
Differential leukocyte counts and morphologic evaluation of blood cells were determined
by light microscopy of blood smears stained with a Romanowsky stain. Smears were
prepared from mixtures of methylene blue and whole blood (1:1, v:v) and were incubated
for at least 20 minutes at room temperature prior to microscopic examination for
quantitative determination of reticulocytes.
Clinical chemistry variables were measured on a Roche Cobas Fara chemistry analyzer
(Roche Diagnostic Systems, Inc., Montclair, NJ). The parameters that were evaluated
are listed in Table2. Reagents for assays of sorbitol dehydrogenase were obtained from
Sigma Chemical Company (St. Louis, MO); other reagents were obtained from the
manufacturer.
Urine samples were collected overnight from fasted rats individually housed in
metabolism cages (Hoeltge, Inc., Cincinnati, OH). Animals had free access to water
during the urine collection period. Urine collection containers were kept immersed in
ice water during sampling to minimize evaporation and suppress bacterial growth. After
volume, pH, and specific gravity were measured, sorbitol dehydrogenase and N-acetyl-β-
D-glucosaminidase were measured on a Roche Cobas Fara chemistry analyzer.
Ribonuclease and thiocyanate in frozen urine samples were measured
spectrophotometrically.
Sperm Motility and Vaginal Cytology in Rats and Mice
Vaginal cytology and sperm motility evaluations were performed on base-study rats and
mice (10animals per sex) from the 0, 30, 100, and 300ppm groups at the end of the 13-
week studies. The parameters that were evaluated are listed in Table2. Methods were
those described by Morrissey et al. (1988). Briefly, for the 12days prior to sacrifice, the
vaginal vaults of 10females of each species per dose group were moistened with saline, if
necessary, and samples of vaginal fluid and cells were spread on a glass slide, dried, and
stained. Relative numbers of leukocytes, nucleated epithelial cells, and large squamous
epithelial cells were determined and used to ascertain estrous cycle stage (i.e., diestrus,
proestrus, estrus, and metestrus).
Sperm motility was evaluated at necropsy (Dunnick etal., 1986). The left epididymis was
isolated and weighed. The tail of the epididymis (cauda epididymis) was then removed
from the epididymal body (corpus epididymis) and weighed. Test yolk (rats) or modified
Tyrode's buffer (mice) was applied to slides and a small incision was made at the distal
border of the cauda epididymis. The sperm effluxing from the incision were dispersed in
the buffer on the slides and the numbers of motile and nonmotile spermatozoa were
counted for five fields per slide.
Following completion of sperm motility estimates, each left cauda epididymis was placed
in buffered saline solution. Distal cauda were teased and the tissue was incubated in
the saline solution and then heat fixed at 65°C. Sperm density was then determined
microscopically with the aid of a hemacytometer. To quantify spermatogenesis,
testicular spermatid head count was determined by removing the tunica albuginea and
homogenizing the left testis in phosphate-buffered saline containing 10% dimethyl
sulfoxide. Homogenization-resistant spermatid nuclei were counted using a
hemacytometer.
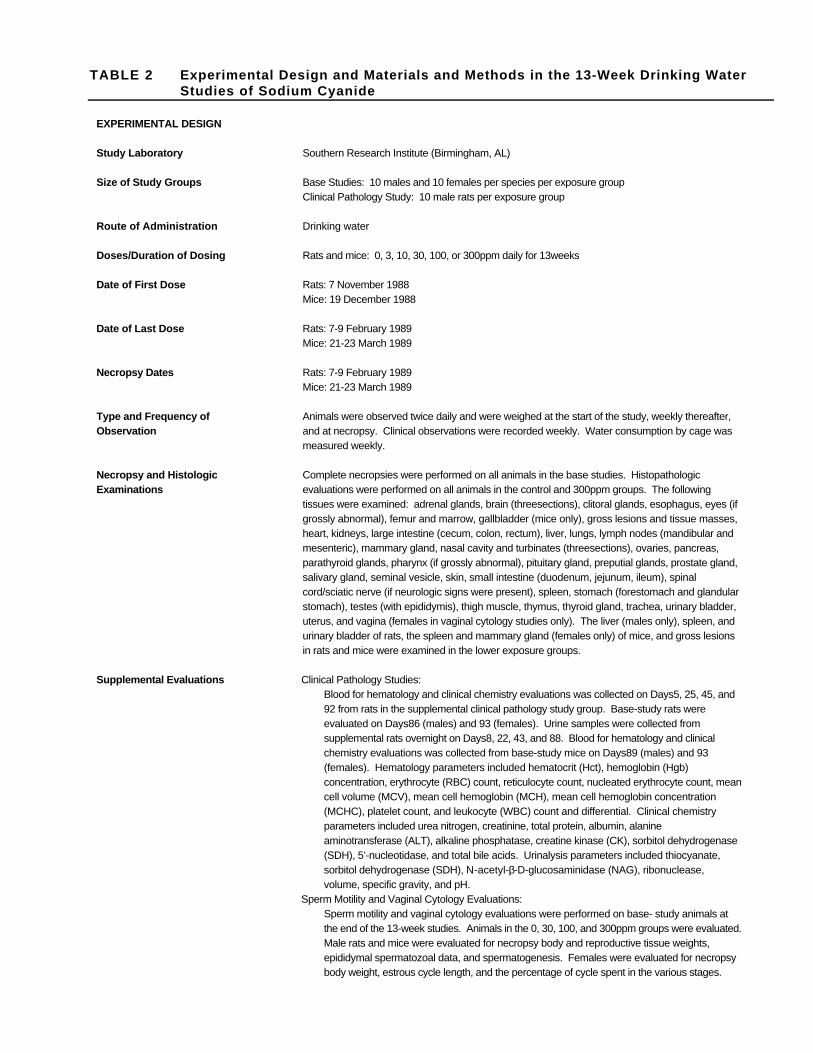
TABLE 2 Experimental Design and Materials and Methods in the 13-Week Drinking Water Studies of Sodium Cyanide
EXPERIMENTAL DESIGN
Study Laboratory Southern Research Institute (Birmingham, AL)
Size of Study Groups Base Studies: 10 males and 10 females per species per exposure group Clinical Pathology Study: 10 male rats per exposure group
Route of Administration Drinking water
Doses/Duration of Dosing Rats and mice: 0, 3, 10, 30, 100, or 300ppm daily for 13weeks
Date of First Dose Rats: 7 November 1988 Mice: 19 December 1988
Date of Last Dose Rats: 7-9 February 1989 Mice: 21-23 March 1989
Necropsy Dates Rats: 7-9 February 1989 Mice: 21-23 March 1989
Type and Frequency of Observation
Animals were observed twice daily and were weighed at the start of the study, weekly thereafter, and at necropsy. Clinical observations were recorded weekly. Water consumption by cage was measured weekly.
Necropsy and Histologic Examinations
Complete necropsies were performed on all animals in the base studies. Histopathologic evaluations were performed on all animals in the control and 300ppm groups. The following tissues were examined: adrenal glands, brain (threesections), clitoral glands, esophagus, eyes (if grossly abnormal), femur and marrow, gallbladder (mice only), gross lesions and tissue masses, heart, kidneys, large intestine (cecum, colon, rectum), liver, lungs, lymph nodes (mandibular and mesenteric), mammary gland, nasal cavity and turbinates (threesections), ovaries, pancreas, parathyroid glands, pharynx (if grossly abnormal), pituitary gland, preputial glands, prostate gland, salivary gland, seminal vesicle, skin, small intestine (duodenum, jejunum, ileum), spinal cord/sciatic nerve (if neurologic signs were present), spleen, stomach (forestomach and glandular stomach), testes (with epididymis), thigh muscle, thymus, thyroid gland, trachea, urinary bladder, uterus, and vagina (females in vaginal cytology studies only). The liver (males only), spleen, and urinary bladder of rats, the spleen and mammary gland (females only) of mice, and gross lesions in rats and mice were examined in the lower exposure groups.
Supplemental Evaluations Clinical Pathology Studies: Blood for hematology and clinical chemistry evaluations was collected on Days5, 25, 45, and 92 from rats in the supplemental clinical pathology study group. Base-study rats were evaluated on Days86 (males) and 93 (females). Urine samples were collected from supplemental rats overnight on Days8, 22, 43, and 88. Blood for hematology and clinical chemistry evaluations was collected from base-study mice on Days89 (males) and 93 (females). Hematology parameters included hematocrit (Hct), hemoglobin (Hgb) concentration, erythrocyte (RBC) count, reticulocyte count, nucleated erythrocyte count, mean cell volume (MCV), mean cell hemoglobin (MCH), mean cell hemoglobin concentration (MCHC), platelet count, and leukocyte (WBC) count and differential. Clinical chemistry parameters included urea nitrogen, creatinine, total protein, albumin, alanine aminotransferase (ALT), alkaline phosphatase, creatine kinase (CK), sorbitol dehydrogenase (SDH), 5’-nucleotidase, and total bile acids. Urinalysis parameters included thiocyanate, sorbitol dehydrogenase (SDH), N-acetyl-β-D-glucosaminidase (NAG), ribonuclease, volume, specific gravity, and pH.
Sperm Motility and Vaginal Cytology Evaluations: Sperm motility and vaginal cytology evaluations were performed on base- study animals at the end of the 13-week studies. Animals in the 0, 30, 100, and 300ppm groups were evaluated. Male rats and mice were evaluated for necropsy body and reproductive tissue weights, epididymal spermatozoal data, and spermatogenesis. Females were evaluated for necropsy body weight, estrous cycle length, and the percentage of cycle spent in the various stages.
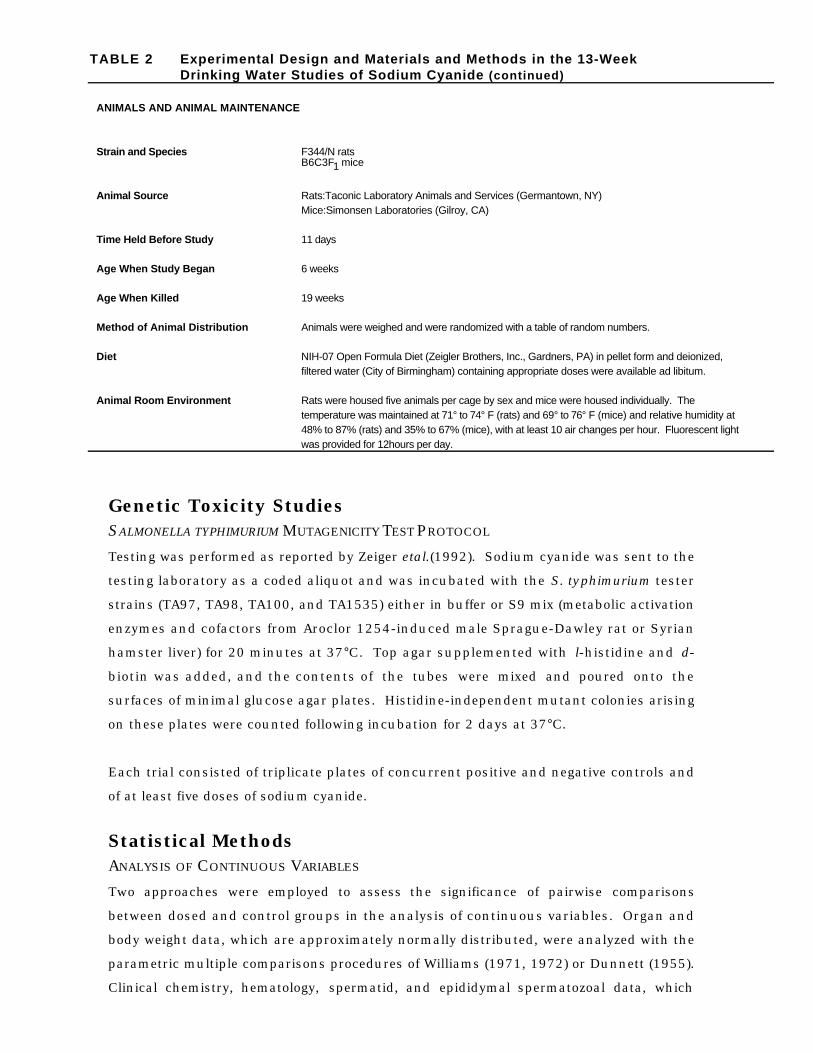
TABLE 2 Experimental Design and Materials and Methods in the 13-Week Drinking Water Studies of Sodium Cyanide (continued)
ANIMALS AND ANIMAL MAINTENANCE
Strain and Species F344/N rats B6C3F1 mice
Animal Source Rats:Taconic Laboratory Animals and Services (Germantown, NY) Mice:Simonsen Laboratories (Gilroy, CA)
Time Held Before Study 11 days
Age When Study Began 6 weeks
Age When Killed 19 weeks
Method of Animal Distribution Animals were weighed and were randomized with a table of random numbers.
Diet NIH-07 Open Formula Diet (Zeigler Brothers, Inc., Gardners, PA) in pellet form and deionized, filtered water (City of Birmingham) containing appropriate doses were available ad libitum.
Animal Room Environment Rats were housed five animals per cage by sex and mice were housed individually. The temperature was maintained at 71° to 74° F (rats) and 69° to 76° F (mice) and relative humidity at 48% to 87% (rats) and 35% to 67% (mice), with at least 10 air changes per hour. Fluorescent light was provided for 12hours per day.
Genetic Toxicity Studies SALMONELLA TYPHIMURIUM MUTAGENICITY TEST PROTOCOL
Testing was performed as reported by Zeiger etal.(1992). Sodium cyanide was sent to the
testing laboratory as a coded aliquot and was incubated with the S. typhimurium tester
strains (TA97, TA98, TA100, and TA1535) either in buffer or S9 mix (metabolic activation
enzymes and cofactors from Aroclor 1254-induced male Sprague-Dawley rat or Syrian
hamster liver) for 20 minutes at 37°C. Top agar supplemented with l-histidine and d-
biotin was added, and the contents of the tubes were mixed and poured onto the
surfaces of minimal glucose agar plates. Histidine-independent mutant colonies arising
on these plates were counted following incubation for 2 days at 37°C.
Each trial consisted of triplicate plates of concurrent positive and negative controls and
of at least five doses of sodium cyanide.
Statistical Methods ANALYSIS OF CONTINUOUS VARIABLES
Two approaches were employed to assess the significance of pairwise comparisons
between dosed and control groups in the analysis of continuous variables. Organ and
body weight data, which are approximately normally distributed, were analyzed with the
parametric multiple comparisons procedures of Williams (1971, 1972) or Dunnett (1955).
Clinical chemistry, hematology, spermatid, and epididymal spermatozoal data, which
typically have skewed distributions, were analyzed with the nonparametric multiple
comparisons methods of Shirley (1977) or Dunn (1964). Jonckheere's test (Jonckheere,
1954) was used to assess the significance of dose-response trends and to determine
whether a trend-sensitive test (Williams, Shirley) was more appropriate for pairwise
comparisons than a test capable of detecting departures from monotonic dose response
(Dunnett, Dunn). If the P-value from Jonckheere's test was greater than or equal to
0.10, Dunn's or Dunnett's test was used rather than Shirley's or Williams' test.
The outlier test of Dixon and Massey (1951) was employed to detect extreme values. No
value selected by the outlier test was eliminated unless it was at least twice the next
largest value or at most half of the next smallest value. The extreme values chosen by
the statistical test were subject to approval by NTP personnel. In addition, values
indicated by the laboratory report as being inadequate due to technical problems were
eliminated from the analysis.
ANALYSIS OF VAGINAL CYTOLOGY DATA
Because the data are proportions (the proportion of the observation period that an
animal was in a given estrous stage), an arcsine transformation was used to bring the
data into closer conformance with normality assumptions. Treatment effects were
investigated by applying a multivariate analysis of variance (Morrison, 1976) to the
transformed data to test for simultaneous equality of measurements across dose levels.
ANALYSIS OF MUTAGENICITY IN SALMONELLA TYPHIMURIUM
A positive response in the Salmonella typhimurium assay is defined as a reproducible,
dose-related increase in histidine-independent (revertant) colonies in any one
strain/activation combination. An equivocal response is defined as an increase in
revertants that was not dose related, not reproducible, or not of sufficient magnitude to
support a determination of mutagenicity. A negative response was obtained when no
increase in revertant colonies was observed following chemical treatment. There was no
minimum percentage or fold increase required for a chemical to be judged positive or
weakly positive.
Quality Assurance The animal studies of sodium cyanide were performed in compliance with U.S. Food and
Drug Administration Good Laboratory Practices regulations (21CFR, Part58). The Quality
Assurance Unit of Southern Research Institute performed audits and inspections of
protocols, procedures, data, and reports throughout the course of the studies.
RESULTS
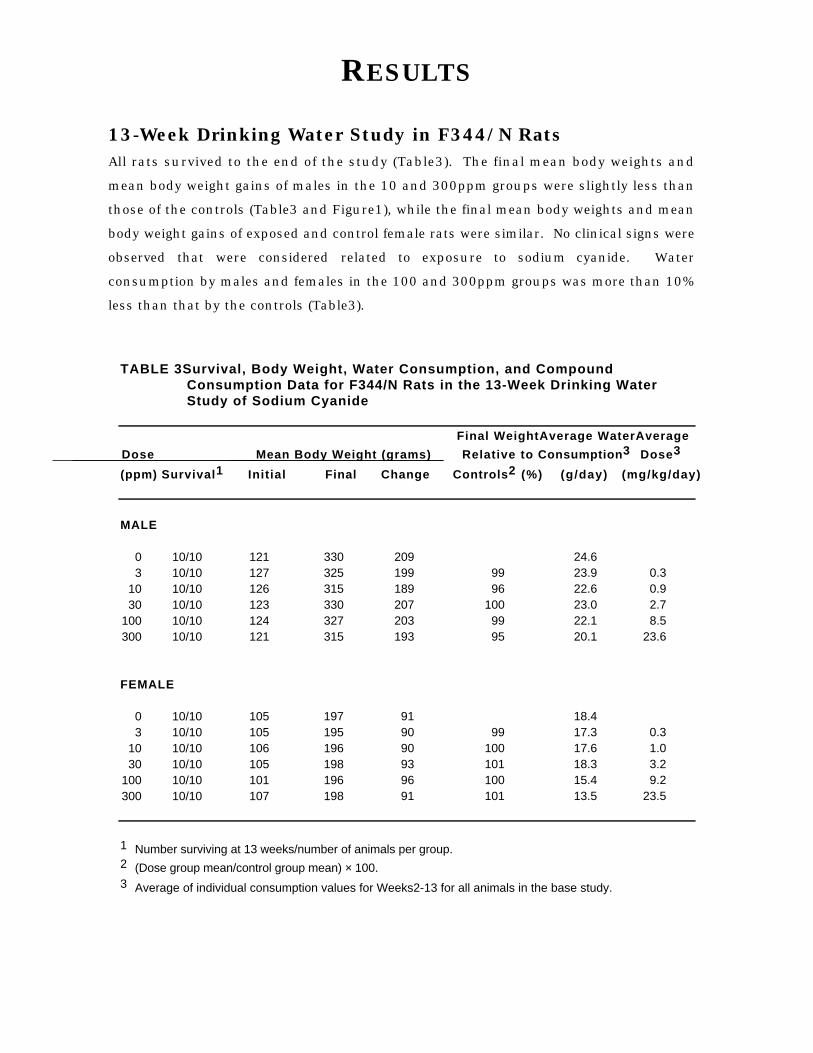
13-Week Drinking Water Study in F344/N Rats All rats survived to the end of the study (Table3). The final mean body weights and
mean body weight gains of males in the 10 and 300ppm groups were slightly less than
those of the controls (Table3 and Figure1), while the final mean body weights and mean
body weight gains of exposed and control female rats were similar. No clinical signs were
observed that were considered related to exposure to sodium cyanide. Water
consumption by males and females in the 100 and 300ppm groups was more than 10%
less than that by the controls (Table3).
TABLE 3Survival, Body Weight, Water Consumption, and Compound Consumption Data for F344/N Rats in the 13-Week Drinking Water Study of Sodium Cyanide
Dose
(ppm) Survival1 Mean Body Weight (grams)
Initial Final Change
Final WeightAverage WaterAverage
Relative to Consumption3 Dose3
Controls2 (%) (g/day) (mg/kg/day)
MALE
0 3
10 30
100 300
10/10 10/10 10/10 10/10 10/10 10/10
121 127 126 123 124 121
330 325 315 330 327 315
209 199 189 207 203 193
99 96
100 99 95
24.6 23.9 22.6 23.0 22.1 20.1
0.3 0.9 2.7 8.5
23.6
FEMALE
0 3
10 30
100 300
10/10 10/10 10/10 10/10 10/10 10/10
105 105 106 105 101 107
197 195 196 198 196 198
91 90 90 93 96 91
99 100 101 100 101
18.4 17.3 17.6 18.3 15.4 13.5
0.3 1.0 3.2 9.2
23.5
1 Number surviving at 13 weeks/number of animals per group. 2 (Dose group mean/control group mean) × 100. 3 Average of individual consumption values for Weeks2-13 for all animals in the base study.
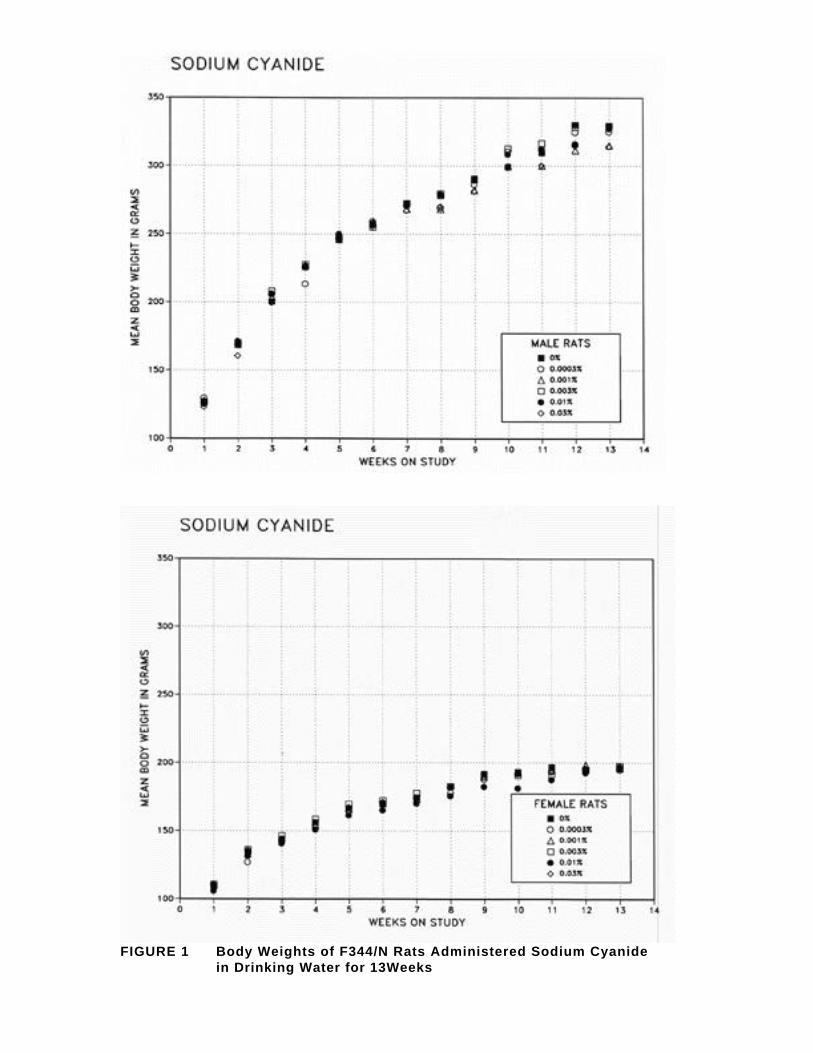
FIGURE 1 Body Weights of F344/N Rats Administered Sodium Cyanide in Drinking Water for 13Weeks
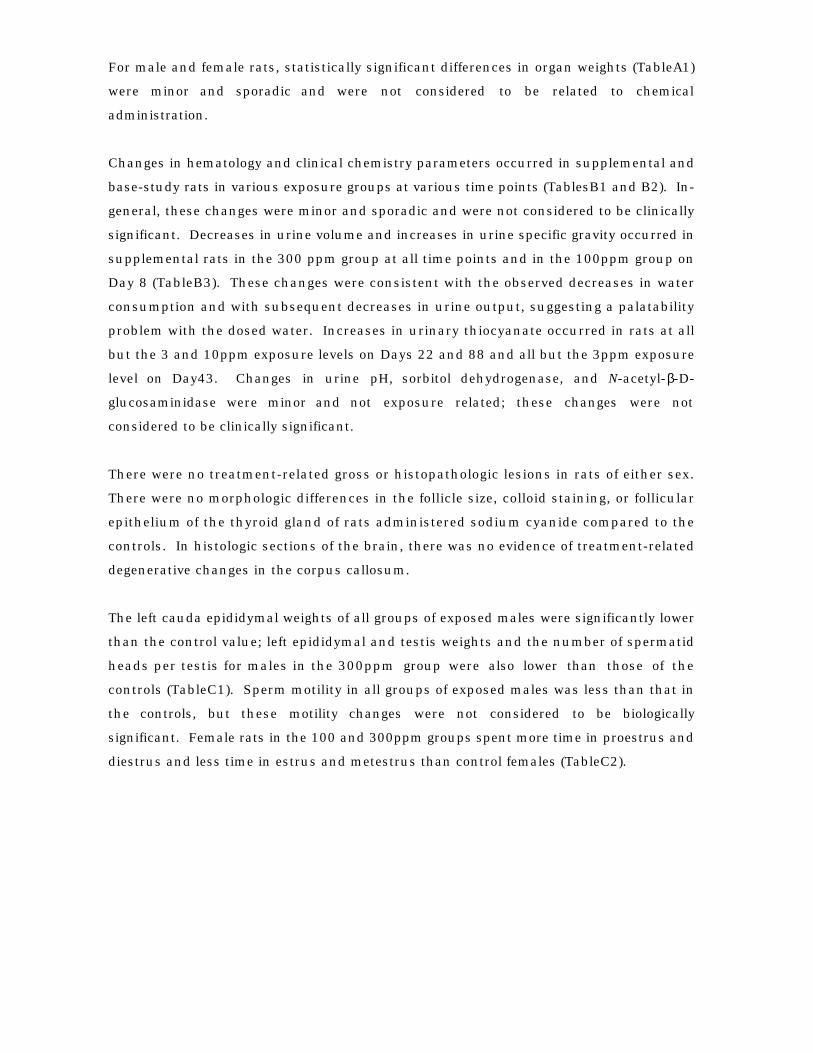
For male and female rats, statistically significant differences in organ weights (TableA1)
were minor and sporadic and were not considered to be related to chemical
administration.
Changes in hematology and clinical chemistry parameters occurred in supplemental and
base-study rats in various exposure groups at various time points (TablesB1 and B2). In-
general, these changes were minor and sporadic and were not considered to be clinically
significant. Decreases in urine volume and increases in urine specific gravity occurred in
supplemental rats in the 300 ppm group at all time points and in the 100ppm group on
Day 8 (TableB3). These changes were consistent with the observed decreases in water
consumption and with subsequent decreases in urine output, suggesting a palatability
problem with the dosed water. Increases in urinary thiocyanate occurred in rats at all
but the 3 and 10ppm exposure levels on Days 22 and 88 and all but the 3ppm exposure
level on Day43. Changes in urine pH, sorbitol dehydrogenase, and N-acetyl-β-D-
glucosaminidase were minor and not exposure related; these changes were not
considered to be clinically significant.
There were no treatment-related gross or histopathologic lesions in rats of either sex.
There were no morphologic differences in the follicle size, colloid staining, or follicular
epithelium of the thyroid gland of rats administered sodium cyanide compared to the
controls. In histologic sections of the brain, there was no evidence of treatment-related
degenerative changes in the corpus callosum.
The left cauda epididymal weights of all groups of exposed males were significantly lower
than the control value; left epididymal and testis weights and the number of spermatid
heads per testis for males in the 300ppm group were also lower than those of the
controls (TableC1). Sperm motility in all groups of exposed males was less than that in
the controls, but these motility changes were not considered to be biologically
significant. Female rats in the 100 and 300ppm groups spent more time in proestrus and
diestrus and less time in estrus and metestrus than control females (TableC2).
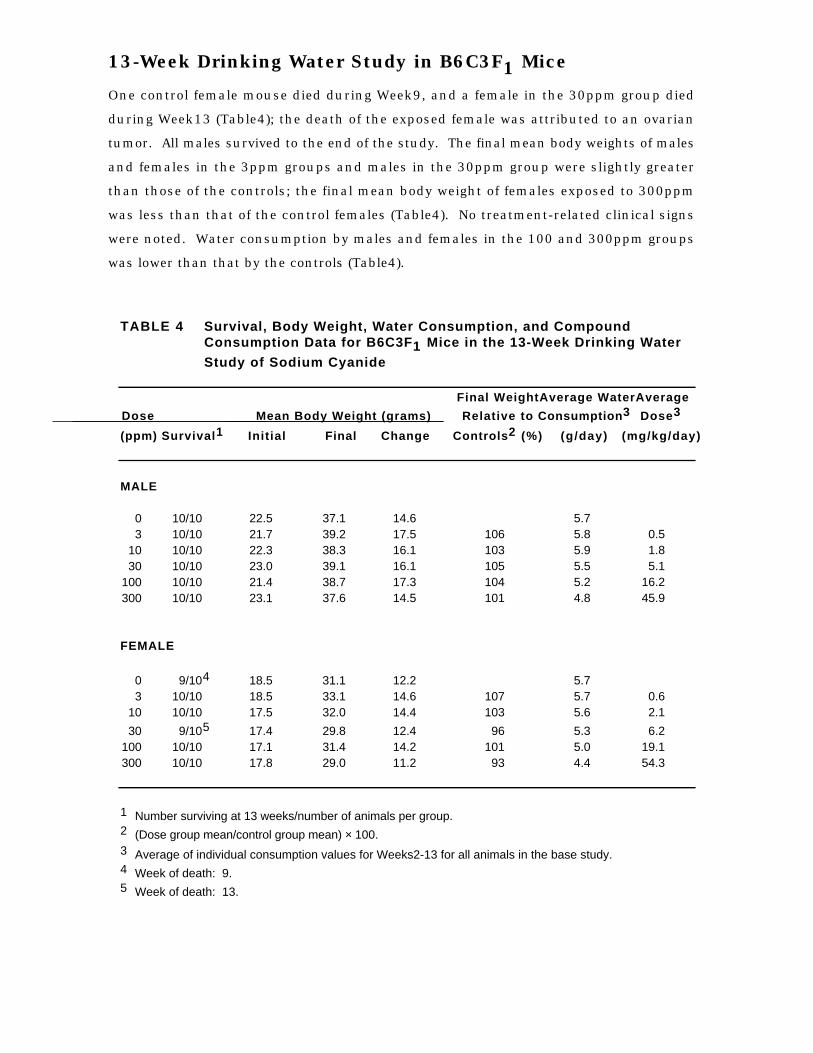
13-Week Drinking Water Study in B6C3F1 Mice
One control female mouse died during Week9, and a female in the 30ppm group died
during Week13 (Table4); the death of the exposed female was attributed to an ovarian
tumor. All males survived to the end of the study. The final mean body weights of males
and females in the 3ppm groups and males in the 30ppm group were slightly greater
than those of the controls; the final mean body weight of females exposed to 300ppm
was less than that of the control females (Table4). No treatment-related clinical signs
were noted. Water consumption by males and females in the 100 and 300ppm groups
was lower than that by the controls (Table4).
TABLE 4 Survival, Body Weight, Water Consumption, and Compound Consumption Data for B6C3F1 Mice in the 13-Week Drinking Water
Study of Sodium Cyanide
Dose
(ppm) Survival1 Mean Body Weight (grams)
Initial Final Change
Final WeightAverage WaterAverage
Relative to Consumption3 Dose3
Controls2 (%) (g/day) (mg/kg/day)
MALE
0 3
10 30
100 300
10/10 10/10 10/10 10/10 10/10 10/10
22.5 21.7 22.3 23.0 21.4 23.1
37.1 39.2 38.3 39.1 38.7 37.6
14.6 17.5 16.1 16.1 17.3 14.5
106 103 105 104 101
5.7 5.8 5.9 5.5 5.2 4.8
0.5 1.8 5.1
16.2 45.9
FEMALE
0 3
10
30 100 300
9/104
10/10 10/10
9/105
10/10 10/10
18.5 18.5 17.5
17.4 17.1 17.8
31.1 33.1 32.0
29.8 31.4 29.0
12.2 14.6 14.4
12.4 14.2 11.2
107 103
96 101 93
5.7 5.7 5.6
5.3 5.0 4.4
0.6 2.1
6.2 19.1 54.3
1 Number surviving at 13 weeks/number of animals per group. 2 (Dose group mean/control group mean) × 100. 3 Average of individual consumption values for Weeks2-13 for all animals in the base study. 4 Week of death: 9. 5 Week of death: 13.
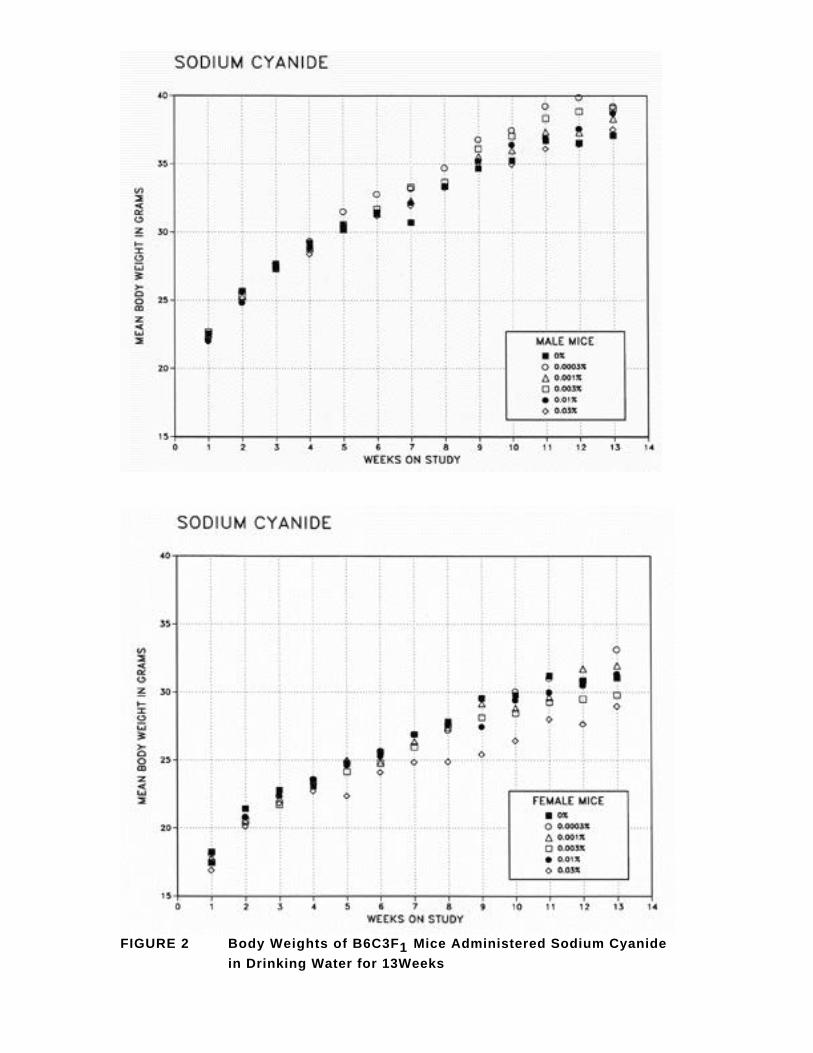
FIGURE 2 Body Weights of B6C3F1 Mice Administered Sodium Cyanide
in Drinking Water for 13Weeks
Differences in absolute and relative organ weights of male and female mice (TableA1)
were sporadic and were not considered related to cyanide toxicity.
Few hematologic or clinical chemistry changes occurred in mice (TablesB4 and B5).
These changes were minimal and were not considered to be biologically significant.
There were no treatment-related gross or histopathologic lesions in mice of either sex.
The left epididymal and cauda epididymal weights of males in the 300ppm group were
significantly less than those of the controls (TableC3). No changes in sperm motility or
spermatid head density such as those seen in male rats exposed to 300ppm sodium
cyanide occurred in male mice. No significant changes in estrous cycle length occurred
in females (TableC4).
Genetic Toxicity Studies Sodium cyanide (0.3 to 333µg/plate) was tested for mutagenicity in Salmonella
typhimurium strains TA100, TA1535, TA97, and TA98, with and without Aroclor-induced
rat and hamster S9 at concentrations of 10% and 30%; all results were negative
(AppendixD).
DISCUSSION
Previous studies with laboratory animals have demonstrated that exposure to acutely
toxic doses of cyanide can cause nerve damage and disturbances of thyroid function
(Ferraro, 1933; Hurst, 1940; Ibrahim etal., 1963; Lessell, 1971). In those animal studies,
however, the levels of cyanide necessary to produce lesions were near or within the
lethal range. The effects of subchronic administration of cyanide are less clear. In a 2-
year feed study in which rats were administered feed containing hydrogen cyanide at
concentrations up to 300ppm, there were no increases in mortality, decreases in body
weight gain, hematologic changes, or gross or histologic lesions in any tissue of any
exposure group (Howard and Hanzal, 1955). In rats administered feed containing 1,500-
ppm potassium cyanide for 11.5months, Philbrick etal. (1979) observed decreases in body
weight gain, decreases in thyroid function that were not accompanied by discernible
histologic lesions, and modest myelin degeneration in spinal cord white matter.
Philbrick and coworkers also found evidence of decreased thyroid function and
vacuolation of nervous tissue in rats fed a diet containing 2,500ppm potassium
thiocyanate for 11.5months. This concentration caused no change in body weight gain.
The studies by Philbrick etal. included only one dose level of each compound, and no
data verifying compound levels in the feed were presented; therefore, the significance of
the results is difficult to assess. Nevertheless, the literature data do indicate that
repeated exposure to doses of cyanide that are marginally toxic is capable of producing
thyroid gland and nervous system changes in rodents.
The neurologic and thyroid gland lesions attributed to subchronic poisoning by cyanide
and cyanogenic compounds in humans (Hardy etal., 1950; Wilson, 1965; Osuntokun,
1968; Osuntokun etal., 1970; El Ghawabi etal., 1975; Towill etal., 1978) are similar to
those described in experimental animals receiving repeated high doses of cyanide
(Ferraro, 1933; Hurst, 1940; Ibrahim etal., 1963; Lessell, 1971). However, few
quantitative exposure data are available in these cases of human poisoning. In studies
where disturbances of thyroid function, or goiter, were seen in humans, exposure to
cyanide vapors was described as "frequent" or "almost constant," and the thyroid gland
effects were accompanied by signs of acute cyanide poisoning, including headache,
dizziness, and difficulty in breathing. No studies describing thyroid gland effects in
humans exposed to low, nonacute toxic levels of cyanide were found in the literature.
Visual and other neurological disturbances attributed to cyanide generally occur in
individuals exposed to relatively high levels of cyanide or cyanogenic compounds (e.g.,
tropical neuropathies in persons consuming cassava as a significant percentage of the
diet; tobacco amblyopia in persons who smoke) or individuals with inborn deficiencies in
cyanide detoxification (e.g., optical neuropathy in persons with Leber's hereditary optic
atrophy). Thus, while there is strong evidence for neurotoxic and thyrotoxic effects of
cyanide in humans, these effects may represent high-dose phenomena, and the risk
from low-level chronic exposures may be less. Alternatively, although humans are
generally considered to be less sensitive than rodents to the acute effects of cyanide
intoxication (McNamara, 1976), it is possible that humans may be more sensitive to the
neurologic and thyroid gland effects.
While assessments of thyroid function (e.g., measurement of serum triiodothyronine,
thyroxine, and thyroid-stimulating hormone levels) and specific examination of optic
nerves were not performed in these NTP studies, the evaluations that were performed
(i.e., histopathologic examination of thyroid gland and brain) provided no evidence of
thyroid gland or neurologic effects. These results indicate that subchronic
administration of sodium cyanide to rats and mice at concentrations that caused no
clinical signs of toxicity or reductions in body weight gains was not thyrotoxic or
neurotoxic. Furthermore, with the exception of effects on the rat testis and epididymis,
there was no evidence of other organ-specific toxicity. These results are in agreement
with those of Howard and Hanzal (1955), who used dose levels similar to those employed
in the present studies. The concentrations used in the present studies (3 to 300ppm)
were chosen because, in earlier short-term studies, concentrations of sodium cyanide
greater than 300ppm caused marked decreases in water consumption and significant
depressions in body weight gains in both rats and mice, making administration of higher
concentrations in the drinking water unfeasible.
These sodium cyanide studies were initiated by the NIEHS to provide data for safety
assessment with regard to groundwater contamination around chemical waste disposal
sites. The lack of lesions in the rat and mouse brain in these studies suggests that
subchronic exposure to low concentrations of cyanide in drinking water does not
present a significant human health hazard. However, the data contained in this report
do not address relative species sensitivity to low-dose cyanide exposure, and future
research in this area would be helpful in assessing the risk to humans from subchronic
cyanide exposure.
Recently published studies suggest that the changes seen in reproductive endpoints in
this study are probably not secondary to body weight reductions (Chapin etal., 1993a,b).
Testicular sperm production and testis, epididymal, and cauda epididymal weights
decreased with increasing exposure concentration, with the decreases becoming
statistically significant at the highest concentration. These data suggest that
subchronic exposure to low doses of sodium cyanide may produce mild, but perhaps
significant, adverse effects on the male reproductive system. The observed differences in
sperm motility, while statistically significant, are not considered to be biologically
significant, as they represent a relatively small percentage difference from the controls
and are well within the range of normal values reported by various laboratories.
However, the reductions in cauda epididymal weight, cauda sperm count, and testicular
spermatid count are all consistent with a small but measurable adverse effect on male
rat reproduction. Based on results of previous studies, these collective reproductive
changes alone are probably insufficient to decrease fertility in rats (Chapin etal., 1985;
Gray etal., 1992); however, the interactive effects of fertilization and development were
not evaluated. In addition, the relative sensitivity of humans to such changes is
considered to be greater than that of rats (Working, 1988). Therefore, a potential for
adverse reproductive effects in humans following subchronic exposure to cyanide or
cyanogenic compounds exists.
The lack of a dose-response relationship in the differences in female reproductive
parameters suggests that these differences are spurious, and the results of this study
would need to be replicated before such changes could be unequivocally attributed to
sodium cyanide exposure. If the differences in female reproductive parameters were
found to be treatment related, it is likely that perturbations in hormonal balance would
be involved. Similarly, the male reproductive effects may have a hormonal component,
but the present data do not allow elimination of other possible mechanisms.
In summary, administration of sodium cyanide at concentrations up to 300ppm in
drinking water to rats and mice for 13 weeks resulted in no significant adverse effects on
body weights, organ weights, histopathology, or clinical pathology parameters. No
evidence of neurologic or thyroid gland damage was seen. The absorption of
administered cyanide was confirmed by increases in urinary thiocyanate excretion.
Concentrations of 100 ppm and greater resulted in decreased water consumption by rats
and mice, suggesting poor palatability. Alterations in reproductive parameters suggest
that subchronic exposure to low concentrations of sodium cyanide may produce mild but
significant adverse effects on the male reproductive system. These changes are probably
not biologically significant in rats; however, because humans are considered to be
relatively more sensitive to such reproductive changes than rats, the potential for
reproductive toxicity in humans from low concentrations of cyanide may be
underestimated by these studies. Furthermore, the epidemiologic evidence for
thyrotoxic and neurotoxic effects of cyanide after prolonged exposure in humans
suggests that a difference in species sensitivity to such effects may exist between
humans and rodents, and further research in this area is warranted.
REFERENCES
AGENCY FOR TOXIC SUBSTANCES AND DISEASE REGISTRY (ATSDR) (1988). Toxicological Profile
for Cyanide. Published for the Agency for Toxic Substances and Disease
Registry, U.S. Public Health Service, by Oak Ridge National Laboratory, Oak
Ridge, TN.
AMERICAN CONFERENCE OF GOVERNMENTAL INDUSTRIAL HYGIENISTS (ACGIH) (1991). 1991-1992
Threshold Limit Values for Chemical Substances and Physical Agents and
Biological Exposure Indices, p. 17. Cincinnati, OH.
BALLANTYNE, B. (1983). Artifacts in the definition of toxicity by cyanides and cyanogens.
Fundam. Appl. Toxicol. 3, 400-408.
BOORMAN, G. A., MONTGOMERY, C. A., JR., EUSTIS, S. L., WOLFE, M. J., MCCONNELL, E. E., AND
HARDISTY, J. F. (1985). Quality assurance in pathology for rodent carcinogenicity
studies. In Handbook of Carcinogen Testing (H. A. Milman and E. K. Weisburger,
Eds.), pp. 345-357. Noyes Publications, Park Ridge, NJ.
BOORMAN, G. A., HICKMAN, R. L., DAVIS, G. W., RHODES, L. S., WHITE, N. W., GRIFFIN, T. A.,
MAYO, J., AND HAMM, T. E., JR. (1986). Serological titers to murine viruses in 90-
day and 2-year studies. In Complications of Viral and Mycoplasmal Infections in
Rodents to Toxicology Research and Testing (T. E. Hamm, Jr., Ed.), pp. 11-23.
Hemisphere, New York.
BOXER, G. E., AND RICKARDS, J. C. (1952). Studies on the metabolism of the carbon of
cyanide and thiocyanate. Arch. Biochem. Biophys. 39, 7-26.
BROWN, W. E., WOOD, C. D., AND SMITH, A. N. (1960). Sodium cyanide as a cancer
chemotherapeutic agent. Am. J. Obstet. Gynecol. 80, 907-918.
CHAPIN, R. E., DUTTON, S. L., ROSS, M. D., AND LAMB, J. C., IV (1985). Effects of ethylene
glycol monomethyl ether (EGME) on mating performance and epididymal sperm
parameters in F344 rats. Fundam. Appl. Toxicol. 5, 182-189.
CHAPIN, R. E., GULATI, D. K., FAIL, P. A., HOPE, E., RUSSELL, S. R., HEINDEL, J. J., GEORGE,J.
D., GRIZZLE, T. B., AND TEAGUE, J. L. (1993a). The effects of feed restriction on
reproductive function in Swiss CD-1 mice. Fundam. Appl. Toxicol. 20, 15-22.
CHAPIN, R. E., GULATI, D. K., BARNES, L. H., AND TEAGUE, J. L. (1993b). The effects of feed
restriction on reproductive function in Sprague-Dawley rats. Fundam. Appl.
Toxicol. 20, 23-29.
CHEN, K. K., AND ROSE, C. L. (1952). Nitrite and thiosulfate therapy in cyanide poisoning.
J. Am. Med. Assoc. 149, 113-119.
CHISHOLM, I. A., BRONTE-STEWART, J., AND FOULDS, W. S. (1967). Hydroxocobalamin versus
cyanocobalamin in the treatment of tobacco amblyopia. Lancet 2 (August 26),
450-451.
CODE OF FEDERAL REGULATIONS (CFR) 21, Part 58. Good Laboratory Practice for Nonclinical
Laboratory Studies.
COLE, R. H., FREDERICK, R. E., HEALY, R. P., AND ROLAN, R. G. (1984). Preliminary findings of
the priority pollutant monitoring project of the Nationwide Urban Runoff
Program. J. Water Pollut. Control Fed. 56, 898-908.
COUCH, J. F. (1934). Poisoning of Livestock by Plants that Produce Hydrocyanic Acid.
United States Department of Agriculture Leaflet No. 88, pp. 2-4.
DEFLORA, S. (1981). Study of 106 organic and inorganic compounds in the
Salmonella/microsome test. Carcinogenesis 2, 283-298.
DIXON, W. J., AND MASSEY, F. J., JR. (1951). Introduction to Statistical Analysis, 1st ed.,
pp.145-147. McGraw-Hill Book Company, New York.
DOHERTY, P. A., FERM, V. H., AND SMITH, R. P. (1982). Congenital malformations induced by
infusion of sodium cyanide in the golden hamster. Toxicol. Appl. Pharmacol. 64,
456-464.
DRINKER, P. (1932). Hydrocyanic acid gas poisoning by absorption through the skin. J.
Ind. Hyg. 14, 1-2.
DUNN, O. J. (1964). Multiple comparisons using rank sums. Technometrics 6, 241-252.
DUNNICK, J. K., HARRIS, M. W., CHAPIN, R. E., HALL, L. B., AND LAMB, J. C., IV (1986).
Reproductive toxicology of methyldopa in male F344/N rats. Toxicology 41, 305-
318.
DUNNETT, C. W. (1955). A multiple comparison procedure for comparing several
treatments with a control. J. Am. Stat. Assoc. 50, 1096-1121.
EL GHAWABI, S. H., GAAFAR, M. A., EL-SAHARTI, A. A., AHMED, S. H., MALASH, K. K., AND FARES,
R. (1975). Chronic cyanide exposure: A clinical, radioisotope, and laboratory
study. Br. J. Ind. Med. 32, 215-219.
FERRARO, A. (1933). Experimental toxic encephalomyelopathy (Diffuse sclerosis following
subcutaneous injections of potassium cyanide). Psychiatr. Q. 7, 267-283.
FRIEDBERG, K. D., AND SCHWARZKOPF, H. A. (1969). The exhalation of hydrocyanic acid in
cyanide poisoning. Arch. Toxicol. 24, 235-248.
GARBERG, P., _KERBLOM, E.-L., AND BOLCSFOLDI, G. (1988). Evaluation of a genotoxicity test
measuring DNA-strand breaks in mouse lymphoma cells by alkaline unwinding
and hydroxyapatite elution. Mutat. Res. 203, 155-176.
GETTLER, A. O., AND BAINE, J. O. (1938). The toxicology of cyanide. Am. J. Med. Sci. 195,
182-198.
GRAY, L. E., JR., MARSHALL, R., OSTBY, J., AND SETZER, R. W. (1992). Correlation of
ejaculated sperm numbers with fertility in the rat. The Toxicologist 12, 433.
HARDY, H. L., JEFFRIES, W. M., WASSERMAN, M. M., AND WADDELL, W. R. (1950). Thiocyanate
effect following industrial cyanide exposure. N. Engl. J. Med. 242, 968-972.
HARTUNG, R. (1982). Cyanides and nitriles. In Patty's Industrial Hygiene, 3rd ed. (G. D.
Clayton and F. E. Clayton, Eds.), pp. 4845-4900. John Wiley & Sons, Inc., New
York.
HILL, G. J., SHINE, T. E., HILL, H. Z., AND MILLER, C. (1976). Failure of amygdalin to arrest
B16 melanoma and BW5147. AKR Leuk. Cancer Res. 36, 2102-2107.
HOWARD, J. W., AND HANZAL, R. F. (1955). Chronic toxicity for rats of food treated with
hydrogen cyanide. J. Agric. Food Chem. 3, 325-329.
HURST, E. W. (1940). Experimental demyelination of the central nervous system. 1.The
encephalopathy produced by potassium cyanide. Aust. J. Exp. Biol. Med. Sci.
18, 201-223.
IBRAHIM, M. Z. M., BRISCOE, P. B., JR., BAYLISS, O. B., AND ADAMS, C. W. M. (1963). The
relationship between enzyme activity and neuroglia in the prodromal and
demyelinating stages of cyanide encephalopathy in the rat. J. Neurol.
Neurosurg. Psychiatry 26, 479-486.
ISOM, G. E., AND WAY, J. L. (1976). Lethality of cyanide in the absence of inhibition of liver
cytochrome oxidase. Biochem. Pharmacol. 25, 605-608.
ISOM, G. E., LIU, D. H., AND WAY, J. L. (1975). Effect of sublethal doses of cyanide on
glucose catabolism. Biochem. Pharmacol. 24, 871-875.
JONCKHEERE, A. R. (1954). A distribution-free k-sample test against ordered alternatives.
Biometrika 41, 133-145.
KLAASSEN, C. D. (1980). Nonmetallic environmental toxicants: Air pollutants, solvents
and vapors, and pesticides. In The Pharmacological Basis of Therapeutics, 6th
ed. (A. G. Gilman, L. S. Goodman, and A. Gilman, Eds.), pp. 1651-1652.
Macmillan Publishing Company, Inc., New York.
KLEINHOFS, A., AND SMITH, J. A. (1976). Effect of excision repair on azide-induced
mutagenesis. Mutat. Res. 41, 233-240.
KREBS, E. T., JR. (1970). The nitrilosides (Vitamin B 17). Their nature, occurrence and
metabolic significance. Antineoplastics. Vitamin B-17. J. Appl. Nutr. 22, 75-86.
KUSHI, A., MATSUMOTO, T., AND YOSHIDA, D. (1983). Mutagen from the gaseous phase of
protein hydrolyzate. Agric. Biol. Med. 47, 1979-1982.
LASTER, W. R., JR., AND SCHNABEL, F. M., JR. (1975). Experimental studies of the
antitumor activity of amygdalin MF (NSC-15780) alone and in combination with
β-glucosidase (NSC-128056). Cancer Chemother. Rep. 59, 951-965.
LESSELL, S. (1971). Experimental cyanide optic neuropathy. Arch. Ophthalmol. 86, 194-
204.
LESSELL, S., AND KUWABARA, T. (1974). Fine structure of experimental cyanide optic
neuropathy. Invest. Ophthalmol. 13, 748-756.
LEWIS, J. P. (1977). Laetrile (Informed opinion). West. J. Med. 127, 55-62.
LIEBOWITZ, D., AND SCHWARTZ, H. (1948). Cyanide poisoning. Am. J. Clin. Pathol. 18, 965-
970.
MARONPOT, R. R., AND BOORMAN, G. A. (1982). Interpretation of rodent hepatocellular
proliferative alterations and hepatocellular tumors in chemical safety
assessment. Toxicol. Pathol. 10, 71-80.
MCMILLAN, D. E., AND SVOBODA, A. C., IV (1982). The role of erythrocytes in cyanide
detoxification. J. Pharmacol. Exp. Ther. 221, 37-41.
MCNAMARA, B. P. (1976). Estimates of the toxicity of hydrocyanic acid vapors in man.
Edgewood Arsenal Technical Report EB-TR-76023. Department of the Army,
Edgewood Arsenal, Aberdeen Proving Grounds, MD.
THE MERCK INDEX (1983). 10th ed. (M. Windholz, Ed.), p. 1233. Merck & Company,
Rahway, NJ.
MORRISON, D. F. (1976). Multivariate Statistical Methods, 2nd ed., pp. 170-179. McGraw-
Hill Book Company, New York.
MORRISSEY, R. E., SCHWETZ, B. A., LAMB, J. C., IV, ROSS, M. C., TEAGUE, J. L., AND MORRIS, R.
W. (1988). Evaluation of rodent sperm, vaginal cytology, and reproductive organ
weight data from National Toxicology Program thirteen-week studies. Fundam.
Appl. Toxicol. 11, 343-358.
MORRONE, J. A. (1962). Chemotherapy of inoperable cancer. Preliminary report of 10-
cases treated with laetrile. Exp. Med. Surg. 20, 299-308.
OSUNTOKUN, B. O. (1968). An ataxic neuropathy in Nigeria. A clinical, biochemical, and
electrophysiological study. Brain 91, 215-248.
OSUNTOKUN, B. O., ALADETOYINBO, A., AND ADEUJA, A. O. G. (1970). Free-cyanide levels in
tropical ataxic neuropathy. Lancet 2 (August 15), 372-373.
OWAIS, W. M., JANAKAT, S., AND HUNAITI, A. (1985). Activation of sodium cyanide to a toxic
but non-mutagenic metabolite in Salmonella typhimurium. Mutat. Res. 144,
119-125.
PERSSON, S.-Å., CASSEL, G., AND SELLSTRÖM, Å. (1985). Acute cyanide intoxication and
central transmitter systems. Fundam. Appl. Toxicol. 5, S150-S159.
PETTERSEN, J. C., AND COHEN, S. D. (1985). Antagonism of cyanide poisoning by
chlorpromazine and sodium thiosulfate. Toxicol. Appl. Pharmacol. 81, 265-273.
PHILBRICK, D. J., HOPKINS, J. B., HILL, D. C, ALEXANDER, J. C., AND THOMSON, R. G. (1979).
Effects of prolonged cyanide and thiocyanate feeding in rats. J. Toxicol. Environ.
Health 5, 579-592.
POTTER, A. L. (1950). The successful treatment of two recent cases of cyanide poisoning.
Br. J. Ind. Med. 7, 125-130.
RAO, G. N., HASEMAN, J. K., AND EDMONDSON, J. (1989a). Influence of viral infections on
body weight, survival, and tumor prevalence in Fischer 344/NCr rats on two-
year studies. Lab. Anim. Sci. 39, 389-393.
RAO, G. N., PIEGORSCH, W. W., CRAWFORD, D. D., EDMONDSON, J., AND HASEMAN, J. K. (1989b).
Influence of viral infections on body weight, survival, and tumor prevalence of
B6C3F1 (C57BL/6N _ C3H/Hen) mice in carcinogenicity studies. Fundam. Appl.
Toxicol. 13, 156-164.
RIETVELD, E. C., DELBRESSINE, L. P. C., WAEGEMAEKERS, T. H. J. M., AND SEUTTER-BERLAGE,
F. (1983). 2-Chlorobenzylmercapturic acid, a metabolite of the riot control
agent 2-chlorobenzylidene malononitrile (CS) in the rat. Arch. Toxicol. 54, 139-
144.
RUTKOWSKI, J. V., ROEBUCK, B. D., AND SMITH, R. P. (1986). Liver damage does not increase
the sensitivity of mice to cyanide given acutely. Toxicology 38, 305-314.
SAX, N. I. (1984). Dangerous Properties of Industrial Materials, 6th ed., p. 2421. Van
Nostrand Reinhold, New York.
SHIRLEY, E. (1977). A non-parametric equivalent of Williams' test for contrasting
increasing dose levels of a treatment. Biometrics 33, 386-389.
SITTIG, M. (1991). Handbook of Toxic and Hazardous Chemicals and Carcinogens, 3rd ed.,
pp. 272-274. Noyes Publication, Park Ridge, NJ.
SMYTH, H. F., JR., WEIL, C. S., WEST, J. S., AND CARPENTER, C. P. (1969). An exploration of
joint toxic action: Twenty-seven industrial chemicals intubated in rats in all
possible pairs. Toxicol. Appl. Pharmacol. 14, 340-347.
SOLOMONSON, L. P. (1982). Cyanide as a metabolic inhibitor. In Cyanide in Biology (B.
Vennesland, E. E. Conn, C. J. Knowles, J. Westley, and F. Wissing, Eds.), pp.11-
28. Academic Press, New York.
SRI, INTERNATIONAL (1987a). 14-Day Repeated Exposure Toxicology Investigation of
Sodium Cyanide Administered to Male and Female F-344 Rats in Drinking
Water. Unpublished report prepared for the National Toxicology Program,
National Institute of Environmental Health Sciences, Research Triangle Park,
NC 27709.
SRI, INTERNATIONAL (1987b). 14-Day Repeated Exposure Toxicology Investigation of
Sodium Cyanide Administered to Male and Female B6C3F1 Mice in Drinking
Water. Unpublished report prepared for the National Toxicology Program,
National Institute of Environmental Health Sciences, Research Triangle Park,
NC 27709.
STONE, J. E., WOOD, C. D., AND SMITH, A. M. (1959). Chemotherapy of Ehrlich's ascites
tumor with cyanide and ether combinations. Proc. Soc. Exp. Biol. Med. 101,
367-369.
TEWE, O. O., AND MANER, J. H. (1981a). Long-term and carry-over effect of dietary
inorganic cyanide (KCN) in the life cycle performance and metabolism of rats.
Toxicol. Appl. Pharmacol. 58, 1-7.
TEWE, O. O., AND MANER, J. H. (1981b). Performance and pathophysiological changes in
pregnant pigs fed cassava diets containing different levels of cyanide. Res. Vet.
Sci. 30, 147-151.
TOWILL, L. E., DRURY, J. S., WHITFIELD, B. L., LEWIS, E. B., GALYAN, E. L., AND HAMMONS, A. S.
(1978). Review of the environmental effects of pollutants: V.Cyanide.
Document prepared for the Health Effects Research Laboratory, United States
Environmental Protection Agency, Cincinnati, OH.
UNITED STATES ENVIRONMENTAL PROTECTION AGENCY (USEPA) (1974). Disposal of Hazardous
Wastes. Publication No. SW-115. U.S. Government Printing Office,
Washington, DC.
UNITED STATES ENVIRONMENTAL PROTECTION AGENCY (USEPA) (1975). Hazardous Waste
Disposal Damage Reports. Report No. EPA/530/SW-151, pp. 3-5. U.S.
Government Printing Office, Washington, DC.
WAY, J. L. (1982). Pharmacologic aspects of cyanide and its antagonism. In Cyanide in
Biology (B. Vennesland, E. E. Conn, C. J. Knowles, J. Westley, and F. Wissing,
Eds.), pp. 29-49. Academic Press, New York.
WESTLEY, J., ADLER, H., WESTLEY, L., AND NISHIDA, C. (1983). The sulfurtransferases.
Fundam. Appl. Toxicol. 3, 377-382.
WILLIAMS, D. A. (1971). A test for differences between treatment means when several
dose levels are compared with a zero dose control. Biometrics 27, 103-117.
WILLIAMS, D. A. (1972). A comparison of several dose levels with a zero dose control.
Biometrics 28, 519-531.
WILSON, J. (1965). Leber's hereditary optic atrophy: A possible defect of cyanide
metabolism. Clin. Sci. 29, 505-515.
WOOD, J. L., AND COOLEY, S. L. (1956). Detoxication of cyanide by cystine. J. Biol. Chem.
218, 449-457.
WORKING, P. K. (1988). Male reproductive toxicology: Comparison of the human to
animal models. Environ. Health Perspect. 77, 37-44.
YAMAMOTO, K., YAMAMOTO, Y., HATTORI, H., AND SAMORI, T. (1982). Effects of route of
administration on the cyanide concentration distribution in the various organs
of cyanide-intoxicated rats. Tohoku J. Exp. Med. 137, 73-78.
ZEIGER, E., ANDERSON, B., HAWORTH, S., LAWLOR, T., AND MORTELMANS, K. (1992).
Salmonella mutagenicity tests: V.Results from the testing of 311 chemicals.
Environ. Mol. Mutagen. 19 (Suppl. 21), 2-141.
APPENDIX A
Organ Weights and Organ-Weight-to-Body-Weight Ratios
Table A1
Table A2
Organ Weights and Organ-Weight-to-Body-Weight Ratios for F344/N Rats in the 13-Week Drinking Water Study of Sodium Cyanide
Organ Weights and Organ-Weight-to-Body-Weight Ratios for B6C3F1 Mice
in the 13-Week Drinking Water Study of Sodium Cyanide
A-2
A-3
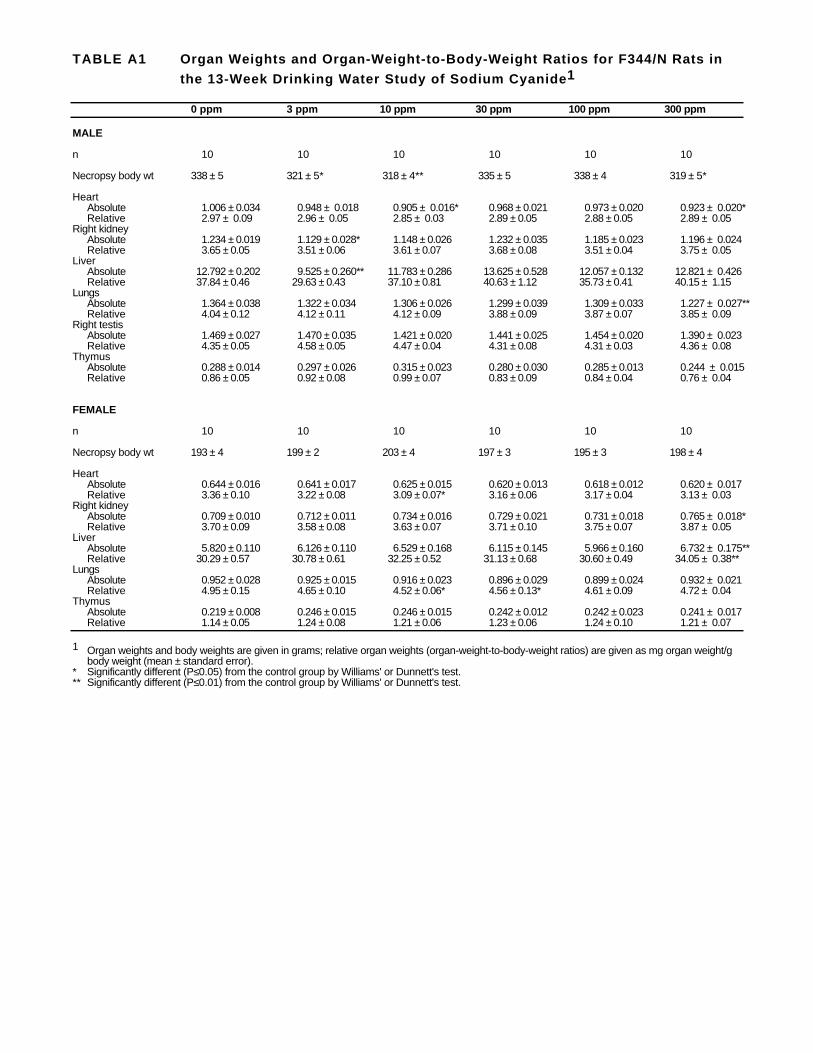
1
TABLE A1 Organ Weights and Organ-Weight-to-Body-Weight Ratios for F344/N Rats in
the 13-Week Drinking Water Study of Sodium Cyanide1
0 ppm 3 ppm 10 ppm 30 ppm 100 ppm 300 ppm
MALE
n 10 10 10 10 10 10
Necropsy body wt 338 ± 5 321 ± 5* 318 ± 4** 335 ± 5 338 ± 4 319 ± 5*
Heart Absolute 1.006 ± 0.034 0.948 ± 0.018 0.905 ± 0.016* 0.968 ± 0.021 0.973 ± 0.020 0.923 ± 0.020* Relative 2.97 ± 0.09 2.96 ± 0.05 2.85 ± 0.03 2.89 ± 0.05 2.88 ± 0.05 2.89 ± 0.05
Right kidney Absolute 1.234 ± 0.019 1.129 ± 0.028* 1.148 ± 0.026 1.232 ± 0.035 1.185 ± 0.023 1.196 ± 0.024 Relative 3.65 ± 0.05 3.51 ± 0.06 3.61 ± 0.07 3.68 ± 0.08 3.51 ± 0.04 3.75 ± 0.05
Liver Absolute 12.792 ± 0.202 9.525 ± 0.260** 11.783 ± 0.286 13.625 ± 0.528 12.057 ± 0.132 12.821 ± 0.426 Relative 37.84 ± 0.46 29.63 ± 0.43 37.10 ± 0.81 40.63 ± 1.12 35.73 ± 0.41 40.15 ± 1.15
Lungs Absolute 1.364 ± 0.038 1.322 ± 0.034 1.306 ± 0.026 1.299 ± 0.039 1.309 ± 0.033 1.227 ± 0.027** Relative 4.04 ± 0.12 4.12 ± 0.11 4.12 ± 0.09 3.88 ± 0.09 3.87 ± 0.07 3.85 ± 0.09
Right testis Absolute 1.469 ± 0.027 1.470 ± 0.035 1.421 ± 0.020 1.441 ± 0.025 1.454 ± 0.020 1.390 ± 0.023 Relative 4.35 ± 0.05 4.58 ± 0.05 4.47 ± 0.04 4.31 ± 0.08 4.31 ± 0.03 4.36 ± 0.08
Thymus Absolute 0.288 ± 0.014 0.297 ± 0.026 0.315 ± 0.023 0.280 ± 0.030 0.285 ± 0.013 0.244 ± 0.015 Relative 0.86 ± 0.05 0.92 ± 0.08 0.99 ± 0.07 0.83 ± 0.09 0.84 ± 0.04 0.76 ± 0.04
FEMALE
n 10 10 10 10 10 10
Necropsy body wt 193 ± 4 199 ± 2 203 ± 4 197 ± 3 195 ± 3 198 ± 4
Heart Absolute 0.644 ± 0.016 0.641 ± 0.017 0.625 ± 0.015 0.620 ± 0.013 0.618 ± 0.012 0.620 ± 0.017 Relative 3.36 ± 0.10 3.22 ± 0.08 3.09 ± 0.07* 3.16 ± 0.06 3.17 ± 0.04 3.13 ± 0.03
Right kidney Absolute 0.709 ± 0.010 0.712 ± 0.011 0.734 ± 0.016 0.729 ± 0.021 0.731 ± 0.018 0.765 ± 0.018* Relative 3.70 ± 0.09 3.58 ± 0.08 3.63 ± 0.07 3.71 ± 0.10 3.75 ± 0.07 3.87 ± 0.05
Liver Absolute 5.820 ± 0.110 6.126 ± 0.110 6.529 ± 0.168 6.115 ± 0.145 5.966 ± 0.160 6.732 ± 0.175** Relative 30.29 ± 0.57 30.78 ± 0.61 32.25 ± 0.52 31.13 ± 0.68 30.60 ± 0.49 34.05 ± 0.38**
Lungs Absolute 0.952 ± 0.028 0.925 ± 0.015 0.916 ± 0.023 0.896 ± 0.029 0.899 ± 0.024 0.932 ± 0.021 Relative 4.95 ± 0.15 4.65 ± 0.10 4.52 ± 0.06* 4.56 ± 0.13* 4.61 ± 0.09 4.72 ± 0.04
Thymus Absolute 0.219 ± 0.008 0.246 ± 0.015 0.246 ± 0.015 0.242 ± 0.012 0.242 ± 0.023 0.241 ± 0.017 Relative 1.14 ± 0.05 1.24 ± 0.08 1.21 ± 0.06 1.23 ± 0.06 1.24 ± 0.10 1.21 ± 0.07
Organ weights and body weights are given in grams; relative organ weights (organ-weight-to-body-weight ratios) are given as mg organ weight/g body weight (mean ± standard error).
* Significantly different (P≤0.05) from the control group by Williams' or Dunnett's test. ** Significantly different (P≤0.01) from the control group by Williams' or Dunnett's test.
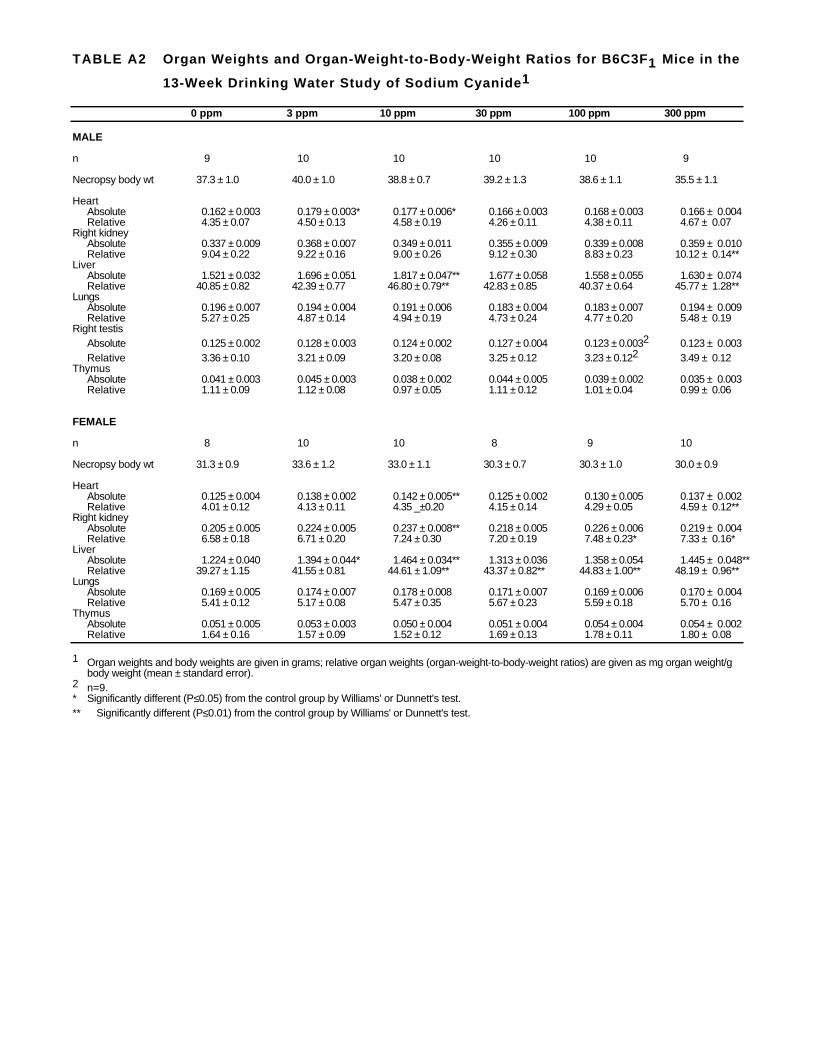
TABLE A2 Organ Weights and Organ-Weight-to-Body-Weight Ratios for B6C3F1 Mice in the
13-Week Drinking Water Study of Sodium Cyanide1
0 ppm 3 ppm 10 ppm 30 ppm 100 ppm 300 ppm
MALE
n 9 10 10 10 10 9
Necropsy body wt 37.3 ± 1.0 40.0 ± 1.0 38.8 ± 0.7 39.2 ± 1.3 38.6 ± 1.1 35.5 ± 1.1
Heart Absolute 0.162 ± 0.003 0.179 ± 0.003* 0.177 ± 0.006* 0.166 ± 0.003 0.168 ± 0.003 0.166 ± 0.004 Relative 4.35 ± 0.07 4.50 ± 0.13 4.58 ± 0.19 4.26 ± 0.11 4.38 ± 0.11 4.67 ± 0.07
Right kidney Absolute 0.337 ± 0.009 0.368 ± 0.007 0.349 ± 0.011 0.355 ± 0.009 0.339 ± 0.008 0.359 ± 0.010 Relative 9.04 ± 0.22 9.22 ± 0.16 9.00 ± 0.26 9.12 ± 0.30 8.83 ± 0.23 10.12 ± 0.14**
Liver Absolute 1.521 ± 0.032 1.696 ± 0.051 1.817 ± 0.047** 1.677 ± 0.058 1.558 ± 0.055 1.630 ± 0.074 Relative 40.85 ± 0.82 42.39 ± 0.77 46.80 ± 0.79** 42.83 ± 0.85 40.37 ± 0.64 45.77 ± 1.28**
Lungs Absolute 0.196 ± 0.007 0.194 ± 0.004 0.191 ± 0.006 0.183 ± 0.004 0.183 ± 0.007 0.194 ± 0.009 Relative 5.27 ± 0.25 4.87 ± 0.14 4.94 ± 0.19 4.73 ± 0.24 4.77 ± 0.20 5.48 ± 0.19
Right testis Absolute 0.125 ± 0.002 0.128 ± 0.003 0.124 ± 0.002 0.127 ± 0.004 0.123 ± 0.0032 0.123 ± 0.003 Relative 3.36 ± 0.10 3.21 ± 0.09 3.20 ± 0.08 3.25 ± 0.12 3.23 ± 0.122 3.49 ± 0.12
Thymus Absolute 0.041 ± 0.003 0.045 ± 0.003 0.038 ± 0.002 0.044 ± 0.005 0.039 ± 0.002 0.035 ± 0.003 Relative 1.11 ± 0.09 1.12 ± 0.08 0.97 ± 0.05 1.11 ± 0.12 1.01 ± 0.04 0.99 ± 0.06
FEMALE
n 8 10 10 8 9 10
Necropsy body wt 31.3 ± 0.9 33.6 ± 1.2 33.0 ± 1.1 30.3 ± 0.7 30.3 ± 1.0 30.0 ± 0.9
Heart Absolute 0.125 ± 0.004 0.138 ± 0.002 0.142 ± 0.005** 0.125 ± 0.002 0.130 ± 0.005 0.137 ± 0.002 Relative 4.01 ± 0.12 4.13 ± 0.11 4.35 _±0.20 4.15 ± 0.14 4.29 ± 0.05 4.59 ± 0.12**
Right kidney Absolute 0.205 ± 0.005 0.224 ± 0.005 0.237 ± 0.008** 0.218 ± 0.005 0.226 ± 0.006 0.219 ± 0.004 Relative 6.58 ± 0.18 6.71 ± 0.20 7.24 ± 0.30 7.20 ± 0.19 7.48 ± 0.23* 7.33 ± 0.16*
Liver Absolute 1.224 ± 0.040 1.394 ± 0.044* 1.464 ± 0.034** 1.313 ± 0.036 1.358 ± 0.054 1.445 ± 0.048** Relative 39.27 ± 1.15 41.55 ± 0.81 44.61 ± 1.09** 43.37 ± 0.82** 44.83 ± 1.00** 48.19 ± 0.96**
Lungs Absolute 0.169 ± 0.005 0.174 ± 0.007 0.178 ± 0.008 0.171 ± 0.007 0.169 ± 0.006 0.170 ± 0.004 Relative 5.41 ± 0.12 5.17 ± 0.08 5.47 ± 0.35 5.67 ± 0.23 5.59 ± 0.18 5.70 ± 0.16
Thymus Absolute 0.051 ± 0.005 0.053 ± 0.003 0.050 ± 0.004 0.051 ± 0.004 0.054 ± 0.004 0.054 ± 0.002 Relative 1.64 ± 0.16 1.57 ± 0.09 1.52 ± 0.12 1.69 ± 0.13 1.78 ± 0.11 1.80 ± 0.08
1 Organ weights and body weights are given in grams; relative organ weights (organ-weight-to-body-weight ratios) are given as mg organ weight/g body weight (mean ± standard error).
2 n=9. * Significantly different (P≤0.05) from the control group by Williams' or Dunnett's test. ** Significantly different (P≤0.01) from the control group by Williams' or Dunnett's test.
SODIUM CYANIDE, NTP TOXICITY REPORT NUMBER 37
APPENDIX B
Hematology, Clinical Chemistry, and Urinalysis Results
Table B1 Hematology Data for F344/N Rats in the 13-Week Drinking Water Study of Sodium Cyanide B-2
Table B2 Clinical Chemistry Data for F344/N Rats in the 13-Week Drinking Water Study of Sodium Cyanide B-5
Table B3 Urinalysis Data for Male F344/N Rats in the 13-Week Drinking Water Study of Sodium Cyanide B-7
Table B4 Hematology Data for B6C3F1 Mice in the 13-Week Drinking Water Study
of Sodium Cyanide B-8
Table B5 Clinical Chemistry Data for B6C3F1 Mice in the 13-Week Drinking Water Study
of Sodium Cyanide B-9
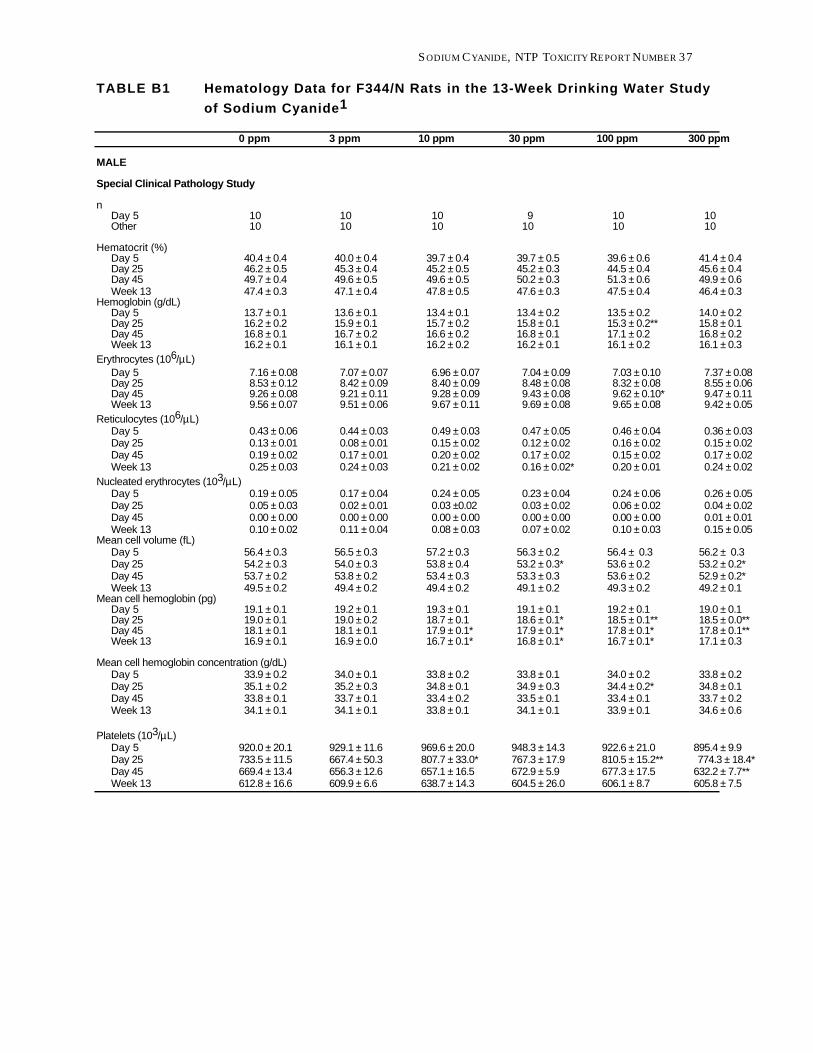
SODIUM CYANIDE, NTP TOXICITY REPORT NUMBER 37
TABLE B1 Hematology Data for F344/N Rats in the 13-Week Drinking Water Study
of Sodium Cyanide1
0 ppm 3 ppm 10 ppm 30 ppm 100 ppm 300 ppm
MALE
Special Clinical Pathology Study
n Day 5 10 10 10 9 10 10 Other 10 10 10 10 10 10
Hematocrit (%) Day 5 Day 25 Day 45
40.4 ± 0.4 46.2 ± 0.5 49.7 ± 0.4
40.0 ± 0.4 45.3 ± 0.4 49.6 ± 0.5
39.7 ± 0.4 45.2 ± 0.5 49.6 ± 0.5
39.7 ± 0.5 45.2 ± 0.3 50.2 ± 0.3
39.6 ± 0.6 44.5 ± 0.4 51.3 ± 0.6
41.4 ± 0.4 45.6 ± 0.4 49.9 ± 0.6
Week 13 47.4 ± 0.3 47.1 ± 0.4 47.8 ± 0.5 47.6 ± 0.3 47.5 ± 0.4 46.4 ± 0.3 Hemoglobin (g/dL)
Day 5 Day 25 Day 45 Week 13
13.7 ± 0.1 16.2 ± 0.2 16.8 ± 0.1 16.2 ± 0.1
13.6 ± 0.1 15.9 ± 0.1 16.7 ± 0.2 16.1 ± 0.1
13.4 ± 0.1 15.7 ± 0.2 16.6 ± 0.2 16.2 ± 0.2
13.4 ± 0.2 15.8 ± 0.1 16.8 ± 0.1 16.2 ± 0.1
13.5 ± 0.2 15.3 ± 0.2** 17.1 ± 0.2 16.1 ± 0.2
14.0 ± 0.2 15.8 ± 0.1 16.8 ± 0.2 16.1 ± 0.3
Erythrocytes (106/µL) Day 5 Day 25 Day 45 Week 13
7.16 ± 0.08 8.53 ± 0.12 9.26 ± 0.08 9.56 ± 0.07
7.07 ± 0.07 8.42 ± 0.09 9.21 ± 0.11 9.51 ± 0.06
6.96 ± 0.07 8.40 ± 0.09 9.28 ± 0.09 9.67 ± 0.11
7.04 ± 0.09 8.48 ± 0.08 9.43 ± 0.08 9.69 ± 0.08
7.03 ± 0.10 8.32 ± 0.08 9.62 ± 0.10* 9.65 ± 0.08
7.37 ± 0.08 8.55 ± 0.06 9.47 ± 0.11 9.42 ± 0.05
Reticulocytes (106/µL) Day 5 0.43 ± 0.06 0.44 ± 0.03 0.49 ± 0.03 0.47 ± 0.05 0.46 ± 0.04 0.36 ± 0.03 Day 25 0.13 ± 0.01 0.08 ± 0.01 0.15 ± 0.02 0.12 ± 0.02 0.16 ± 0.02 0.15 ± 0.02 Day 45 0.19 ± 0.02 0.17 ± 0.01 0.20 ± 0.02 0.17 ± 0.02 0.15 ± 0.02 0.17 ± 0.02 Week 13 0.25 ± 0.03 0.24 ± 0.03 0.21 ± 0.02 0.16 ± 0.02* 0.20 ± 0.01 0.24 ± 0.02
Nucleated erythrocytes (103/µL) Day 5 0.19 ± 0.05 0.17 ± 0.04 0.24 ± 0.05 0.23 ± 0.04 0.24 ± 0.06 0.26 ± 0.05 Day 25 0.05 ± 0.03 0.02 ± 0.01 0.03 ±0.02 0.03 ± 0.02 0.06 ± 0.02 0.04 ± 0.02 Day 45 0.00 ± 0.00 0.00 ± 0.00 0.00 ± 0.00 0.00 ± 0.00 0.00 ± 0.00 0.01 ± 0.01 Week 13 0.10 ± 0.02 0.11 ± 0.04 0.08 ± 0.03 0.07 ± 0.02 0.10 ± 0.03 0.15 ± 0.05
Mean cell volume (fL) Day 5 56.4 ± 0.3 56.5 ± 0.3 57.2 ± 0.3 56.3 ± 0.2 56.4 ± 0.3 56.2 ± 0.3 Day 25 54.2 ± 0.3 54.0 ± 0.3 53.8 ± 0.4 53.2 ± 0.3* 53.6 ± 0.2 53.2 ± 0.2* Day 45 53.7 ± 0.2 53.8 ± 0.2 53.4 ± 0.3 53.3 ± 0.3 53.6 ± 0.2 52.9 ± 0.2* Week 13 49.5 ± 0.2 49.4 ± 0.2 49.4 ± 0.2 49.1 ± 0.2 49.3 ± 0.2 49.2 ± 0.1
Mean cell hemoglobin (pg) Day 5 Day 25 Day 45 Week 13
19.1 ± 0.1 19.0 ± 0.1 18.1 ± 0.1 16.9 ± 0.1
19.2 ± 0.1 19.0 ± 0.2 18.1 ± 0.1 16.9 ± 0.0
19.3 ± 0.1 18.7 ± 0.1 17.9 ± 0.1* 16.7 ± 0.1*
19.1 ± 0.1 18.6 ± 0.1* 17.9 ± 0.1* 16.8 ± 0.1*
19.2 ± 0.1 18.5 ± 0.1** 17.8 ± 0.1* 16.7 ± 0.1*
19.0 ± 0.1 18.5 ± 0.0** 17.8 ± 0.1** 17.1 ± 0.3
Mean cell hemoglobin concentration (g/dL) Day 5 33.9 ± 0.2 34.0 ± 0.1 33.8 ± 0.2 33.8 ± 0.1 34.0 ± 0.2 33.8 ± 0.2 Day 25 35.1 ± 0.2 35.2 ± 0.3 34.8 ± 0.1 34.9 ± 0.3 34.4 ± 0.2* 34.8 ± 0.1 Day 45 33.8 ± 0.1 33.7 ± 0.1 33.4 ± 0.2 33.5 ± 0.1 33.4 ± 0.1 33.7 ± 0.2 Week 13 34.1 ± 0.1 34.1 ± 0.1 33.8 ± 0.1 34.1 ± 0.1 33.9 ± 0.1 34.6 ± 0.6
Platelets (103/µL) Day 5 920.0 ± 20.1 929.1 ± 11.6 969.6 ± 20.0 948.3 ± 14.3 922.6 ± 21.0 895.4 ± 9.9 Day 25 733.5 ± 11.5 667.4 ± 50.3 807.7 ± 33.0* 767.3 ± 17.9 810.5 ± 15.2** 774.3 ± 18.4* Day 45 669.4 ± 13.4 656.3 ± 12.6 657.1 ± 16.5 672.9 ± 5.9 677.3 ± 17.5 632.2 ± 7.7** Week 13 612.8 ± 16.6 609.9 ± 6.6 638.7 ± 14.3 604.5 ± 26.0 606.1 ± 8.7 605.8 ± 7.5
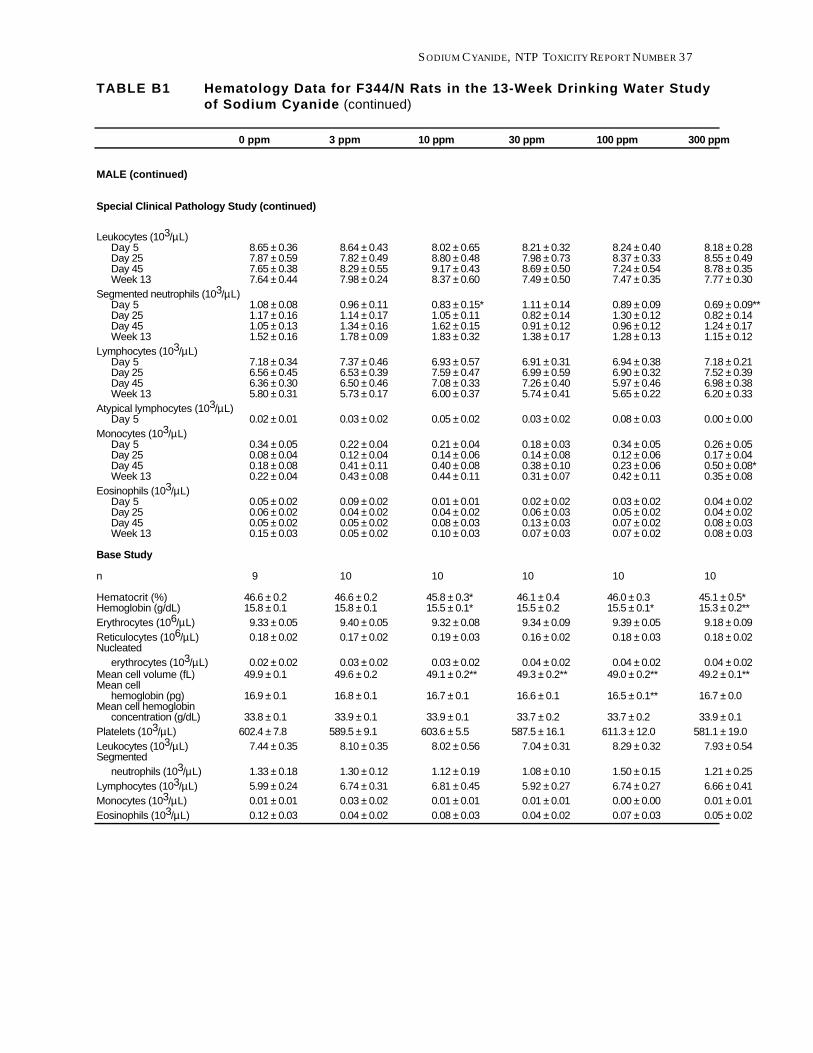
SODIUM CYANIDE, NTP TOXICITY REPORT NUMBER 37
TABLE B1 Hematology Data for F344/N Rats in the 13-Week Drinking Water Study of Sodium Cyanide (continued)
0 ppm 3 ppm 10 ppm 30 ppm 100 ppm 300 ppm
MALE (continued)
Special Clinical Pathology Study (continued)
Leukocytes (103/µL) Day 5 Day 25 Day 45 Week 13
8.65 ± 0.36 7.87 ± 0.59 7.65 ± 0.38 7.64 ± 0.44
8.64 ± 0.43 7.82 ± 0.49 8.29 ± 0.55 7.98 ± 0.24
8.02 ± 0.65 8.80 ± 0.48 9.17 ± 0.43 8.37 ± 0.60
8.21 ± 0.32 7.98 ± 0.73 8.69 ± 0.50 7.49 ± 0.50
8.24 ± 0.40 8.37 ± 0.33 7.24 ± 0.54 7.47 ± 0.35
8.18 ± 0.28 8.55 ± 0.49 8.78 ± 0.35 7.77 ± 0.30
Segmented neutrophils (103/µL) Day 5 Day 25 Day 45 Week 13
1.08 ± 0.08 1.17 ± 0.16 1.05 ± 0.13 1.52 ± 0.16
0.96 ± 0.11 1.14 ± 0.17 1.34 ± 0.16 1.78 ± 0.09
0.83 ± 0.15* 1.05 ± 0.11 1.62 ± 0.15 1.83 ± 0.32
1.11 ± 0.14 0.82 ± 0.14 0.91 ± 0.12 1.38 ± 0.17
0.89 ± 0.09 1.30 ± 0.12 0.96 ± 0.12 1.28 ± 0.13
0.69 ± 0.09** 0.82 ± 0.14 1.24 ± 0.17 1.15 ± 0.12
Lymphocytes (103/µL) Day 5 Day 25 Day 45 Week 13
7.18 ± 0.34 6.56 ± 0.45 6.36 ± 0.30 5.80 ± 0.31
7.37 ± 0.46 6.53 ± 0.39 6.50 ± 0.46 5.73 ± 0.17
6.93 ± 0.57 7.59 ± 0.47 7.08 ± 0.33 6.00 ± 0.37
6.91 ± 0.31 6.99 ± 0.59 7.26 ± 0.40 5.74 ± 0.41
6.94 ± 0.38 6.90 ± 0.32 5.97 ± 0.46 5.65 ± 0.22
7.18 ± 0.21 7.52 ± 0.39 6.98 ± 0.38 6.20 ± 0.33
Atypical lymphocytes (103/µL) Day 5 0.02 ± 0.01 0.03 ± 0.02 0.05 ± 0.02 0.03 ± 0.02 0.08 ± 0.03 0.00 ± 0.00
Monocytes (103/µL) Day 5 Day 25 Day 45 Week 13
0.34 ± 0.05 0.08 ± 0.04 0.18 ± 0.08 0.22 ± 0.04
0.22 ± 0.04 0.12 ± 0.04 0.41 ± 0.11 0.43 ± 0.08
0.21 ± 0.04 0.14 ± 0.06 0.40 ± 0.08 0.44 ± 0.11
0.18 ± 0.03 0.14 ± 0.08 0.38 ± 0.10 0.31 ± 0.07
0.34 ± 0.05 0.12 ± 0.06 0.23 ± 0.06 0.42 ± 0.11
0.26 ± 0.05 0.17 ± 0.04 0.50 ± 0.08* 0.35 ± 0.08
Eosinophils (103/µL) Day 5 Day 25 Day 45 Week 13
0.05 ± 0.02 0.06 ± 0.02 0.05 ± 0.02 0.15 ± 0.03
0.09 ± 0.02 0.04 ± 0.02 0.05 ± 0.02 0.05 ± 0.02
0.01 ± 0.01 0.04 ± 0.02 0.08 ± 0.03 0.10 ± 0.03
0.02 ± 0.02 0.06 ± 0.03 0.13 ± 0.03 0.07 ± 0.03
0.03 ± 0.02 0.05 ± 0.02 0.07 ± 0.02 0.07 ± 0.02
0.04 ± 0.02 0.04 ± 0.02 0.08 ± 0.03 0.08 ± 0.03
Base Study
n 9 10 10 10 10 10
Hematocrit (%) Hemoglobin (g/dL)
46.6 ± 0.2 15.8 ± 0.1
46.6 ± 0.2 15.8 ± 0.1
45.8 ± 0.3* 15.5 ± 0.1*
46.1 ± 0.4 15.5 ± 0.2
46.0 ± 0.3 15.5 ± 0.1*
45.1 ± 0.5* 15.3 ± 0.2**
Erythrocytes (106/µL) Reticulocytes (106/µL) Nucleated
9.33 ± 0.05 0.18 ± 0.02
9.40 ± 0.05 0.17 ± 0.02
9.32 ± 0.08 0.19 ± 0.03
9.34 ± 0.09 0.16 ± 0.02
9.39 ± 0.05 0.18 ± 0.03
9.18 ± 0.09 0.18 ± 0.02
erythrocytes (103/µL) 0.02 ± 0.02 0.03 ± 0.02 0.03 ± 0.02 0.04 ± 0.02 0.04 ± 0.02 0.04 ± 0.02 Mean cell volume (fL) 49.9 ± 0.1 49.6 ± 0.2 49.1 ± 0.2** 49.3 ± 0.2** 49.0 ± 0.2** 49.2 ± 0.1** Mean cell
hemoglobin (pg) 16.9 ± 0.1 16.8 ± 0.1 16.7 ± 0.1 16.6 ± 0.1 16.5 ± 0.1** 16.7 ± 0.0 Mean cell hemoglobin
concentration (g/dL) 33.8 ± 0.1 33.9 ± 0.1 33.9 ± 0.1 33.7 ± 0.2 33.7 ± 0.2 33.9 ± 0.1 Platelets (103/µL) Leukocytes (103/µL) Segmented
602.4 ± 7.8 7.44 ± 0.35
589.5 ± 9.1 8.10 ± 0.35
603.6 ± 5.5 8.02 ± 0.56
587.5 ± 16.1 7.04 ± 0.31
611.3 ± 12.0 8.29 ± 0.32
581.1 ± 19.0 7.93 ± 0.54
neutrophils (103/µL) Lymphocytes (103/µL) Monocytes (103/µL) Eosinophils (103/µL)
1.33 ± 0.18 5.99 ± 0.24 0.01 ± 0.01 0.12 ± 0.03
1.30 ± 0.12 6.74 ± 0.31 0.03 ± 0.02 0.04 ± 0.02
1.12 ± 0.19 6.81 ± 0.45 0.01 ± 0.01 0.08 ± 0.03
1.08 ± 0.10 5.92 ± 0.27 0.01 ± 0.01 0.04 ± 0.02
1.50 ± 0.15 6.74 ± 0.27 0.00 ± 0.00 0.07 ± 0.03
1.21 ± 0.25 6.66 ± 0.41 0.01 ± 0.01 0.05 ± 0.02
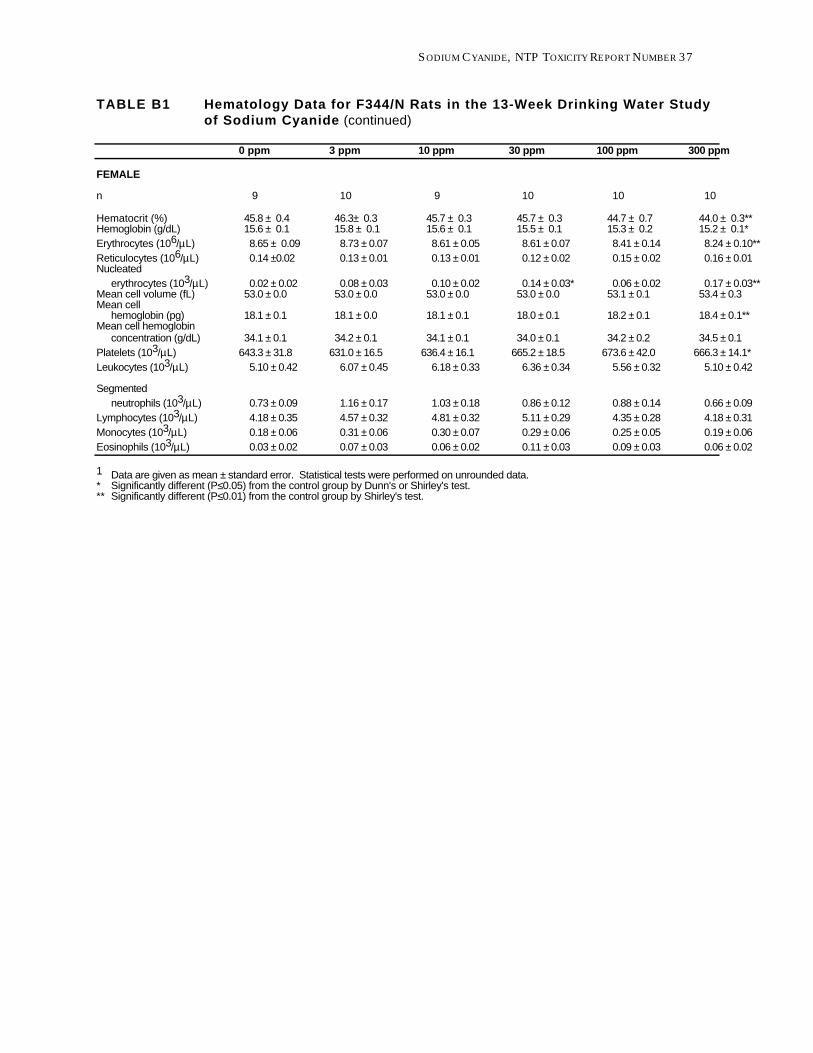
SODIUM CYANIDE, NTP TOXICITY REPORT NUMBER 37
TABLE B1 Hematology Data for F344/N Rats in the 13-Week Drinking Water Study of Sodium Cyanide (continued)
0 ppm 3 ppm 10 ppm 30 ppm 100 ppm 300 ppm
FEMALE
n 9 10 9 10 10 10
Hematocrit (%) 45.8 ± 0.4 46.3± 0.3 45.7 ± 0.3 45.7 ± 0.3 44.7 ± 0.7 44.0 ± 0.3** Hemoglobin (g/dL) 15.6 ± 0.1 15.8 ± 0.1 15.6 ± 0.1 15.5 ± 0.1 15.3 ± 0.2 15.2 ± 0.1* Erythrocytes (106/µL) 8.65 ± 0.09 8.73 ± 0.07 8.61 ± 0.05 8.61 ± 0.07 8.41 ± 0.14 8.24 ± 0.10** Reticulocytes (106/µL) 0.14 ±0.02 0.13 ± 0.01 0.13 ± 0.01 0.12 ± 0.02 0.15 ± 0.02 0.16 ± 0.01 Nucleated
erythrocytes (103/µL) 0.02 ± 0.02 0.08 ± 0.03 0.10 ± 0.02 0.14 ± 0.03* 0.06 ± 0.02 0.17 ± 0.03** Mean cell volume (fL) 53.0 ± 0.0 53.0 ± 0.0 53.0 ± 0.0 53.0 ± 0.0 53.1 ± 0.1 53.4 ± 0.3 Mean cell
hemoglobin (pg) 18.1 ± 0.1 18.1 ± 0.0 18.1 ± 0.1 18.0 ± 0.1 18.2 ± 0.1 18.4 ± 0.1** Mean cell hemoglobin
concentration (g/dL) 34.1 ± 0.1 34.2 ± 0.1 34.1 ± 0.1 34.0 ± 0.1 34.2 ± 0.2 34.5 ± 0.1 Platelets (103/µL) 643.3 ± 31.8 631.0 ± 16.5 636.4 ± 16.1 665.2 ± 18.5 673.6 ± 42.0 666.3 ± 14.1* Leukocytes (103/µL) 5.10 ± 0.42 6.07 ± 0.45 6.18 ± 0.33 6.36 ± 0.34 5.56 ± 0.32 5.10 ± 0.42
Segmented neutrophils (103/µL) 0.73 ± 0.09 1.16 ± 0.17 1.03 ± 0.18 0.86 ± 0.12 0.88 ± 0.14 0.66 ± 0.09
Lymphocytes (103/µL) 4.18 ± 0.35 4.57 ± 0.32 4.81 ± 0.32 5.11 ± 0.29 4.35 ± 0.28 4.18 ± 0.31 Monocytes (103/µL) 0.18 ± 0.06 0.31 ± 0.06 0.30 ± 0.07 0.29 ± 0.06 0.25 ± 0.05 0.19 ± 0.06 Eosinophils (103/µL) 0.03 ± 0.02 0.07 ± 0.03 0.06 ± 0.02 0.11 ± 0.03 0.09 ± 0.03 0.06 ± 0.02
1 Data are given as mean ± standard error. Statistical tests were performed on unrounded data. * Significantly different (P≤0.05) from the control group by Dunn's or Shirley's test. ** Significantly different (P≤0.01) from the control group by Shirley's test.
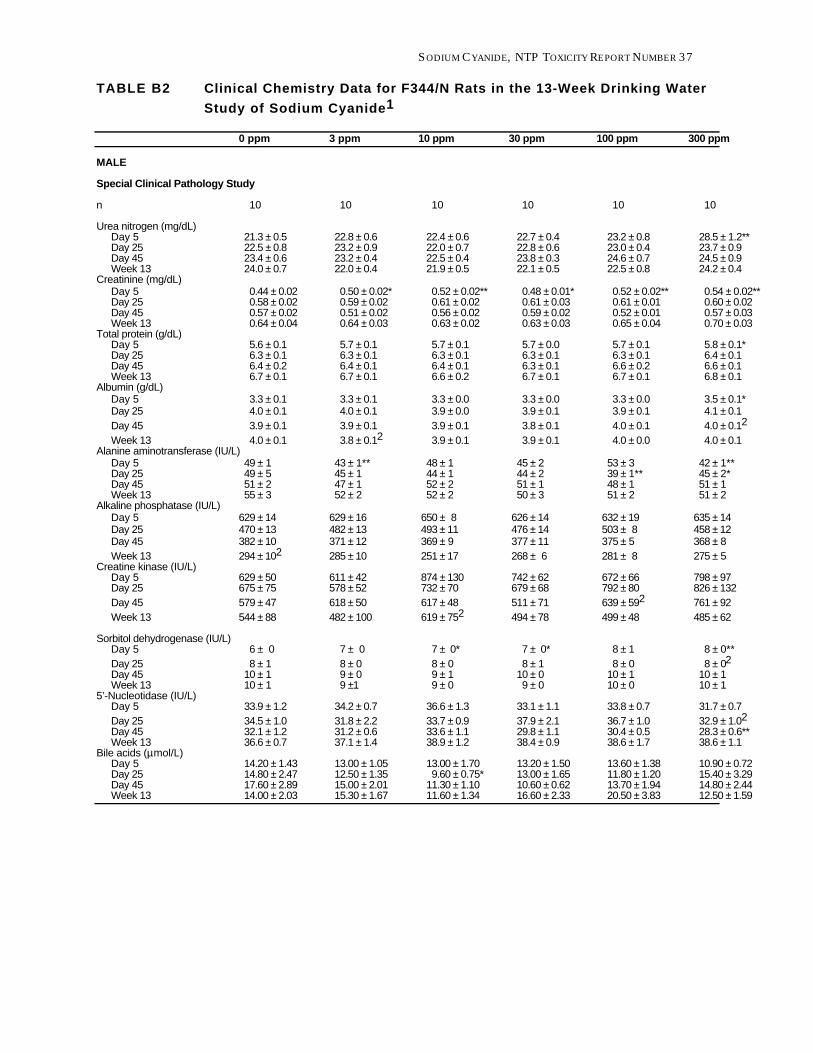
SODIUM CYANIDE, NTP TOXICITY REPORT NUMBER 37
TABLE B2 Clinical Chemistry Data for F344/N Rats in the 13-Week Drinking Water
Study of Sodium Cyanide1
0 ppm 3 ppm 10 ppm 30 ppm 100 ppm 300 ppm
MALE
Special Clinical Pathology Study
n 10 10 10 10 10 10
Urea nitrogen (mg/dL) Day 5 Day 25 Day 45 Week 13
21.3 ± 0.5 22.5 ± 0.8 23.4 ± 0.6 24.0 ± 0.7
22.8 ± 0.6 23.2 ± 0.9 23.2 ± 0.4 22.0 ± 0.4
22.4 ± 0.6 22.0 ± 0.7 22.5 ± 0.4 21.9 ± 0.5
22.7 ± 0.4 22.8 ± 0.6 23.8 ± 0.3 22.1 ± 0.5
23.2 ± 0.8 23.0 ± 0.4 24.6 ± 0.7 22.5 ± 0.8
28.5 ± 1.2** 23.7 ± 0.9 24.5 ± 0.9 24.2 ± 0.4
Creatinine (mg/dL) Day 5 Day 25 Day 45 Week 13
0.44 ± 0.02 0.58 ± 0.02 0.57 ± 0.02 0.64 ± 0.04
0.50 ± 0.02* 0.59 ± 0.02 0.51 ± 0.02 0.64 ± 0.03
0.52 ± 0.02** 0.61 ± 0.02 0.56 ± 0.02 0.63 ± 0.02
0.48 ± 0.01* 0.61 ± 0.03 0.59 ± 0.02 0.63 ± 0.03
0.52 ± 0.02** 0.61 ± 0.01 0.52 ± 0.01 0.65 ± 0.04
0.54 ± 0.02** 0.60 ± 0.02 0.57 ± 0.03 0.70 ± 0.03
Total protein (g/dL) Day 5 Day 25 Day 45 Week 13
5.6 ± 0.1 6.3 ± 0.1 6.4 ± 0.2 6.7 ± 0.1
5.7 ± 0.1 6.3 ± 0.1 6.4 ± 0.1 6.7 ± 0.1
5.7 ± 0.1 6.3 ± 0.1 6.4 ± 0.1 6.6 ± 0.2
5.7 ± 0.0 6.3 ± 0.1 6.3 ± 0.1 6.7 ± 0.1
5.7 ± 0.1 6.3 ± 0.1 6.6 ± 0.2 6.7 ± 0.1
5.8 ± 0.1* 6.4 ± 0.1 6.6 ± 0.1 6.8 ± 0.1
Albumin (g/dL) Day 5 3.3 ± 0.1 3.3 ± 0.1 3.3 ± 0.0 3.3 ± 0.0 3.3 ± 0.0 3.5 ± 0.1* Day 25 4.0 ± 0.1 4.0 ± 0.1 3.9 ± 0.0 3.9 ± 0.1 3.9 ± 0.1 4.1 ± 0.1 Day 45 3.9 ± 0.1 3.9 ± 0.1 3.9 ± 0.1 3.8 ± 0.1 4.0 ± 0.1 4.0 ± 0.12
Week 13 4.0 ± 0.1 3.8 ± 0.12 3.9 ± 0.1 3.9 ± 0.1 4.0 ± 0.0 4.0 ± 0.1 Alanine aminotransferase (IU/L)
Day 5 Day 25 Day 45 Week 13
49 ± 1 49 ± 5 51 ± 2 55 ± 3
43 ± 1** 45 ± 1 47 ± 1 52 ± 2
48 ± 1 44 ± 1 52 ± 2 52 ± 2
45 ± 2 44 ± 2 51 ± 1 50 ± 3
53 ± 3 39 ± 1** 48 ± 1 51 ± 2
42 ± 1** 45 ± 2* 51 ± 1 51 ± 2
Alkaline phosphatase (IU/L) Day 5 629 ± 14 629 ± 16 650 ± 8 626 ± 14 632 ± 19 635 ± 14 Day 25 470 ± 13 482 ± 13 493 ± 11 476 ± 14 503 ± 8 458 ± 12 Day 45 382 ± 10 371 ± 12 369 ± 9 377 ± 11 375 ± 5 368 ± 8 Week 13 294 ± 102 285 ± 10 251 ± 17 268 ± 6 281 ± 8 275 ± 5
Creatine kinase (IU/L) Day 5 Day 25
629 ± 50 675 ± 75
611 ± 42 578 ± 52
874 ± 130 732 ± 70
742 ± 62 679 ± 68
672 ± 66 792 ± 80
798 ± 97 826 ± 132
Day 45 579 ± 47 618 ± 50 617 ± 48 511 ± 71 639 ± 592 761 ± 92 Week 13 544 ± 88 482 ± 100 619 ± 752 494 ± 78 499 ± 48 485 ± 62
Sorbitol dehydrogenase (IU/L) Day 5 6 ± 0 7 ± 0 7 ± 0* 7 ± 0* 8 ± 1 8 ± 0** Day 25 Day 45 Week 13
8 ± 1 10 ± 1 10 ± 1
8 ± 0 9 ± 0 9 ±1
8 ± 0 9 ± 1 9 ± 0
8 ± 1 10 ± 0 9 ± 0
8 ± 0 10 ± 1 10 ± 0
8 ± 02 10 ± 1 10 ± 1
5’-Nucleotidase (IU/L) Day 5 33.9 ± 1.2 34.2 ± 0.7 36.6 ± 1.3 33.1 ± 1.1 33.8 ± 0.7 31.7 ± 0.7 Day 25 Day 45 Week 13
34.5 ± 1.0 32.1 ± 1.2 36.6 ± 0.7
31.8 ± 2.2 31.2 ± 0.6 37.1 ± 1.4
33.7 ± 0.9 33.6 ± 1.1 38.9 ± 1.2
37.9 ± 2.1 29.8 ± 1.1 38.4 ± 0.9
36.7 ± 1.0 30.4 ± 0.5 38.6 ± 1.7
32.9 ± 1.02 28.3 ± 0.6** 38.6 ± 1.1
Bile acids (µmol/L) Day 5 Day 25 Day 45 Week 13
14.20 ± 1.43 14.80 ± 2.47 17.60 ± 2.89 14.00 ± 2.03
13.00 ± 1.05 12.50 ± 1.35 15.00 ± 2.01 15.30 ± 1.67
13.00 ± 1.70 9.60 ± 0.75*
11.30 ± 1.10 11.60 ± 1.34
13.20 ± 1.50 13.00 ± 1.65 10.60 ± 0.62 16.60 ± 2.33
13.60 ± 1.38 11.80 ± 1.20 13.70 ± 1.94 20.50 ± 3.83
10.90 ± 0.72 15.40 ± 3.29 14.80 ± 2.44 12.50 ± 1.59
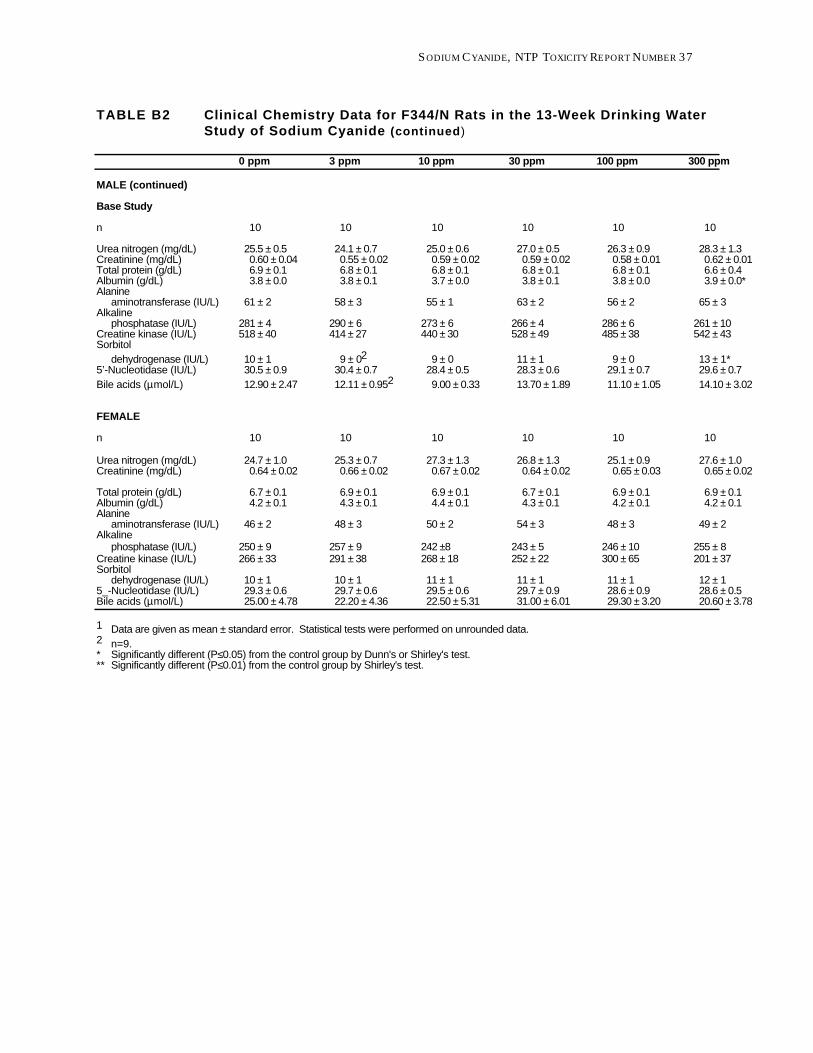
SODIUM CYANIDE, NTP TOXICITY REPORT NUMBER 37
TABLE B2 Clinical Chemistry Data for F344/N Rats in the 13-Week Drinking Water Study of Sodium Cyanide (continued)
0 ppm 3 ppm 10 ppm 30 ppm 100 ppm 300 ppm
MALE (continued)
Base Study
n 10 10 10 10 10 10
Urea nitrogen (mg/dL) 25.5 ± 0.5 24.1 ± 0.7 25.0 ± 0.6 27.0 ± 0.5 26.3 ± 0.9 28.3 ± 1.3 Creatinine (mg/dL) 0.60 ± 0.04 0.55 ± 0.02 0.59 ± 0.02 0.59 ± 0.02 0.58 ± 0.01 0.62 ± 0.01 Total protein (g/dL) 6.9 ± 0.1 6.8 ± 0.1 6.8 ± 0.1 6.8 ± 0.1 6.8 ± 0.1 6.6 ± 0.4 Albumin (g/dL) 3.8 ± 0.0 3.8 ± 0.1 3.7 ± 0.0 3.8 ± 0.1 3.8 ± 0.0 3.9 ± 0.0* Alanine
aminotransferase (IU/L) 61 ± 2 58 ± 3 55 ± 1 63 ± 2 56 ± 2 65 ± 3 Alkaline
phosphatase (IU/L) 281 ± 4 290 ± 6 273 ± 6 266 ± 4 286 ± 6 261 ± 10 Creatine kinase (IU/L) 518 ± 40 414 ± 27 440 ± 30 528 ± 49 485 ± 38 542 ± 43 Sorbitol
dehydrogenase (IU/L) 10 ± 1 9 ± 02 9 ± 0 11 ± 1 9 ± 0 13 ± 1* 5’-Nucleotidase (IU/L) 30.5 ± 0.9 30.4 ± 0.7 28.4 ± 0.5 28.3 ± 0.6 29.1 ± 0.7 29.6 ± 0.7 Bile acids (µmol/L) 12.90 ± 2.47 12.11 ± 0.952 9.00 ± 0.33 13.70 ± 1.89 11.10 ± 1.05 14.10 ± 3.02
FEMALE
n 10 10 10 10 10 10
Urea nitrogen (mg/dL) 24.7 ± 1.0 25.3 ± 0.7 27.3 ± 1.3 26.8 ± 1.3 25.1 ± 0.9 27.6 ± 1.0 Creatinine (mg/dL) 0.64 ± 0.02 0.66 ± 0.02 0.67 ± 0.02 0.64 ± 0.02 0.65 ± 0.03 0.65 ± 0.02
Total protein (g/dL) 6.7 ± 0.1 6.9 ± 0.1 6.9 ± 0.1 6.7 ± 0.1 6.9 ± 0.1 6.9 ± 0.1 Albumin (g/dL) 4.2 ± 0.1 4.3 ± 0.1 4.4 ± 0.1 4.3 ± 0.1 4.2 ± 0.1 4.2 ± 0.1 Alanine
aminotransferase (IU/L) 46 ± 2 48 ± 3 50 ± 2 54 ± 3 48 ± 3 49 ± 2 Alkaline
phosphatase (IU/L) 250 ± 9 257 ± 9 242 ±8 243 ± 5 246 ± 10 255 ± 8 Creatine kinase (IU/L) 266 ± 33 291 ± 38 268 ± 18 252 ± 22 300 ± 65 201 ± 37 Sorbitol
dehydrogenase (IU/L) 10 ± 1 10 ± 1 11 ± 1 11 ± 1 11 ± 1 12 ± 1 5_-Nucleotidase (IU/L) 29.3 ± 0.6 29.7 ± 0.6 29.5 ± 0.6 29.7 ± 0.9 28.6 ± 0.9 28.6 ± 0.5 Bile acids (µmol/L) 25.00 ± 4.78 22.20 ± 4.36 22.50 ± 5.31 31.00 ± 6.01 29.30 ± 3.20 20.60 ± 3.78
1 Data are given as mean ± standard error. Statistical tests were performed on unrounded data. 2 n=9. * Significantly different (P≤0.05) from the control group by Dunn's or Shirley's test. ** Significantly different (P≤0.01) from the control group by Shirley's test.
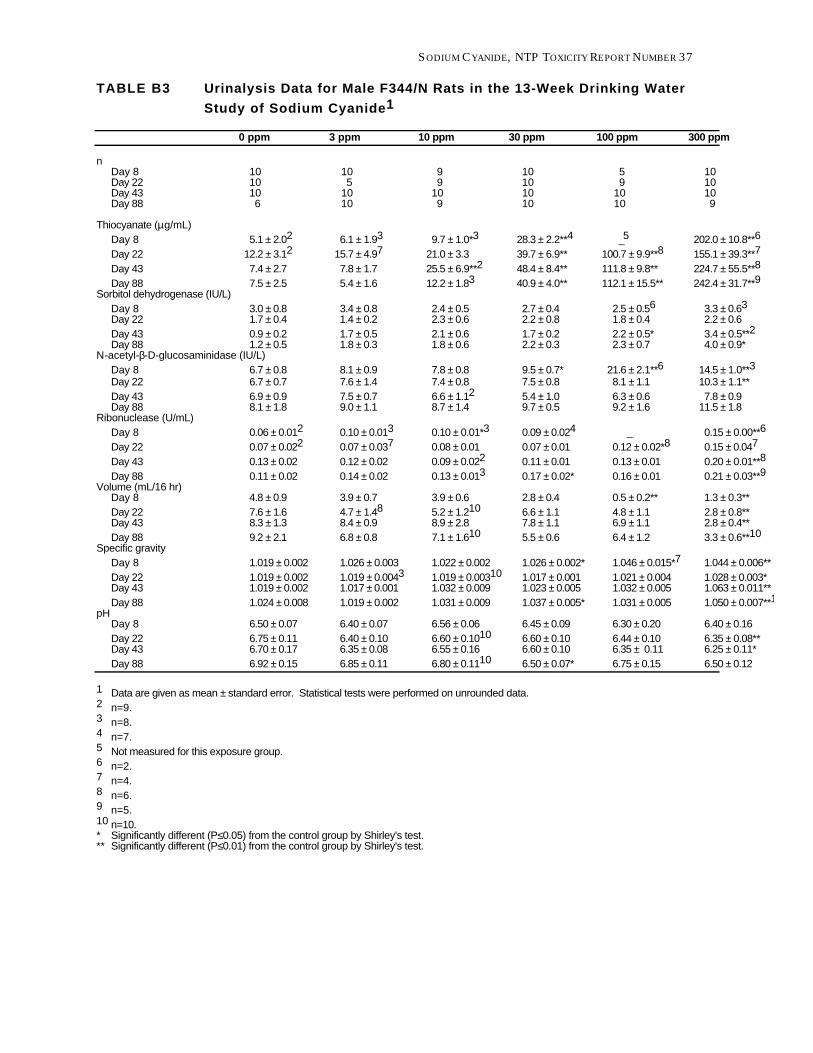
SODIUM CYANIDE, NTP TOXICITY REPORT NUMBER 37
TABLE B3 Urinalysis Data for Male F344/N Rats in the 13-Week Drinking Water
Study of Sodium Cyanide1
0 ppm 3 ppm 10 ppm 30 ppm 100 ppm 300 ppm
n Day 8 10 10 9 10 5 10 Day 22 10 5 9 10 9 10 Day 43 10 10 10 10 10 10 Day 88 6 10 9 10 10 9
Thiocyanate (µg/mL) Day 8 5.1 ± 2.02 6.1 ± 1.93 9.7 ± 1.0*3 28.3 ± 2.2**4 _ 5 202.0 ± 10.8**6
Day 22 12.2 ± 3.12 15.7 ± 4.97 21.0 ± 3.3 39.7 ± 6.9** 100.7 ± 9.9**8 155.1 ± 39.3**7
Day 43 7.4 ± 2.7 7.8 ± 1.7 25.5 ± 6.9**2 48.4 ± 8.4** 111.8 ± 9.8** 224.7 ± 55.5**8
Day 88 7.5 ± 2.5 5.4 ± 1.6 12.2 ± 1.83 40.9 ± 4.0** 112.1 ± 15.5** 242.4 ± 31.7**9 Sorbitol dehydrogenase (IU/L)
Day 8 Day 22
3.0 ± 0.8 1.7 ± 0.4
3.4 ± 0.8 1.4 ± 0.2
2.4 ± 0.5 2.3 ± 0.6
2.7 ± 0.4 2.2 ± 0.8
2.5 ± 0.56 1.8 ± 0.4
3.3 ± 0.63 2.2 ± 0.6
Day 43 0.9 ± 0.2 Day 88 1.2 ± 0.5
N-acetyl-β-D-glucosaminidase (IU/L)
1.7 ± 0.5 1.8 ± 0.3
2.1 ± 0.6 1.8 ± 0.6
1.7 ± 0.2 2.2 ± 0.3
2.2 ± 0.5* 2.3 ± 0.7
3.4 ± 0.5**2 4.0 ± 0.9*
Day 8 6.7 ± 0.8 8.1 ± 0.9 7.8 ± 0.8 9.5 ± 0.7* 21.6 ± 2.1**6 14.5 ± 1.0**3
Day 22 6.7 ± 0.7 7.6 ± 1.4 7.4 ± 0.8 7.5 ± 0.8 8.1 ± 1.1 10.3 ± 1.1** Day 43 Day 88
6.9 ± 0.9 8.1 ± 1.8
7.5 ± 0.7 9.0 ± 1.1
6.6 ± 1.12 8.7 ± 1.4
5.4 ± 1.0 9.7 ± 0.5
6.3 ± 0.6 9.2 ± 1.6
7.8 ± 0.9 11.5 ± 1.8
Ribonuclease (U/mL) Day 8 0.06 ± 0.012 0.10 ± 0.013 0.10 ± 0.01*3 0.09 ± 0.024 _ 0.15 ± 0.00**6
Day 22 0.07 ± 0.022 0.07 ± 0.037 0.08 ± 0.01 0.07 ± 0.01 0.12 ± 0.02*8 0.15 ± 0.047
Day 43 0.13 ± 0.02 0.12 ± 0.02 0.09 ± 0.022 0.11 ± 0.01 0.13 ± 0.01 0.20 ± 0.01**8
Day 88 0.11 ± 0.02 0.14 ± 0.02 0.13 ± 0.013 0.17 ± 0.02* 0.16 ± 0.01 0.21 ± 0.03**9 Volume (mL/16 hr)
Day 8 4.8 ± 0.9 3.9 ± 0.7 3.9 ± 0.6 2.8 ± 0.4 0.5 ± 0.2** 1.3 ± 0.3** Day 22 Day 43
7.6 ± 1.6 8.3 ± 1.3
4.7 ± 1.48 8.4 ± 0.9
5.2 ± 1.210 8.9 ± 2.8
6.6 ± 1.1 7.8 ± 1.1
4.8 ± 1.1 6.9 ± 1.1
2.8 ± 0.8** 2.8 ± 0.4**
Day 88 9.2 ± 2.1 6.8 ± 0.8 7.1 ± 1.610 5.5 ± 0.6 6.4 ± 1.2 3.3 ± 0.6**10 Specific gravity
Day 8 1.019 ± 0.002 1.026 ± 0.003 1.022 ± 0.002 1.026 ± 0.002* 1.046 ± 0.015*7 1.044 ± 0.006** Day 22 Day 43
1.019 ± 0.002 1.019 ± 0.002
1.019 ± 0.0043 1.017 ± 0.001
1.019 ± 0.00310 1.032 ± 0.009
1.017 ± 0.001 1.023 ± 0.005
1.021 ± 0.004 1.032 ± 0.005
1.028 ± 0.003* 1.063 ± 0.011**
Day 88 1.024 ± 0.008 1.019 ± 0.002 1.031 ± 0.009 1.037 ± 0.005* 1.031 ± 0.005 1.050 ± 0.007**10 pH
Day 8 6.50 ± 0.07 6.40 ± 0.07 6.56 ± 0.06 6.45 ± 0.09 6.30 ± 0.20 6.40 ± 0.16 Day 22 Day 43
6.75 ± 0.11 6.70 ± 0.17
6.40 ± 0.10 6.35 ± 0.08
6.60 ± 0.1010 6.55 ± 0.16
6.60 ± 0.10 6.60 ± 0.10
6.44 ± 0.10 6.35 ± 0.11
6.35 ± 0.08** 6.25 ± 0.11*
Day 88 6.92 ± 0.15 6.85 ± 0.11 6.80 ± 0.1110 6.50 ± 0.07* 6.75 ± 0.15 6.50 ± 0.12
1 Data are given as mean ± standard error. Statistical tests were performed on unrounded data. 2 n=9. 3 n=8. 4 n=7. 5 Not measured for this exposure group. 6 n=2. 7 n=4. 8 n=6. 9 n=5. 10 n=10. * Significantly different (P≤0.05) from the control group by Shirley's test. ** Significantly different (P≤0.01) from the control group by Shirley's test.
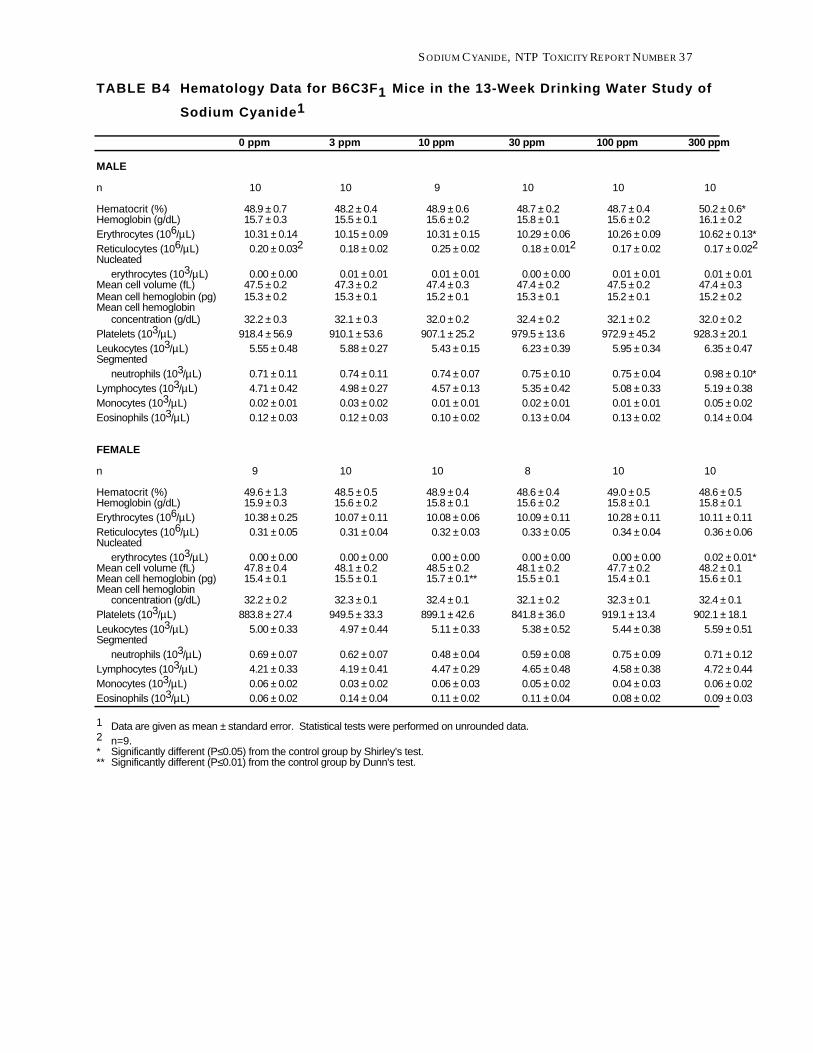
SODIUM CYANIDE, NTP TOXICITY REPORT NUMBER 37
TABLE B4 Hematology Data for B6C3F1 Mice in the 13-Week Drinking Water Study of
Sodium Cyanide1
0 ppm 3 ppm 10 ppm 30 ppm 100 ppm 300 ppm
MALE
n 10 10 9 10 10 10
Hematocrit (%) Hemoglobin (g/dL) Erythrocytes (106/µL) Reticulocytes (106/µL) Nucleated
erythrocytes (103/µL) Mean cell volume (fL) Mean cell hemoglobin (pg) Mean cell hemoglobin
concentration (g/dL) Platelets (103/µL) Leukocytes (103/µL) Segmented
neutrophils (103/µL) Lymphocytes (103/µL) Monocytes (103/µL) Eosinophils (103/µL)
48.9 ± 0.7 15.7 ± 0.3 10.31 ± 0.14 0.20 ± 0.032
0.00 ± 0.00 47.5 ± 0.2 15.3 ± 0.2
32.2 ± 0.3 918.4 ± 56.9
5.55 ± 0.48
0.71 ± 0.11 4.71 ± 0.42 0.02 ± 0.01 0.12 ± 0.03
48.2 ± 0.4 15.5 ± 0.1 10.15 ± 0.09 0.18 ± 0.02
0.01 ± 0.01 47.3 ± 0.2 15.3 ± 0.1
32.1 ± 0.3 910.1 ± 53.6
5.88 ± 0.27
0.74 ± 0.11 4.98 ± 0.27 0.03 ± 0.02 0.12 ± 0.03
48.9 ± 0.6 15.6 ± 0.2 10.31 ± 0.15 0.25 ± 0.02
0.01 ± 0.01 47.4 ± 0.3 15.2 ± 0.1
32.0 ± 0.2 907.1 ± 25.2
5.43 ± 0.15
0.74 ± 0.07 4.57 ± 0.13 0.01 ± 0.01 0.10 ± 0.02
48.7 ± 0.2 15.8 ± 0.1 10.29 ± 0.06 0.18 ± 0.012
0.00 ± 0.00 47.4 ± 0.2 15.3 ± 0.1
32.4 ± 0.2 979.5 ± 13.6
6.23 ± 0.39
0.75 ± 0.10 5.35 ± 0.42 0.02 ± 0.01 0.13 ± 0.04
48.7 ± 0.4 15.6 ± 0.2 10.26 ± 0.09 0.17 ± 0.02
0.01 ± 0.01 47.5 ± 0.2 15.2 ± 0.1
32.1 ± 0.2 972.9 ± 45.2
5.95 ± 0.34
0.75 ± 0.04 5.08 ± 0.33 0.01 ± 0.01 0.13 ± 0.02
50.2 ± 0.6* 16.1 ± 0.2 10.62 ± 0.13* 0.17 ± 0.022
0.01 ± 0.01 47.4 ± 0.3 15.2 ± 0.2
32.0 ± 0.2 928.3 ± 20.1
6.35 ± 0.47
0.98 ± 0.10* 5.19 ± 0.38 0.05 ± 0.02 0.14 ± 0.04
FEMALE
n 9 10 10 8 10 10
Hematocrit (%) Hemoglobin (g/dL) Erythrocytes (106/µL) Reticulocytes (106/µL) Nucleated
erythrocytes (103/µL) Mean cell volume (fL) Mean cell hemoglobin (pg) Mean cell hemoglobin
concentration (g/dL) Platelets (103/µL) Leukocytes (103/µL) Segmented
neutrophils (103/µL) Lymphocytes (103/µL) Monocytes (103/µL) Eosinophils (103/µL)
49.6 ± 1.3 15.9 ± 0.3 10.38 ± 0.25 0.31 ± 0.05
0.00 ± 0.00 47.8 ± 0.4 15.4 ± 0.1
32.2 ± 0.2 883.8 ± 27.4
5.00 ± 0.33
0.69 ± 0.07 4.21 ± 0.33 0.06 ± 0.02 0.06 ± 0.02
48.5 ± 0.5 15.6 ± 0.2 10.07 ± 0.11 0.31 ± 0.04
0.00 ± 0.00 48.1 ± 0.2 15.5 ± 0.1
32.3 ± 0.1 949.5 ± 33.3
4.97 ± 0.44
0.62 ± 0.07 4.19 ± 0.41 0.03 ± 0.02 0.14 ± 0.04
48.9 ± 0.4 15.8 ± 0.1 10.08 ± 0.06 0.32 ± 0.03
0.00 ± 0.00 48.5 ± 0.2 15.7 ± 0.1**
32.4 ± 0.1 899.1 ± 42.6
5.11 ± 0.33
0.48 ± 0.04 4.47 ± 0.29 0.06 ± 0.03 0.11 ± 0.02
48.6 ± 0.4 15.6 ± 0.2 10.09 ± 0.11 0.33 ± 0.05
0.00 ± 0.00 48.1 ± 0.2 15.5 ± 0.1
32.1 ± 0.2 841.8 ± 36.0
5.38 ± 0.52
0.59 ± 0.08 4.65 ± 0.48 0.05 ± 0.02 0.11 ± 0.04
49.0 ± 0.5 15.8 ± 0.1 10.28 ± 0.11 0.34 ± 0.04
0.00 ± 0.00 47.7 ± 0.2 15.4 ± 0.1
32.3 ± 0.1 919.1 ± 13.4
5.44 ± 0.38
0.75 ± 0.09 4.58 ± 0.38 0.04 ± 0.03 0.08 ± 0.02
48.6 ± 0.5 15.8 ± 0.1 10.11 ± 0.11 0.36 ± 0.06
0.02 ± 0.01* 48.2 ± 0.1 15.6 ± 0.1
32.4 ± 0.1 902.1 ± 18.1
5.59 ± 0.51
0.71 ± 0.12 4.72 ± 0.44 0.06 ± 0.02 0.09 ± 0.03
1 Data are given as mean ± standard error. Statistical tests were performed on unrounded data. 2 n=9. * Significantly different (P≤0.05) from the control group by Shirley's test. ** Significantly different (P≤0.01) from the control group by Dunn's test.
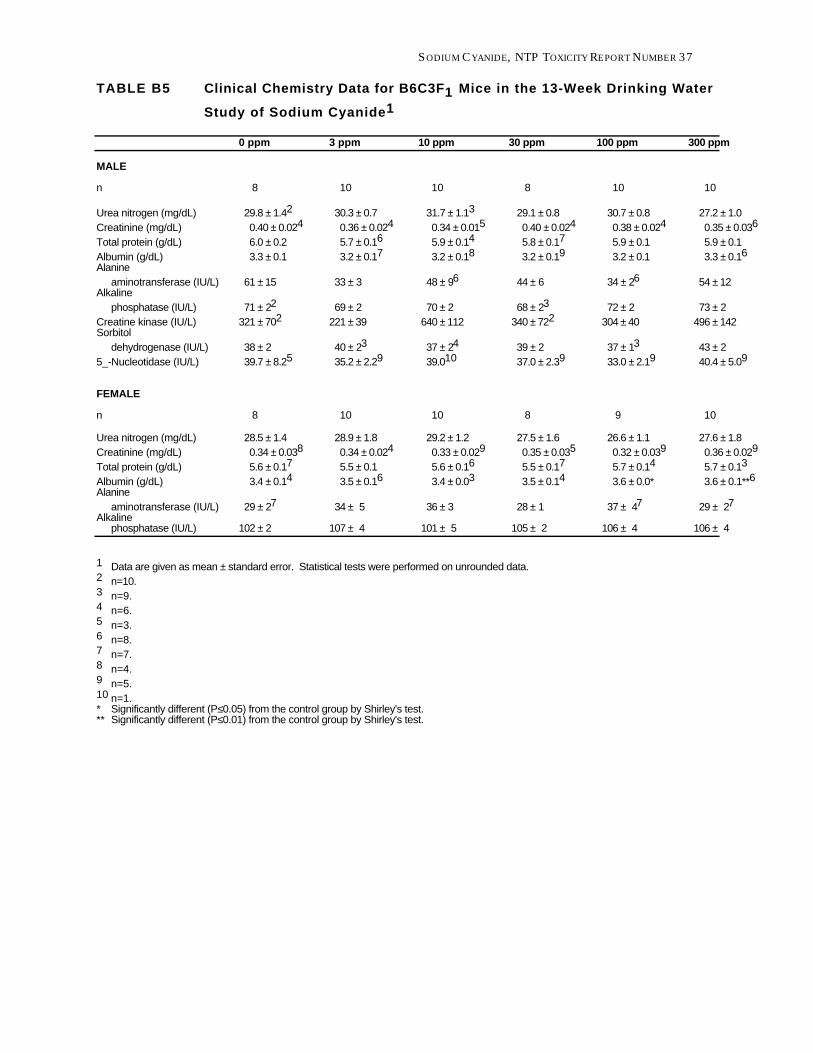
SODIUM CYANIDE, NTP TOXICITY REPORT NUMBER 37
TABLE B5 Clinical Chemistry Data for B6C3F1 Mice in the 13-Week Drinking Water
Study of Sodium Cyanide1
0 ppm 3 ppm 10 ppm 30 ppm 100 ppm 300 ppm
MALE
n 8 10 10 8 10 10
Urea nitrogen (mg/dL) Creatinine (mg/dL) Total protein (g/dL) Albumin (g/dL) Alanine
aminotransferase (IU/L) Alkaline
phosphatase (IU/L) Creatine kinase (IU/L) Sorbitol
dehydrogenase (IU/L) 5_-Nucleotidase (IU/L)
29.8 ± 1.42
0.40 ± 0.024
6.0 ± 0.2 3.3 ± 0.1
61 ± 15
71 ± 22
321 ± 702
38 ± 2 39.7 ± 8.25
30.3 ± 0.7 0.36 ± 0.024
5.7 ± 0.16
3.2 ± 0.17
33 ± 3
69 ± 2 221 ± 39
40 ± 23
35.2 ± 2.29
31.7 ± 1.13
0.34 ± 0.015
5.9 ± 0.14
3.2 ± 0.18
48 ± 96
70 ± 2 640 ± 112
37 ± 24
39.010
29.1 ± 0.8 0.40 ± 0.024
5.8 ± 0.17
3.2 ± 0.19
44 ± 6
68 ± 23
340 ± 722
39 ± 2 37.0 ± 2.39
30.7 ± 0.8 0.38 ± 0.024
5.9 ± 0.1 3.2 ± 0.1
34 ± 26
72 ± 2 304 ± 40
37 ± 13
33.0 ± 2.19
27.2 ± 1.0 0.35 ± 0.036
5.9 ± 0.1 3.3 ± 0.16
54 ± 12
73 ± 2 496 ± 142
43 ± 2 40.4 ± 5.09
FEMALE
n 8 10 10 8 9 10
Urea nitrogen (mg/dL) Creatinine (mg/dL) Total protein (g/dL) Albumin (g/dL) Alanine
aminotransferase (IU/L) Alkaline
phosphatase (IU/L)
28.5 ± 1.4 0.34 ± 0.038
5.6 ± 0.17
3.4 ± 0.14
29 ± 27
102 ± 2
28.9 ± 1.8 0.34 ± 0.024
5.5 ± 0.1 3.5 ± 0.16
34 ± 5
107 ± 4
29.2 ± 1.2 0.33 ± 0.029
5.6 ± 0.16
3.4 ± 0.03
36 ± 3
101 ± 5
27.5 ± 1.6 0.35 ± 0.035
5.5 ± 0.17
3.5 ± 0.14
28 ± 1
105 ± 2
26.6 ± 1.1 0.32 ± 0.039
5.7 ± 0.14
3.6 ± 0.0*
37 ± 47
106 ± 4
27.6 ± 1.8 0.36 ± 0.029
5.7 ± 0.13
3.6 ± 0.1**6
29 ± 27
106 ± 4
1 Data are given as mean ± standard error. Statistical tests were performed on unrounded data. 2 n=10. 3 n=9. 4 n=6. 5 n=3. 6 n=8. 7 n=7. 8 n=4. 9 n=5. 10 n=1. * Significantly different (P≤0.05) from the control group by Shirley's test. ** Significantly different (P≤0.01) from the control group by Shirley's test.
SODIUM CYANIDE, NTP TOXICITY REPORT NUMBER 37
APPENDIX C
Reproductive Tissue Evaluations and Estrous Cycle Characterization
Table C1 Summary of Reproductive Tissue Evaluations in Male F344/N Rats in the 13-Week Drinking Water Study of Sodium Cyanide C-2
Table C2 Summary of Estrous Cycle Characterization in Female F344/N Rats in the 13-Week Drinking Water Study of Sodium Cyanide C-2
Table C3 Summary of Reproductive Tissue Evaluations in Male B6C3F1 Mice
in the 13-Week Drinking Water Study of Sodium Cyanide C-3
Table C4 Summary of Estrous Cycle Characterization in Female B6C3F1 Mice
in the 13-Week Drinking Water Study of Sodium Cyanide C-3
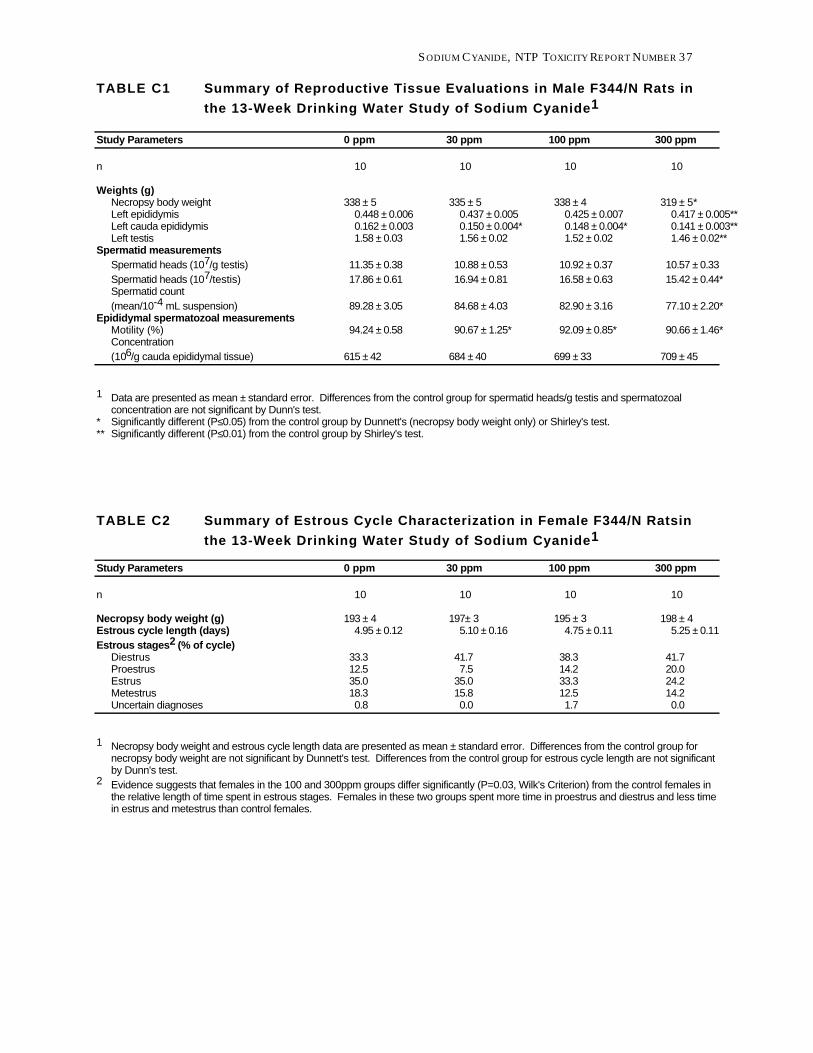
1
SODIUM CYANIDE, NTP TOXICITY REPORT NUMBER 37
TABLE C1 Summary of Reproductive Tissue Evaluations in Male F344/N Rats in
the 13-Week Drinking Water Study of Sodium Cyanide1
Study Parameters 0 ppm 30 ppm 100 ppm 300 ppm
n 10 10 10 10
Weights (g) Necropsy body weight 338 ± 5 335 ± 5 338 ± 4 319 ± 5* Left epididymis 0.448 ± 0.006 0.437 ± 0.005 0.425 ± 0.007 0.417 ± 0.005** Left cauda epididymis 0.162 ± 0.003 0.150 ± 0.004* 0.148 ± 0.004* 0.141 ± 0.003** Left testis 1.58 ± 0.03 1.56 ± 0.02 1.52 ± 0.02 1.46 ± 0.02**
Spermatid measurements Spermatid heads (107/g testis) 11.35 ± 0.38 10.88 ± 0.53 10.92 ± 0.37 10.57 ± 0.33 Spermatid heads (107/testis) 17.86 ± 0.61 16.94 ± 0.81 16.58 ± 0.63 15.42 ± 0.44* Spermatid count (mean/10-4 mL suspension) 89.28 ± 3.05 84.68 ± 4.03 82.90 ± 3.16 77.10 ± 2.20*
Epididymal spermatozoal measurements Motility (%) 94.24 ± 0.58 90.67 ± 1.25* 92.09 ± 0.85* 90.66 ± 1.46* Concentration (106/g cauda epididymal tissue) 615 ± 42 684 ± 40 699 ± 33 709 ± 45
Data are presented as mean ± standard error. Differences from the control group for spermatid heads/g testis and spermatozoal concentration are not significant by Dunn's test.
* Significantly different (P≤0.05) from the control group by Dunnett's (necropsy body weight only) or Shirley's test. ** Significantly different (P≤0.01) from the control group by Shirley's test.
TABLE C2 Summary of Estrous Cycle Characterization in Female F344/N Ratsin
the 13-Week Drinking Water Study of Sodium Cyanide1
Study Parameters 0 ppm 30 ppm 100 ppm 300 ppm
n 10 10 10 10
Necropsy body weight (g) 193 ± 4 197± 3 195 ± 3 198 ± 4 Estrous cycle length (days) 4.95 ± 0.12 5.10 ± 0.16 4.75 ± 0.11 5.25 ± 0.11 Estrous stages2 (% of cycle)
Diestrus 33.3 41.7 38.3 41.7 Proestrus 12.5 7.5 14.2 20.0 Estrus 35.0 35.0 33.3 24.2 Metestrus 18.3 15.8 12.5 14.2 Uncertain diagnoses 0.8 0.0 1.7 0.0
1 Necropsy body weight and estrous cycle length data are presented as mean ± standard error. Differences from the control group for necropsy body weight are not significant by Dunnett's test. Differences from the control group for estrous cycle length are not significant by Dunn's test.
2 Evidence suggests that females in the 100 and 300ppm groups differ significantly (P=0.03, Wilk's Criterion) from the control females in the relative length of time spent in estrous stages. Females in these two groups spent more time in proestrus and diestrus and less time in estrus and metestrus than control females.
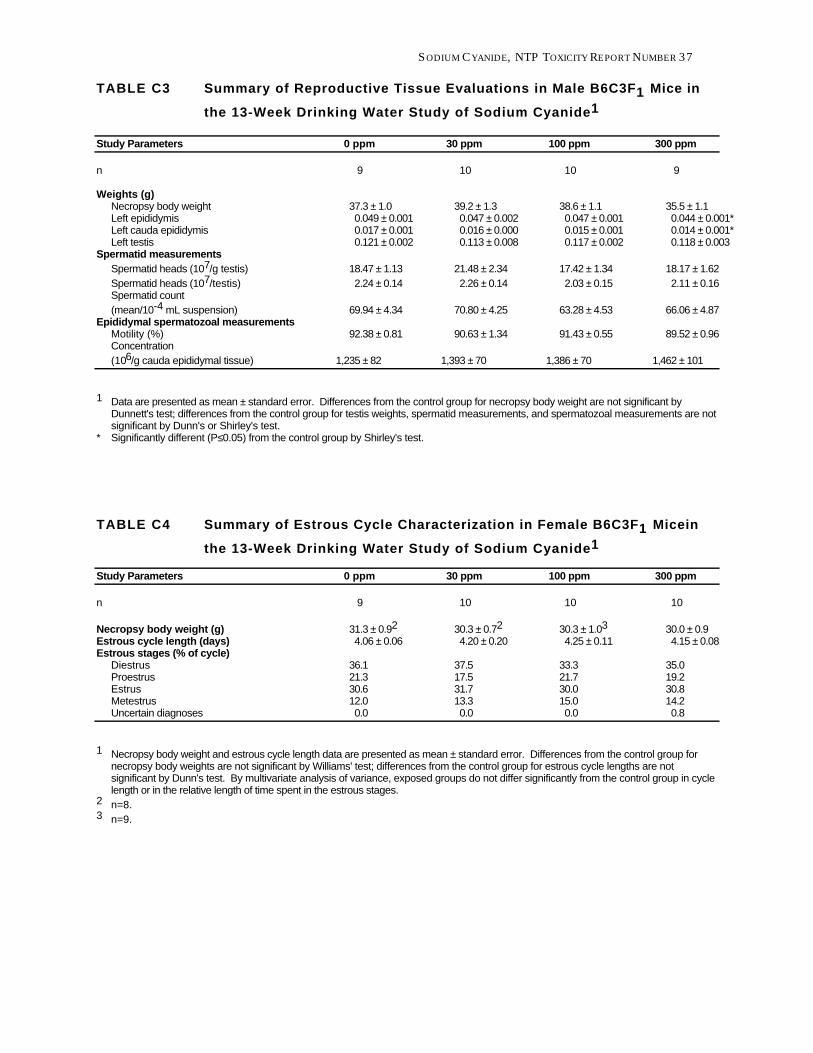
1
SODIUM CYANIDE, NTP TOXICITY REPORT NUMBER 37
TABLE C3 Summary of Reproductive Tissue Evaluations in Male B6C3F1 Mice in
the 13-Week Drinking Water Study of Sodium Cyanide1
Study Parameters 0 ppm 30 ppm 100 ppm 300 ppm
n 9 10 10 9
Weights (g) Necropsy body weight 37.3 ± 1.0 39.2 ± 1.3 38.6 ± 1.1 35.5 ± 1.1 Left epididymis 0.049 ± 0.001 0.047 ± 0.002 0.047 ± 0.001 0.044 ± 0.001* Left cauda epididymis 0.017 ± 0.001 0.016 ± 0.000 0.015 ± 0.001 0.014 ± 0.001* Left testis 0.121 ± 0.002 0.113 ± 0.008 0.117 ± 0.002 0.118 ± 0.003
Spermatid measurements Spermatid heads (107/g testis) 18.47 ± 1.13 21.48 ± 2.34 17.42 ± 1.34 18.17 ± 1.62 Spermatid heads (107/testis) 2.24 ± 0.14 2.26 ± 0.14 2.03 ± 0.15 2.11 ± 0.16 Spermatid count (mean/10-4 mL suspension) 69.94 ± 4.34 70.80 ± 4.25 63.28 ± 4.53 66.06 ± 4.87
Epididymal spermatozoal measurements Motility (%) 92.38 ± 0.81 90.63 ± 1.34 91.43 ± 0.55 89.52 ± 0.96 Concentration (106/g cauda epididymal tissue) 1,235 ± 82 1,393 ± 70 1,386 ± 70 1,462 ± 101
Data are presented as mean ± standard error. Differences from the control group for necropsy body weight are not significant by Dunnett's test; differences from the control group for testis weights, spermatid measurements, and spermatozoal measurements are not significant by Dunn's or Shirley's test.
* Significantly different (P≤0.05) from the control group by Shirley's test.
TABLE C4 Summary of Estrous Cycle Characterization in Female B6C3F1 Micein
the 13-Week Drinking Water Study of Sodium Cyanide1
Study Parameters 0 ppm 30 ppm 100 ppm 300 ppm
n 9 10 10 10
Necropsy body weight (g) 31.3 ± 0.92 30.3 ± 0.72 30.3 ± 1.03 30.0 ± 0.9 Estrous cycle length (days) 4.06 ± 0.06 4.20 ± 0.20 4.25 ± 0.11 4.15 ± 0.08 Estrous stages (% of cycle)
Diestrus 36.1 37.5 33.3 35.0 Proestrus 21.3 17.5 21.7 19.2 Estrus 30.6 31.7 30.0 30.8 Metestrus 12.0 13.3 15.0 14.2 Uncertain diagnoses 0.0 0.0 0.0 0.8
1 Necropsy body weight and estrous cycle length data are presented as mean ± standard error. Differences from the control group for necropsy body weights are not significant by Williams' test; differences from the control group for estrous cycle lengths are not significant by Dunn's test. By multivariate analysis of variance, exposed groups do not differ significantly from the control group in cycle length or in the relative length of time spent in the estrous stages.
2 n=8. 3 n=9.

D-2
SODIUM CYANIDE, NTP TOXICITY REPORT NUMBER 37
APPENDIX D
Genetic Toxicology
Table D Mutagenicity of Sodium Cyanide in Salmonella typhimurium
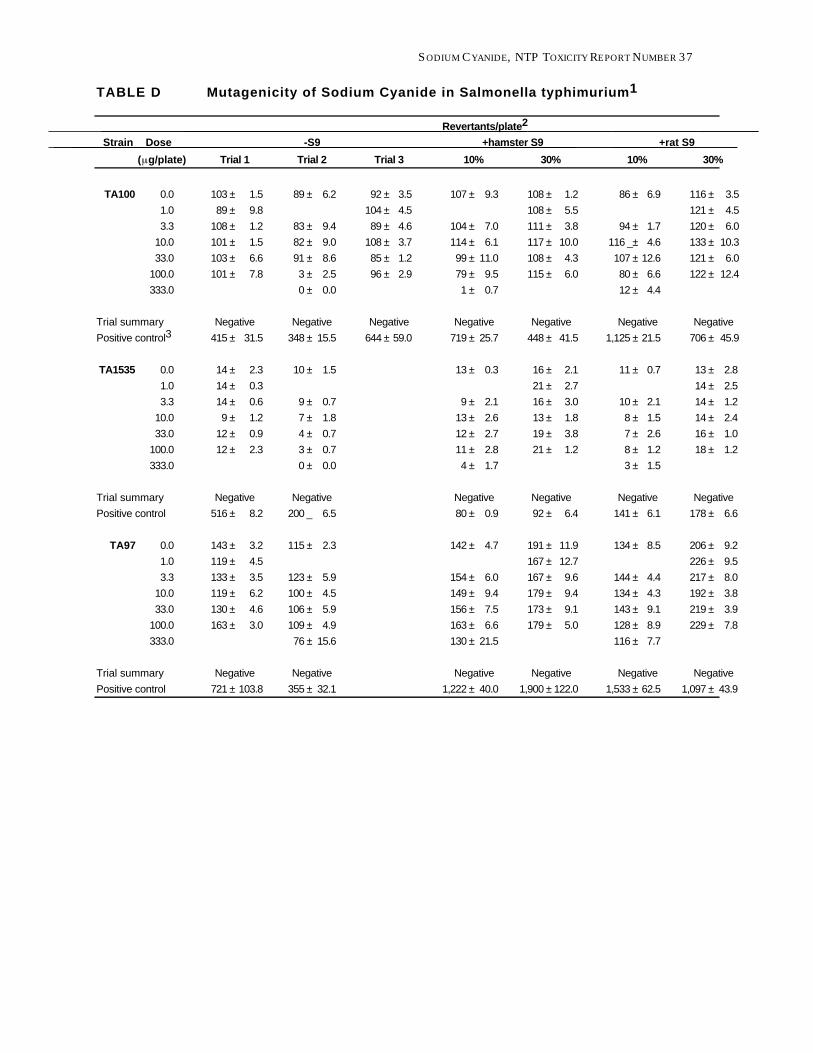
SODIUM CYANIDE, NTP TOXICITY REPORT NUMBER 37
TABLE D Mutagenicity of Sodium Cyanide in Salmonella typhimurium1
Strain Dose
( g/plate) Trial 1
-S9
Trial 2 Trial 3
Revertants/plate2
+hamster S9
10% 30% 10%
+rat S9
30%
TA100 0.0
1.0
3.3
10.0
33.0
100.0
333.0
103 ± 89 ±
108 ± 101 ± 103 ± 101 ±
1.5
9.8
1.2
1.5
6.6
7.8
89 ±
83 ± 82 ± 91 ± 3 ± 0 ±
6.2
9.4
9.0
8.6
2.5
0.0
92 ± 104 ± 89 ±
108 ± 85 ± 96 ±
3.5
4.5
4.6
3.7
1.2
2.9
107 ± 9.3
104 ± 7.0
114 ± 6.1
99 ± 11.0
79 ± 9.5
1 ± 0.7
108 ± 1.2
108 ± 5.5
111 ± 3.8
117 ± 10.0
108 ± 4.3
115 ± 6.0
86 ± 6.9
94 ± 1.7
116 _± 4.6
107 ± 12.6
80 ± 6.6
12 ± 4.4
116 ± 3.5
121 ± 4.5
120 ± 6.0
133 ± 10.3
121 ± 6.0
122 ± 12.4
Trial summary
Positive control3 Negative
415 ± 31.5
Negative
348 ± 15.5
Negative
644 ± 59.0
Negative
719 ± 25.7
Negative
448 ± 41.5
Negative
1,125 ± 21.5
Negative
706 ± 45.9
TA1535 0.0
1.0
3.3
10.0
33.0
100.0
333.0
14 ± 14 ± 14 ± 9 ±
12 ± 12 ±
2.3
0.3
0.6
1.2
0.9
2.3
10 ±
9 ± 7 ± 4 ± 3 ± 0 ±
1.5
0.7
1.8
0.7
0.7
0.0
13 ±
9 ± 13 ± 12 ± 11 ± 4 ±
0.3
2.1
2.6
2.7
2.8
1.7
16 ± 21 ± 16 ± 13 ± 19 ± 21 ±
2.1
2.7
3.0
1.8
3.8
1.2
11 ±
10 ± 8 ± 7 ± 8 ± 3 ±
0.7
2.1
1.5
2.6
1.2
1.5
13 ± 14 ± 14 ± 14 ± 16 ± 18 ±
2.8
2.5
1.2
2.4
1.0
1.2
Trial summary
Positive control
Negative
516 ± 8.2
Negative
200 _ 6.5
Negative
80 ± 0.9
Negative
92 ± 6.4
Negative
141 ± 6.1
Negative
178 ± 6.6
TA97 0.0
1.0
3.3
10.0
33.0
100.0
333.0
143 ± 119 ± 133 ± 119 ± 130 ± 163 ±
3.2
4.5
3.5
6.2
4.6
3.0
115 ± 2.3
123 ± 5.9
100 ± 4.5
106 ± 5.9
109 ± 4.9
76 ± 15.6
142 ± 4.7
154 ± 6.0
149 ± 9.4
156 ± 7.5
163 ± 6.6
130 ± 21.5
191 ± 11.9
167 ± 12.7
167 ± 9.6
179 ± 9.4
173 ± 9.1
179 ± 5.0
134 ±
144 ± 134 ± 143 ± 128 ± 116 ±
8.5
4.4
4.3
9.1
8.9
7.7
206 ± 226 ± 217 ± 192 ± 219 ± 229 ±
9.2
9.5
8.0
3.8
3.9
7.8
Trial summary
Positive control
Negative
721 ± 103.8
Negative
355 ± 32.1
Negative
1,222 ± 40.0
Negative
1,900 ± 122.0
Negative
1,533 ± 62.5
Negative
1,097 ± 43.9
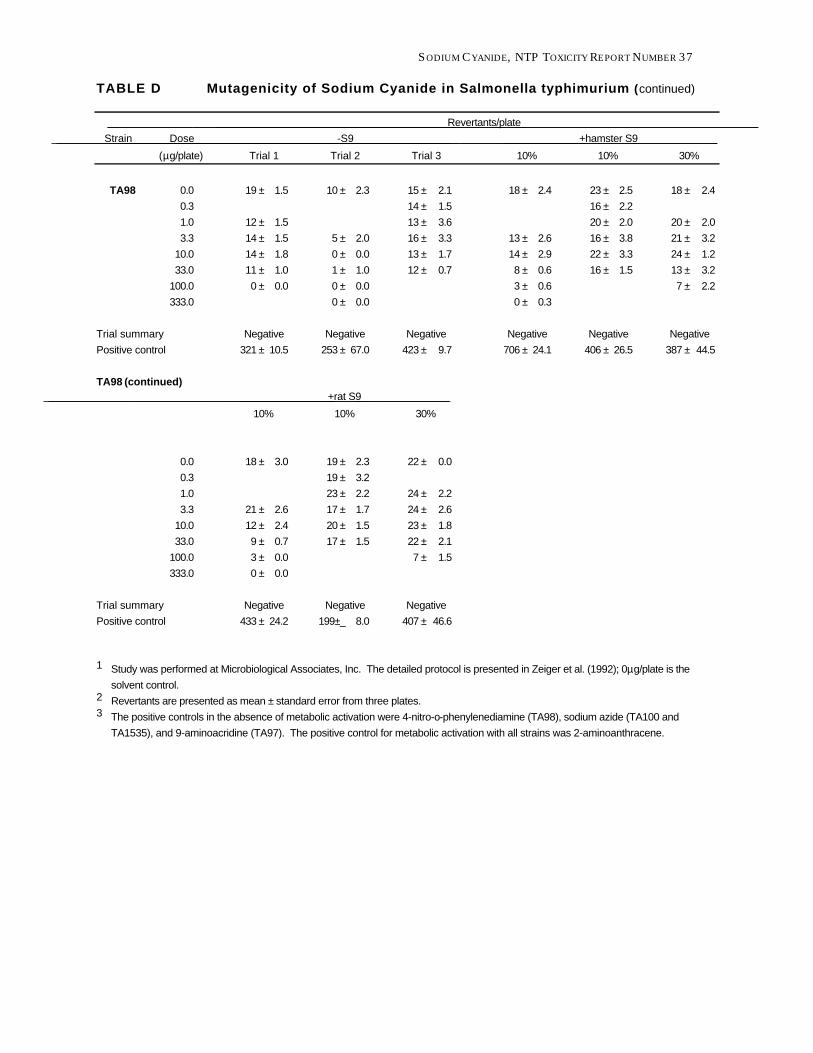
SODIUM CYANIDE, NTP TOXICITY REPORT NUMBER 37
TABLE D Mutagenicity of Sodium Cyanide in Salmonella typhimurium (continued)
Revertants/plate
Strain Dose -S9 +hamster S9
(µg/plate) Trial 1 Trial 2 Trial 3 10% 10% 30%
TA98 0.0 19 ± 1.5 10 ± 2.3 15 ± 2.1 18 ± 2.4 23 ± 2.5 18 ± 2.4
0.3 14 ± 1.5 16 ± 2.2
1.0 12 ± 1.5 13 ± 3.6 20 ± 2.0 20 ± 2.0
3.3 14 ± 1.5 5 ± 2.0 16 ± 3.3 13 ± 2.6 16 ± 3.8 21 ± 3.2
10.0 14 ± 1.8 0 ± 0.0 13 ± 1.7 14 ± 2.9 22 ± 3.3 24 ± 1.2
33.0 11 ± 1.0 1 ± 1.0 12 ± 0.7 8 ± 0.6 16 ± 1.5 13 ± 3.2
100.0 0 ± 0.0 0 ± 0.0 3 ± 0.6 7 ± 2.2
333.0 0 ± 0.0 0 ± 0.3
Trial summary Negative Negative Negative Negative Negative Negative
Positive control 321 ± 10.5 253 ± 67.0 423 ± 9.7 706 ± 24.1 406 ± 26.5 387 ± 44.5
TA98 (continued) +rat S9
10% 10% 30%
0.0 18 ± 3.0 19 ± 2.3 22 ± 0.0
0.3 19 ± 3.2
1.0 23 ± 2.2 24 ± 2.2
3.3 21 ± 2.6 17 ± 1.7 24 ± 2.6
10.0 12 ± 2.4 20 ± 1.5 23 ± 1.8
33.0 9 ± 0.7 17 ± 1.5 22 ± 2.1
100.0 3 ± 0.0 7 ± 1.5
333.0 0 ± 0.0
Trial summary Negative Negative Negative
Positive control 433 ± 24.2 199±_ 8.0 407 ± 46.6
1 Study was performed at Microbiological Associates, Inc. The detailed protocol is presented in Zeiger et al. (1992); 0µg/plate is the
solvent control. 2 Revertants are presented as mean ± standard error from three plates. 3 The positive controls in the absence of metabolic activation were 4-nitro-o-phenylenediamine (TA98), sodium azide (TA100 and
TA1535), and 9-aminoacridine (TA97). The positive control for metabolic activation with all strains was 2-aminoanthracene.

SODIUM CYANIDE, NTP TOXICITY REPORT NUMBER 37
NTP TECHNICAL REPORTS ON TOXICITY STUDIES PRINTED AS OF NOVEMBER 1993
Toxicity Chemical Route of Exposure Publication Report Number Number
1 Hexachloro-1,3-butadiene Dosed Feed 91-3120 2 n-Hexane Inhalation 91-3121 3 Acetone Drinking Water 91-3122 4 1,2-Dichloroethane Drinking Water, Gavage 91-3123 5 Cobalt Sulfate Heptahydrate Inhalation 91-3124 6 Pentachlorobenzene Dosed Feed 91-3125 7 1,2,4,5-Tetrachlorobenzene Dosed Feed 91-3126 8 D & C Yellow No. 11 Dosed Feed 91-3127 9 o-Cresol Dosed Feed 92-3128
m-Cresol p-Cresol
10 Ethylbenzene Inhalation 92-3129 11 Antimony Potassium Tartrate Drinking Water, I.P. 92-3130
Inject. 12 Castor Oil Dosed Feed 92-3131 13 Trinitrofluorenone Dermal, Dosed Feed 92-3132 14 p-Chloro-_,_,_-Trifluorotoluene Gavage (corn oil, a-CD) 92-3133 15 t-Butyl Perbenzoate Gavage 92-3134 16 Glyphosate Dosed Feed 92-3135 17 Black Newsprint Ink Dermal 92-3340 18 Methyl Ethyl Ketone Peroxide Dermal 92-3341 19 Formic Acid Inhalation 92-3342 20 Diethanolamine Drinking Water, Dermal 92-3343 21 2-Hydroxy-4- Dosed Feed, Drinking 92-3344
Methoxybenzophenone Water 22 N, N-Dimethylformamide Inhalation 93-3345 23 o-Nitrotoluene Dosed Feed 92-3346
m-Nitrotoluene p-Nitrotoluene
24 1,6-Hexanediamine Inhalation 93-3347 25 Glutaraldehyde Inhalation 93-3348 26 Ethylene Glycol Ethers Drinking Water 93-3349 28 Tetrachlorophthalic Anhydride Gavage 93-3351 29 Cupric Sulfate Drinking Water, Dosed 93-3352
Feed

SODIUM CYANIDE, NTP TOXICITY REPORT NUMBER 37
NTP TECHNICAL REPORTS ON TOXICITY STUDIES PRINTED AS OF NOVEMBER 1993 (continued)
Toxicity Chemical Route of Exposure Publication Report Number Number
33 2-Chloronitrobenzene Inhalation 93-3382 4-Chloronitrobenzene
35 Chemical Mixture of 25 Drinking Water 93-3384 Groundwater Contaminants
36 Pesticide/Fertilizer Mixtures Drinking Water 93-3385


![CITOGENETIC EFFECTS INDUCED BY SODIUM NITRITE ON … · antidote in cyanide intoxications [1]. The goal of this paper was to investigate the influence of sodium nitrite on wheat meristematic](https://img.pdfslide.us/doc/110x75/60608f4c54f7a61c81417b9d/citogenetic-effects-induced-by-sodium-nitrite-on-antidote-in-cyanide-intoxications.jpg)