Embed Size (px)
Citation preview

Aust. J. Soil Res., 2001, 39, 1225–1246
© CSIRO 2001 0004-9573/01/06122510.1071/SR00094
Sodic soil reclamation: Modelling and field study
Donald L. Suarez
USDA, ARS, George E. Brown, Jr. Salinity Laboratory, 450 W. Big Springs Road, Riverside, CA 92507, USA; email: [email protected]
Abstract
Reclamation of sodic soils has traditionally been undertaken using calculation of gypsum or Ca requirementassuming 100% exchange efficiency and neglect of the contribution of calcium carbonate in the profile.The UNSATCHEM model is reviewed and then evaluated for its ability to predict field reclamation of asodic saline soil. The 40-ha field site was initially at an electrical conductivity (EC) of 50 dS/m and asodium absorption ratio (SAR) of 144 in the top 30 cm. After installation of a drainage system, 24 Mg/haof gypsum was applied to a depth of 15 cm in the soil. Subsequently, 114 cm of water was applied by almostcontinuous ponding for 3 months. Model simulations were made based on infiltration of 70–80 cm of water,correcting for the estimated evaporation of 41 cm of water. These infiltration estimates are consistent withthe good fit between the measured Cl concentrations after reclamation and the model predicted values after70–80 cm of infiltrated water. Model predictions of EC and SAR after reclamation gave a satisfactory fitto the measured values. The effectiveness of mixing gypsum to various depths was evaluated in terms of thepredicted SAR profiles. Alternative management practices of green manuring in presence of calcite weresimulated and appeared feasible. In this instance it appears likely that the field could have been reclaimedeither with less water or without the addition of gypsum.
Additional keywords: gypsum, leaching, salinity.
SR00094Sodi c soi l reclamati onDonal d L. SuarezD. L. Suar ez
Introduction
Agricultural productivity in arid regions throughout the world is being threatened byvarious long-term trends. Increasing urban water demands in arid regions, due in part toincreasing population, makes high quality water less available for irrigation. Waterextraction in many arid regions is currently much greater than sustainable rates. In order forirrigation to expand or even maintain its existing level, new water supplies, of lower quality,will have to be utilised. This includes use of urban waste waters as well as presently under-utilised brackish waters. In addition to water constraints, there is a deteriorating landresource base. Over-irrigation, inadequate drainage, and other poor management practiceshave resulted in rapid rates of soil salinisation. Urbanisation also occurs in primeagricultural land, forcing agriculture into newer regions. A large increase in landreclamation efforts and improved management practices will have to be undertaken in orderto maintain or increase the productivity of irrigated lands.
Reclamation of saline soils requires leaching of the soluble salts. The requirements forleaching are based on the salt tolerance of the crops to be grown. General guidelines arereadily available to calculate the amount of water to be applied to achieve a certainreduction in salinity. For example, the amount of water required to leach a soil can becalculated by:
where Diw is the depth of the irrigation water to be applied, Ds is the depth of the soil to beleached, and θv is the volumetric water content of the soil after leaching. This relationship
(1))( vsiw θ= DD

1226 D. L. Suarez
assumes piston displacement (no macropore flow, no dispersion or convection, and nochemical interaction of the solute with the soil). Hoffman (1980) presented the empiricalrelationship:
where C is the salt concentration, Co is the initial salt concentration, D is the depth ofleaching water applied, Ds is the depth of the soil to be leached, and k is an empiricalcoefficient. This equation is based on fitting to measured leaching curves. As can beexpected the k value is dependent on soil type. Hoffman (1980) observed that a value of 0.3for clay soils and a value of 0.1 for sandy loam fitted the data examined adequately. Thelarger the k value, the more water is required for leaching. Clay soils may have morepreferential flow due to cracks and bypass of water around aggregates, thus resulting in lessefficient leaching of soils with elevated clay content. Shown in Fig. 1 are the leachingcurves proposed by Hoffman (1980) for clay loam and sandy loam.
In contrast to leaching of saline soils, reclamation of saline-sodic and sodic soils requiresconsideration of chemical factors as well as water flow. The traditional approach has beento calculate the amendment requirement based on the amount of Ca needed to reduce theexchangeable Na percentage (ESP) in the soil to a specific level, typically to below 10 (USSalinity Laboratory Staff 1954). The general approach has been to calculate the gypsumrequirement based directly on the quantity of Na to be exchanged, for example 1.23 Mg/hafor every molc/kg of Na to be exchanged. This calculation is based on the mass of Na to beexchanged, thus assuming quantitative replacement of the Na by Ca and that there are noother sources of Ca present in the solution; neither of these assumptions is valid.Consideration of exchange efficiency allows calculation (after Oster and Jayawardane1998) from:
Continuous ponding
Clay loam
Sandy loam
Measured
1.0
0.8
0.6
0.4
0.2
0
Frac
tion
of in
itial
sal
t rem
aini
ng (
c/c 0
)
Depth of leaching water/depth of soil (dL/dS)
0 0.5 1.0 1.5 2.0
Fig. 1. Leaching recommendations of Hoffman (1980) and measured changes in salinity after leaching and reclamation.
(2)so
D/D
k
C
C=

Sodic soil reclamation 1227
where GR, the gypsum requirement, is given in Mg/ha; Ds is the depth of the soil to bereclaimed (m); CEC is the cation exchange capacity in mmolc/kg; ESPi is the initial ESPand ESPf is the final desired ESP; ρb is the soil bulk density; and F is a Ca–Na exchangeefficiency factor. Examination of cation exchange equations, such as:
where kg is the selectivity coefficient, demonstrates that unless Ca exchange selectivity isextremely high, significant quantities of Ca must remain in solution under saline conditionsin order to exchange most of the Na. This unavoidable loss of Ca has been consideredinefficiency of exchange. In general the lower the ESP and the higher the salinity the lessefficient is the exchange. Oster and Frenkel (1980) calculated that this F factor (Eqn 3)varied between 1.1 at ESPf of 15 and 1.3 at ESPf of 5.
Offsetting exchange inefficiency during computation of amendment requirements isneglect of the role of calcium carbonate in the exchange process. Calcite dissolution hasusually been dismissed as an important factor in sodic soil reclamation, the reason beingthat it is generally considered to be insoluble. However, this is generally not the case undersoil conditions of elevated CO2, and in the presence of a sink for Ca. The extent of calciumcarbonate dissolution also depends on the irrigation water alkalinity and Ca content. TheCa content of the irrigation water can also be sufficient to cause appreciable reclamation.The net result of these processes is that the amount of amendment required is overestimatedby these traditional methods, despite the inefficiency of exchange. For example, accordingto these guidelines, reclamation to reduce the exchangeable Na by 200 mmolc/kg soil (20meq/100 g) to a depth of 30.5 cm requires 85 Mg gypsum/ha. Such a value corresponds toreduction of the ESP from 50 to 10 for a soil with a CEC of 500 mmolc/kg (50 meq/100 g).These quantities of gypsum are not economically viable; thus, these recommendations arerarely followed.
Alternative determinations of gypsum requirements can be based on the quantitativecalculation of exchange efficiency, calcite dissolution, and the Ca contribution of theirrigation water using numerical models (Simunek and Suarez 1997). The objectives of thispaper are to review the relevant concepts of these processes in the UNSATCHEM modeland to evaluate the predictions, based on data from a field reclamation project. Acomparison is made of the model predictions to field results of reclamation, as well asconsideration of management alternatives.
UNSATCHEM model
The model to be applied to the reclamation problem, UNSATCHEM (Simunek and Suarez1996; Suarez and Simunek 1997), is reviewed below. Several unique features are theprediction of CO2 concentrations in the root-zone, consideration of the effects of soilchemistry on hydraulic properties, and inclusion of a kinetic model to describe calcitedissolution and precipitation. The model uses a modified version of the 1-dimensionalRichards’ equation:
(3))ESP(CEC)(ESPD0.00086FGR fibs −ρ=
[ ][ ] (4)Ca
Na
Ca
Na0.52g
+
+
= kX
X
(5)1)(
= S z
h K
zt
w −+∂∂
∂
∂
∂θ∂

1228 D. L. Suarez
where θw is the volumetric water content, K is the hydraulic conductivity function, h is thewater pressure head, t is time, z is the spatial coordinate (positive up), and S is the sink termrepresenting removal of water from the soil by plant roots. This equation neglects the effectsof thermal and density gradients, and is used with the assumption that the gas phasedynamics do not affect water flow.
The unsaturated soil hydraulic properties are described by a modified version of thoseproposed by van Genuchten (1980). The hydraulic conductivity functions are given by:
where
and where θr and θs are the residual and saturated water content [cm3/cm3], respectively; Ksis the saturated conductivity [cm/day]; Kr is the relative hydraulic conductivity; Se is relativesaturation; and m, n, and α [1/cm] are the empirical parameters of the hydrauliccharacteristics. Hydraulic characteristics are determined by the parameters, θr, θs, α, n, Ks,and r, where r represents the effect of soil chemistry on hydraulic properties. Use of themodel requires optimising the first 5 parameters from the experimental water retention,pressure head, and saturated conductivity data. It is considered that for sodic soilreclamation it is sufficient to choose the default hydraulic characteristics based on soiltexture (Carsel and Parrish 1988) and adjust the saturated hydraulic conductivity value tothat of the soil. The major error in the default parameters, for our applications, is thesaturated hydraulic conductivity and not the water retention pressure relationships.
Chemical effects on hydraulic conductivity
Equation 6 differs from previous relations in that it includes a reduction term, r, whichscales the hydraulic conductivity in relation to the chemical conditions in the soil. Optimalsoil chemical conditions for infiltration are represented by values where r = 1. Elevatedlevels of exchangeable sodium result in swelling of smectitic clays. Detachment of clayparticles, dispersion, and subsequent clay migration and redeposition results in blocking ofpores at low salinity and in the presence of exchangeable sodium (McNeal 1968; Shainbergand Levy 1992). This process is readily observed in the natural development of clay panlayers in soils and most dramatically in sodic, nonsaline soils. In addition, it has beendetermined that elevated levels of pH adversely affect saturated hydraulic conductivity,separate from the sodicity and salinity interactions (Suarez et al. 1984).
Suarez and Simunek (1997) represented the chemical effects on hydraulic properties bythe use of a reduction function, r, given by:
where r1 is the reduction due to the adverse effects of low salinity and high exchangeablesodium fractions on the clay, and r2 is the adverse effect of pH. The r1 term is given byMcNeal (1968) as:
(6)) (1 1==)( eesrs
1
2
1
−− m
2
SSrKrKKhK m
(8)
(7) 111
rs
re
θ−θ
θ−θ
−
= S
> n /n = m
(9)21 rrr =

Sodic soil reclamation 1229
where c and n are empirical factors, and x is defined by:
where fm is the mass fraction of smectite in the soil, d* is an adjusted interlayer spacing, andESP* is an adjusted exchangeable sodium percentage (percentage of the total cationexchange charge of the soil that is neutralised by Na+). The term d* is defined by:
where C0 is the sum of the cation charge in solution expressed in mmolc/L and the termESP* is given by:
The reduction factor r2, for the adverse effect of pH on hydraulic conductivity (K), wascalculated from the experimental data of Suarez et al. (1984), after first correcting for theadverse effects of low salinity and high exchangeable sodium using the calculated r1 values.Based on these limited data:
In view of the differences among soils, these specific values may not be generalisedpredictors of soil hydraulic conductivity, although they do represent conditions of 3 aridland soils examined at the US Salinity Laboratory. These equations illustrate the changesin K that affect infiltration and solute movement under various chemical conditions. Thisoption in the model should not be considered as a quantitative prediction of what will occurat a specific site but is useful to evaluate the relative importance of the chemical effectsunder different soil and water conditions. Many other factors in addition to sodicity and pHaffect soil aggregate stability, such as organic matter content, mode of irrigation, tillage,and extent of ground cover. It is reasonable to assume that these factors also affect thehydraulic conductivity and that there is an interaction between these factors and thechemical factors considered here.
Carbon dioxide production and transport
Unsaturated zone models typically either consider a closed system with constant inorganiccarbon, as is also commonly considered for groundwater systems, or assume an open systemat fixed CO2. The first assumption is clearly not desirable for a root-zone model as largeamounts of CO2 are produced by plant decomposition as well as plant root respiration.Specification of a fixed CO2 is a marked improvement over the closed system assumption butstill does not consider spatial and temporal fluctuations. These changes are due to changes inproduction of CO2, as well as changes in the transport of CO2, which is mostly related tochanges in the air-filled porosity of the soil, but can also be related to the flow of water.
(10)1
11 n
n
cx
cxr
+−=
(11)ESP10 3.6
4_ d** f =x m ×
(12)
/L mmol300 1.2+)( 356.4 = *
L/ mmol300>0 = *
c00.5
0
c0
≤− CCd
Cd
(13)) log 11.63 + 1.24 ( ESP = ESP*0soil C
9.3 > for pH0.1 =
(14)9.3 pH 6.83for pH0.36_ 3.46 =
6.83 < for pH1 =
2
2
2
r
r
r
≤≤
1230 D. L. Suarez
Simunek and Suarez (1993) described a general soil model for CO2 production andtransport. The CO2 production is the sum of the production rate by soil microorganisms, γs[cm3 /cm3.day], and the production rate by plant roots, γp [cm3/cm3.day]:
where the subscript s refers to soil microorganisms and the subscript p refers to plant roots,and Πfi is the product of reduction coefficients dependent on depth, temperature, pressurehead (the soil water content), CO2 concentration, osmotic head, and time. The parametersγs0 and γp0 represent, respectively, the optimal CO2 production by the soil microorganismsor plant roots for the whole soil profile at 20°C under optimal water, solute, and soil CO2concentration conditions. The individual reduction functions are given in Simunek andSuarez (1993). Discussion of selection of the values for optimal production as well ascoefficients for the reduction functions is given in Suarez and Simunek (1993).
The 1-dimensional carbon dioxide transport model presented by Simunek and Suarez(1993) assumed that CO2 transport in the unsaturated zone occurs in both the liquid and gasphases. One-dimensional CO2 transport described by the following equation considersconvective transport in the aqueous phase and diffusive transport in both gas and aqueousphases:
where Jda is the CO2 flux resulting from gas phase diffusion [cm/day], Jdw the CO2 fluxfrom dispersion in the dissolved phase [cm/day], Jca the CO2 flux from convection in thegas phase [cm/day], and Jcw the CO2 flux from convection in the dissolved phase [cm/day].The term cT is the total concentration of CO2 [cm3/cm3] and P is the CO2 production/sinkterm [cm3/cm3.day]. The term Scw represents the dissolved CO2 removed from the soil byroot water uptake. It is assumed that when plants take up water the dissolved CO2 is alsoextracted.
The total CO2 concentration, cT [cm3/cm3] is the sum of CO2 in the gas and dissolvedphases:
Combining expressions for the flux terms in the solution and gas phases with Eqns 16 and17, then:
where cw and ca are the volumetric concentrations of CO2 in the dissolved phase and gasphase [cm3/cm3], respectively, Da is the effective soil matrix diffusion coefficient of CO2 inthe gas phase [cm2/ day], Dw is the effective soil matrix dispersion coefficient of CO2 in thedissolved phase [cm2 /day], qa is the soil air flux [cm/day], qw is the soil water flux [cm/day],and θa is the volumetric air content [cm3 /cm3]. The total aqueous phase CO2, cw, is the sumof aqueous CO2 and H2CO3, and is related to the CO2 concentration in the gas phase by(Stumm and Morgan 1981):
(15)pi0psi0sps f + f = + = Pii
∏γ∏γγγ
(16))( = wcwcadwdaT P + cS J + J + J + J
zt
c−
∂
∂−
∂
∂
(17) + wwaaT θθ cc = c
(18) +=)+(
wwwaaw
wwa
aawwaa P + c S c q
z cq
zz
cD
zz
cD
zt
cc
−
∂
∂−
∂
∂−
∂
∂θ
∂
∂
∂∂
θ∂
∂
∂
θθ∂
(19)T aHw c R K = c

Sodic soil reclamation 1231
where KH is the Henry’s Law constant, R is the universal gas constant (8.314 kg m2/s2 kmol), and T is the absolute temperature [K]. The value of KH as a function of temperatureis taken from Harned and Davis (1943). Substituting Eqn 19 into 18 gives:
where Rf is the CO2 retardation factor, DE is the effective dispersion coefficient for CO2 inthe soil [cm2/day], qE is the effective velocity of CO2 [cm/day], S* is the aqueous CO2
uptake rate [1/day] associated with root water uptake, and θa is the volumetric air content[cm3/cm3]. The model does not consider coupled water and air movement and the flux ofair, qa, must be specified using additional assumptions. The compressibility of the air isneglected since the gas phase is at or near atmospheric pressure throughout the unsaturatedzone. Assuming that the air flux is zero at the lower soil boundary and that water volumechanges in the soil caused by water flow are immediately matched by correspondingchanges in the gas volume, Simunek and Suarez (1993) obtained:
This flux assumption is reasonable, since when water leaves the soil due to evaporation androot water uptake, air enters the soil at the surface and when water enters the soil duringprecipitation and irrigation events, soil air is escaping. However, in the case of saturatedconditions (typically at the soil surface) air may be trapped and compressed under thewetting front.
Solute transport
Advective-dispersive chemical transport under transient flow conditions in partiallysaturated soil is expressed by (Suarez and Simunek 1996):
where cTi is the total dissolved concentration of the aqueous component i [M/cm3], c–Tiis the total adsorbed or exchangeable concentration of the aqueous component i [M/M], c Ti is the non-adsorbed solid phase concentration of aqueous component i [M/M], ρis the bulk density of the soil [Mg/cm3], D is the dispersion coefficient [cm2/day], q isthe volumetric flux [cm/day], and ns is the number of aqueous components. Thecoefficient D is the sum of the diffusion and dispersion components.
Chemical model
Chemical species
The chemical model currently includes consideration of 9 aqueous components: Ca, Mg,Na, K, SO4, Cl, alkalinity, NO3, and B. Alkalinity is defined as:
(20)= aaEa
Eaf P + c S* c q
zzD
zt
c R−
∂
∂−
∂
∂
∂
∂
∂
∂
c
(21))()((0))(r
wwa dzzS+ zq q = zqz
LL∫−
−
(22),ˆ
sTi
TiTiTiTi n 1 = i cqz
cD
zt
c
t
_c
t
c
−
∂
∂θ
∂
∂
∂
∂ρ
∂
∂ρ
∂
θ∂ =
+
+
(23) ]OH[ + ]H[_ ])
[B(OH + ]NaHCO[ +]NaCO2[ + ] MgHCO[ + ]MgCO[
+ ][CaHCO + ]CaCO2[ + ]CO2[ + ]HCO[ = Alkalinity
+4
033
+3
03
303
233
−−−
+−−

1232 D. L. Suarez
where brackets represent concentrations (mol/kg). From these components we obtain 11species Ca2+, Mg2+, Na+, K+, SO4
2+, Cl, HCO3–, CO3
2–, NO3–, H3BO3, and B(OH)4
–, andthe ion pair/complexes CaHCO3
+, CaCO30, CaSO4
0, MgHCO3+, MgCO3
0, MgSO40,
NaHCO30, NaCO3
–, NaSO4–, KHCO3
0, KCO3–, KSO4
–. It is assumed that all aqueousspecies are in equilibrium as defined by the ion association expressions and constants.Alkalinity as defined in Eqn 23 is a conservative species, affected only by dissolution orprecipitation of a carbonate phase (such as calcite). After calculating the air phase CO2partial pressure, the H2CO3
* (sum of aqueous CO2 and H2CO3) is calculated using Eqn 19. The equilibrium equations are solved using an iterative approach. The soil solution pH
is determined as a dependent variable [H] from solution of Eqn 23 and a charge balanceexpression and multiplication by the activity coefficient. All equilibrium constants arecalculated from available temperature-dependent expressions. Soil temperature iscalculated from a heat flow submodel, with input of air temperature, as discussed above.
Osmotic pressure
The osmotic pressure is used to calculate the impact of salinity on water uptake and plant yield. The osmotic pressure is calculated using the following equation:
where Pϕ is the osmotic pressure of the solution (Pa), v is the total number of moles of ionsgiven by one mole of electrolyte, Vs is the partial molal volume of the water, m0 is unitmolality, m is molality of the solution, ϕ is the osmotic coefficient of the solution and Ms isthe molar weight (Stokes 1979). The osmotic coefficient is calculated from (Pitzer 1973).
Activity coefficients
Activity coefficients are determined either using either an extended version of theDebye-Huckel equation (Truesdell and Jones 1974), or at high ionic strength, Pitzerequations (Pitzer 1973). The Pitzer approach considers ion–ion interactions for everyspecies in solution; thus, it does not consider the individual ion pairs and complexes suchas NaSO4 described above as a species. The model is considered suitable for prediction ofspecies activity in solutions up to 20 mol/kg.
Solid phases
The model considers a restricted set of solid phases; thus, it cannot be used to predict thecomposition of an evaporating brine. The minerals considered include calcite, gypsum,hydromagnesite, nesquehonite, and sepiolite. Since the model attempts to predict thecomposition of a water, predictions cannot be based only on thermodynamicconsiderations.
Calcite precipitation
The equilibrium condition of a solution with calcite in the presence of CO2 is describedby the expression:
(24)T0
s
s
mV
vmMRP
ϕϕ =
(25) )OH(
= )HCO( )Ca( 2CO22
1CO2CSP2
3+2
a
aP
K
KKK−
Sodic soil reclamation 1233
where parentheses denote activities, KCO2 is the Henry’s law constant for the solubility of
CO2 in water, Ka1 and Ka2 are the first and second dissociation constants of carbonic acidin water, KSP
C is the solubility product for calcite, and PCO2 is the partial pressure of CO2.
The equilibrium concentrations are obtained by solving the third-order equation. It has beenshown that waters below irrigated regions are supersaturated with respect to calcite (Suarez1977a; Suarez et al. 1992); thus, the equilibrium condition underestimates the Ca solubilityin soil water. The cause of supersaturation has been shown to be due to poisoning of crystalsurfaces by dissolved organic matter (Inskeep and Bloom 1986; Lebron and Suarez 1996).
Calcite crystal growth models are not applicable to soil systems, as the concentrationsof dissolved organic carbon (DOC) in near surface natural environments are usuallycomparable to levels found by Inskeep and Bloom (1986) to completely inhibit calcitecrystal growth. Lebron and Suarez (1996) developed a precipitation rate model whichconsiders the effects of DOC on both crystal growth and heterogeneous nucleation. Thecombined rate expression is given by:
where RT is the total precipitation rate, expressed in mmol/Ls, RCG is the precipitation raterelated to crystal growth, and RHN is the precipitation rate due to heterogeneous nucleation.Since for soil systems the crystal growth rate can be neglected, only nucleation is animportant process. The RHN term is given by:
where kHN is the precipitation rate constant due to heterogeneous nucleation, f(SA) is afunction of the surface area of the particles (e.g. clay) upon which heterogeneous nucleationoccurs (= 1.0 if no solid phase is present), Ω is the calcite saturation value, and 2.5 is the Ωvalue above which heterogeneous nucleation can occur. This equation leads to calciteprecipitation rates which are independent of the calcite surface area, consistent with theexperimental data of Lebron and Suarez (1996). For the purposes of saline and sodic soilreclamation it can be assumed that the nucleation rate is sufficiently fast such that theeffective calcite solubility can be taken at the point at which there is no further nucleation.This level of supersaturation is very close to the supersaturation (3-fold) based on fieldmeasurements (Suarez 1977).
Gypsum
The model allows specification of the initial presence of gypsum, requiring input of thequantity present (mmolc/kg). If gypsum is present in any soil layer at the given time step,the model forces the solution to gypsum equilibrium. The program tracks changes in theamount of gypsum present. If all the gypsum initially present is dissolved in a soil layer,such as during reclamation of a sodic soil, then gypsum equilibrium is no longer forced. Inall cases gypsum precipitates wherever supersaturation is indicated by solutioncalculations. The gypsum precipitation/dissolution expression is given by:
where γ represents the activity coefficient of the ion and the KSP is the solubility product insolution. To obtain equilibrium, i.e. when the ion activity product (IAP) is equal to thesolubility product KSP
G , we solve a quadratic equation based on Eqn 28. For the objectives
(26)HNCGT R + R = R
(27))DOC10](3.372.5))[log(( 1.144HNHN −−×−Ω SAfk = R
(28)) OH (
= ] SO [ ] Ca [2
2SO24Ca +2
SP24
+2 γγ −
− K

1234 D. L. Suarez
of this model it appears reasonable to assume that kinetics of gypsum dissolution/precipitation are sufficiently fast that the equilibrium condition can be used.
Magnesium precipitation
Dolomite precipitation is not considered by the present model since true dolomite hasnot been observed to precipitate at near earth surface conditions. It is also not reasonable toassume that a solution is dolomite-saturated merely because dolomite is present in the soilprofile. If dolomite is present in the soil, the model has an option to use the kineticexpressions of Busenberg and Plummer (1982) to represent the dissolution process. Thedissolution rate of dolomite is very slow, especially as the solution IAP values approachwithin 2–3 orders of magnitude of the solubility product. For purposes of sodic soilreclamation, dolomite dissolution kinetics may be omitted.
The model considers that Mg precipitation can occur as a carbonate or as a silicate. Sincethis is a predictive model, it considers only phases that either precipitate under earth surfaceconditions or occur frequently and are reactive under earth surface conditions. These neednot necessarily be the thermodynamically most stable phases. With this consideration,magnesite is neglected, as it apparently does not form under earth surface temperatures, isrelatively rare, and its dissolution rate is exceedingly small.
If nesquehonite or hydromagnesite saturation is reached, the model will precipitate thepredicted Mg carbonate. These phases will occur very infrequently. The Mg carbonateprecipitated, combined with calcite precipitation, will likely represent the mixed Ca–Mgprecipitate, called protodolomite, that is observed in hypersaline environments. However,the resulting solution composition is much different than that produced by simply forcingequilibrium with respect to dolomite. The precipitation of calcite + magnesium carbonateresults in solutions of approximately 3 orders of magnitude supersaturation with respect todolomite. This result is consistent with the high levels of dolomite supersaturationmaintained in high Mg waters (D. Suarez, unpublished data).
Precipitation (or dissolution, if present in the soil) of sepiolite is also considered by themodel. Sepiolite will readily precipitate into a solid with a KSP
S greater than that of well-crystallised sepiolite. Formation of this mineral requires high pH, high Mg concentrations,and low CO2 partial pressure. Details of the conditions for precipitation of magnesiumcontaining minerals are given in Suarez and Simunk (1997).
Cation exchange
Cation exchange is generally the dominant chemical process for the major cations insolution in the unsaturated zone. The model uses a Gapon-type expression of the form(White and Zelazny 1986):
where y and x are the respective valences of species i and j, and the overscoredconcentrations are those of the exchanger phase (molc /kg). It is assumed that the cationexchange capacity, cT (molc/kg), is constant, and for non-acid soils:
where the overscored concentrations are those of the exchanger phase (molc /kg).
(29)_
_
)(
)(1
i
1j
j
iij
/yy+
/xx+
x+
y+
c
c
c
c = K
(30)K + Na+Mg+Ca = +++2+2
T c

Sodic soil reclamation 1235
Experimentally determined selectivity values are not constant, nor is the cationexchange capacity, which varies as a function of pH, due to variable charge materials suchas organic matter. It has been observed that soils have an increased preference for Ca2+ overNa+, and Ca2+ over Mg+, at low levels of exchanger phase Ca2+. Suarez and Wood (1993)developed a mixing model which is able to approximate the nonconstant values of the soilselectivity coefficient by taking into account the organic matter content of the soil and usingthe published constant selectivity values for clay and organic matter. Calcium preferencedecreases as the organic matter exchanger sites (which have higher Ca preference thanclays) become Ca saturated. UNSATCHEM uses this approach by solving 2 sets ofequations for cation exchange (clay and organic matter).
Reclamation
Field experiment
The reclamation site, located in Riverside, California, consisted of a 40-ha field that wassaline and sodic. The soil is classified as Indio, very fine sandy loam, Hyperthermic TypicTorrifluvent; however, substantial parts of the field consisted of silt loam. The subsoil (at0.7–1 m) is described as silty clay loam with interstratified thin clay layers.
The initial electrical conductivity (ECa) distribution was mapped using a Geonics EM38, in both vertical and horizontal mode for obtaining spatial information with depth. Ateach sampling time 24 cores were taken at sites selected based on the EM survey. For eachof the 24 cores, 4 samples were collected at 30-cm intervals to a depth of 120 cm. For eachsample a saturation paste was prepared and the extract analysed for specific conductance(EC), Ca, Mg, Na, K, S (SO4) by ICP-ES, alkalinity by titration, and nitrate byspectrometric measurements.
The EC data were used for calibration to convert the ECa to ECe. Exchangeable cationsand cation exchange capacity were determined on selected samples using the saturationpastes and displacement of solution with 0.5 M ammonium nitrate. The exchangeable cation
0 10 20 30 40 50 60
EC (dS/m)
1.2
1.0
0.8
0.6
0.4
0.2
0.0
Dep
th (
m)
InitialFinal
Fig. 2. Median EC values with depth for both initial and final (after leaching)conditions. Reclamation consisted of application of 24 Mg/ha of gypsum andapplication of 114 cm of water. The dashed lines indicate the 95% confidencelimits of the median for the field.

1236 D. L. Suarez
content was corrected for carry over in the residual solution based on the saturation extractanalysis and residual water content. Calcite release due to calcite dissolution duringextraction was corrected using the alkalinity in the extract (Amrhein and Suarez 1990). Soiltexture was determined on the collected cores.
At the time of the initial survey the median salinity levels ranged from 50 dS/m in thetop 30 cm to 12.7 dS/m below 90 cm (Fig. 2). The median sodium adsorption ratio (SAR)values ranged from 144 in the top 30 cm to 94 below 90 cm (Fig. 3). The field was initiallyhighly variable in both salinity and SAR, as shown in Fig. 4a and b, respectively. Thesalinity profile was ‘inverted’, with the highest salinity at the surface, consistent with saltaccumulation by capillary rise from a shallow water table and surface evaporation.
Gypsum was applied to the soil in the field at a rate of 24 Mg/ha and disked to a depth ofapproximately 15 cm. A series of dikes were constructed to allow for ponding of water. Atotal depth of 114 cm of water was applied on the field in a series of 6 irrigation events overapproximately 3 months. The water was almost continuously ponded during September,October and November; thus, evaporation was estimated from open pan evaporation. Theestimated evaporation during those months was 19.3, 13.4, and 8.38 cm, for a total of 41 cmduring the reclamation time (D. Ackley, pers. comm.). The calculated water infiltrated was73 cm, after correction of the applied water for surface evaporation. The applied irrigationwater was from the Colorado River, with the composition as given in Table 1.
At the completion of leaching, the field was resurveyed using the EM-38 and anadditional 24 cores were taken to calibrate the EM-38 readings and to characterise the finalconditions. The median salinity levels after leaching ranged from 4.7 dS/m in the top 30 cmto 10.5 dS/m below 90 cm (Fig. 2) and the median SAR values ranged from 9 in the top 30cm to 54 below 90 cm (Fig. 3). The median SAR value of 9 in the top 30 cm of soils is justbelow the recommended reclamation value of SAR 10. The field data illustrate theheterogeneity of the reclamation, as after leaching only 52% of the field had an EC below4 dS/m and 26% of the field had an EC above 8 dS/m in the top 30 cm.
0 40 80 120 160 200
SAR
1.2
0.9
0.6
0.3
0.0
Dep
th (
m)
I n i t i a lFinal
Fig. 3. Median SAR values with depth for both initial and final (after leaching)conditions. Reclamation consisted of application of 24 Mg/ha of gypsum andapplication of 114 cm of water. The dashed lines indicate the 95% confidencelimits of the median for the field.

Sodic soil reclamation 1237
It is very time consuming to determine the CEC of calcareous soils; thus, it is notfeasible to measure the CEC of all samples and calculate a mean value. The mean CECcalculated for 6 soil samples taken from the 0–30 cm depth was 43.5 mmolc/kg. Theaverage clay of these samples was determined to be 13.2%. From these data the CEC of theclay was calculated to be 334 mmolc/kg. The mean CEC of the field was calculated from
<8.0
8.0−16.0
16.0−32.0
>32.0
ECe(dS/m)
SAR
<25.0
25.0−50.0
50.0−100.0
>100.0
EC initial
0.3−0.6 m0.0−0.3 m
SAR initial0.0−0.3 m 0.3−0.6 m
0.6−0.9 m 0.9−1.2 m
0.6−0.9 m 0.9−1.2 m
Fig. 4. (a) Initial EC distribution in the field, and (b) initial SARdistribution in the field.

1238 D. L. Suarez
the large data set (96) of available saturation percentages (SP), using the empirical equation(Rhoades et al. 1999):
and the CEC of soil clay determined. The mean CEC was determined as 65.3 mmolc/kg. Predictions of the final ECe with depth, based on the Hoffman (1980) relationship, were
not accurate based on the specified soil texture (Fig. 1). The sandy loam relationshipoverpredicted the extent of leaching, as twice as much water was required as predicted. Thisdiscrepancy is only in part due to the additional salt load generated by the dissolution ofgypsum. It is considered that there was a non-uniform application of water (D. Ackley, pers.comm.). Water was ponded in a series of strips along contour. Overfilling of the stripsresulted in redistribution of water into the downslope portions of the field. Differences ininfiltration rates within a ponded area were also likely. The drainage system was installedimmediately before application of the gypsum and leaching water. This analysis also doesnot account for the effects of spatial differences in measured hydraulic conductivity due totextural changes. Preferential water flow is not expected for these soils due to the lack ofcracking and dominant sandy loam texture.
Evaluation of the gypsum requirement was made using the recommendations given inHandbook 60 as well as those using Eqn 3. The mean CEC was taken as 65.3 mmolc/kg.The initial median ESP of 67 was calculated based on the SAR of the saturation extracts(using the relationship given in Handbook 60) Using the recommendation to reduce theESP to <10 along with the values in Table 6 (Handbook 60) results in a median gypsumrequirement of 16.1 Mg/ha to reclaim the top 30 cm of soil. The median gypsumrequirement is 19.2 based on Eqn 3 and using a bulk density of 1.4 and an efficiency factorof 1.2.
The median gypsum requirement is not entirely satisfactory as there were portions of thefield at very high SAR and gypsum requirement. It was calculated that 40% of the field wasat an SAR of >200, corresponding to an ESP of >75, and the CEC ranged from 20 to 96mmolc/kg. Based on the CEC and SAR distribution it is estimated that 25% of the field hada gypsum requirement of 28.5 Mg/ha.
Model simulation
Validation of the processes represented in a model requires a controlled set of experiments.Field experiments serve a useful purpose in that they represent actual conditions that mayinclude additional factors and processes not considered in controlled experiments. Theability of UNSATCHEM to predict changes in soil water content and thus water flow at thefield scale, as well as CO2 concentration in the root-zone, has been demonstrated earlier
(31)627.25)/0.7(SP%clay −=
Table 1. Solution and exchange phase composition used in the field simulation
Depth Ca Mg Na K Alkalinity Cl SO4 XCaA XMg
A XNaA
(cm) (mmolc/L) (mmolc/kg)
Irrigation water 2.00 1.00 2.00 0.10 1.50 2.00 1.600–30 11.3 11.7 523 3.03 6.03 350 193 12.5 8.02 41.7
30–60 6.41 7.18 300 3.01 6.60 140 170 14.9 9.93 37.060–90 1.82 1.73 141 2.01 8.56 57.0 81.0 16.7 10.7 34.090–120 2.23 2.12 134 1.37 7.72 50.0 82.0 18.2 11.6 31.7
AX denotes exchangeable ion.

Sodic soil reclamation 1239
(Suarez and Simunek 1993). The capability of various models to predict reclamation is lesscertain. Suarez and Dudley (1998) examined the predictions of 3 models to simulate thechemistry of a soil irrigated with sodic water. There were large differences in the modelpredictions of EC and exchange ion composition.
Dudley et al. (1981) observed a poor relation between predicted and observedconcentrations of Ca and Cl in irrigated field plots using the SALTFLO model. Even undercontrolled experimental conditions, variations in soil properties and infiltration may besufficiently large to discourage use of such simulations using average properties and asingle 1-dimensional simulation.
Simulation of the reclamation of the field using UNSATCHEM was done using the fieldvalues of CEC, ESP initial solution, and applied and infiltrated water. The initial soilsolution and exchange phase conditions used for the simulation are presented in Table 1.The simulations used a CO2 partial pressure of 0.5 kPa, and soil temperature of 25°C. TheCa/Na selectivity coefficient of 4.0 was used to establish SAR–ESP relationshipscompatible with those in USDA Handbook 60 (US Salinity Laboratory Staff 1954).
As shown by a comparison of the field data (Final) in Fig. 2 with the model predictionsin Fig. 5, there was an overprediction of the extent of leaching if we consider only appliedwater, uncorrected for surface evaporation. The predicted EC after leaching was 0.8 and1.31 dS/m in the top 30 and 60 cm of soil, respectively. Similarly, the predicted SAR afterapplication of 114 cm of leaching water (Fig. 6) was lower than the observed SAR (Fig. 3).The calculated infiltration values of 70–80 cm of water were used in all subsequentsimulations.
The effective reclamation can be evaluated by first examining the Cl distribution afterleaching with the Cl distribution simulated by the model. In these soils Cl can be utilisedas a non-reactive tracer for water flow. As shown in Fig. 7, the predicted Cl distribution ishighly dependent on the amount of water infiltrated. The mean Cl distribution measuredafter reclamation was well predicted by the model simulation after infiltration of 80 cm ofwater. This value is consistent with the 73 cm of water calculated as water infiltrated.
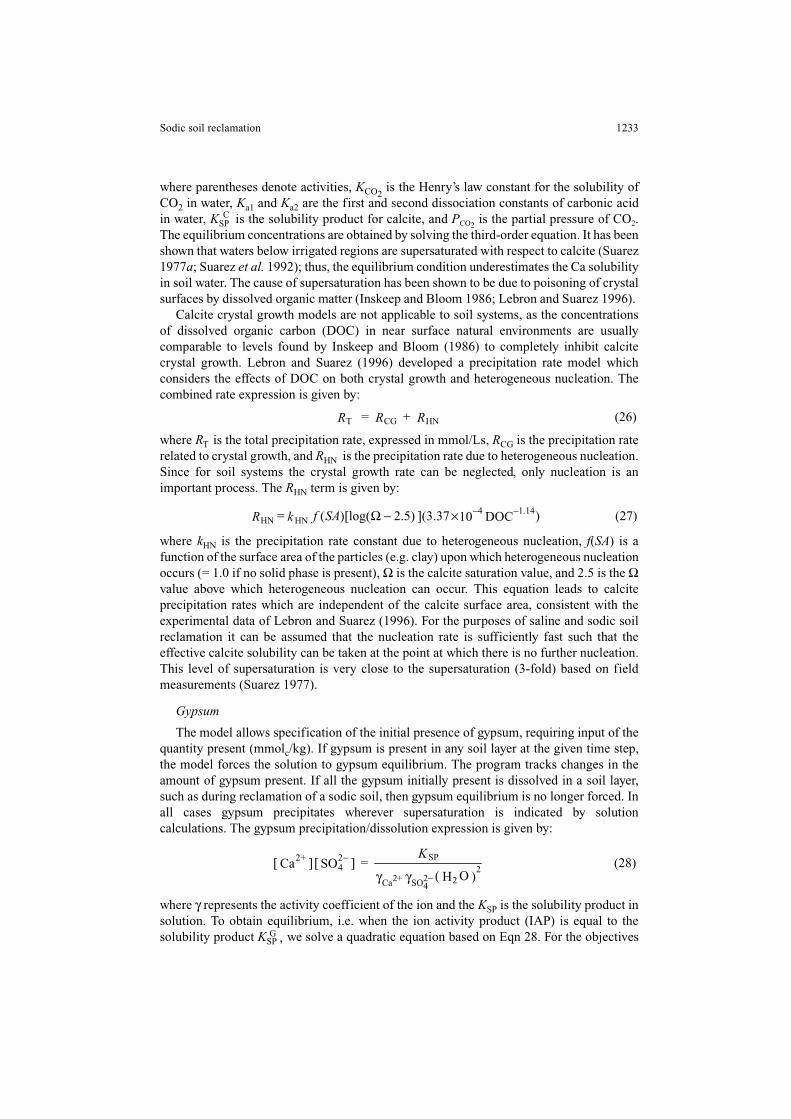
Based on the data and simulation of EC presented in Fig. 8, it is considered that themodel provided a good prediction of EC for all but the uppermost depth, where the
0 10 20 30 40 50 60
EC (dS/m)
1.2
1.0
0.8
0.6
0.4
0.2
0.0
Dep
th (
m)
Initial
0.5
1.14
0.2 m water
Fig. 5. Model predicted changes in salinity with depth after mixing 24Mg/ha of gypsum into the top 15 cm and leaching with 20, 50, and 114 cmof water.

1240 D. L. Suarez
measured value of 4.7 dS/m is contrasted with the 1.61 predicted value, and outside the 95%confidence limits. Since the EC–leaching relationship is not linear (see Fig. 1), thisdifference may be due to the construction of mean values from a spatially variablepopulation.
The prediction of SAR, shown in Fig. 9, was a reasonable fit to the observed data, andis considered satisfactory for its purpose of evaluating various management decisions. Thetop 30 cm had a predicted SAR of 5.6 in contrast to the measured value of 9.4, but this valueis just outside the 95% confidence limits of the measured mean. Predictions at the other 3depths are also within or close to the confidence limits of the field measurements. These
0 40 80 120 160
SAR
1.2
1.0
0.8
0.6
0.4
0.2
0.0
Dep
th (
m) 0.5
1.14
0.2 m waterInitial
0 50 100 150 250 300 350
Chloride (mmolc/L)
1.2
1.0
0.8
0.6
0.4
0.2
0.0
Dep
th (
m)
Initial
1.14
0.8 m water
Measured ----
Fig. 6. Model predicted changes in SAR with depth after mixing 24 Mg/ha gypsum into the top 15 cm and leaching with 20, 50, and 114 cm ofwater.
Fig. 7. Distribution of measured Cl concentration with depth before and afterreclamation, and model predicted distributions after infiltration of 70 and 114 cmof water.
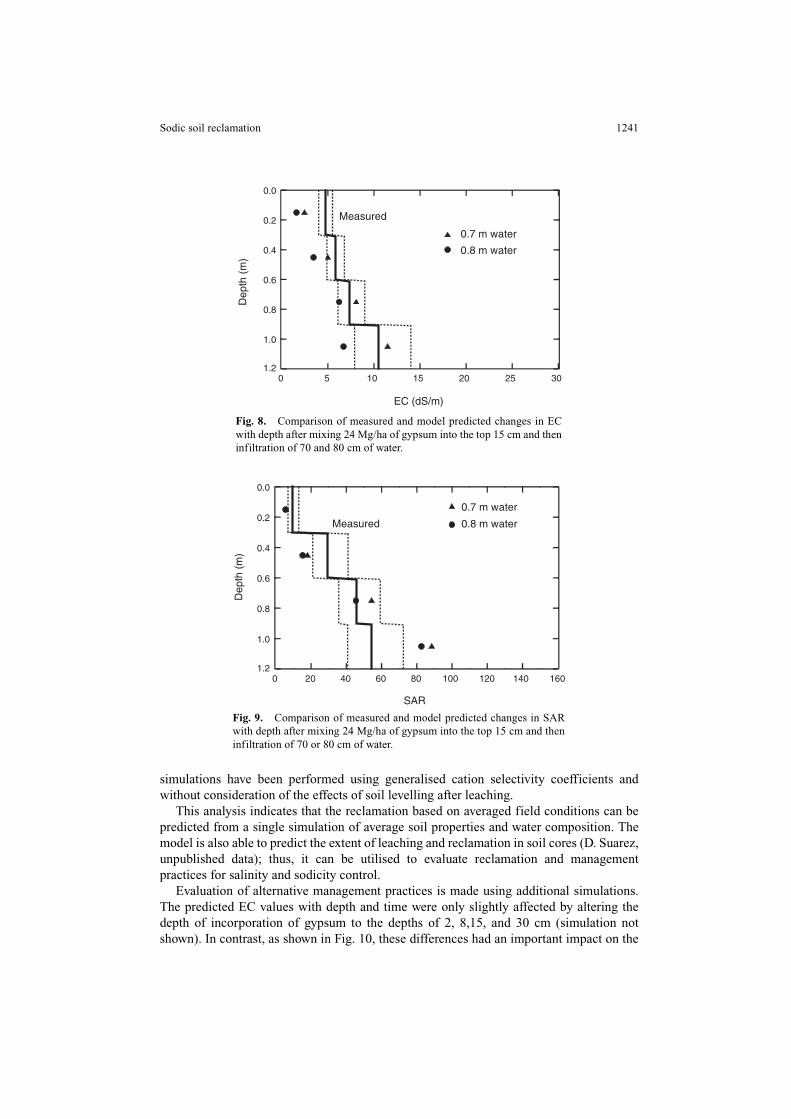
Sodic soil reclamation 1241
simulations have been performed using generalised cation selectivity coefficients andwithout consideration of the effects of soil levelling after leaching.
This analysis indicates that the reclamation based on averaged field conditions can bepredicted from a single simulation of average soil properties and water composition. Themodel is also able to predict the extent of leaching and reclamation in soil cores (D. Suarez,unpublished data); thus, it can be utilised to evaluate reclamation and managementpractices for salinity and sodicity control.
Evaluation of alternative management practices is made using additional simulations.The predicted EC values with depth and time were only slightly affected by altering thedepth of incorporation of gypsum to the depths of 2, 8,15, and 30 cm (simulation notshown). In contrast, as shown in Fig. 10, these differences had an important impact on the
0 5 10 15 20 25 30
EC (dS/m)
1.2
1.0
0.8
0.6
0.4
0.2
0.0
Dep
th (
m)
Measured
0.7 m water
0.8 m water
0 20 40 60 80 100 120 140 160
SAR
1.2
1.0
0.8
0.6
0.4
0.2
0.0
Dep
th (
m)
Measured
0.7 m water
0.8 m water
Fig. 8. Comparison of measured and model predicted changes in ECwith depth after mixing 24 Mg/ha of gypsum into the top 15 cm and theninfiltration of 70 and 80 cm of water.
Fig. 9. Comparison of measured and model predicted changes in SARwith depth after mixing 24 Mg/ha of gypsum into the top 15 cm and theninfiltration of 70 or 80 cm of water.
1242 D. L. Suarez
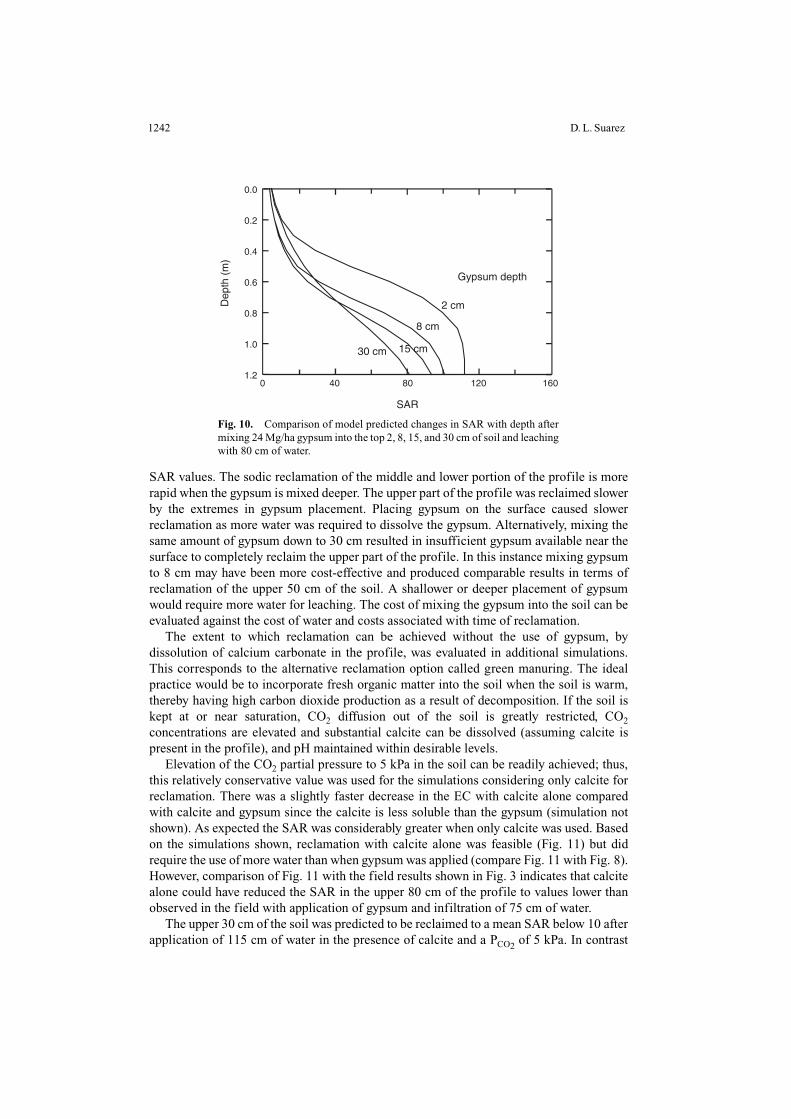
SAR values. The sodic reclamation of the middle and lower portion of the profile is morerapid when the gypsum is mixed deeper. The upper part of the profile was reclaimed slowerby the extremes in gypsum placement. Placing gypsum on the surface caused slowerreclamation as more water was required to dissolve the gypsum. Alternatively, mixing thesame amount of gypsum down to 30 cm resulted in insufficient gypsum available near thesurface to completely reclaim the upper part of the profile. In this instance mixing gypsumto 8 cm may have been more cost-effective and produced comparable results in terms ofreclamation of the upper 50 cm of the soil. A shallower or deeper placement of gypsumwould require more water for leaching. The cost of mixing the gypsum into the soil can beevaluated against the cost of water and costs associated with time of reclamation.
The extent to which reclamation can be achieved without the use of gypsum, bydissolution of calcium carbonate in the profile, was evaluated in additional simulations.This corresponds to the alternative reclamation option called green manuring. The idealpractice would be to incorporate fresh organic matter into the soil when the soil is warm,thereby having high carbon dioxide production as a result of decomposition. If the soil iskept at or near saturation, CO2 diffusion out of the soil is greatly restricted, CO2
concentrations are elevated and substantial calcite can be dissolved (assuming calcite ispresent in the profile), and pH maintained within desirable levels.
Elevation of the CO2 partial pressure to 5 kPa in the soil can be readily achieved; thus,this relatively conservative value was used for the simulations considering only calcite forreclamation. There was a slightly faster decrease in the EC with calcite alone comparedwith calcite and gypsum since the calcite is less soluble than the gypsum (simulation notshown). As expected the SAR was considerably greater when only calcite was used. Basedon the simulations shown, reclamation with calcite alone was feasible (Fig. 11) but didrequire the use of more water than when gypsum was applied (compare Fig. 11 with Fig. 8).However, comparison of Fig. 11 with the field results shown in Fig. 3 indicates that calcitealone could have reduced the SAR in the upper 80 cm of the profile to values lower thanobserved in the field with application of gypsum and infiltration of 75 cm of water.
The upper 30 cm of the soil was predicted to be reclaimed to a mean SAR below 10 afterapplication of 115 cm of water in the presence of calcite and a PCO2
of 5 kPa. In contrast
0 40 80 120 160
SAR
1.2
1.0
0.8
0.6
0.4
0.2
0.0
Dep
th (
m)
2 cm
8 cm
15 cm30 cm
Gypsum depth
Fig. 10. Comparison of model predicted changes in SAR with depth aftermixing 24 Mg/ha gypsum into the top 2, 8, 15, and 30 cm of soil and leachingwith 80 cm of water.

Sodic soil reclamation 1243
the reclamation of the upper 30 cm of soil to below SAR 10 was predicted after only 48 cmof water when 24 Mg/ha of gypsum was applied to the top 15 cm of soil. Reclamation withcalcium carbonate alone is feasible but requires about twice as much water. This estimateis comparable to that observed in field studies comparing reclamation using greenmanuring and gypsum reclamation of a sodic soil (Manzoor Qadir, pers. comm., 2001). Ifthe CO2 partial pressure is only 0.5 kPa, then based on the simulations, it is predicted thatreclamation will require application of 150 cm of water.
Earlier Oster and Frenkel (1980) calculated that in the presence of gypsum, an increasein CO2 partial pressure from 1 to 4 kPa only increased by 5% the depth reclaimed. Thissmall effect is due to the common ion effect that suppresses calcite dissolution in thepresence of gypsum. However in the absence of gypsum we determined that there is a largePCO2
effect on Na replacement.
0 40 80 120 160
SAR
1.2
1.0
0.8
0.6
0.4
0.2
0.0
Dep
th (
m)
0.2 m water
0.5 m
0.8 m
1.14 m
0 10 20 30 40 50
Alkalinity (mmolC/L)
1.2
1.0
0.8
0.6
0.4
0.2
0.0
Dep
th (
m)
0.2 m water0.5 m
0.8 m 1.14 m
Fig. 11. Model predicted changes in SAR with depth after elevating theCO2 to 5 kPa in the presence of calcite, then leaching with 20,50, 80, and114 cm of water.
Fig. 12. Model predicted alkalinity concentrations (mmolc/L) with depthafter elevating the CO2 to 5 kPa in the presence of calcite, and thenleaching with 20, 50, 80, and 114 cm of water.
1244 D. L. Suarez
The extent to which calcite acts as a Ca source can be evaluated by examination of thealkalinity in the profiles. As shown in Fig. 12 concentrations of alkalinity as high as 32mmolc/L are predicted. This corresponds to release of 32 mmolc/L of Ca from calcite inaddition to the Ca present in the irrigation water that is not associated with alkalinity.Elevated alkalinity occurs as a result of Ca adsorption on the exchange sites, reducing Cain solution and allowing for further calcite dissolution. Once exchange is complete, thealkalinity concentrations decrease to around 5 mmolc/L.
This analysis suggests that in terms of Na replacement, gypsum use could have beenavoided, and furthermore that the reclamation effort should have more thoroughlyconsidered water application uniformity and time of year for leaching. Uniform applicationof 48 cm of water during a period of low evaporation would have enabled the top 30 cm ofthe soil to be sufficiently reclaimed in terms of salinity and SAR. The only hazardassociated with this management practice is that the EC must be sufficiently high and pHsufficiently low during reclamation to maintain soil structural stability until the SARdecreases to a safe level.
An important consideration when using calcite as the Ca source for reclamation is thatthe EC–SAR combination remain suitable to maintain good soil structure and aggregatestability. In these simulations UNSATCHEM predicted that the hydraulic conductivity ofthe soil was reduced to as low as 30% of the optimal value during reclamation in theabsence of gypsum and at PCO2
of 5 kPa. This reduction was due to the initial decrease inEC while the SAR was still relatively high. The reduction in hydraulic conductivityremained until about 150 cm of water had passed through the profile. In addition to theextra time required for leaching, it is not clear that the adverse chemical effects on hydraulicconductivity would be reversible under field conditions.
The importance of maintaining high CO2 concentrations during sodic soil reclamation inthe absence of gypsum is further illustrated by results of hydraulic conductivity predictionsat PCO2
of 0.5 kPa. In this instance the hydraulic conductivity of the most affected layers(below 120 cm), and thus the infiltration, was reduced to <4% of the optimal value. Clearlyreclamation would not be successful under these conditions. The required infiltration of 150cm of water would require up to 5 years. The additional adverse effect of reduced CO2 wasdue to the relatively greater pH as well as the elevated SAR. The larger PCO2
(5 kPa) served tokeep the pH below 7.8 at all times, while at 0.5 kPa the pH rose to above 8.4.
These simulations illustrate how the model can be used as a management tool at the fieldlevel both to evaluate an existing practice and to predict the results of alternative practices.In this instance water use could have been reduced by almost 50% with improveduniformity in application and avoiding reclamation during periods of highevapotranspiration. In this instance it may also have been possible to avoid the expense ofgypsum application.
Representation of the spatial variation in EC and SAR after reclamation is important butclearly not possible if we use average field values as was done in this analysis. However, ifwe were to consider the spatial distribution of the water inputs and hydraulic properties andinitial soil conditions it would be possible to run the UNSATCHEM model at numerouslocations and then create a spatial map of the predicted distributions. Such maps could beused to develop precision reclamation and management practices for a field.
Acknowledgments
The author appreciates the assistance of Scott Lesch in collection of EM data anddevelopment of the EC and SR maps, and Nahid Vishteh in analysis of soil samples.

Sodic soil reclamation 1245
References
Amrhein CA, Suarez DL (1990) A procedure for determining sodium-calcium selectivity in calcareous andgypsiferous soils. Soil Science Society of America Journal 54, 999–1007.
Busenberg E, Plummer LN (1982) The kinetics of dissolution of dolomite in CO2–H2O systems at 1.5 to65 C and 0 to 1 ATM PCO2. American Journal of Science 282, 45–78.
Carsel RF, Parrish RS (1988) Developing joint probability distributions of soil water retentioncharacteristics. Water Resources Research 24, 755–769.
Dudley LM, Wagenet RJ, Jurinak JJ (1981) Description of soil chemistry during transient solute transport.Water Resources Research 17, 1498–1504.
van Genuchten MTh (1980) A closed-form equation for predicting the hydraulic conductivity ofunsaturated soils. Soil Science Society of America Journal 44, 892–898.
Harned HS, Davis Jr, R (1943) The ionization constant of carbonic acid and the solubility of carbon dioxidein water and aqueous salt solutions from 0 to 50 C. Journal of American Chemical Society 653, 2030–2037.
Hoffman GJ (1980) Guidelines for the reclamation of salt- affected soils. In ‘Proceedings of the 2ndInterAmerican Conference on Salinity and Water Management’. Juarez, Mexico. (Ed. GA O’Conner)pp. 49–64.
Inskeep WP, Bloom PR (1986) Kinetics of calcite precipitation in the presence of water soluble organicligands. Soil Science Society of America Journal 50, 1167–1172.
Lebron I, Suarez DL (1996) Calcite nucleation and precipitation kinetics as affected by dissolved organicmatter at 25°C and pH >7.5. Geochimica et Cosmoschimica Acta 60, 2767–2776.
McNeal BL (1968) Prediction of the effect of mixed-salt solutions on soil hydraulic conductivity. SoilScience Society of America Proceedings 32, 190–193.
Oster JD, Frenkel H (1980) The chemistry of the reclamation of sodic soils with gypsum and lime. SoilScience Society of America Journal 44, 41–45.
Oster JD, Jayawardane NS (1998) Agricultural management of sodic soils. In ‘Sodic soils’. (Eds MESumner, R Naidu) pp. 125–147. (Oxford University Press: New York)
Pitzer KS (1973) Thermodynamics of electrolytes I: Theoretical basis and general equations. Journal ofPhysical Chemistry 77, 268–277.
Rhoades JD, Chanduvi F, Lesch SM (1999) Salinity assessment: Methods and interpretation of electricalconductivity measurements. Procedure for interpreting soil salinity. p. 53. (Food and AgricultureOrganization: Rome)
Shainberg I, Levy GJ (1992) Physico-chemical effects of salts upon infiltration and water movement insoils, In ‘Interacting processes in soil science’. (Eds RJ Wagenet, P Baveye, BA Stewart) (LewisPublishers, CRC Press: Boca Raton, FL)
Simunek J, Suarez DL (1993) Modeling of carbon dioxide transport and production in soil:1. Modeldevelopment. Water Resources Research 29, 487–497.
Simunek J, Suarez DL (1996) UNSATCHEM Code for simulating the one-dimensional variably saturatedwater flow, heat transport, carbon dioxide production and transport, and multicomponent solutetransport with major ion equilibrium and kinetic chemistry, Part A. US Salinity Laboratory ResearchReport No. 128, US Salinity Laboratory USDA, Riverside, CA.
Simunek J, Suarez DL (1997) Sodic soil reclamation using multicomponent transport modeling. Journal ofIrrigation and Drainage Engineering 123, 367–376.
Stokes RH (1979) Thermodynamics of solutions, In ‘Activity coefficients in electrolyte solutions’. (Ed. RMPytkowicz) pp. 1–62. (CRC Press, Inc.: Boca Raton, FL)
Stumm W, Morgan JJ (1981) ‘Aquatic chemistry: An introduction emphasizing chemical equilibria innatural waters.’ (John Wiley and Sons: New York)
Suarez DL (1977) Ion activity products of calcium carbonate in waters below the root zone. Soil ScienceSociety of America Journal 41, 310–315.
Suarez DL, Dudley LM (1998) Hydrochemical considerations in modeling modeling water quality withinthe vadose zone. In. ‘Agroecosystems and the environment: Sources, control and remediation ofpotentially toxic trace element oxyanions’. (Eds L Dudley, J Guitjens) (American Association for theAdvancement of Science—Pacific Division: San Francisco)
Suarez DL, Rhoades JD, Lavado R, Grieve CM (1984) Effect of pH on saturated hydraulic conductivity andsoil dispersion. Soil Science Society of America Journal 48, 50–55.
Suarez DL, Simunek J (1993) Modeling of carbon dioxide transport and production in soil: 2. Parameterselection, sensitivity analysis and comparison of model predictions to field data. Water ResourcesResearch 29, 499–513.

1246 D. L. Suarez
http://www.publish.csiro.au/journals/ajsr
Suarez DL, Simunek J (1996) Solute transport modeling under variably saturated water flow conditions. In‘Reactive transport in porous media, Reviews in mineralogy’. (Eds P Lichtner, CI Steefel, EH Oelkers)pp. 229–268. (MSA: Washington, DC)
Suarez DL, Simunek J (1997) UNSATCHEM: Unsaturated water and solute transport model withequilibrium and kinetic chemistry, Soil Science Society of America Journal 61, 1633–1646.
Suarez DL, Wood JD (1993) ‘Predicting Ca-Mg exchange selectivity of smetitic soils’. Agronomy Abstractp. 236. (American Society of Agronomy: Madison, WI)
Suarez DL, Wood JD, Ibrabim I (1992) Reevaluation of calcite supersaturation in soils. Soil Science Societyof America Journal 56, 1776–1784.
Truesdell AH, Jones BF (1974) WATEQ, a computer program for calculating chemical equilibria of naturalwaters. Journal Research, U.S. Geological Survey 2, 233–248.
US Salinity Laboratory Staff (1954) ‘Diagnosis and improvement of saline and alkali soils.’ USDAHandbook 60. (US Government Printing Office: Washington, DC)
White N, Zelazny LW (1986) Charge properties in soil colloids. In ‘Soil physical chemistry’. (Ed. DLSparks) pp. 39–81. (CRC Press: Boca Raton, FL)
Manuscript received 27 October 2000, accepted 13 August 2001