Embed Size (px)
Citation preview

Sociology Program Review 2011-2012
Page 1 Section 1: Program Description 10/26/2011
1. Program Description A. Description
Sociology is the scientific study of human behavior in groups and the social forces that influence that behavior. The Sociology program offers a diverse curriculum in an effort to provide students with the tools necessary to comprehend their social world, using sociological theory and methodology to focus on the building blocks of the social structure and culture. The program includes courses that explore how social institutions play integral roles in our society, how class, race, ethnicity, and gender interact with these fundamental social institutions, the inequalities that exist in society, the importance of norms and values, the deviations therein, and the origins of social problems, their potential solutions, and the challenge to the status quo. Upon completion of a sociology course, the student will have a greater understanding of her/his part in the social world, enhancing interpersonal relationships and relationships to the social structure. A student graduating with an Associate of Arts in Sociology may transfer to a four-year institution to complete a Bachelor's Degree. Because of the broad scope of subject matter, sociology is excellent preparation for a wide range of career paths, including teaching, journalism, law, business, communications, non-profit management, corrections/law enforcement, and employment in the human services fields. (Human Services): Human Services is a course of study for those interested in employment in such diverse settings as group homes and halfway houses; correctional, develop mental disability agencies, and community mental health centers; family, child, and youth service agencies and programs concerned with alcoholism, drug abuse, family violence, homelessness, aging or other social issues. The primary focus of the human service worker is to assist individual and communities to function as effectively as possible in the major domains of living as case managers, advocates, grant writers, youth workers, volunteer coordinators, human resource specialists, fundraisers, trainers, para-educators or advocacy. The Human Services AA and certificate programs are structured around interrelated components including: theoretical foundations/intervention strategies; client population/cultural diversity; research /evaluation; and skill development/field experience. Successful completion of appropriate coursework will enable students to either further their education, seek employment in a variety of social service organizations or both. B. Program Student Learning Outcomes - Successful students in the program are able to:
1. Demonstrate comprehension of the major sociological theories and relevant concepts. 2. Demonstrate comprehension of the scientific method, the variety and appropriateness of
research designs and the application and interpretation of the findings. 3. Critically evaluate and apply theoretical concepts to specific cultural phenomenon past and
present.
Program Student Learning Outcomes (Human Services)
4. Conceptual understanding of system concepts, theories and techniques that are foundational to the practice of human/social services.
5. Demonstrate understanding of assessment methods, treatment planning and case management.
6. Demonstrate understanding of recovery oriented behavior health services.

Sociology Program Review 2011-2012
Page 2 Section 1: Program Description 10/26/2011
C. College Level Student Learning Outcomes
1. Critical thinking and problem solving 2. Communication 3. Information Competency
Program Student Learning Outcomes (Human Services)
4. Critical thinking and problem solving 5. Social interaction and life skills 6. Information competency
D. Estimated Costs (Required for Certificate of Achievement ONLY)
Cost
Enrollment Fees N/A
Books N/A
Supplies N/A
Total N/A E. Criteria Used for Admission
No pre-requisites F. Vision
Ventura College will be a model community college known for enhancing the lives and economic futures of its students and the community. G. Mission
Ventura College, one of the oldest comprehensive community colleges in California, provides a positive and accessible learning environment that is responsive to the needs of a highly diverse student body through a varied selection of disciplines, learning approaches and teaching methods including traditional classroom instruction, distance education, experiential learning, and co-curricular activities. It offers courses in basic skills; programs for students seeking an associate degree, certificate or license for job placement and advancement; curricula for students planning to transfer; and training programs to meet worker and employee needs. It is a leader in providing instruction and support for students with disabilities. With its commitment to workforce development in support of the State and region's economic viability, Ventura College takes pride in creating transfer, career technical and continuing education opportunities that promote success, develop students to their full potential, create lifelong learners, enhance personal growth and life enrichment and foster positive values for successful living and membership in a multicultural society. The College is committed to continual assessment of learning outcomes in order to maintain high quality courses and programs. Originally landscaped to be an arboretum, the College has a beautiful, park-like campus that serves as a vital community resource.

Sociology Program Review 2011-2012
Page 3 Section 1: Program Description 10/26/2011
H. Core Commitments
Ventura College is dedicated to following a set of enduring Core Commitments that shall guide it through changing times and give rise to its Vision, Mission and Goals.
Student Success
Respect
Integrity
Quality
Collegiality
Access
Innovation
Diversity
Service
Collaboration
Sustainability
Continuous Improvement I. Degrees/Certificates
Program’s courses are designed to articulate to UC and CSU for transfer students. There are now Associates of Arts Sociology and Associates of Arts Human Services degree. Additionally, there are four proficiency awards in Human Services. J. Program Strengths, Successes, and Significant Events
The Sociology Program worked in conjunction with the Academic Senate and Curriculum Committee to develop a Associates of Arts degree in Sociology (Spring 2011). The Sociology Program acquired a full-time faculty member whom will teach in both Sociology and Human Services programs. The new faculty member will also be facilitating the Human Services Program. The Sociology Club was re-established formally as both an ASVC and ICC member club on campus. The club offered several community based opportunities, such as, The Body Image Day, Ventura County Sheriff Forum, AIDS Walk, Beach Cleanup, voter registration drive, hosted a California gubernatorial candidate, to name just a few. The Sociology Program faculty spearheads speakers within their classroom and opens them to the wider college community. Additionally, faculty as offered access to field trips to the Museum of Tolerance within a Learning Community connected with Criminal Justice courtesy of the Educational Enhancement Grant. The Sociology Program is a campus leader in coordinating and organizing Service Learning opportunities for their students.

Sociology Program Review 2011-2012
Page 4 Section 1: Program Description 10/26/2011

Sociology Program Review 2011-2012
Page 5 Section 1: Program Description 10/26/2011
K. Organizational Structure President: Robin Calote Executive Vice President: Ramiro Sanchez Dean: Gwendolyn Lewis-Huddleston Department Chair: Mark Pauley
Instructors and Staff
Name Albert Chen Classification Associate Professor Year Hired 2007 Years of Work-Related Experience Degrees/Credentials A.A., B.A., M.A.
Name Andrea Horigan Classification Assistant Professor Year Hired 2011 Years of Work-Related Experience Degrees/Credentials B.A., M.A.
Name Lauri Moore Classification Professor Year Hired 1996 Years of Work-Related Experience Degrees/Credentials A.A., B.A., M.A.
Name Classification Year Hired Years of Work-Related Experience Degrees/Credentials

Sociology Program Review 2011-2012
Page 6 Section 2: Performance Expectation 10/26/2011
2. Performance Expectations A. Program Student Learning Outcomes - Successful students in the program are able to:
1. Demonstrate comprehension of the major sociological theories and relevant concepts. 2. Demonstrate comprehension of the scientific method, the variety and appropriateness of
research designs and the application and interpretation of the findings. 3. Critically evaluate and apply theoretical concepts to specific cultural phenomenon past and
present. B. Student Success Outcomes
1. The program will increase its retention rate from the average of the program’s prior three-year retention rate. The retention rate is the number of students who finish a term with any grade other than W or DR divided by the number of students at census. 2. The program will increase its retention rate from the average of the college’s prior three-year retention rate. The retention rate is the number of students who finish a term with any grade other than W or DR divided by the number of students at census. 3. The program will increase the student success rates from the average of the program’s prior three-year success rates. The student success rate is the percentage of students who receive a grade of c or better. 4. The program will increase the student success rates from the average of the college’s prior three-year success rates. The student success rate is the percentage of students who receive a grade of C or better.
C. Program Operating Outcomes
1. The program will maintain WSCH/FTEF above the 525 goal set by the district. 2. Inventory of instructional equipment is functional, current, and otherwise adequate to maintain a quality-learning environment, currently no cost. 3.

Sociology Program Review 2011-2012
Page 7 Section 2: Performance Expectation 10/26/2011
D. Courses to Student Learning Outcomes Map
Course to Program-Level Student Learning Outcome Mapping (CLSLO) I: This program-level student learning outcome is INTRODUCED is this course. P: This program-level student learning outcome is PRACTICED in this course. M: This program-level student learning outcome is MASTERED in this course. Leave blank if program-level student learning outcome is not addressed.
Courses
PLSLO #1
PLSLO #2
PLSLO #3
SOC V01 M I I
SOC V01SL P P P
SOC V02 M I P
SOC V02SL P P P
SOC V03 M I M
SOC V04 M I M
SOC V05 I I P
SOC V07 I M P
SOC V13 M I P
SOC V24 M I M
SOC V31 M I P
SOC V88 I I P
SOC V89 I I P
SOC V90 I I P
SOC V95 I I P
SOC V96 I I P
HMS V50 I/P/M I/P/M I/P/M
HMS V51 I/P/M I/P/M I/P/M
HMS V52 I/P/M I/P/M I/P/M
HMS V53 I/P/M I/P/M I/P/M

Sociology Program Review 2011-2012
Page 8 Section 3: Operating Information 10/26/2011
3. Operating Information A1: Budget Summary Table To simplify the reporting and analysis of the Banner budget detail report, the budget accounts were consolidated into nine expense categories. The personnel categories include employee payroll expenses (benefits). The “3 Year Average” was computed to provide a trend benchmark to compare the prior three year expenses to the FY11 expenses. The “FY11 College” expense percentages are included to provide a benchmark to compare the program’s expenses to the overall college expenses.
A2: Budget Summary Chart This chart illustrates the program’s expense trends. The data label identifies the FY11 expenses (the last bar in each group). The second-to-last bar is the program’s prior three year average.
Category Title FY08 FY09 FY10
3 Year
Average FY11
FY11
Program
FY11
College
1 FT Faculty 156,601 199,472 173,692 176,588 217,100 23% 12%
2 PT Faculty 177,069 194,164 225,555 198,929 203,241 2% -10%
4 Students 2,530 4,007 5,210 4,521 10%
7 Supplies 1,713 744 1,464 1,307 - -100% 24%
8 Services 1,300 200 206 569 148 -74% -17%
9 Equipment 935 607 - 771 - -100% -42%
Total 340,148 399,194 406,127 381,823 425,010 11% 0%
-
50,000
100,000
150,000
200,000
250,000
FT Faculty PT Faculty Students Supplies Services Equipment
217,100 203,241
4,521 - 148 -
Sociology: Budget Expenditure Trends
FY08 FY09 FY10 3 Year Average FY11

Sociology Program Review 2011-2012
Page 9 Section 3: Operating Information 10/26/2011
A3: Comparative Budget Changes Chart This chart illustrates the percentage change from the prior three year average expense to the FY11 expenses. The top bar for each budget category represents the program’s change in expenses and includes the data label. The second bar represents the college’s change in expenses.
A4: Budget Detail Report The program’s detail budget information is available in Appendix A – Program Review Budget Report. This report is a PDF document and is searchable. The budget information was extracted from the District’s Banner Financial System. The program budget includes all expenses associated to the program’s Banner program codes within the following funds: general fund (111), designated college equipment fund (114-35012), State supplies and equipment funds (128xx), and the technology refresh fund (445). The Program Review Budget Report is sorted by program (in alphabetical order) and includes the following sections: total program expenses summary; subtotal program expenses for each different program code; detail expenses by fund, organization and account; and program inventory (as posted in Banner). To simplify the report, the Banner personnel benefit accounts (3xxx) were consolidated into employee type benefit accounts (3xxx1 = FT Faculty, 3xxx2 = PT Faculty, 3xxx3 = Classified, etc.).
23%
2%
11%
-50% -40% -30% -20% -10% 0% 10% 20% 30% 40% 50%
FT Faculty
PT Faculty
Students
Supplies
Services
Equipment
Total
Sociology: Comparative Budget Changes
FY11 Program Change from Prior Three Year Average
FY11 College Change from Prior Three Year Average

Sociology Program Review 2011-2012
Page 10 Section 3: Operating Information 10/26/2011
A5: Interpretation of the Program Budget Information The program shows a 23% increase in average FT faculty expenditures over the last three years paralleling the college average expenditures over the same period. Three factors account for this change; step and column increases, changes in release time, and increased full-time loads. Increases in full-time expenditures correspond to the decrease in part-time expenditures which mirrors the college trends. Our supplies budget remains minimal as we have little supply needs.

Sociology Program Review 2011-2012
Page 11 Section 3: Operating Information 10/26/2011
B1: Program Inventory Table This chart shows the inventory (assets) as currently posted in the Banner Financial System. This inventory list is not complete and will require review by each program. Based on this review an updated inventory list will be maintained by the college. A result of developing a complete and accurate inventory list is to provide an adequate budget for equipment maintenance and replacement (total-cost-of-ownership). The college will be working on this later this fall.
B2: Interpretation of the Program Inventory Information N/A
Item Vendor Org Fund Purchased Age Price Perm Inv # Serial #
No equipment in the Banner Assets System

Sociology Program Review 2011-2012
Page 12 Section 3: Operating Information 10/26/2011
C1: Productivity Terminology Table
Sections A credit or non-credit class. Does not include not-for-credit classes (community education).
Census Number of students enrolled at census (typically the 4th week of class for fall and spring).
FTES Full Time Equivalent Students A student in the classroom 15 hours/week for 35 weeks (or two semesters) = 525 student contact hours. 525 student contact hours = 1 FTES. Example: 400 student contact hours = 400/525 = 0.762 FTES. The State apportionment process and District allocation model both use FTES as the primary funding criterion.
FTEF Full Time Equivalent Faculty A faculty member teaching 15 units for two semesters (30 units for the year) = 1 FTE. Example: a 6 unit assignment = 6/30 = 0.20 FTEF (annual). The college also computes semester FTEF by changing the denominator to 15 units. However, in the program review data, all FTE is annual. FTEF includes both Full-Time Faculty and Part-Time Faculty. FTEF in this program review includes faculty assigned to teach extra large sections (XL Faculty). This deviates from the district practice of not including these assignments as part of FTEF. However, it is necessary to account for these assignments to properly produce represent faculty productivity and associated costs.
Cross Listed FTEF
FTEF is assigned to all faculty teaching cross-listed sections. The FTEF assignment is proportional to the number of students enrolled at census. This deviates from the practice of assigning load only to the primary section. It is necessary to account for these cross-listed assignments to properly represent faculty productivity and associated costs.
XL FTE Extra Large FTE: This is the calculated assignment for faculty assigned to extra large sections (greater than 60 census enrollments).The current practice is not to assign FTE. Example: if census>60, 50% of the section FTE assignment for each additional group of 25 (additional tiers).
WSCH Weekly Student Contact Hours The term “WSCH” is used as a total for weekly student contact hours AND as the ratio of the total WSCH divided by assigned FTEF. Example: 20 sections of 40 students at census enrolled for 3 hours per week taught by 4.00 FTEF faculty. (20 x 40 x 3) = 2,400 WSCH / 4.00 FTEF = 600 WSCH/FTEF.
WSCH to FTES
Using the example above: 2,400 WSCH x 35 weeks = 84,000 student contact hours = 84,000 / 525 = 160 FTES (see FTES definition). Simplified Formulas: FTES = WSCH/15 or WSCH = FTES x 15
District Goal
Program WSCH ratio goal. WSCH/FTEF The District goal was set in 2006 to recognize the differences in program productivity.

Sociology Program Review 2011-2012
Page 13 Section 3: Operating Information 10/26/2011
C2: Productivity Summary Table This table is a summary of the detail information provided in the Program Review Productivity Report. The “3 Year Average” was computed to provide a trend benchmark to compare the results of the prior three years to the FY11 results. The “FY11 College” percentages are included to provide a benchmark to compare the program’s percentages.
C3: Comparative Productivity Changes Chart This chart illustrates the percentage change from the prior three year average productivity to the FY11 productivity. The top bar for each budget category represents the program’s change in productivity and includes the data label. The second bar represents the college’s change in productivity.
Title FY08 FY09 FY10
3 Year
Average FY11
Program
Change
College
Change
Sections 54 51 46 50 43 -15% -13%
Census 2,059 2,728 2,768 2,518 2,685 7% -2%
FTES 204 271 275 250 268 7% -1%
FT Faculty 1.71 1.65 1.39 1.58 1.82 15% 5%
PT Faculty 3.02 2.85 2.69 2.85 2.12 -26% -12%
XL Faculty 0.80 1.60 1.80 1.40 1.85 32% 29%
Total Faculty 5.53 6.10 5.88 5.84 5.79 -1% 2%
WSCH 553 666 702 642 694 8% -2%
-15%
7%
7%
15%
-26%
32%
-1%
8%
-30% -20% -10% 0% 10% 20% 30% 40% 50%
Sections
Census
FTES
FT Faculty
PT Faculty
XL Faculty
Total Faculty
WSCH
Sociology: Productivity Changes
Program Change
College Change

Sociology Program Review 2011-2012
Page 14 Section 3: Operating Information 10/26/2011
C4: Interpretation of the Program Productivity Information The college cuts overall in sections was 13%, Sociology took a 15% reduction in sections which was substantial. In FY08 Sociology offered 54 sections. FY11 Sociology offered only 43 sections. While our production remained constant during this period, it was due to the extra-large class size. Currently, FY12 our extra-large class offerings have decreased substantially, which will effect number of sections offered, class size, number of students served which will impact future productivity.

Sociology Program Review 2011-2012
Page 15 Section 3: Operating Information 10/26/2011
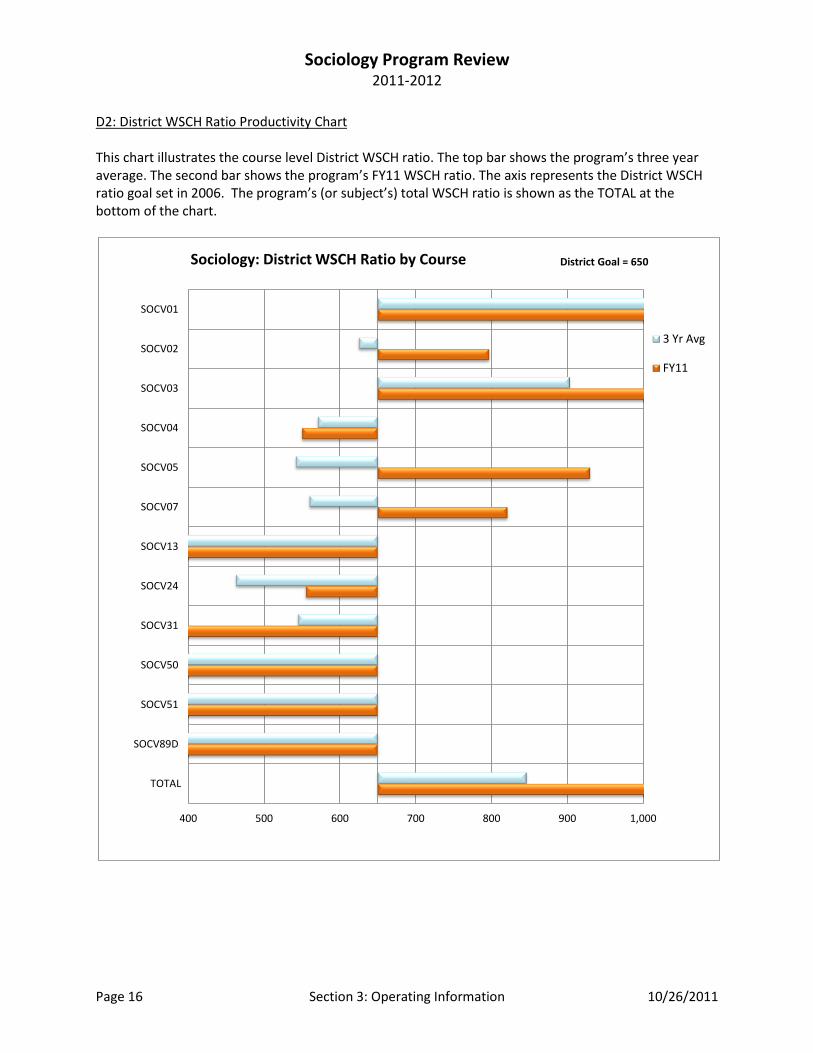
D1: District WSCH Ratio Productivity Table This table shows the District WSCH ratio (WSCH/FTEF) for each course by year for this program. Courses not offered during FY11 (last year) or without faculty load (independent study) are excluded. Because these are ratios, the combined average is computed using total WSCH and total FTEF (not the average of ratios). The formula used in this table distributes FTEF to all cross-listed sections (proportional to census enrollment) but does not include the associated faculty costs of extra large assignment. District WSCH Ratio = WSCH / (PT FTE + FT FTE).
Course Title FY08 FY09 FY10 3 Yr Avg FY11 Change Dist Goal % Goal
SOCV01 Introduction to Sociology 794 1,103 1,186 1,020 1,207 18% 650 186%
SOCV02 Social Problems 496 626 733 625 797 27% 650 123%
SOCV03 Racial&Ethnic Group Relations 607 966 1,154 903 1,079 20% 650 166%
SOCV04 Sociology of Gender Roles 499 634 581 571 550 -4% 650 85%
SOCV05 The Changing Family 214 - 870 542 930 72% 650 143%
SOCV07 Sociological Analysis 480 435 765 560 821 47% 650 126%
SOCV13 Deviance, Crime and Society 390 315 - 353 - -100% 650 0%
SOCV24 Sociology of Chicano Community 375 540 480 463 555 20% 650 85%
SOCV31 Intro to Social Psychology 497 566 570 545 - -100% 650 0%
SOCV50 Introduction to Social Work 300 - - 300 - -100% 650 0%
SOCV51 Social Work Methods I 345 210 - 278 - -100% 650 0%
SOCV89D Intro to Mental Health Rehab 210 - - 210 - -100% 650 0%
TOTAL Annual District WSCH Ratio 648 903 1,013 846 1,020 21% 650 157%
District WSCH Ratio: Weekly Student Contact Hours/(FT FTE+PT FTE)
Sociology Program Review 2011-2012
Page 16 Section 3: Operating Information 10/26/2011
D2: District WSCH Ratio Productivity Chart This chart illustrates the course level District WSCH ratio. The top bar shows the program’s three year average. The second bar shows the program’s FY11 WSCH ratio. The axis represents the District WSCH ratio goal set in 2006. The program’s (or subject’s) total WSCH ratio is shown as the TOTAL at the bottom of the chart.
400 500 600 700 800 900 1,000
SOCV01
SOCV02
SOCV03
SOCV04
SOCV05
SOCV07
SOCV13
SOCV24
SOCV31
SOCV50
SOCV51
SOCV89D
TOTAL
District Goal = 650Sociology: District WSCH Ratio by Course
3 Yr Avg
FY11

Sociology Program Review 2011-2012
Page 17 Section 3: Operating Information 10/26/2011
D3: College WSCH Ratio Productivity Table This table shows the College’s WSCH ratio (WSCH/FTEF) for each course by year for the program. Courses not offered during FY11 (last year) or without faculty load (independent study) are excluded. Because these are ratios, the combined average is computed using total WSCH and total FTEF (not the average of ratios). The formula used in this table includes the associated faculty costs of extra large sections. Faculty teaching extra large sections are paid stipends equal to 50% of their section FTE assignment for each group of 25 students beyond the first 60 students (calculated in this table as XL FTE). This College WSCH Ratio is a more valid representation of WSCH productivity. The College WSCH Ratio will be used in the program review process. College WSCH Ratio = WSCH / (PT FTE + FT FTE + XL FTE)
Course Title FY08 FY09 FY10 3 Yr Avg FY11 Change Dist Goal % Goal
SOCV01 Introduction to Sociology 607 681 699 665 690 4% 650 106%
SOCV02 Social Problems 496 578 628 575 620 8% 650 95%
SOCV03 Racial&Ethnic Group Relations 607 966 1,019 869 1,079 24% 650 166%
SOCV04 Sociology of Gender Roles 499 634 581 571 550 -4% 650 85%
SOCV05 The Changing Family 214 - 870 542 620 14% 650 95%
SOCV07 Sociological Analysis 480 435 612 517 657 27% 650 101%
SOCV13 Deviance, Crime and Society 390 315 - 353 - -100% 650 0%
SOCV24 Sociology of Chicano Community 375 540 480 463 555 20% 650 85%
SOCV31 Intro to Social Psychology 497 566 570 545 - -100% 650 0%
SOCV50 Introduction to Social Work 300 - - 300 - -100% 650 0%
SOCV51 Social Work Methods I 345 210 - 278 - -100% 650 0%
SOCV89D Intro to Mental Health Rehab 210 - - 210 - -100% 650 0%
TOTAL Annual College WSCH Ratio 554 666 702 643 694 8% 650 107%
College WSCH Ratio: Weekly Student Contact Hours/(FT FTE + PT FTE + XL FTE)

Sociology Program Review 2011-2012
Page 18 Section 3: Operating Information 10/26/2011
D4: College WSCH Ratio Productivity Chart This chart illustrates the course level College WSCH ratio. The top bar shows the program’s three year average. The second bar shows the FY11 WSCH ratio. The axis represents the District WSCH ratio goal set in 2006. The program’s (or subject’s) total WSCH ratio is shown as the TOTAL at the bottom of the chart. The computation used for the College WSCH Ratio includes XL FTE (extra-large sections) and the assignment of FTEF to all cross-listed sections (proportional to census enrollment).
694
400 500 600 700 800 900 1,000
SOCV01
SOCV02
SOCV03
SOCV04
SOCV05
SOCV07
SOCV13
SOCV24
SOCV31
SOCV50
SOCV51
SOCV89D
TOTAL
District Goal = 650Sociology: College WSCH Ratio by Course
3 Yr Avg
FY11

Sociology Program Review 2011-2012
Page 19 Section 3: Operating Information 10/26/2011
D5: Productivity Detail Report
The program’s detail productivity information is available in Appendix B – Program Review Productivity Report. This report is a PDF document and is searchable. The productivity information was extracted from the District’s Banner Student System. The productivity information includes all information associated with the program’s subject codes. The Program Review Productivity Report is sorted by subject code (alphabetical order) and includes the following sections: productivity measures and WSCH ratios by course by year. D6: Interpretation of the Program Course Productivity Information The district WSCH ratio of 650 was exceeded by 57% overall. See D1: District WSCH Ratio Productivity Table. The larger classes compensated for the smaller specialty classes. Our concern is that reducing the extra-large class sections will negatively impact the continued productivity WSCH ratio in the future.

Sociology Program Review 2011-2012
Page 20 Section 3: Operating Information 10/26/2011
E1: Student Success Terminology
Census Number of students enrolled at Census (typically the 4th week of class for fall and spring). Census enrollment is used to compute WSCH and FTES for funding purposes.
Retain Students completing the class with any grade other than W or DR divided by Census Example: 40 students enrolled, 5 students dropped prior to census,35 students were enrolled at census, 25 students completed the class with a grade other than W or DR: Retention Rate = 25/35 = 71%
Success Students completing the class with grades A, B, C, CR or P divided by Census Excludes students with grades D, F, or NC.
E2: Student Success Summary The following two tables summarize the detail information provided in the Appendix C - Program Review Student Success Report. The first table shows the number of students. The second table shows the percentage of students. Both tables show the distribution of student grades by year for the program (subject). They show the number of students who were counted at census, completed the class (retention), and were successful. The “3 Year Average” was computed to provide a trend benchmark to compare the prior three year expenses to the FY11 success measures. The “College” success percentages are included to compare the results of the program to the results of the college.
Subject Fiscal Year A B C P/CR D F W NC Census Retain Success
SOC FY08 574 448 295 1 85 279 304 10 1,996 1,682 1,318
SOC FY09 884 606 357 2 96 352 367 2 2,666 2,297 1,849
SOC FY10 1,007 618 361 1 93 339 242 - 2,662 2,419 1,987
SOC 3 Year Avg 822 557 338 1 91 323 304 4 2,441 2,133 1,718
SOC FY11 934 688 355 - 94 315 255 15 2,656 2,401 1,977
Subject Fiscal Year A B C P/CR D F W NC Census Retain Success
SOC FY08 29% 22% 15% 0% 4% 14% 15% 1% 84% 66%
SOC FY09 33% 23% 13% 0% 4% 13% 14% 0% 86% 69%
SOC FY10 38% 23% 14% 0% 3% 13% 9% 0% 91% 75%
SOC 3 Year Avg 34% 23% 14% 0% 4% 13% 12% 0% 87% 70%
SOC FY11 35% 26% 13% 0% 4% 12% 10% 1% 90% 74%
College 3 Year Avg 33% 19% 12% 5% 5% 10% 15% 2% 85% 68%
College FY11 33% 20% 13% 3% 5% 10% 14% 2% 86% 70%

Sociology Program Review 2011-2012
Page 21 Section 3: Operating Information 10/26/2011
E3: Retention and Success Rates This chart illustrates the retention and success rates of students who were counted at census. Each measure has four bars. The first bar represents the program’s prior three year average percent. The second bar shows last year’s (FY11) percent. The third and fourth bars represent the overall college percents.
90%
74%
86%
70%
0% 20% 40% 60% 80% 100%
Ret
ain
Succ
ess
Sociology: Retention and Success Rates
Program 3 Year Average
Program FY11
College 3 Year Average
College FY11

Sociology Program Review 2011-2012
Page 22 Section 3: Operating Information 10/26/2011
E4: Grade Distribution This chart illustrates the program’s distribution of grades (by subject). Each grade has four bars. The first bar represents the program’s prior three year average percent of grades. The second bar shows last year’s (FY11) grade distribution percents. The third and fourth bars represent the overall college distribution percents.
E5: Student Success Detail Report The program student success detail information is available in Appendix C – Program Review Student Success Report. This report is a PDF document and is searchable. The student success information was extracted from the District’s Banner Student System. The student success information includes all information associated with the program’s subject codes. The Program Review Student Success Report is sorted by subject code (alphabetical order) and includes the following sections: comparative summary and course detail by term. The following table defines the terminology.
35%
26%
13%
0%
4%
12%
10%
1%
33%
20%
13%
3%
5%
10%
14%
2%
0% 5% 10% 15% 20% 25% 30% 35% 40%
A
B
C
P/CR
D
F
W
NC
Sociology: Grade Distribution
Program 3 Year Average
Program FY11
College 3 Year Average
College FY11

Sociology Program Review 2011-2012
Page 23 Section 3: Operating Information 10/26/2011
E6: Interpretation of Program Retention, Student Success, and Grade Distribution From the three year average, our success rate is up 4% from 70% to 74% for FY11. This is 6% above the college three year average. From the three year average for retention, the Sociology Program is up 3% for FY11 which is 5% higher than the college three year average. The grade distribution have a similar trend with the college. The collaboration of the Sociology faculty for implementation of Student Learning Outcomes may have had an impact on the student success and retention rates. Further analysis will be forthcoming. Currently, FY12 our extra-large class offerings have decreased substantially, which will effect number of sections offered, class size, number of students served which may impact future success and retention.

Sociology Program Review 2011-2012
Page 24 Section 3: Operating Information 10/26/2011
F1: Program Completion – Student Awards This table shows the number of students who completed a program certificate or degree during the fiscal year. Gender distribution is included. The following chart illustrates this information.
F2: Interpretation of the Program Completion Information One student completed an A.A. in Human Services.
Program FY Certificates Degrees Female Male
Sociology FY08 - - - -
Sociology FY09 - 1 1 -
Sociology FY10 - - - -
Sociology FY11 - - - -
Total Awards in 4 Years - 1 1 -
-
-
-
-
0 1 2
Certificates
Degrees
Female
Male
Sociology : Student Certificates and Degrees
FY08
FY09
FY10
FY11

Sociology Program Review 2011-2012
Page 25 Section 3: Operating Information 10/26/2011
G1: Student Demographics Summary Tables This table shows the program and college census enrollments for each demographic category. It also shows the average age of the students. The program FY11 results can be compared to its prior three year average, the college FY11 results, and the college prior three year average.
This table shows the program and college percentage of census enrollments for each demographic category.
Subject FY Hispanic White Asian Afr Am Pac Isl Filipino Nat Am Other Female Male Other Avg Age
SOC FY08 898 707 58 98 14 55 27 139 1,308 681 7 26
SOC FY09 1,206 902 101 115 28 99 42 173 1,707 946 13 25
SOC FY10 1,241 882 75 116 28 105 38 177 1,648 1,003 11 24
SOC 3 Year Avg 1,115 830 78 110 23 86 36 163 1,554 877 10 25
SOC FY11 1,374 808 80 127 17 83 35 132 1,703 951 2 23
College 3 Year Avg 11,806 11,169 988 1,005 217 827 403 2,302 15,888 12,694 134 27
College FY11 13,034 10,566 977 1,040 196 886 402 1,688 15,734 13,014 40 24
Subject FY Hispanic White Asian Afr Am Pac Isl Filipino Nat Am Other Female Male Other Avg Age
SOC FY08 45% 35% 3% 5% 1% 3% 1% 7% 66% 34% 0% 26
SOC FY09 45% 34% 4% 4% 1% 4% 2% 6% 64% 35% 0% 25
SOC FY10 47% 33% 3% 4% 1% 4% 1% 7% 62% 38% 0% 24
SOC 3 Year Avg 46% 34% 3% 5% 1% 4% 1% 7% 64% 36% 0% 25
SOC FY11 52% 30% 3% 5% 1% 3% 1% 5% 64% 36% 0% 23
College 3 Year Avg 41% 39% 3% 3% 1% 3% 1% 8% 55% 44% 0% 27
College FY11 45% 37% 3% 4% 1% 3% 1% 6% 55% 45% 0% 24

Sociology Program Review 2011-2012
Page 26 Section 3: Operating Information 10/26/2011
G2: Student Demographics Chart This chart illustrates the program’s percentages of students by ethnic group. . Each group has four bars. The first bar represents the program’s prior three year percent. The second bar shows last year’s (FY11) percent. The third and fourth bars represent the overall college percents.
G3: Student Demographics Detail Report The program student success detail information is available in Appendix D – Program Review Student Demographics Report. This report is a PDF document and is searchable. The student success information was extracted from the District’s Banner Student System. The student demographic information includes all information associated with the program’s subject codes. The Program Review Student Demographics Report is sorted by subject code (alphabetical order) and includes the following sections: comparative summary by year, and detail demographics by term and course. G4: Interpretation of the Program Demographic Information Sociology Program attracts a larger percentage of Hispanics. The overall college Hispanic 45% and sociology is 52%. When looking at gender, overall, the college is at 55% and sociology is at 64%. There appears to be White Flight in the social sciences with 7% less White student population than the college.
52%
30%
3%
5%
1%
3%
1%
5%
64%
36%
45%
37%
3%
4%
1%
3%
1%
6%
55%
45%
0% 10% 20% 30% 40% 50% 60% 70%
Hispanic
White
Asian
Afr Am
Pac Isl
Filipino
Nat Am
Other
Female
Male
Sociology: Demographics
Program Prior 3 Year Average
Program FY11
College Prior 3 Year Average
College FY11

Sociology Program Review 2011-2012
Page 27 Section 4: Performance Assessment 10/26/2011
4. Performance Assessment
A1: Program-Level Student Learning Outcomes
Program-Level Student Learning Outcome 1 Performance Indicators Demonstrate comprehension of the major sociological theories and relevant concepts.
Short answer, essay and multiple choice exams, alternative learning techniques and life application assignments.
Operating Information In SOC V01, only 68% of students were able to achieve a C grade or better by demonstration comprehension of the major sociology theories and relevant concepts.
Analysis – Assessment
We fell 7% from our goal. Faculty felt that administering the assessment midterm, while valuable, was premature.
Program-Level Student Learning Outcome 2 Performance Indicators Demonstrate comprehension of the scientific method, the variety and appropriateness of research designs and the application and interpretation of the findings.
Any of the following: research project, multiple choice exam, group project/exercises and alternate learning techniques.
Operating Information In SOC V07, 87.5% of the students achieved the goal of a C or better by demonstration of the scientific method, the variety and appropriateness of research designs and the application and interpretation of the findings.
Analysis – Assessment
We exceeded our goal by 12.5% due largely to the fact that most students who take SOC 07 have previously taken other sociology courses, therefore having prior knowledge of the social research process.
Program-Level Student Learning Outcome 3 Performance Indicators Critically evaluate and apply theoretical concepts to specific cultural phenomenon past and present.
Essay exams, multiple-choice, alternate learning techniques and life application.
Operating Information In SOC V03, 76% of the students achieved the goal of a C or better by demonstrating the ability to critically evaluate and apply theoretical concepts to specific cultural phenomenon past and present.
Analysis – Assessment
We exceeded our goal by 1% due largely to the fact that many students have previously taken a sociology course.

Sociology Program Review 2011-2012
Page 28 Section 4: Performance Assessment 10/26/2011
Program-Level Student Learning Outcome 4 Performance Indicators Demonstrate understanding of assessment methods, treatment planning and case management.
Class participation, skills assessment, practice sessions, paper, exam and class discussion.
Operating Information In HMS V52, 78% of the students achieved the goal of a C or better by demonstrating the ability to demonstrate understanding of assessment methods, treatment planning and case management.
Analysis – Assessment
While there is no pre-requisite, this is generally the third course in a sequence of the Human Services program.

Sociology Program Review 2011-2012
Page 29 Section 4: Performance Assessment 10/26/2011
4B: Student Success Outcomes
Student Success Outcome 1 Performance Indicators The program will increase its retention rate from the average of the program’s prior three-year retention rate. The retention rate is the number of students who finish a term with any grade other than W or DR divided by the number of students at census.
The program will increase the retention rate by 2% or more above the average of the program’s retention rate for the prior three years.
Operating Information Sociology’s prior three year average retention rate was is up 3% for FY11 which is 5% higher than the college three year average. We exceed the indicator by 3%.
Analysis – Assessment
The collaboration of the Sociology faculty for implementation of Student Learning Outcomes may have had an impact on the student success and retention rates. Further analysis will be forthcoming. Currently, FY12 our extra-large class offerings have decreased substantially, which will effect number of sections offered, class size, number of students served which may impact future success and retention.
Student Success Outcome 2 Performance Indicators The program will increase its retention rate from the average of the college’s prior three-year retention rate. The retention rate is the number of students who finish a term with any grade other than W or DR divided by the number of students at census.
The program will increase the retention rate by 2% or more above the average of the college retention rate for the prior three years.
Operating Information Sociology’s prior three year average retention rate was 90% for FY11 which is 5% higher than the college three year average. We exceed the indicator by 3%.
Analysis – Assessment
The collaboration of the Sociology faculty for implementation of Student Learning Outcomes may have had an impact on the student success and retention rates. Further analysis will be forthcoming. Currently, FY12 our extra-large class offerings have decreased substantially, which will effect number of sections offered, class size, number of students served which may impact future success and retention.

Sociology Program Review 2011-2012
Page 30 Section 4: Performance Assessment 10/26/2011
Student Success Outcome 3 Performance Indicators The program will increase the student success rates from the average of the program’s prior three-year success rates. The student success rate is the percentage of students at census who receive a grade of C or better.
The program will increase student success rate by 2% or more above the program’s average student success rate for the prior three years.
Operating Information From the three year average, our success rate is up 4% from 70% to 74% for FY11. This is 6% above the college three year average. We exceed the indicator by 2%.
Analysis – Assessment
The collaboration of the Sociology faculty for implementation of Student Learning Outcomes may have had an impact on the student success and retention rates. Further analysis will be forthcoming. Currently, FY12 our extra-large class offerings have decreased substantially, which will effect number of sections offered, class size, number of students served which may impact future success and retention.
Student Success Outcome 4 Performance Indicators The program will increase the student success rates from the average of the college’s prior three-year success rates. The student success rate is the percentage of students at census who receive a grade of C or better.
The program student success will increase by 5% over the average of the college’s student success rate for the prior three years.
Operating Information From the three year average, the college success rate was 68% and Sociology was 74%. This is 6% above the college three year average. We exceed the indicator by 1%.
Analysis – Assessment
The collaboration of the Sociology faculty for implementation of Student Learning Outcomes may have had an impact on the student success and retention rates. Further analysis will be forthcoming. Currently, FY12 our extra-large class offerings have decreased substantially, which will effect number of sections offered, class size, number of students served which may impact future success and retention.

Sociology Program Review 2011-2012
Page 31 Section 4: Performance Assessment 10/26/2011

Sociology Program Review 2011-2012
Page 32 Section 4: Performance Assessment 10/26/2011
C. Program Operating Outcomes
Program Operating Outcome 1 Performance Indicators The program will maintain WSCH/FTEF above the 650 goal set by the district.
The program will exceed the efficiency goal of 650 set by the district by 2%.
Operating Information Consistently, our WSCH/FTEF has exceeded the district goal of 650. Our FY11 was 694, exceeding the goals of the college by 7%.
Analysis – Assessment
Given that for the previous 3 years, Sociology has offered extra-large classes, the goals have been met annually. However, with the current reduction of class size and sections FY12, the projection for meeting our goals may be compromised. Therefore, we do not project an increase and are concerned about maintaining district goals.
Program Operating Outcome 2 Performance Indicators Inventory of instructional equipment is functional, current, and otherwise adequate to maintain a quality-learning environment, currently no cost.
N/A
Operating Information N/A
Analysis – Assessment

Sociology Program Review 2011-2012
Page 33 Section 4: Performance Assessment 10/26/2011
Program Operating Outcome 3 Performance Indicators For the past three years, Sociology has had 2.0 full-time instructors currently, for FY12 an additional faculty was added bringing us to 3.0. We will maintain a full-time 3.0 faculty.
Full-time faculty will be 3.0.
Operating Information The Sociology Program does not anticipate an increase or decrease.
Analysis – Assessment
The Sociology Program has met the goal of full-time faculty 3.0 and request no further faculty at this time.
Program Operating Outcome 4 Performance Indicators
Operating Information
Analysis – Assessment

Sociology Program Review 2011-2012
Page 34 Section 5: Program Findings 10/26/2011
5. Findings Finding 1 Collaboration Finding 2 To maintain and enhance retention and student success through the vehicle of Learning
Communities. See Table 3E2, Chart 3E3, and Data Interpretation E6. Finding 3 To insure all non-core classes are offered within a two year rotational period. See Table 3D3. To increase successful completion of A.A. degree in Sociology. Finding 4 To protect the minimum requirements for transfer and completion of A.A. degree in Sociology, the SOC V07 course (Sociological Analysis) must be re-classified as a tier one core class. See Graph 3F1. Finding 5 To maintain and enhance retention and student success through capping online courses to allow student access to brick and mortar classes. See Table 3E2, Chart 3E3, and Data Interpretation E6.

Sociology Program Review 2011-2012
Page 35 Section 6: Program Initiatives 10/26/2011
6. Initiatives
Initiative: Faculty will meet at least once a semester to share best practices and assessment techniques. Initiative ID: SP1201
Links to Finding 1: Faculty will meet at least once a semester to share best practices and assessment techniques. Benefits:
1. Greater student achievement of student learning outcomes.
2. Increased dialogue amongst department faculty.
3. Sharing of teaching techniques, best practices, assessment tools, and resources. Request for Resources
Funding Sources : No funds requested
No new resources are required (use existing resources) x Requires additional general funds for personnel, supplies or services (includes maintenance contracts)
Requires computer equipment funds (hardware and software)
Requires college equipment funds (other than computer related)
Requires college facilities funds
Requires other resources (grants, etc.)

Sociology Program Review 2011-2012
Page 36 Section 6: Program Initiatives 10/26/2011
Initiative In an effort to promote increased student success and retention, Learning Communities collaboration will link courses to Service Learning in Psychology, Political Science and Sociology. Interdisciplinary Service Learning and Learning Community for SOC V01 SL, SOC V02 SL, PSYCH V01 SL and POLS V01 SL. Initiative ID: SP1202 Links to Finding 2: In order to provide students the opportunity to connect the content in the classroom with community experiences, the three disciplines will work together to develop group projects enabling students to address social issues across the social science curriculum. This will require the four courses SOC V01 SL, SOC V02 SL, PSYCH V01 SL and POLS V01 SL to be offered concurrently. This collaboration will positively impact both retention and success. Benefits: To foster collaborative learning with both students and faculty. Increase the Learning Communities on campus and provide extended Service Learning opportunities in the community. This initiative will provide an avenue for bringing the college into the community to effect positive change. Request for Resources: Clarification from administration on potential liability insurance costs. Funding Sources Please check one or more of the following funding sources.
No new resources are required (use existing resources) X Requires additional general funds for personnel, supplies or services (includes maintenance contracts)
Requires computer equipment funds (hardware and software)
Requires college equipment funds (other than computer related)
Requires college facilities funds
Requires other resources (grants, etc.)

Sociology Program Review 2011-2012
Page 37 Section 6: Program Initiatives 10/26/2011
Initiative Scheduling rotation grid for core and non-core Sociology course offerings. Initiative ID SP1203 Links to Finding 3 To insure access for students to non-core classes within a two year rotational period, a sociology grid will be developed and utilized when preparing the course schedule. This initiative will additionally increase successful completion of A.A. degree in Sociology. Benefits This will enable students to explore the breadth and variety of the Sociology field leading to an increase in Sociology A.A. transfer degrees and student success and retention. Request for Resources None Funding Sources No funds requested.
No new resources are required (use existing resources) X Requires additional general funds for personnel, supplies or services (includes maintenance contracts)
Requires computer equipment funds (hardware and software))
Requires college equipment funds (other than computer related)
Requires college facilities funds
Requires other resources (grants, etc.)
Sociology Program Review 2011-2012
Page 38 Section 6: Program Initiatives 10/26/2011
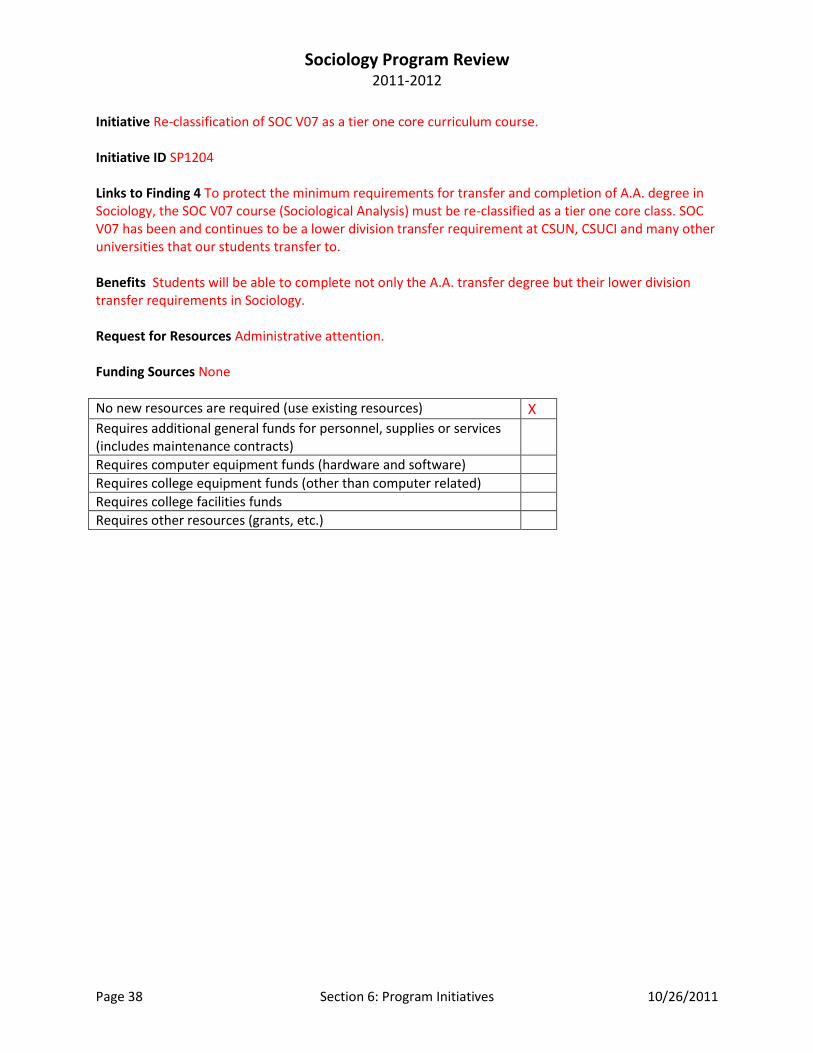
Initiative Re-classification of SOC V07 as a tier one core curriculum course. Initiative ID SP1204 Links to Finding 4 To protect the minimum requirements for transfer and completion of A.A. degree in Sociology, the SOC V07 course (Sociological Analysis) must be re-classified as a tier one core class. SOC V07 has been and continues to be a lower division transfer requirement at CSUN, CSUCI and many other universities that our students transfer to. Benefits Students will be able to complete not only the A.A. transfer degree but their lower division transfer requirements in Sociology. Request for Resources Administrative attention. Funding Sources None
No new resources are required (use existing resources) X Requires additional general funds for personnel, supplies or services (includes maintenance contracts)
Requires computer equipment funds (hardware and software)
Requires college equipment funds (other than computer related)
Requires college facilities funds
Requires other resources (grants, etc.)
Sociology Program Review 2011-2012
Page 39 Section 6: Program Initiatives 10/26/2011
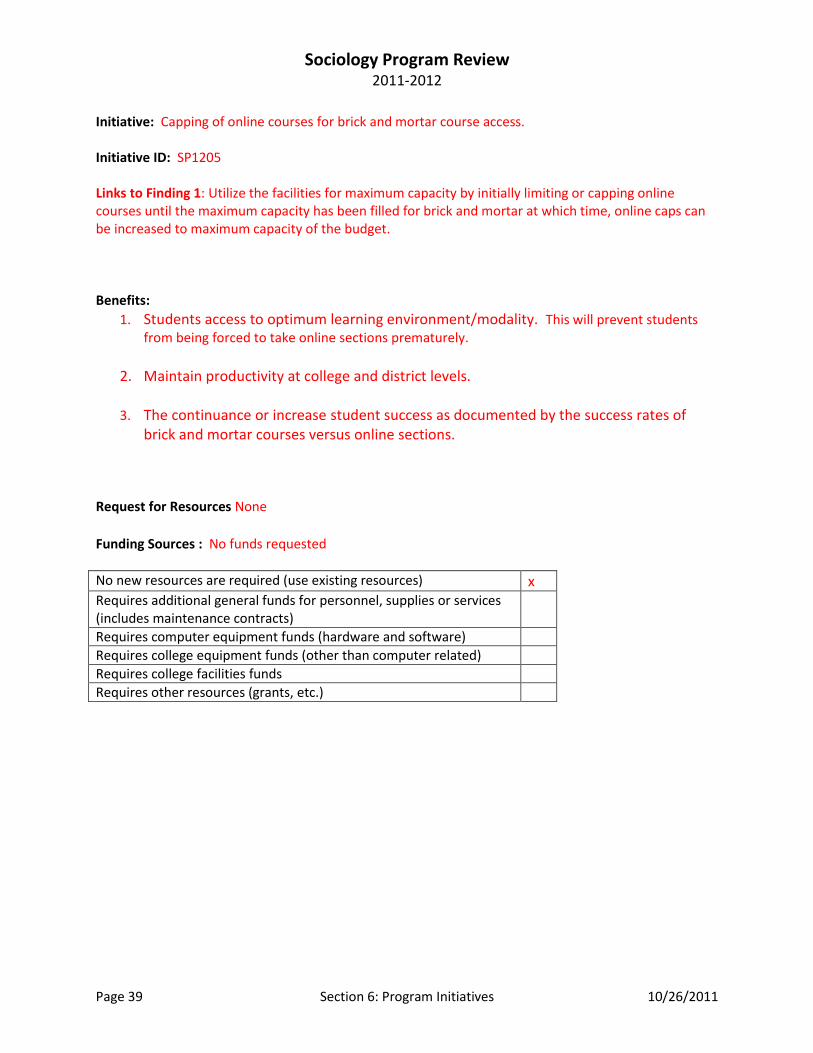
Initiative: Capping of online courses for brick and mortar course access. Initiative ID: SP1205 Links to Finding 1: Utilize the facilities for maximum capacity by initially limiting or capping online courses until the maximum capacity has been filled for brick and mortar at which time, online caps can be increased to maximum capacity of the budget. Benefits:
1. Students access to optimum learning environment/modality. This will prevent students from being forced to take online sections prematurely.
2. Maintain productivity at college and district levels.
3. The continuance or increase student success as documented by the success rates of
brick and mortar courses versus online sections.
Request for Resources None
Funding Sources : No funds requested
No new resources are required (use existing resources) x Requires additional general funds for personnel, supplies or services (includes maintenance contracts)
Requires computer equipment funds (hardware and software)
Requires college equipment funds (other than computer related)
Requires college facilities funds
Requires other resources (grants, etc.)

Sociology Program Review 2011-2012
Page 40 Section 6: Program Initiatives 10/26/2011

Sociology Program Review 2011-2012
Page 41 Section 6: Program Initiatives 10/26/2011
6A: Initiatives Priority Spreadsheet The following blank tables represent Excel spreadsheets and will be substituted with a copy of the completed Excel spreadsheets. Personnel –Faculty Requests
Personnel – Other Requests
Oth
er
Pro
gram
Pro
gram
Pri
ori
ty
(0, 1
, 2, 3
…)
Div
isio
n P
rio
rity
(R,H
,M,L
)
Co
mm
itte
e P
rio
rity
(R, H
, M, L
)
Co
lle
ge P
rio
rity
(R, H
, M, L
)
Init
iati
ve ID
Init
iati
ve T
itle
Re
sou
rce
De
scri
pti
on
Esti
mat
ed
Co
st
No
Ne
w R
eso
urc
es
Re
qu
est
ed
Ge
ne
ral F
un
d
Oth
er
1
2
3
4
5
Pe
rso
nn
el -
Oth
er
Pro
gram
Pro
gram
Pri
ori
ty
(0, 1
, 2, 3
…)
Div
isio
n P
rio
rity
(R,H
,M,L
)
Co
mm
itte
e P
rio
rity
(R, H
, M, L
)
Co
lle
ge P
rio
rity
(R, H
, M, L
)
Init
iati
ve ID
Init
iati
ve T
itle
Re
sou
rce
De
scri
pti
on
Esti
mat
ed
Co
st
No
Ne
w R
eso
urc
es
Re
qu
est
ed
Ne
w G
en
era
l Fu
nd
s
Oth
er
1
2
3
4
5

Sociology Program Review 2011-2012
Page 42 Section 6: Program Initiatives 10/26/2011
Computer Equipment and Software
Other Equipment Requests
Facilities Requests
Equ
ipm
en
t -
Co
mp
ute
r R
ela
ted
Pro
gram
Pro
gram
Pri
ori
ty
(0, 1
, 2, 3
…)
Div
isio
n P
rio
rity
(R,H
,M,L
)
Co
mm
itte
e P
rio
rity
(R, H
, M, L
)
Co
lle
ge P
rio
rity
(R, H
, M, L
)
Init
iati
ve ID
Init
iati
ve T
itle
Re
sou
rce
De
scri
pti
on
Esti
mat
ed
Co
st
No
Ne
w R
eso
urc
es
Re
qu
est
ed
Tech
no
logy
Fu
nd
Oth
er
1
2
3
4
5
Equ
ipm
en
t
Pro
gram
Pro
gram
Pri
ori
ty
(0, 1
, 2, 3
…)
Div
isio
n P
rio
rity
(R,H
,M,L
)
Co
mm
itte
e P
rio
rity
(R, H
, M, L
)
Co
lle
ge P
rio
rity
(R, H
, M, L
)
Init
iati
ve ID
Init
iati
ve T
itle
Re
sou
rce
De
scri
pti
on
Esti
mat
ed
Co
st
No
Ne
w R
eso
urc
es
Re
qu
est
ed
Equ
ipm
en
t Fu
nd
Oth
er
1
2
3
4
5
Faci
liti
es
Pro
gram
Pro
gram
Pri
ori
ty
(0, 1
, 2, 3
…)
Div
isio
n P
rio
rity
(R,H
,M,L
)
Co
mm
itte
e P
rio
rity
(R, H
, M, L
)
Co
lle
ge P
rio
rity
(R, H
, M, L
)
Init
iati
ve ID
Init
iati
ve T
itle
Re
sou
rce
De
scri
pti
on
Esti
mat
ed
Co
st
No
Ne
w R
eso
urc
es
Re
qu
est
ed
Faci
liti
es
Fun
d
Oth
er
1
2
3
4
5
Sociology Program Review 2011-2012
Page 43 Section 6: Program Initiatives 10/26/2011
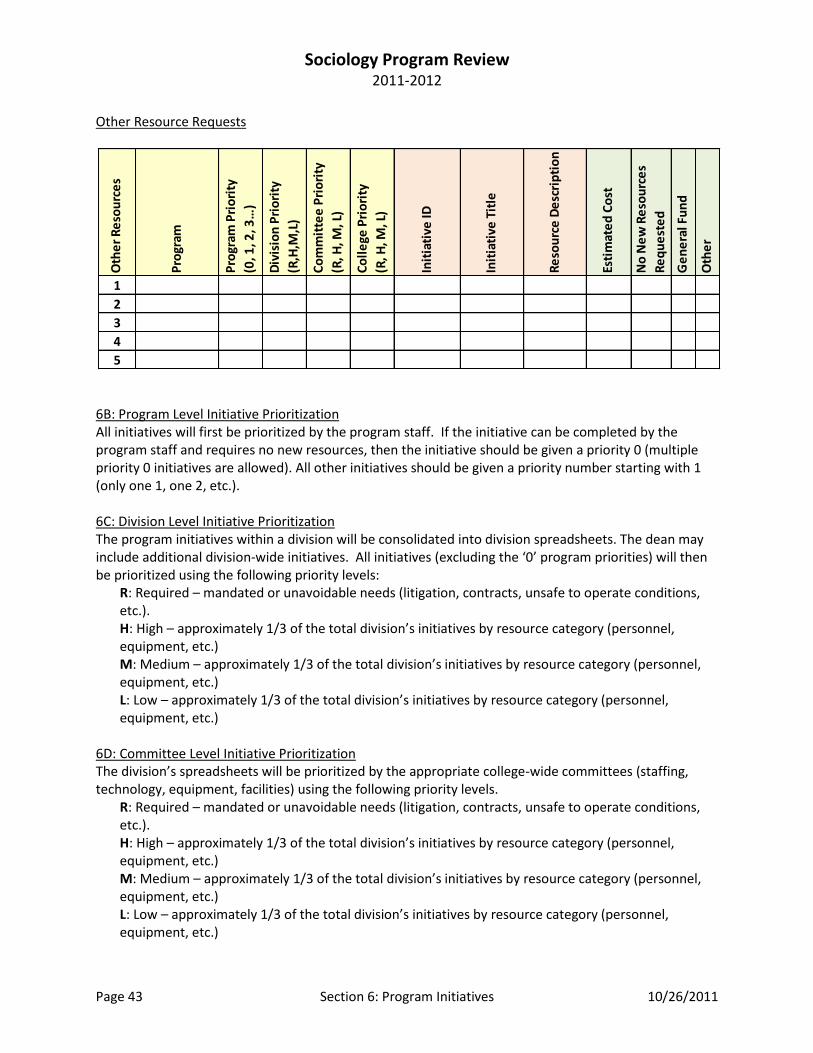
Other Resource Requests
6B: Program Level Initiative Prioritization All initiatives will first be prioritized by the program staff. If the initiative can be completed by the program staff and requires no new resources, then the initiative should be given a priority 0 (multiple priority 0 initiatives are allowed). All other initiatives should be given a priority number starting with 1 (only one 1, one 2, etc.). 6C: Division Level Initiative Prioritization The program initiatives within a division will be consolidated into division spreadsheets. The dean may include additional division-wide initiatives. All initiatives (excluding the ‘0’ program priorities) will then be prioritized using the following priority levels:
R: Required – mandated or unavoidable needs (litigation, contracts, unsafe to operate conditions, etc.). H: High – approximately 1/3 of the total division’s initiatives by resource category (personnel, equipment, etc.) M: Medium – approximately 1/3 of the total division’s initiatives by resource category (personnel, equipment, etc.) L: Low – approximately 1/3 of the total division’s initiatives by resource category (personnel, equipment, etc.)
6D: Committee Level Initiative Prioritization The division’s spreadsheets will be prioritized by the appropriate college-wide committees (staffing, technology, equipment, facilities) using the following priority levels.
R: Required – mandated or unavoidable needs (litigation, contracts, unsafe to operate conditions, etc.). H: High – approximately 1/3 of the total division’s initiatives by resource category (personnel, equipment, etc.) M: Medium – approximately 1/3 of the total division’s initiatives by resource category (personnel, equipment, etc.) L: Low – approximately 1/3 of the total division’s initiatives by resource category (personnel, equipment, etc.)
Oth
er
Re
sou
rce
s
Pro
gram
Pro
gram
Pri
ori
ty
(0, 1
, 2, 3
…)
Div
isio
n P
rio
rity
(R,H
,M,L
)
Co
mm
itte
e P
rio
rity
(R, H
, M, L
)
Co
lle
ge P
rio
rity
(R, H
, M, L
)
Init
iati
ve ID
Init
iati
ve T
itle
Re
sou
rce
De
scri
pti
on
Esti
mat
ed
Co
st
No
Ne
w R
eso
urc
es
Re
qu
est
ed
Ge
ne
ral F
un
d
Oth
er
1
2
3
4
5

Sociology Program Review 2011-2012
Page 44 Section 6: Program Initiatives 10/26/2011
6E: College Level Initiative Prioritization Dean’s will present the consolidated prioritized initiatives to the College Planning Council. The College Planning Council will then prioritize the initiatives using the following priority levels.
R: Required – mandated or unavoidable needs (litigation, contracts, unsafe to operate conditions, etc.). H: High – approximately 1/3 of the total division’s initiatives by resource category (personnel, equipment, etc.) M: Medium – approximately 1/3 of the total division’s initiatives by resource category (personnel, equipment, etc.) L: Low – approximately 1/3 of the total division’s initiatives by resource category (personnel, equipment, etc.)

Sociology Program Review 2011-2012
Page 45 Section 7: Program Review Process Assessment 10/26/2011
7A: Appeals After the program review process is complete, your program has the right to appeal the ranking of initiatives. If you choose to appeal, please complete the form that explains and supports your position. The appeal will be handled at the next higher level of the program review process.
7B: Process Assessment In this first year of program review using the new format, programs will be establishing performance indicators (goals) for analysis next year. Program review will take place annually, but until programs have been through an entire annual cycle, they cannot completely assess the process. However, your input is very important to us as we strive to improve, and your initial comments on this new process are encouraged.