Embed Size (px)
Citation preview


Sociology 125
Lecture 14
Poverty & InequalityOctober 20, 2014
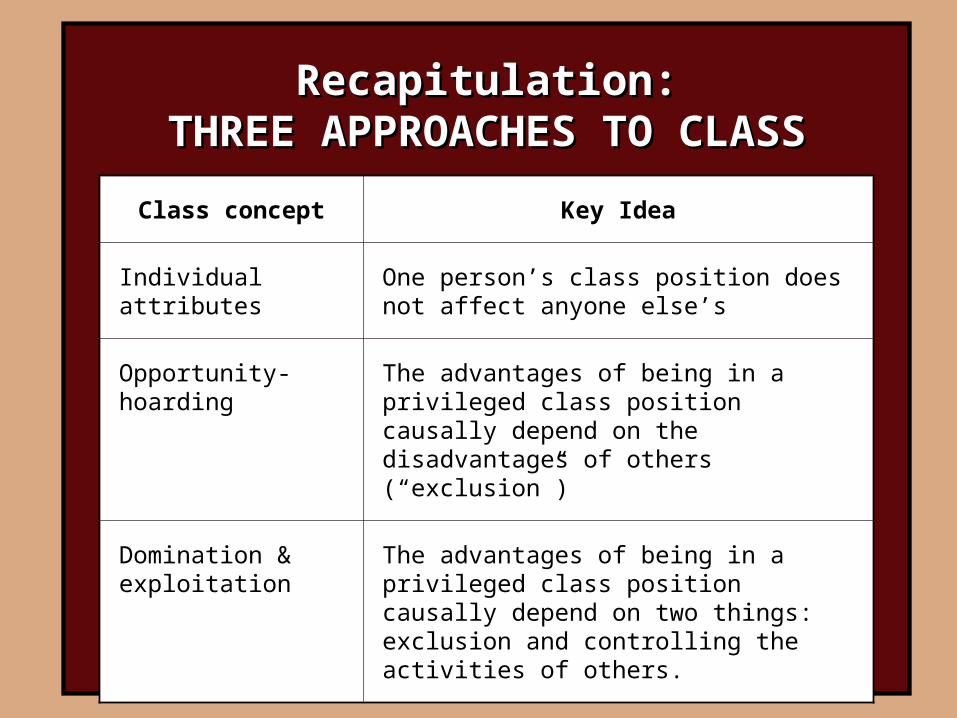
Recapitulation:Recapitulation:THREE APPROACHES TO CLASSTHREE APPROACHES TO CLASS
Class concept Key Idea
Individual attributes One person’s class position does not affect anyone else’s
Opportunity-hoarding The advantages of being in a privileged class position causally depend on the disadvantages of others (“exclusion”)
Domination & exploitation
The advantages of being in a privileged class position causally depend on two things: exclusion and controlling the activities of others.

THE COMPOSITE AMERICAN CLASS STRUCTURETHE COMPOSITE AMERICAN CLASS STRUCTURE
1.1. An extremely rich An extremely rich capitalist/corporate managerial classcapitalist/corporate managerial class
2.2. Historically a large and stable Historically a large and stable middle class middle class anchored in anchored in possession of educational credentials, with an uncertain possession of educational credentials, with an uncertain future.future.
3.3. A A working class working class that was once supported by a strong labor that was once supported by a strong labor movement with living standards overlapping the middle movement with living standards overlapping the middle class, but now quite vulnerable.class, but now quite vulnerable.
4.4. The working poorThe working poor: A poor segment of the working class, with : A poor segment of the working class, with low wages, unconstrained competition, high vulnerability.low wages, unconstrained competition, high vulnerability.
5.5. The underclassThe underclass: A marginalized population living in : A marginalized population living in desperate poverty.desperate poverty.

An Empirical Profile of An Empirical Profile of Inequality in AmericaInequality in America
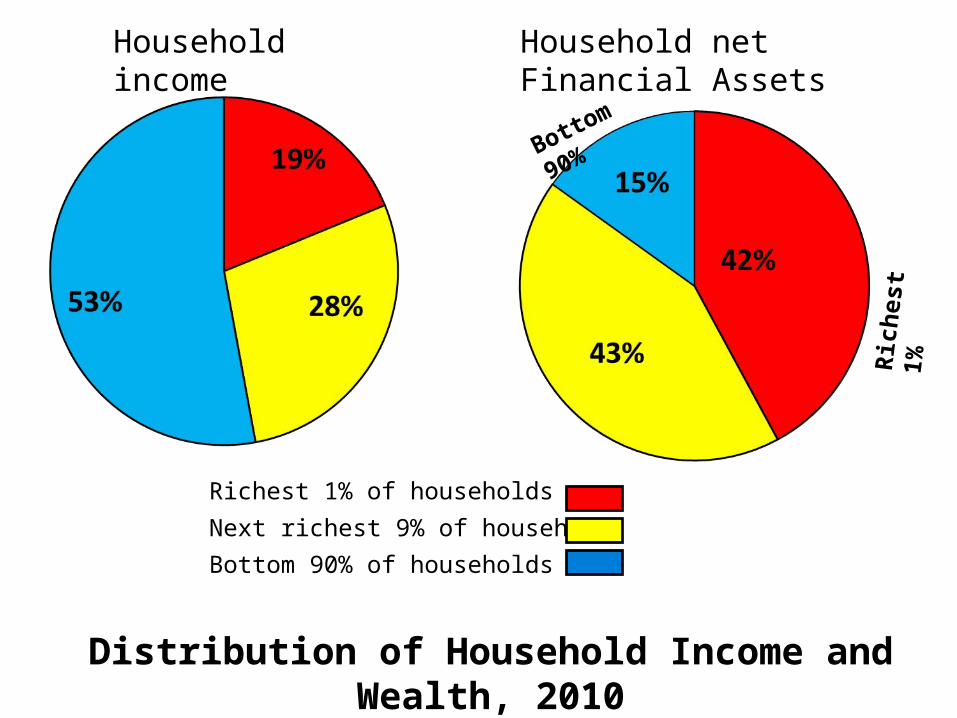
Richest 1% of households
Next richest 9% of households
Bottom 90% of households
Household income Household net Financial Assets
Distribution of Household Income and Wealth, 2010
Ric
hes
t 1%
Bottom 90%
0%
10%
20%
30%
40%
50%
60%
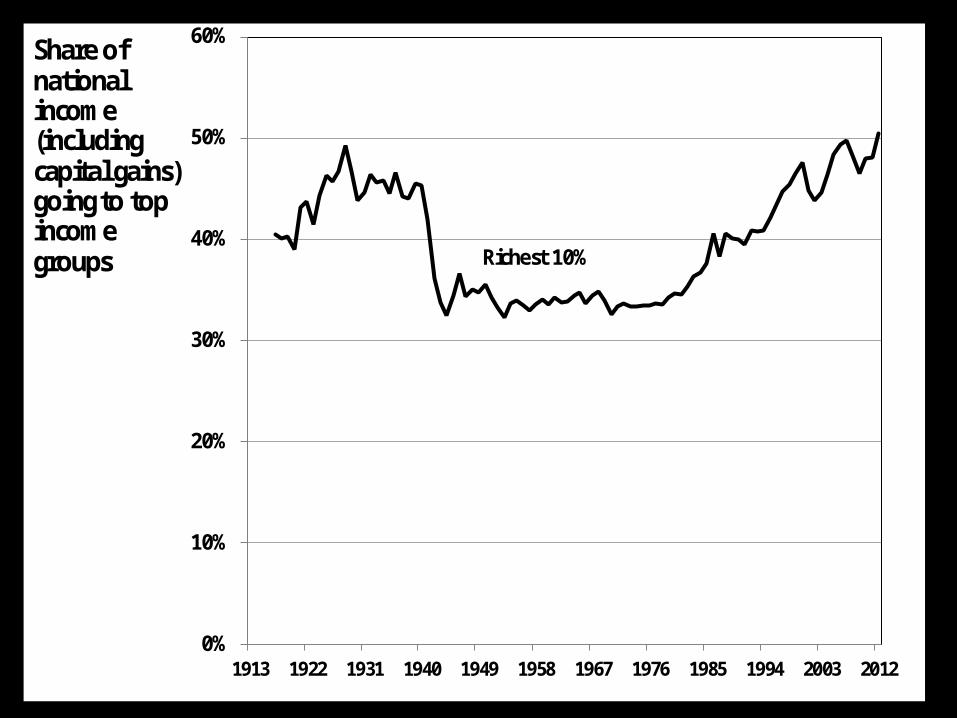
1913 1922 1931 1940 1949 1958 1967 1976 1985 1994 2003 2012
Richest 10%
Share of national income (including capital gains) going to top income groups
0%
10%
20%
30%
40%
50%
60%
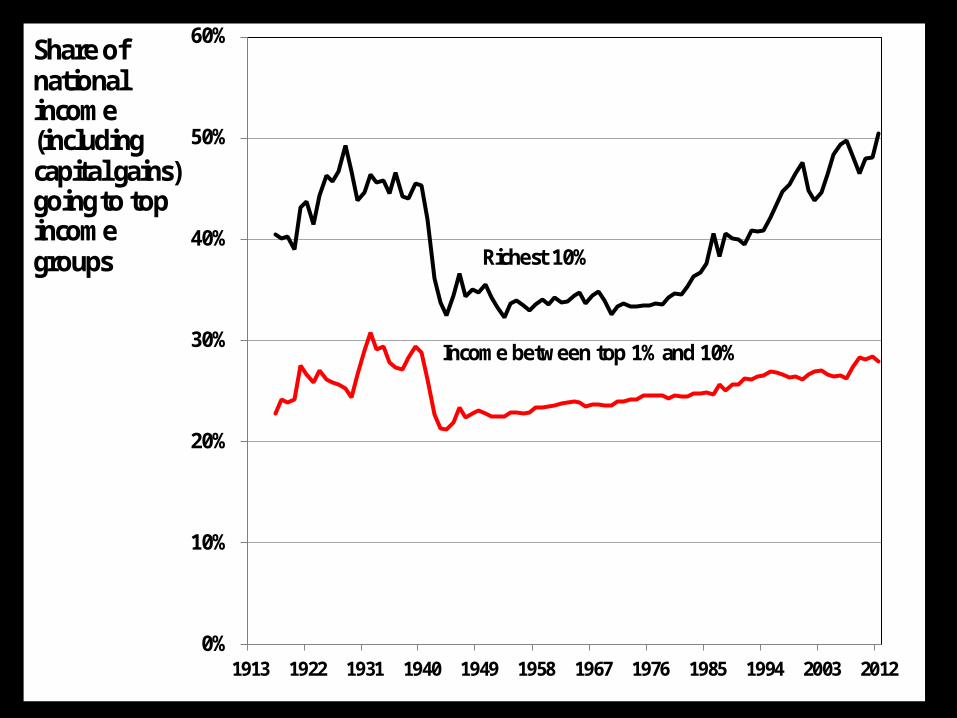
1913 1922 1931 1940 1949 1958 1967 1976 1985 1994 2003 2012
Richest 10%
Income between top 1% and 10%
Share of national income (including capital gains) going to top income groups
0%
10%
20%
30%
40%
50%
60%
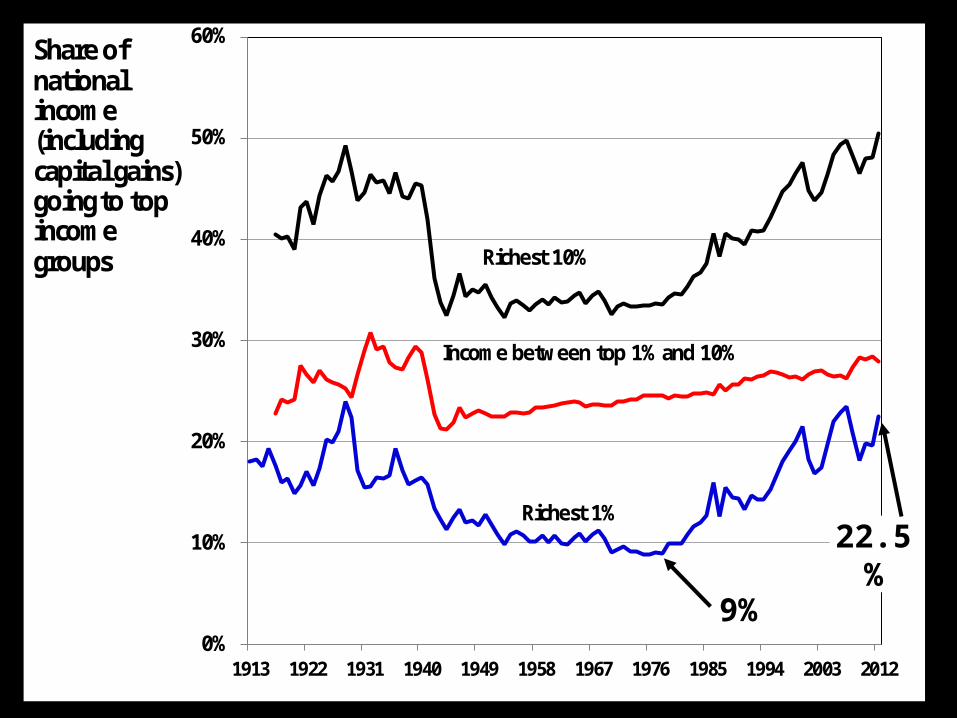
1913 1922 1931 1940 1949 1958 1967 1976 1985 1994 2003 2012
Richest 10%
Income between top 1% and 10%
Richest 1%
Share of national income (including capital gains) going to top income groups
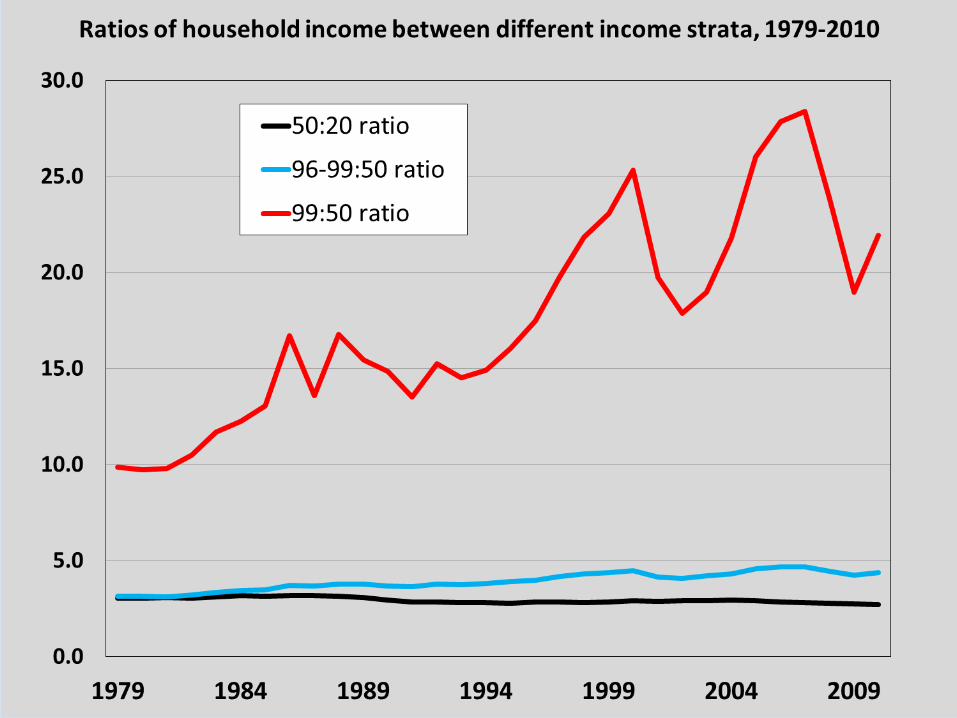
9%
22.5%
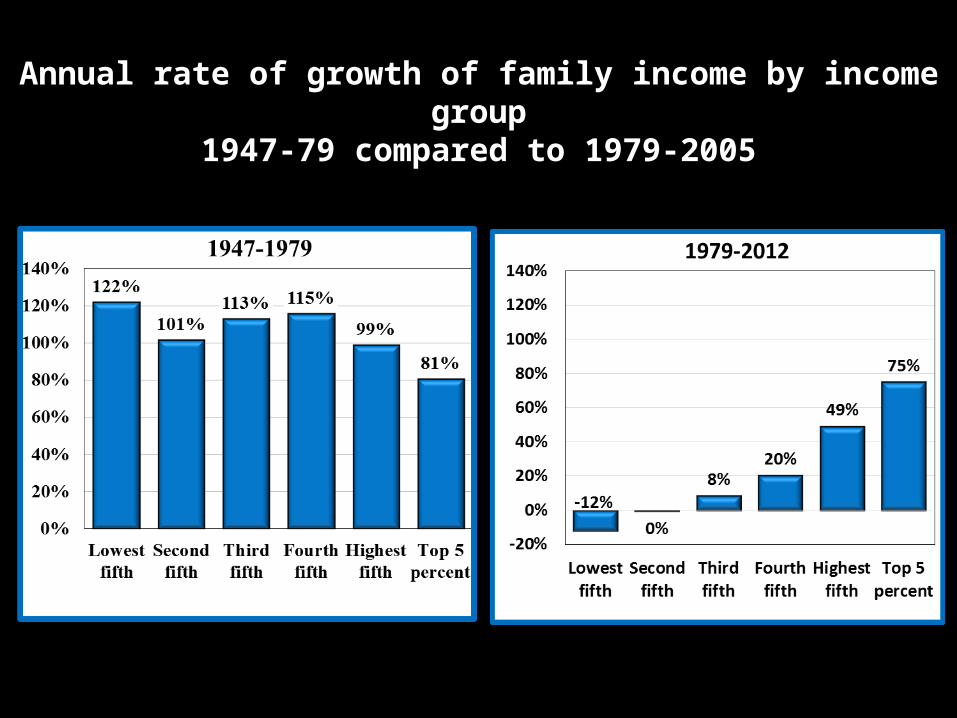
Annual rate of growth of family income by income groupAnnual rate of growth of family income by income group1947-79 compared to 1979-20051947-79 compared to 1979-2005
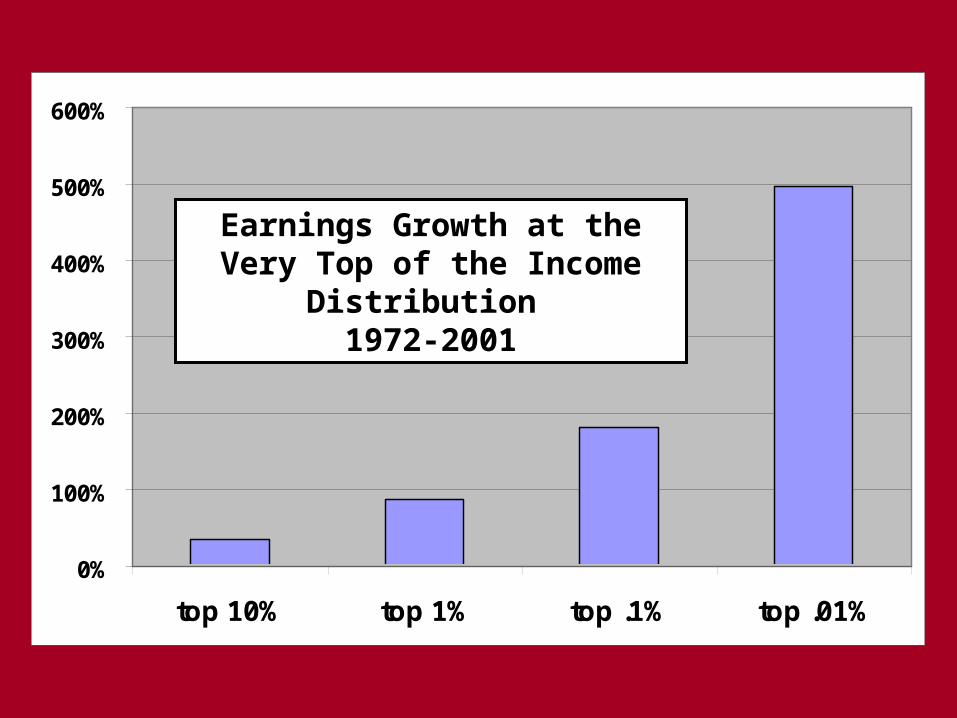
0%
100%
200%
300%
400%
500%
600%
top 10% top 1% top .1% top .01%
Earnings Growth at the Very Top of the Income Distribution
1972-2001
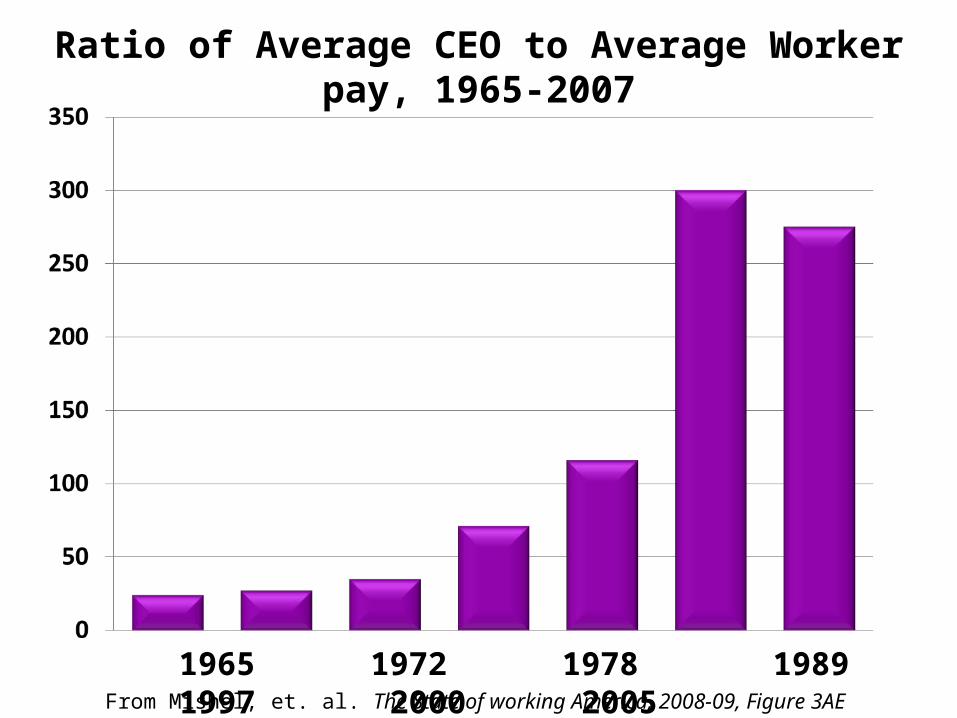
1965 1972 1978 1989 1997 2000 2005From Mishel, et. al. The State of working America, 2008-09, Figure 3AE
Ratio of Average CEO to Average Worker pay, 1965-2007
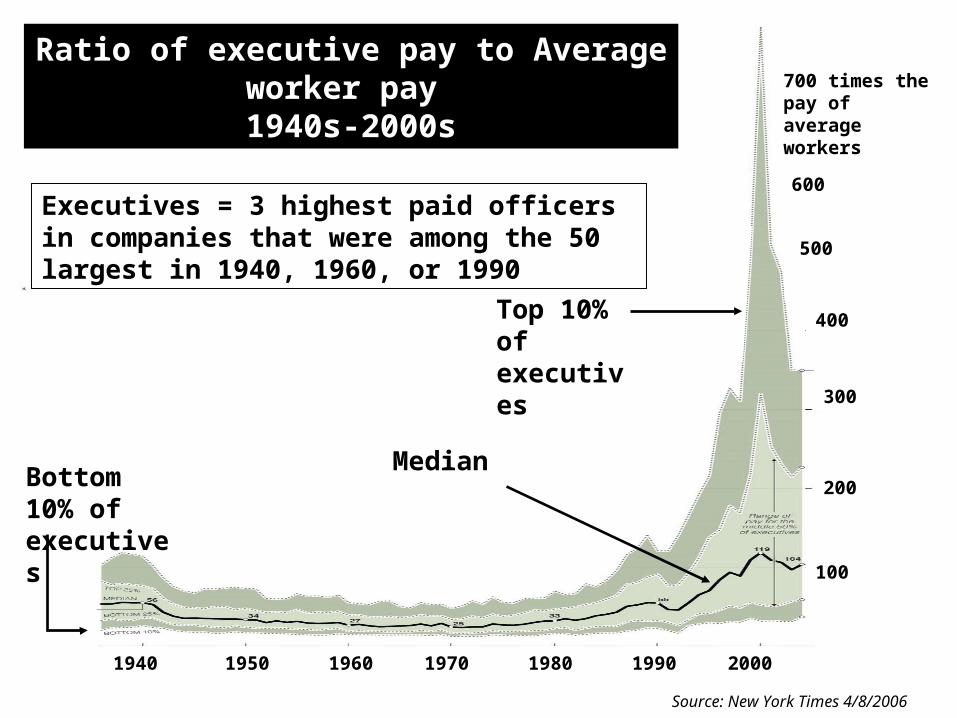
700 times the pay of average workers
500
600
400
300
200
100
Top 10% of executives
Median executiveBottom 10%
of executives
Executives = 3 highest paid officers in companies that were among the 50 largest in 1940, 1960, or 1990
1940 1950 1960 1970 1980 1990 2000
Source: New York Times 4/8/2006
Ratio of executive pay to Average worker pay Ratio of executive pay to Average worker pay 1940s-2000s1940s-2000s
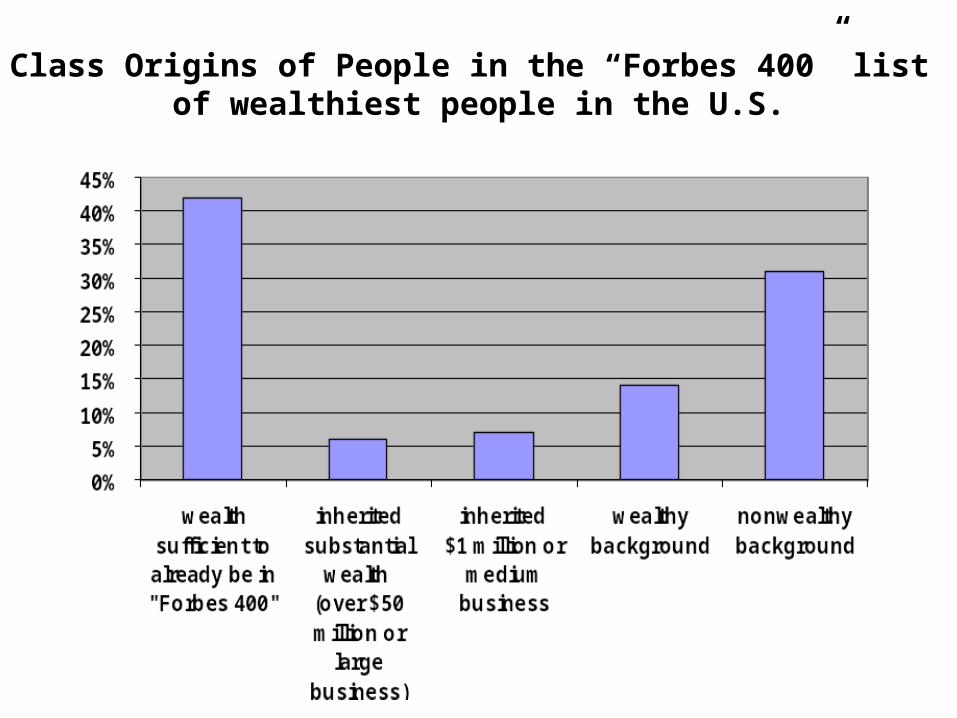
Class Origins of People in the “Forbes 400” list of wealthiest people in the U.S.

An Empirical Profile of An Empirical Profile of Poverty in AmericaPoverty in America
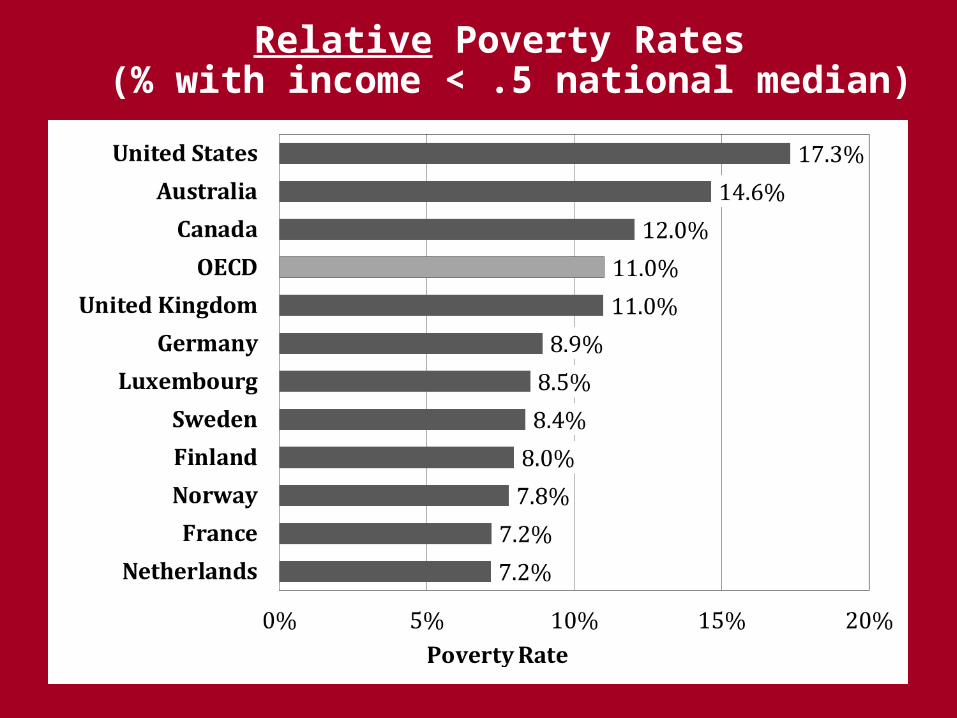
Relative Poverty Rates (% with income < .5 national median)
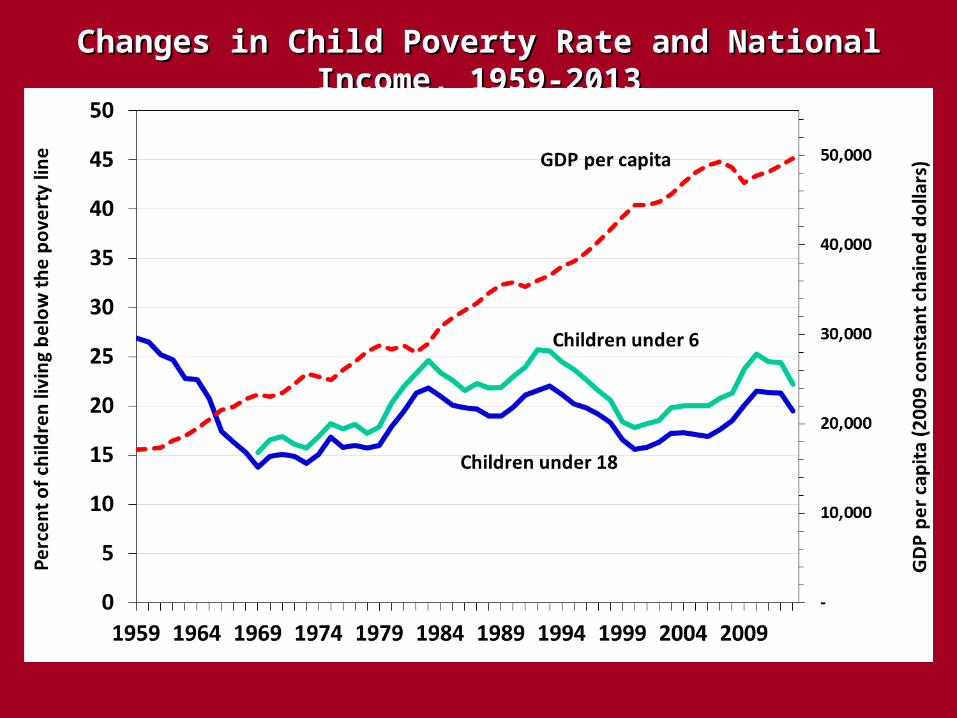
Changes in Child Poverty Rate and National Income, 1959-2013Changes in Child Poverty Rate and National Income, 1959-2013
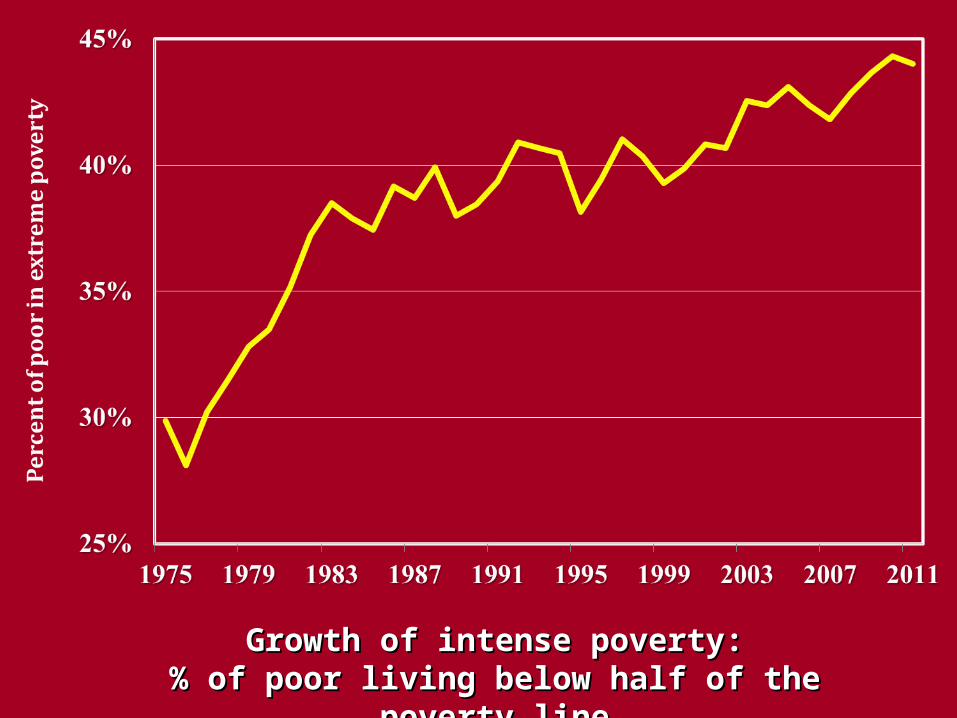
Growth of intense poverty:Growth of intense poverty:% of poor living below half of the poverty line% of poor living below half of the poverty line
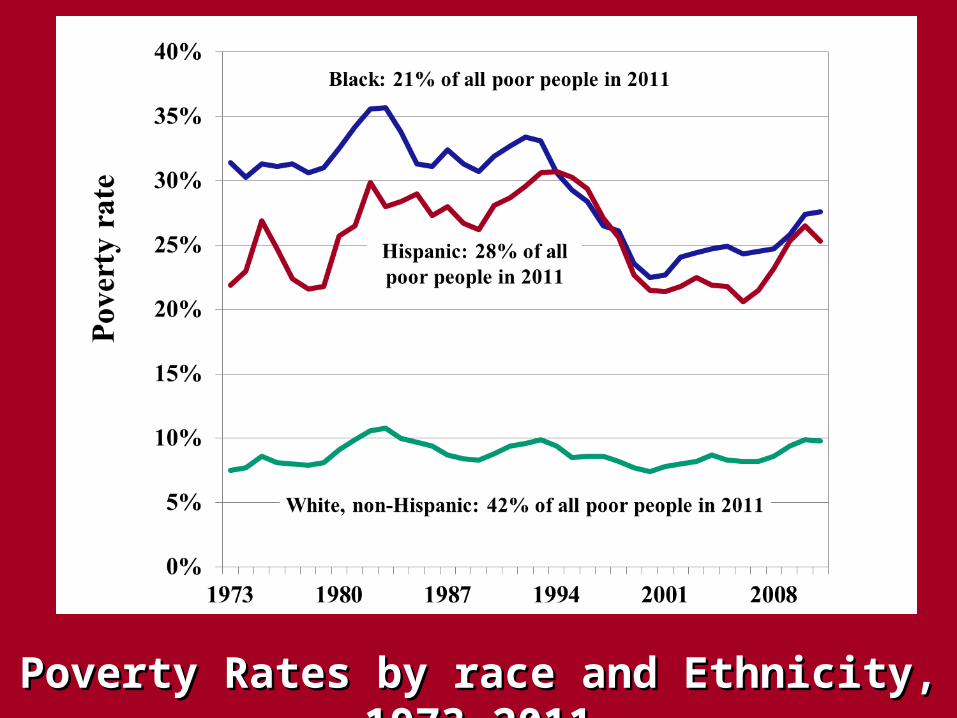
Poverty Rates by race and Ethnicity, 1973-2011Poverty Rates by race and Ethnicity, 1973-2011
Two broad explanations of persistent poverty:
1. Blame the victim
2. Blame society
Blame the victim
Simple reasoning:
1. Some people who are born poor become rich, others do not, sometimes even within a family.
2. There must be something different between those who stay poor and those who do not which explains the different outcomes.
3. Therefore the explanation of poverty must be this individual difference: there must be a personal deficit of some sort.
Blame SocietyBasic idea: Circumstances vary much more between the
poor and the nonpoor do than personalities, motivations or values.
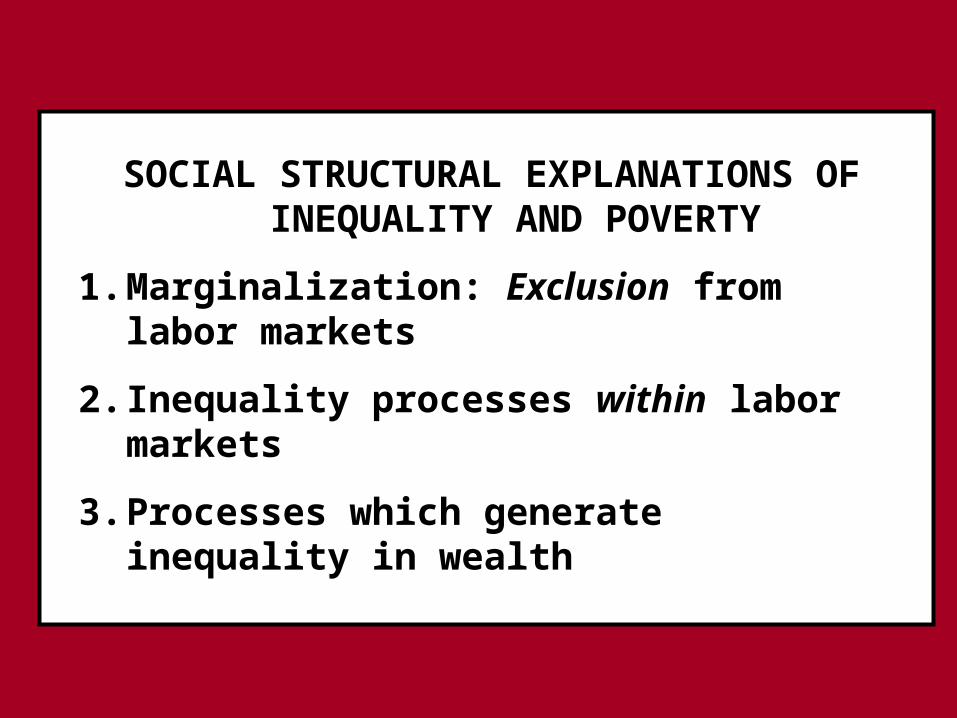
SOCIAL STRUCTURAL EXPLANATIONS OF INEQUALITY AND POVERTY
1. Marginalization: Exclusion from labor markets
2. Inequality processes within labor markets
3. Processes which generate inequality in wealth
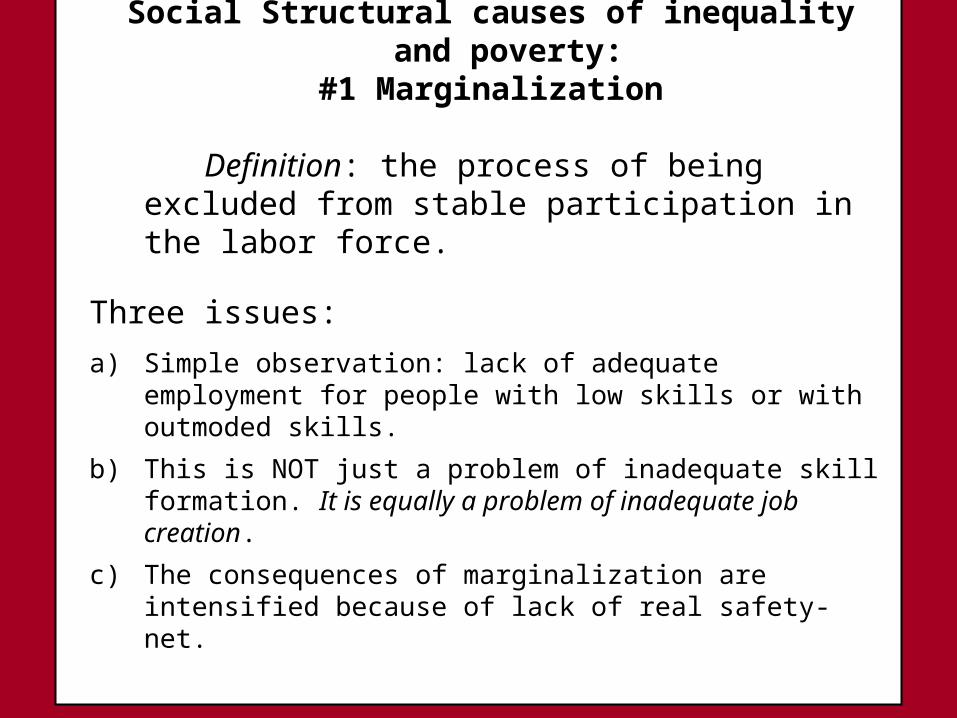
Social Structural causes of inequality and poverty: #1 Marginalization
Definition: the process of being excluded from stable participation in the labor force.
Three issues:
a) Simple observation: lack of adequate employment for people with low skills or with outmoded skills.
b) This is NOT just a problem of inadequate skill formation. It is equally a problem of inadequate job creation.
c) The consequences of marginalization are intensified because of lack of real safety-net.
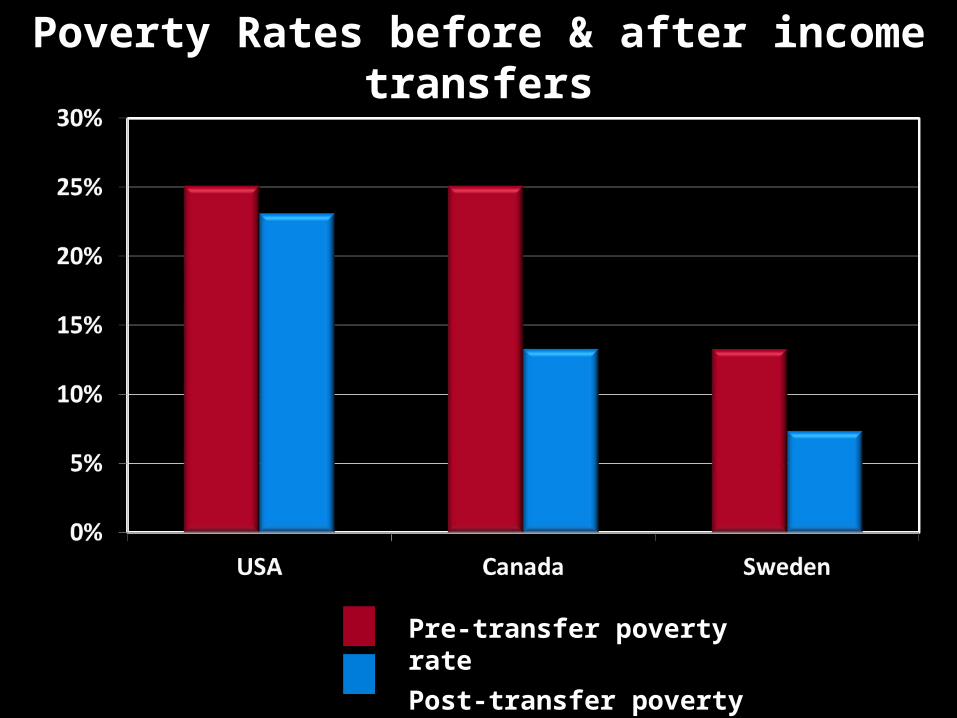
Pre-transfer poverty ratePre-transfer poverty rate
Post-transfer poverty ratePost-transfer poverty rate
Poverty Rates before & after income transfersPoverty Rates before & after income transfers
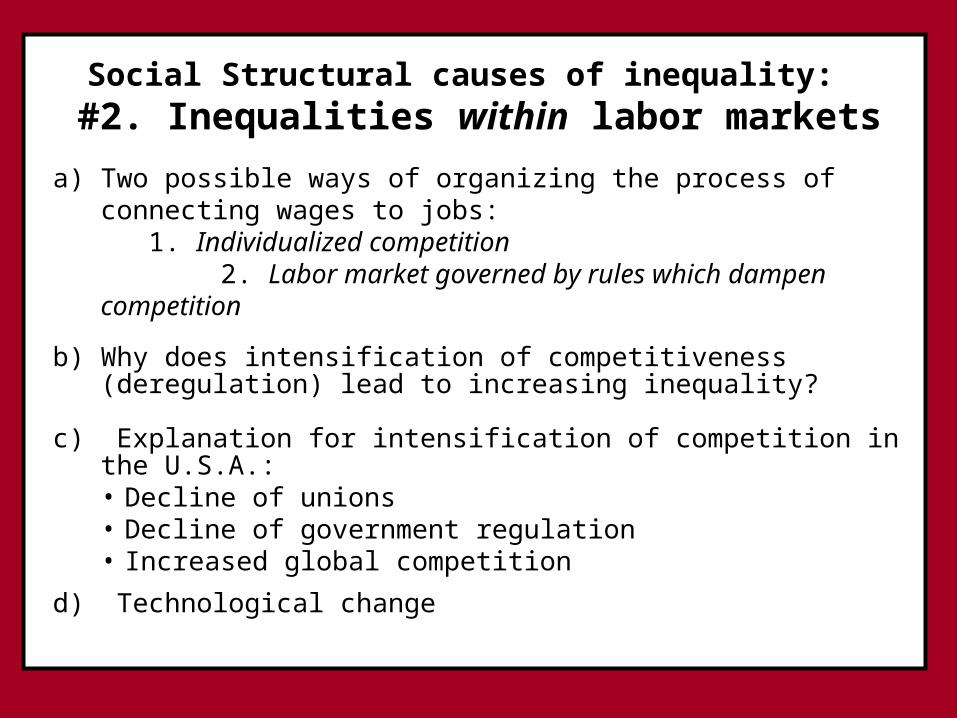
Social Structural causes of inequality: #2. Inequalities within labor markets
a) Two possible ways of organizing the process of connecting wages to jobs: 1. Individualized competition
2. Labor market governed by rules which dampen competition
b) Why does intensification of competitiveness (deregulation) lead to increasing inequality?
c) Explanation for intensification of competition in the U.S.A.:• Decline of unions• Decline of government regulation• Increased global competition
d) Technological change
Social Structural causes of inequality:#3 Wealth inequality
1. Difficult for average person to accumulate much wealth through savings.
2. Stagnation of household income since the early 1970s means that discretionary income for most people has not grown much.
3. Fantastic rise in employment earnings at high end of market has allowed professionals and managers to turn surplus earnings into capitalist wealth (stocks, bonds, etc.)