Embed Size (px)
Citation preview

i
Socioeconomic status and chronic illnesses: an analysis of the
National Income Dynamics Study data
by
MOHAMMED YACOOB VAWDA
Submitted
in partial fulfilment of the academic
requirements for the degree of
Master in Population Studies
in the School of Development Studies,
University of KwaZulu-Natal
Howard College Campus
Durban
November 2011
ii
Declaration
Submitted in partial fulfilment of the requirements for the degree of Masters in Population
Studies, in the Graduate Programme in the School of Development Studies, University of
KwaZulu-Natal, Durban, South Africa.
I declare that this dissertation is my own unaided work. All citations, references and borrowed
ideas have been duly acknowledged. It is being submitted for the degree of Masters in
Population Studies in the Faculty of Humanities, Development and Social Science, University of
KwaZulu-Natal, Durban, South Africa. None of the present work has been submitted previously
for any degree or examination in any other University.
_____________________________
Student signature
______________________________________
Date
iii
Abstract
Over the past decade, chronic illnesses have increased significantly in developing regions around
the world, with implications for health service provision. Research shows that morbidity follows
a social gradient in many countries around the world.
Though various studies highlight the importance of socioeconomic status as a predictor of a
person’s morbidity and mortality experience, there is a dearth of data and literature in the South
African context. This study aimed to address this gap by examining the association between
socioeconomic status and diabetes and hypertension among participants aged 35 years and older.
This was achieved by undertaking the analysis of secondary data from the National Income
Dynamic Study.
The findings of the study reveal that there is a significant relationship between socioeconomic
factors and chronic health outcomes of individuals. People with lower levels of education were
more likely to have a chronic illness than those with higher levels of education. However,
interestingly the lowest rates of prevalence were found in the unemployed category in South
Africa. This draws attention to the need for further research on employment and chronic disease
prevalence. An important finding of the study was the relatively higher prevalence of chronic
conditions in rural areas and among the Black/African population. This data suggests that
changes in lifestyle and behavior in the context of globalization and urbanization may be
contributing to changes in the health profile of these communities. Policy makers need to
acknowledge that chronic diseases are no longer the preserve of the wealthy with diseases such
as diabetes and hypertension evident across all sectors of South African society. By addressing
the causes of chronic conditions policies and programs can aim to prevent the emergence of
future epidemics. In the long-term, sustainable progress will only be achieved with greater
attention directed towards the socioeconomic factors underlying the health profile of the country.

iv
Acknowledgements
To my mentor, Professor Arvin Bhana, I would like to express my sincere gratitude for giving
me the encouragement and support to complete this dissertation.
To my supervisor, Ms. Kerry Vermaak, thank you for your time, advice and patience. This would
have never been possible without your guidance.
To my good friends, Nompumelelo Nzimande, Priya Konan and Kanagie Naidoo, I appreciate
the assistance, time and willingness to help me.
To my family, thank you for the support you give in your own special way. You have inspired
me to always pursue my goals.
Thank you to my sponsor, without your assistance, I would have never been able to complete.
To Mohammed and Feroza Alli, I am grateful for the motivation to complete and for the love,
care and support you have given me through these years.
To my wife, Farzana Alli, you are my support and encouragement. This would not have been
possible without you.
Lastly and most importantly I wish to thank my parents, Shabbir Ahmed Vawda and Fatima
Vawda for their sacrifices, love, inspiration and advice. It is to you that I dedicate this thesis.

v
Acronyms
CI Confidence Interval
CNS Central Nervous System
NIDS National Income Dynamic Study
NRC National Research Council
PCA Principle Component Analysis
SES Socioeconomic Status
WHO World Health Organisation
WB World Bank
Disclaimer: The use of race terminology was used during the period of apartheid. Due to the
segregation laws of apartheid, socioeconomic status across race groups differed. The study
therefore allows the continued use of race to better understand the South African context.

vi
Table of Contents
Declaration ...................................................................................................................................... ii
Abstract .......................................................................................................................................... iii
Acknowledgements ........................................................................................................................ iv
Acronyms ........................................................................................................................................ v
Chapter one ..................................................................................................................................... 1
Introduction ................................................................................................................................. 1
1.1 Background ................................................................................................................... 1
1.2 Aims and objectives of the study .................................................................................. 3
1.3 Theoretical framework ................................................................................................. 4
1.4 Structure of the dissertation .......................................................................................... 7
Chapter two ..................................................................................................................................... 8
Literature review ......................................................................................................................... 8
2.1 Introduction ....................................................................................................................... 8
2.2. Socioeconomic status and health ..................................................................................... 8
2.3. Chronic illness ............................................................................................................... 14
2.4. Summary ........................................................................................................................ 18
Chapter Three................................................................................................................................ 20
Methodology ............................................................................................................................. 20
3.1Introduction ...................................................................................................................... 20
3.2. The National Income Dynamic Study ............................................................................ 20
3.3. Study hypothesis ............................................................................................................ 23
3.4. Key questions ................................................................................................................. 23
3.5. Outcome variable ........................................................................................................... 23
3.6. Associated variables....................................................................................................... 24
3.7. Other control variables ................................................................................................... 27
3.8. Data analysis .................................................................................................................. 28
3.9 Limitations of the Study.................................................................................................. 29
3.10. Summary ...................................................................................................................... 29
Chapter Four ................................................................................................................................. 31
Results ....................................................................................................................................... 31

vii
4.1 Introduction ..................................................................................................................... 31
4.2 The National Income Dynamics Study (NIDS) .............................................................. 31
4.3 Investigating the relationship between socioeconomic status and chronic illness ......... 34
4.4 Bivariable and multivariable analysis ............................................................................. 38
4.5 The impact of socioeconomic status on acquiring hypertension and diabetes ............... 45
4.6 Conclusion ...................................................................................................................... 50
Chapter Five .................................................................................................................................. 51
Discussion and conclusion ........................................................................................................ 51
5.1. Introduction .................................................................................................................... 51
5.2 Discussion ....................................................................................................................... 51
5.3 Recommendations and Conclusion ................................................................................. 57
Reference List ............................................................................................................................... 59
Appendix ....................................................................................................................................... 64
Appendix 1: National Income Dynamics. Study Wave 1: 2008. Adult (15+) Questionnaire .. 64
Appendix 2: National Income Dynamics. Study Wave 1: 2008. Household Questionnaire .... 64
1
Chapter one
Introduction
“Knowing the causes of death is vital for planning for the future”
Lehohla (2006:2)
1.1 Background
Focusing on the health and well-being of a population is important for informing policy and
planning. Numerous studies show that ill-health has a significant impact on the social and
economic systems of countries (Robinson, Pearson, and Norris, 2007). It leads to higher
dependency on social security; high medical costs; reduced numbers of skilled labourers; and
economic melt-down (National Research Council, 2006). Consequently, on a macro level, this
has a profound impact on the economic and social systems of countries including its ability to
maintain contributions and provide resources to the population (National Research Council,
2006). Understanding the causes of ill-health is therefore essential in re-orientating the health
responses of countries.
Existing studies suggest that mortality and morbidity follow a social gradient in many countries
around the world (Ross, et al., 2011). Material and social deprivation have been directly linked to
disease incidence and prevalence and inversely related to health (Brown, et al., 2004). A study
by Hallman (2005) shows that socioeconomic disadvantage is associated with a variety of unsafe
behaviours and experiences. This predisposes people to negative health outcomes. An extensive
body of literature shows that people with a lower socioeconomic status therefore often have
heightened rates of overall mortality and morbidity, including the development of chronic
conditions, in comparison to individuals with a higher socioeconomic status (Brown, et al., 2004;
Frolich, Ross, and Richmond, 2006). Consequently, socioeconomic status is regarded as one of
the strongest and most consistent predictors of a person’s morbidity and mortality experience
(Winkelby, 1992).

2
Despite these findings, there is a lack of adequate research on socioeconomic position and health
status particularly in developing country contexts such as South Africa. South Africa has one of
the highest Gini coefficients in the world (0.61) highlighting the huge wealth and income
discrepancies disparities among its citizens (Steyn, 2006; Steyn and Bradshaw, 2001). In 1996,
52 % of households in South Africa were reportedly living in poverty (Steyn and Bradshaw,
2001). A total of 47.1 % of the population were below the "lower-bound" poverty line proposed
by Statistics South Africa in 2007 (Armstrong, Lekezwa, and Siebrits, 2009). With regard to its
health profile, South Africa faces a dual burden of infectious and chronic diseases (Joubert and
Bradshaw, 2005). Chronic diseases including respiratory disease, cardiovascular disease,
diabetes, cancer and hypertension account for a large majority of the country’s mortality and
morbidity burden. According to Mayosi et al. (2009) the number of deaths caused by chronic
illnesses constitutes the second most important cause of death among the adult population. In
South Africa hypertension and diabetes are rated among the top ten diseases and conditions
contributing to mortality (Puoanei, et al., 2008). In the year 2000, there were approximately 6.5
million people (26.9 %) diagnosed with diabetes with South Africa having (Health24, 2006).
During the periods 1999 to 2006, statistics showed an increase of 38% in the number of diabetic
patients (Mayosi, et al., 2009). Aside from diabetes, hypertension accounts for a large majority
of the chronic disease burden in South Africa. In 2007 an estimated 5.5% of the total population
in the country was living with hypertension (CureResearch, 2008). Between 1997 and 2004,
statistics suggest that 195 people died per day as a result of heart disease and hypertension
(Donjeany, 2008). It is projected that if the current rate of chronic disease incidence is sustained,
there will be an increase of 41% by 2030 for people between the ages 35 and 64 (Donjeany,
2008). According to Donjeany (2008) more than half the deaths due to chronic disease occur
before the age of 65 years. These are premature deaths that affect the workforce in the country
and people who are in their productive years. In light of this fact the economic impact on the
country and its people will be enormous (Donjeany, 2008).
Though research on chronic illness and socioeconomic status is lacking in Africa, globally much
research has been conducted in the United Kingdom on the relationship between diabetes and
socioeconomic position as well as on the relationship between hypertension and socioeconomic
position (Chaturvedi, 2004). However, the United Kingdom is a first-world country and also

3
lacks the historical context of South Africa, which makes generalization a difficult task. From a
developmental perspective, the socioeconomic status of South Africa presently, is very much an
image of South Africa’s historical past characterized by segregation, inequalities and racial
prejudices. The establishment of the Union of South Africa in 1910 first saw the entrenchment of
racial prejudices and policies of segregation. In 1948, this notion of segregation was transformed
with the elected Nationalist Party in the form of Apartheid (McClinton and Zuberi, 2006).
Apartheid essentially institutionalized segregation laws which, in the decades that followed,
consequently led to huge discrepancies between the socioeconomic status of the different race
groups. Presently there has been low growth, low education and high unemployment that has
further entrenched the divide between different socioeconomic groups. Despite this, there is a
dearth of literature on the relationship between socioeconomic status and chronic illness in South
Africa (Schneider, Manabile, and Tikly, 2008). An analysis of South Africa’s past highlights the
significant role that external factors play in influencing the health status of people. However,
over the past decade, most studies conducted in the South African context have focussed on
health in relation to the HIV and AIDS epidemic or communicable diseases such as tuberculosis
and their relationship to socioeconomic status (Kelly, Freeman, Nkomo, and Ntlabati, 2009).
Over the next few years, mortality and morbidity from chronic diseases are expected to
outnumber those by communicable diseases (de-Graft Aikins, 2010; Joubert and Bradshaw,
2005). In light of this, urgent attention needs to be directed towards understanding the link
between socioeconomic status and chronic illness.
1.2 Aims and objectives of the study
Chronic illnesses are the largest cause of mortality in the world, yet over the last decade, health
literature has focused predominantly on the HIV and AIDS epidemic (Yach, 2004). Literature on
chronic illnesses, particularly in Africa, is scarce while data is often incomplete or lacking. The
challenge of reducing the burden of chronic illnesses is also exacerbated by high levels of
poverty and the presence of communicable diseases including malaria, tuberculosis and AIDS. In
light of the fact that chronic illnesses are experienced by a large majority, are life-threatening,
and have serious social, economic and psychological implications they demand urgent priority in
the field of health (Schmittdiel, Bodenheimer, Solomon, Gillies, and Shortell, 2005). According

4
to Kearney, et al. (2005) the number of people with chronic conditions are expected to increase
dramatically in the next ten years if there are no intervention strategies put into place.
The study presented, aimed to address this research gap by focussing on the association between
socioeconomic status and chronic illnesses. It focussed specifically on diabetes and hypertension
since these were highlighted among the top ten chronic conditions contributing to mortality in
the context of South Africa (Puoanei, Tsolekilei, Sandersi, and Parkerii, 2008). At the same time
these chronic conditions are non-communicable unlike HIV and AIDS or tuberculosis. The data
for the study was obtained from the first wave of the National Income Dynamic Study (NIDS).
This was analysed using the socioeconomic determinants highlighted in the Adler-Ostrove model
of 1999 namely; years of schooling, employment status, income and place of residence. By
providing insight into the relationship between socioeconomic status and chronic illness in South
Africa this study aims to guide health and policy initiatives towards launching more effective
ways of reaching people at risk of chronic illnesses. At a broader level, understanding the
socioeconomic determinants of health is important in reducing socioeconomic and health
inequalities in South Africa and guiding the country towards achieving its health goals (Adda,
Chadola, and Marmot, 2002; Steyn and Bradshaw, 2001). This would call for policies to advance
“income redistribution, educational opportunities, employment conditions, the material
environment and lifestyles of the population” (Adda, et al., 2002:1).
1.3 Theoretical framework
The theoretical model employed for this study was created in 1999 by Nancy Adler and Joan
Ostrove. The model, shown in Figure 1, shows the pathways through which the socioeconomic
status of individuals or communities can indirectly influence patterns of health (Adler and
Ostrove, 1999). More specifically it provides a basis for defining socioeconomic status and the
effects thereof (Adler and Ostrove, 1999). These include both the distal and proximate
determinants of health and illness. Adler and Ostrove (1999), highlight that the distal factors
affect the proximate determinants which influence good or ill-health.

5
The model was created to guide research on the different mechanisms that may influence the
health status of individuals (Adler and Ostrove, 1999). However, many researchers have
critiqued the model and highlighted that it lacks certain defining concepts of socioeconomic
status (Adler and Ostrove, 1999). For the study presented, this model has been adapted to analyse
socioeconomic status and the manner in which it influences health and illness. The model shows
that exposure to different elements and adaptations to these elements create a pathway from
socioeconomic status to health and illness (Adler and Ostrove, 1999).
The four variables used to define socioeconomic status in the study are years of schooling,
employment status, income and place of residence. The definition of socioeconomic status
excluded years of schooling however this study incorporated this as it could prove to be an
important factor influencing health status. For instance, years of schooling influences
employment status, income and place of residence. Place of residence with regard to
socioeconomic status describes influences at both an individual and community level. It refers to
surrounding environment including the external environment, the social environment and the
available resources, such as food, water, transport and shelter in the environment (Adler and
Ostrove, 1999). In the model, employment status and income also define socioeconomic status.
These two variables predominantly work together, in that if an individual is employed then they
should be earning an income. Income can be categorised and differs from one person to the next.
In essence, according to the model, the four variables that make up socioeconomic status
influence the environmental and psychological constraints (Adler and Ostrove, 1999).
Psychological constraints of socioeconomic status include cognitive consequences, such as self-
esteem, self-confidence, self-motivation and levels of achievable social status. Environments that
are limiting also limit the psychological ability of individuals. Therefore, the environmental
constraints can also influence the psychological aspect for the individual and the community at
large, as seen in Figure 1 (Adler and Ostrove, 1999). Both environmental and psychological
constraints determine the manner in which individuals act or behave. This good or bad behaviour
in-turn affects the person’s health outcomes. Behavioural characteristics such as smoking and
drinking can influence ill-health, whereas healthy-eating may produce good health. The
combination of environmental and psychological factors determine the extent to which the

6
individual experiences repeated stress responses (Adler and Ostrove, 1999). The increased stress
levels may have long-term effects on the immune and cardiovascular systems.
Psychological and environmental constraints influence different proximate determinants of
health. Adler and Ostrove (1999) found that with environmental constraints, different
environments allow for different levels of exposure to carcinogens and pathogens. These
environmental bacteria influence the health status of individuals directly. With regard to the
psychological aspect, the Central Nervous System (CNS) and endocrine response associated with
repeated exposure to stress has long-term effects on a person’s health status. This may therefore
lead to the onset or rapid progression of disease (Adler and Ostrove, 1999).
Figure 1.1: Model of the pathways through which socioeconomic status influences health
Source: adapted from MacArthur Network on SES and Health in Adler and Ostrove, 1999

7
A critique of the model is that the model seems to be oversimplified. For instance Figure 1 shows
the arrows between the boxes pointing in one direction. This implies that socioeconomic status
influences health in the various ways. In reality however, the health status of individuals can also
influence their socioeconomic status. For instance a person with ill-health may not necessarily be
employed or earning an income thus affecting their socioeconomic status. Therefore, the arrows
between boxes could actually point in both directions (Adler and Ostrove, 1999). For the
purposes of this study, the causal relationship does not matter considerably as I am looking at the
association between socioeconomic status and chronic illness. I have chosen to exclude family
medical history as well as lifestyle from the model, as NIDS datasets are limited in that context.
1.4 Structure of the dissertation
This thesis is divided into 5 chapters. Chapter 1 introduces the study and outlines the theoretical
framework in addition to highlighting the aims and objectives of the research. Chapter 2 provides
a literature review which explores past research to better inform the study. Chapter 3 will focus
on the research methodology, variables used in the study, and the methods used to analyse the
data. Chapter 4 will include an in-depth discussion of the findings obtained from the study. The
concluding chapter, chapter 5, will provide a summary of the research and highlight
recommendations for future research.

8
Chapter two
Literature review
2.1 Introduction
Over the past decade, many countries around the world have undergone an epidemiological
revolution. In sub-Saharan Africa this has led to a quadruple disease burden characterised by
communicable, non-communicable, perinatal, maternal, and injury-related disorders (Mayosi, et
al., 2009). In developing countries, the challenge of reducing the burden of chronic illnesses is
exacerbated by high levels of poverty and the presence of communicable diseases including
malaria, tuberculosis and AIDS. Over the next 20 years the burden of chronic illness is expected
to increase from 28 to 51 % (Nawi, 2010). Consequently, urgent attention is needed on the
socioeconomic determinants of chronic diseases. The purpose of this chapter is to provide a
review of literature on the impact of socioeconomic status on health. This chapter begins by
discussing the impact of the four variables on health namely; years of schooling, employment
status, income and place of residence. It then highlights existing literature on chronic illnesses
and the impact that socioeconomic status has on the health outcomes of people.
2.2. Socioeconomic status and health
The health of individuals and populations are strongly influenced by a number of factors often
described as the social determinants of health (Raphael, 2006). The social determinants of health
are the “conditions in which people are born, grow, live, work and age” (World Health
Organisation, 2008:np). At the micro-level, these determinants lead to individual health or illness
over time (Raphael, 2006). One of the key determinants which have been identified as
contributing to the health outcomes of individuals is socioeconomic status. Socioeconomic status
can be defined as "the relative position of a family or individual on a hierarchical social
structure, based on their access to or control over wealth, prestige and power” (Shavers,
2007:1013). Research suggests that an individual’s health is highly correlated with his or her
social position (Low, Low, Baumler, and Huynh, 2005). Based on the Adler and Ostrove

9
theoretical model, socioeconomic status is a complex phenomenon that is influenced by a
number of variables including: years of schooling, employment status, income and place of
residence. Existing research suggests that although these dimensions of socioeconomic status are
interrelated, each reflects rather different in individual and societal forces associated with health
and disease (Winkelby, 1992).
Although this study focuses on specific variables to define socioeconomic status, there are
various other ways of conceptualising socioeconomic status. Filmer and Pritchett (2001)
highlighted the use of the principle component analysis (PCA) method and added the assets
variable to their model. Schelenberg, Victora and Mushi (2003) included rental or ownership of
land while the demographic conditions of people within the household and other economic
proxies was added by Cortinovis, Vela and Ndiku (1993). Montgomery, Gragnolati, Burke and
Paredes (2000) who recognized the lack of a ‘best practice’ approach emphasized that the
variables in an SES model should be chosen on an ‘ad hoc’ basis to proxy living standards.
2.2.1. Years of schooling
Education, one of the most commonly used measures of socioeconomic status, is a strong
predictor of quality of life and long-term health (Low, et al., 2005). Education level has been
associated with improved health outcomes with each additional year in school associated with
increased life expectancy (Sanchez-Vaznaugh, Kawachi, Subramanian, Sanchez, and Acevedo-
Garcia, 2009). Research shows that education is linked to health and the determinants of health
including health behaviours, preventative service use and risky contexts (Feinstein, Sabates,
Anderson, Sorhaindo, and Hammond, 2006).
Existing studies suggest that individuals who have a higher level of education have lower self-
reported morbidity rates for chronic diseases than those with a lower level of education (Cutler,
2007). Individuals with higher levels of education are also found to report more positive health
behaviours with regard to smoking, drinking, obesity and drug use (Deaton, 2002). A study on
the relationship between socioeconomic status and diabetes control and complications in Europe,
found that healthy lifestyles were more prevalent in better educated men and women

10
(Chaturvedi, et al., 2011). People with a college level education were the least likely to be
current smokers and were most likely to partake in vigorous exercise (Chaturvedi, et al., 2011).
Smoking prevalence has been shown to be inversely associated with education level while an
inverse association also exists between education level and body mass index (Cremeens, 2009;
McLaren, 2007). As a result, Cutler and Lleras-Muney (2005) cite that less education is a
stronger predictor of chronic disease risk behaviours.
One of the explanations for the association between health and education is that individuals with
higher education are more likely to benefit from new health information, have a greater
awareness of health problems and are therefore more likely to benefit from health services
(Deaton, 2002). At the same time, education is associated with acquiring positive psychological,
social, and economic resources (Winkelby, 1992). Years of schooling is also a major factor in
determining social and occupational status in adulthood (Low, et al., 2005). Consequently, it has
significant implications for an individual’s health status.
2.2.2. Employment status
Employment is one of the most significant determinants of health. Existing research highlights
that an individual’s employment status has a significant impact on their physical and mental
health and life expectancy (DOH, 2006; Doyle, Kavanagh, Metcalfe, and Lavin, 2005; Rueda et
al., 2011).
A study on educational attainment and the association between major depressive disorder and
type 2 diabetes found that the risk associated with major depressive disorder was elevated among
those with 12 or fewer years of education in comparison to those with at least some education
beyond high school (Mezuk, Eaton, Golden, and Ding, 2008). Among men unemployment has
been associated with mental health or substance abuse problems while women who are
unemployed have higher rates of diagnosed disorders (DOH, 2006). A study on employment
trajectory as a determinant of change in health-related lifestyle found that, in both genders, sleep
duration decreased during chronic unemployment and among those on a downward employment
trajectory (Virtanen, et al., 2008). In men, alcohol consumption also increased in these two

11
groups while body weight increased among those on a downward employment trajectory.
Similarly among women, physical activity decreased among those on a downward trajectory
(Virtanen, et al., 2008). These negative health behaviors predispose individuals to poor health
outcomes. For instance smoking and obesity are key risk factors for diabetes, cardiovascular
disorders, and respiratory diseases. Consequently unemployment has been cited as a cause of
premature mortality. Studies find that unemployed people with no previous illness were more
likely to die at a younger age than the general population (Doyle, et al., 2005). There therefore
may be various physical, mental health and psychological health benefits associated with
obtaining or keeping employment (Reine, Novo, and Hammarstrom, 2008).
The World Health Organization highlights numerous ways through which employment can
benefit mental health (WHO, 2011). These include a sense of making a valuable contribution
through work, the provision of structured time and social contact (Doyle, et al., 2005; WHO,
2011). Employment is also associated with responsibility, prestige, and increased social networks
which have all been shown to have a positive impact on a person’s health outcomes (Doyle, et
al., 2005). On a broader level, employment also has an impact on other aspects of people’s lives
that are important for health such as family life, including caring and support of families, and
social life (Doyle, et al., 2005). The loss of a job or unemployment can therefore be detrimental
to a person’s health.
2.2.3. Income
The strong association between income and health status has been documented in numerous
literature. Chronic diseases have in the past been associated predominantly with the wealthy and
lifestyles of developed nations (Puoanei, et al., 2008). However, driven by changing
environments, developing countries are increasingly adopting the unhealthy lifestyles linked to
chronic disease acquisition (Nugent, 2008). Studies on income inequality show that mortality is
positively and significantly correlated with almost any measure of income inequality (Deaton,
2002). Examining the presence of various risk factors for chronic disease at different income
levels can provide insight into the changing disease profile.

12
In South Africa income has a large causal effect on general health status. Using data from an
integrated survey of health and economic wellbeing a study on the old age pension in South
Africa found that income influenced health through nutritional status, living standards, and the
reduction of psychosocial stress (Case, 2004). Households receiving pension over a period of
time were also more likely to have a water source on-site (Case, 2004). In addition, the presence
of a pensioner in the household was found to reduce the probability of an adult skipping a meal
by 20 % while the presence of two pensioners reduced the probability of an adult skipping a
meal by 40 % (Case, 2004). These factors are important in maintaining health and well-being.
Income is also associated with factors such as adequate housing which is an important predicator
of health (Winkelby, 1992). However, one of the main factors linked to chronic disease
acquisition is diet (Nugent, 2008). In developing countries, including South Africa, a
combination of economic and social factors has contributed to dietary changes characteristic of
developed countries (Puoanei, et al., 2008). For instance, the lower price of nutrient-poor foods
such as sugar, oils and bread, in comparison to healthier foods, result in lower-income groups
adopting an unhealthy diet (Nugent, 2008). Consequently, non-communicable diseases are
becoming more prevalent in these contexts.
One of the reasons why income is such an important determinant of health is that greater
financial resources may enable more access to health care (Cutler, 2007). Poor health care is a
significant risk factor for the development of chronic diseases (Nugent, 2008). For instance the
low-income population are less likely to get regular preventive care or to afford primary
treatment for conditions such as diabetes. Consequently, the World Health Organization (World
Wealth Organisation, 2005) projects an increase in deaths and illness due to chronic diseases in
low- and middle-income countries up to 2030.
2.2.4. Place of residence
Place of residence has been cited in numerous literature as a determinant of health. Factors
affecting access and services often make living in urban areas more beneficial in developing
countries (Kuate-Defo, 2006). People in rural areas often experience barriers to accessing health
care including transport constraints, geographical constraints and a lack of appropriate health

13
workers and coverage in rural areas. For instance in Zambia, there are twenty times more doctors
and over five times more nurses and midwives in urban than rural areas (World Bank, 2008). In
Malawi, 97 % of doctors are found in urban health facilities despite the fact that 87 % of its
population are living in areas considered to be rural (World Bank, 2008). In these settings,
people are less likely to have access to preventative care and treatment. At the same time, limited
access to health care services often leads to the under diagnosis of conditions such as diabetes
and hypertension.
While people in rural areas may experience poor health, urbanization is also linked to various
negative health behaviours which result in major risk factors for non-communicable diseases. A
qualitative study on the experiences and perceptions about non-communicable diseases of people
who migrated from rural areas to a peri-urban township in South Africa, found that participants
described changes in eating patterns and levels of physical activity (Stern, Puoane, and Tsolekile,
2010). These changes were found to be a result of socioeconomic and environmental constraints.
Many studies are now showing that urbanisation in Africa is linked to poverty. One of the
reasons for this is growing percentage of slums. Slum areas are characterized by a lack of basic
services (including water, sanitation and electricity), overcrowding and unhealthy or hazardous
locations (Ramin, 2009). Though sub-Saharan Africa is currently one of the least urbanized
regions in the world, the region’s urban population is projected to more than double by 2030
(Ramin, 2009).
Unlike in the past, risk factors for chronic diseases across place of residence are becoming
intertwined. For instance, two of the main factors that determine chronic disease acquisition are
physical activity and lifestyle. In South Africa people from rural areas were more likely to
engage in physical activity and adopt traditional diets in comparison to those from urban areas
(Stern, et al., 2010). However modernization has led to dietary and lifestyle changes which are
becoming increasingly visible in rural settings. Changes in the nature of work (less manual labor
and more mechanization) and lifestyle (more television viewing, use of transport) are visible
even in the context of South Africa (Nugent, 2008). These changes will have serious chronic
health implications. For the purposes of this study, place of residence is used as a control
variable in the analysis of secondary data.

14
2.3. Chronic illness
In Africa, data on chronic illness is usually obtained from administrative health records, clinical
trials, vital registration systems, general surveys, censuses and epidemiological studies.
However, data from these sources are not always reliable since many of these systems are
incomplete or lacking (Rao, 2006). Despite the dearth of information on non-communicable
diseases, existing research suggests that age-specific mortality rates from chronic diseases are
higher in sub-Saharan Africa than in all other regions of the world (de-Graft Aikins, 2010). In
South Africa a large majority of the mortality and morbidity burden come from hypertension and
diabetes (Donjeany, 2008; Mayosi, et al., 2009). In these contexts, poor socioeconomic
conditions can significantly increase people’s chances of experiencing ill-health.
2.3.1. Diabetes
Diabetes mellitus or diabetes is a common metabolic disorder that is characterized by a “chronic
high level of blood sugar with disturbances to carbohydrate, fat, and protein metabolism
resulting from defects in insulin secretion, insulin action, or both” (Azevedo and Alla, 2008:np).
The two types of diabetes are: type 1 diabetes, also known as insulin dependent diabetes mellitus
or juvenile onset diabetes and type 2 diabetes also known as non-insulin dependent diabetes
mellitus or adult-onset diabetes (Motala and Ramaiya, 2010). In Africa the complications of
diabetes contribute to a large morbidity burden. Uncontrolled diabetes is the leading cause of eye
complications, blindness, cardiovascular disease, cerebrovascular disease and kidney damage in
Africa (Motala and Ramaiya, 2010). People with diabetes also have an increased likelihood of
cardiovascular disease due to risk factors such as physical inactivity, hypertension and high
lipids in the blood. Consequently studies suggest that cardiovascular disease is one of the most
significant causes of death in the diabetic population (Azevedo and Alla, 2008). Other somatic
consequences of diabetes include stroke and amputations. Recent research has also focused on
the effects of the chronic condition on mental health where people who were diabetic were 1.9
times more likely to suffer from anxiety, depression, and other psychological disorders than
those that were non-diabetic (Wallach and Rey, 2009).

15
The incidence of diabetes has increased dramatically over the past twenty years. Global estimates
of the prevalence of diabetes for 2010 show that among adults aged 20 to 79 years 6.4 % of the
global population, constituting 285 million adults, suffered from diabetes (Shaw, Sicree, and
Zimmet, 2010). The world prevalence of diabetes is projected to increase to 7.7 % affecting 439
million adults by the year 2030 (Shaw, et al., 2010). The impact of the chronic condition on
developing countries is particularly concerning. Current data shows that of the ten countries
where the rates of diabetes are highest, seven are developing countries (Stern, et al., 2010). In
sub-Saharan Africa, the death rate from diabetes is four times higher than the world average
(Stern, et al., 2010). With regard to the prevalence, existing estimates show that diabetes has
increased significantly with an overall prevalence of 3.1 %, affecting a total population of 10.4
million people, in Africa (Kolling, Winkley, and Von Deden, 2010). It is estimated that between
2010 and 2030 developing countries will experience a 69 % increase in numbers of adults with
diabetes (Shaw, et al., 2010).
In Africa, diabetes is known as the ‘disease of opulence’ due to the fact that it is highly prevalent
among the wealthy and more pronounced in urban areas where people tend to eat diets that are
rich in saturated fats and refined sugars and are less physically active (Abubakari et al., 2009;
Azevedo and Alla, 2008; Kolling, et al., 2010). However, diabetes has also been shown to
disproportionately affect people who are socially and materially disadvantaged (Brown, et al.,
2004). Evidence suggests that diabetes may be up to two times more prevalent in low income
populations in comparison to wealthy populations (Rabi, et al., 2006). These findings agree with
research from Western societies, where type 2 diabetes was found to be more prevalent in men
and women from lower socioeconomic groups (Agardh, et al., 2004). Physical inactivity, obesity
and smoking, which are risk factors for the development of type 2 diabetes, are also associated
with a lower socioeconomic position (Agardh, et al., 2004). For people with diabetes
socioeconomic status may also have an influence on access to and quality of care, social support
and community resources (Brown, et al., 2004; Rabi, et al., 2006). A study on diabetes health
seeking behaviour among urban poor in Dar-es-Salaam, Tanzania, found that many people with
diabetes and low socioeconomic status were unable to engage continuously in treatment
(Kolling, et al., 2010). This was due to geographical constraints including the concentration of

16
specialised diabetes clinics in urban rather than rural areas; financial constraints such as bus
fares; and poor physical health (Kolling, et al., 2010). This can impact negatively on treatment
adherence and adequate diabetes care. At a broader level, diabetes among the urban poor has a
major impact not only on the person with diabetes, but also on the family who has the primary
responsibility of caring for relatives are ill (Kolling, et al., 2010). In this context, the
socioeconomic impact of diabetes makes the mobilisation of the family’s resources a necessity.
This interdependence becomes problematic when for instance the family member who supports
the diabetic relative passes away (Kolling, et al., 2010).
‘Levels of education’, which is a measure of socioeconomic status, has also been shown to
influence the prevalence of diabetes. Some of the reasons for this is that education and social
economic position can influence diabetes related knowledge, communication with providers, the
ability to adhere to medication, dietary regimens, exercise and treatment choices (Brown, et al.,
2004). Comparing prevalence by education group, a study on diabetes and socioeconomic status,
found that high school dropouts were 60 % more likely to have diagnosed diabetes and twice as
likely to have actual diabetes than men who have attended college (Smith et al., 2011).
According to Smith et al (2011), individuals from lower education groups face a triple threat
with diabetes: firstly, they have a higher risk in contracting the disease; secondly, they are at
greater risk of having their diabetes undiagnosed and presumably untreated; and thirdly, they
have more difficulty in successful self-management of the disease. In light of the fact that
diabetes is highlighted among the top 10 chronic conditions contributing to mortality in South
Africa, urgent attention should be directed towards the causes of the disease (Puoanei, et al.,
2008).
2.3.2. Hypertension
Hypertension is one of the most common non-communicable diseases. It occurs when the
arteries become inflexible and blood circulation is restricted leading to excessive pressure being
placed on the walls of the arteries (de Ramirez, et al., 2010). In the long-term, severe cases of
hypertension can lead to cardiovascular diseases such as heart attacks, stroke, renal disease and
blindness (de Ramirez, et al., 2010; Steyn, 2006). It has therefore been cited as one of the main

17
chronic disease risk factors both in Africa and globally. Though a comprehensive assessment of
the evidence concerning hypertension in Africa is lacking studies suggest that it is a growing
public health problem (Addo, Smeeth, and Leon, 2007; Wamala, Karyabakabo, Ndungutse, and
Guwatudde, 2009). Due to its under-diagnosis, in South Africa, hypertension is known as the
‘silent epidemic’ (Steyn, 2006). Increasing trends of hypertension among Africans mean that
between 10 to 20 million people may be affected in sub-Saharan Africa alone (Gokah and
Gumpo, 2010). Consequently, hypertension has become a ubiquitous cause of morbidity and
contributor to mortality among Africans (Gokah and Gumpo, 2010).
Though there is a dearth of research on the impact of socioeconomic status on hypertension
particularly in developing country contexts, existing studies suggest that socioeconomic status is
a key determinant of hypertension. Survey data from South Africa shows that hypertension and
obesity increased with increasing wealth (Schneider, et al., 2009). Studies in Africa show that
urban populations consistently have a higher prevalence of hypertension compared to their rural
counterparts (Addo, et al., 2007). In Ethiopia, the high prevalence of hypertension and other
cardiovascular diseases was found to be attributed to the unhealthy lifestyles of the higher
socioeconomic population (Tesfaye, 2009). Similarly, a study conducted in Ghana, found that
people with lower socioeconomic status had a lower incidence of hypertension while those with
a higher socioeconomic status had scattered patterns of hypertension (Addo, et al., 2007). Those
individuals on a higher employment bracket were more likely to have hypertension than those in
the lower bracket (Addo, et al., 2007).
However emerging evidence suggests that non-communicable diseases such as hypertension, are
no longer the preserve of affluent countries, and are now increasingly emerging in developing
contexts and among individuals from lower socioeconomic groups (Gokah and Gumpo, 2010).
The increasing prevalence of hypertension in these contexts are explained by exposure to risk
factors including changes in dietary patterns such as lipid-rich diets and a decrease in physical
activity (Schneider, et al., 2009). In the rural areas of Malawi, Rwanda and Tanzania, higher
body mass index, television ownership and less work-related vigorous physical activity were
associated with higher prevalence of hypertension (de Ramirez, et al., 2010). In addition, diets
that consisted of frequent meat and fat intake were associated with higher hypertension
18
prevalence while diets that involved frequent fruit and vegetable intake was significantly
associated with lower blood pressure measures (de Ramirez, et al., 2010). While large urban and
rural differences in hypertension prevalence are still evident in some sub-Saharan countries,
research in South Africa suggests that dues to changes in lifestyle and behavior these differences
are less visible (Steyn, 2006).
Agreeing with the findings on diabetes among lower socioeconomic groups, a study on
socioeconomic determinants of hypertension in rural Vietnam found that men with lower
educational and occupational status were more likely to be hypertensive (Minh, Byass, Chuc, and
Wall, 2006). Similarly among women those who had lower occupational and economic status
were more likely to be hypertensive (Minh, et al., 2006). For people with hypertension
socioeconomic status can also influence access to treatment and quality of care. A study on
poverty and non-communicable diseases in South Africa found that treatment status for
hypertension was worse for poor people than for rich people (Schneider, et al., 2009).
Consequently, though non-communicable diseases and lifestyle-related risk factors are prevalent
among the poor treatment for chronic diseases is often lacking which serve to perpetuate to ill-
health among the poor.
With the effects of globalization, urbanization, and changes in lifestyles and dietary practices the
prevalence of diabetes and hypertension and their complications in Africa are expected to
increase significantly (Azevedo and Alla, 2008; Gokah and Gumpo, 2010). Research on the
association between socioeconomic status and diabetes and hypertension can provide insight into
the nature of the chronic illness and help governments’ better respond to the impact on the
population.
2.4. Summary
This chapter highlighted the important role that socioeconomic status plays in the health
outcomes of individuals. In Africa, numerous studies showed that years of schooling,
employment status, income and place of residence which are all measures of socioeconomic
position, have a significant impact on the health status of individuals. Firstly, people with a
higher education were more likely to have positive health outcomes due to their knowledge of

19
health information, health problems and services. At the same time, they were more likely to
acquire positive psychological, social, and economic resources. Secondly, employment status
was an important determinant of health by providing increased social networks, income,
responsibility and a sense of making a valuable contribution. Thirdly, income which is related to
education and employment was shown to have a significant impact on health particularly with its
effect on access to health care, nutritional status, living standards, and the reduction of
psychosocial stress. Lastly, place of residence is an important factor that determines access to
health care, lifestyles and behaviours that influence health status.
Despite the dearth of research on chronic illness in South Africa, diabetes and hypertension are
an increasing public health concern. An examination of existing literature on these conditions
highlights the important role that socioeconomic status can play in their development. However,
at the same time it is evident that more research is needed to establish the association between
socioeconomic status and chronic illness particularly in the developing country contexts. This
research attempts to address this gap by focussing on the association between socioeconomic
status and selected chronic illnesses, specifically diabetes and hypertension, in the context of
South Africa. The following chapter, chapter 3 will focus on the research methodology, variables
used in the study, and the methods used to analyse the data.

20
Chapter Three
Methodology
3.1Introduction
The primary objective of the study presented was to investigate whether chronic health
conditions are associated with socioeconomic status. The first part of the chapter provides a
brief description of the primary data source, namely the first wave of the National Income
Dynamic Study. The research design and method of data collection is also reviewed. The latter
part of the chapter explores the different variables used to analyse socioeconomic status as well
as the methods employed in the analysis of the secondary data. The chapter concludes with an
overview of the research questions that were used to guide the study.
3.2. The National Income Dynamic Study
3.2.1. Background
NIDS represents the first national panel study in South Africa. It was conceived in 2006 by the
South African Labour and Development Research Unit (SALDRU). The purpose of the NIDS
study was to understand the development trajectory of South Africa and its people over a period
of time. As such NIDS collected data related to household structure and composition, household
expenditure and income, education, economic activity, labour market participation, and
indicators of health and well-being of individual household members. One of the disadvantages
of household surveys is that they do not engage with all individuals in a household. Often, the
household head and one other individual are considered for an interview or questionnaire. As a
result, the data obtained may not necessarily be a true reflection of the household. The NIDS
data, in contrast, interviewed on average an estimated four individuals per household. In this
regard, the NIDS data is advantageous as it provides a more accurate view of the country in
comparison to household data. At the same time it provides insight into the individual level
variables.

21
3.2.2 Sample design
The first wave of the NIDS panel study was conducted in 2008. The study sample comprised of
31 170 individuals residing in 7305 households. This was drawn from 400 primary sampling
units (PSUs) in all nine South African provinces. Data collection was undertaken by 300
fieldworkers. The study, which is multi-staged and clustered, indicates the breakdown of the
sample by PSU’s, households and individuals. The multistage, clustered design was taken into
consideration during analysis by using the SVY command on Stata version 11. No analysis was
done by province because the sample is not representative at provincial level. NIDS explained
that analysis of the results at provincial level is not recommended. Table 3.1 highlights the
provincial distribution of PSU’s.
Table 3.1: Provincial distribution of PSUs
NIDS (2009a:10)

22
3.2.3. Refusal rates and non-response rates
Beyond Section A of the questionnaire, 1246 adults have no data. This can be attributed to
individuals refusing to participate in the study. The refusal value is recorded under the variable
w1_a_refexpl. There were 208 child observations that had no data beyond section A due to those
children refusing to participate in the study. The refusal value is recorded under the variable
w1_c_refexpl. Those that participated in the study had a ‘system missing’ for this variable.
Figure 3.1 shows the non-response rates distributed over the nine provinces in South Africa.
Highest participation rates were found in KwaZulu-Natal, with highest rates of non-
responsiveness for Gauteng followed closely by Free State and Western Cape.
Figure 3.1: Non-response rates by province
NIDS (2009a:24)

23
3.3. Study hypothesis
This study aimed to assess whether a relationship exists between socioeconomic status and
chronic illness. The null hypothesis states that there is no significant relationship between
socioeconomic status and chronic illness.
3.4. Key questions
The key questions used in this study were:
- Is there a significant relationship that exists between chronic illness and socioeconomic
status?
- What are the demographic variables associated with higher rates of prevalence of the
illnesses?
- Is there any relationship that can be drawn with regard to the associated demographics
and their socioeconomic status?
- Is there a significant relationship that exists between hypertension and socioeconomic
status as well as diabetes and socioeconomic status?
3.5. Outcome variable
There are various definitions of chronic illness. This study used the definition of chronic illness
a persistent health issue lasting for a minimum of 3 months (Medicinenet, 2000). The study
focussed on two long-term diseases that can be classified as chronic namely, diabetes and
hypertension. These diseases form the dependent variable that is, the variable being caused by or
affected by socioeconomic disparities. This variable was derived from the following questions in
NIDS:
J13.2. Have you ever been told by a doctor, nurse or health care professional that you have High
Blood Pressure?
J13.3. Have you ever been told by a doctor, nurse or health care professional that you have
Diabetes or High Blood Sugar?
24
These were combined to form the dummy variable:
0 = no diabetes or hypertension
1 = has diabetes or hypertension
In the cases where analysis required the splitting of the illness into hypertension and diabetes, the
following dummy variables were created:
Diabetes Hypertension
0 = no diabetes 0 = no hypertension
1 = has diabetes 1 = has hypertension
3.6. Associated variables
For the purposes of the study, the Adler-Ostrove theoretical model (Adler and Ostrove, 1999)
was used to distinguish between the independent and dependent variable. Based on this, the
study aimed to establish whether a relationship exists between socioeconomic status and chronic
illness. Other factors that could have impacted on the relationship between chronic illness and
socioeconomic status were accounted for during regression. These included factors such as
marital status, gender and racial groupings. These extraneous variables were measured in the
structure of the model. Extraneous variables such as lifestyle variables, including exercise and
nutrition, could not be accounted for due to the lack of information contained in the data.
3.6.1. Employment status
Employment status is a significant socioeconomic determinant of health. People who are
employed are more likely to have access to resources, finances and health services which impact
on their health and well-being (Doyle, et al., 2005; Shavers, 2007). Employment status can be
categorised into three subcategories namely; employed, unemployed (strict and broad) and
economically inactive. Employed persons are those people who have worked for one hour in the
past one week in relation to the time of the questionnaire. The strict definition of unemployed
persons is those individuals who are willing and able to work and have been actively searching

25
for work. The broad definition of unemployed persons specifies that it also includes those who
are willing to work but have not searched for work in the past four weeks (in relation to the time
of the questionnaire). The inactive population involves those individuals that are not included in
the definitions of being either employed or unemployed (Kingdon, 2006). This study used the
broad definition of unemployment. Using the broad definition meant that the economically
inactive category did not include individuals that could work but choose not to for either a
personal reason or taking time-off. Combinations of questions were used to categorise
employment status in a meaningful manner:
E1: Are you currently being paid a wage or salary to work on a regular basis for an employer
(that is not yourself) whether full time or part time?
E28: Have you engaged in any self-employment activities during the past 30 days?
E40: Have you done casual work to earn in the past 30 days?
E63: How long ago was it since you last worked?
E65: What was the main reason you stopped working in your last job/business?
The categories that were used in the analysis were:
1 = employed
2 = unemployed
3 = economically inactive
3.6.2. Education
Education is often described as the most basic component of socioeconomic status (Shavers,
2007). Individuals with a higher level of education are more likely to engage in health-promoting
behaviour and lifestyles, have higher employability, better economic conditions and
psychological resources (Cutler, 2007; Sanchez-Vaznaugh, et al., 2009). This variable was based
on the question “H1: What is the highest grade in school that you have successfully completed?
Do not count the final year you were in school if you did not successfully complete the year” in
the NIDS study. It was first categorised into 16 levels of schooling - from grade 1 up until a
postgraduate education. Sixteen categories were further broken down into 5 categories for the
purpose of analysis to include: 1= Primary education; 2 = Secondary education; diploma or

26
certificate with grade 12; 3 = Bachelor’s Degree; and a 4=Bachelor’s degree plus a diploma or
certificate, honours, 5 = Master's degree or PhD.
3.6.3. Household income
“Income represents the flow of economic resources over a period of time. Households with
higher income are more likely to have the means to pay for healthcare and to afford better
nutrition” (2007:1015). The study aimed to investigate whether a higher income is associated
with a higher or lower prevalence rate of chronic illness. Income was measured as the total
household income obtained from the question “D39: Please would you look at the show card and
point out the most accurate earnings category. Household income was categorised into 3 income
levels which generated the variable class as placement in society, that is, lower, middle and
upper class households. 1 = Low income (R0 – R1500 per capita) 2 = Middle income (R1501 –
R4500 per capita) 3 = Upper (R4501 – maximum per capita). A criticism of income data is that
most individuals refuse to disclose their income levels. As a result there are often a heightened
number of missing values for this variable.
3.6.4. Place of residence
Place of residence can have a significant impact on the health status of individuals. It often
determines access to health care, resources, and living conditions and so on (Kuate-Defo, 2006).
For instance rural areas are often associated with poor infrastructure, poor living conditions and
poor sanitation services in comparison to the urban areas (Hallman, 2005). As a result, place of
residence is an important control variable with regard to assessing disparities in health outcomes.
In South Africa this is divided between rural, metropolitan and urban as well as non-metropolitan
areas, disaggregated by province.
The questions A8: Suburb/community and A9: Town/city was used to derive the variables
w1_hhgeo and w1_hhgeo which was adapted for the study to inform the participant’s place of
residence. For the purposes of the study, the following categories were created and placed into
one variable called area:
27
1 = rural
2 = non-metro urban
3 = metropolitan
3.7. Other control variables
Place of residence as well as demographic variables were used as the control variables. These
demographic variables include gender, marital status and race.
3.7.1 Gender
Gender was generated using the question “B2: What is your gender?” male was coded as 1 and
female was coded as 0.
3.7.2 Marital status
The variable marital status was derived using the question “B5: What is your current marital
status?” marital status was broken down into 4 categories:
1 = Married
2 = Cohabiting
3 = Never Married
4 = Divorced or Separated
3.7.3 Race
“B3: What population group would you describe yourself as belonging to?” was used and coded
from the NIDS dataset to form the following sub-categories of race:
1 = Black/African
2 = Coloured
3 = White
4 = Indian or Asian

28
3.8. Data analysis
For the study presented, secondary data analysis of the NIDS dataset was employed by me to
measure the relationship between socioeconomic status and chronic illness. This was conducted
with the inclusion of the effect of extraneous variables, such as marital status, gender and race.
The quantitative software, Stata version 11, was used for the process of data analysis.
Using the chi-squared test, the categorical association variables were tested to establish if there
was a significant difference between the two outcome groups amid groups in the outcome
variable. Since the outcome variable was categorical, logistic regressions were done in order to
measure significance of the assumptions made on a multivariable level (Bewick, Cheek, and
Ball, 2005). Considering variables in groups, the logistic regression was guided by a hierarchical
framework, which was established using stepwise model building from distal factors to the
proximate determinants (Bewick, Cheek, and Ball, 2006). Determinants were added and
analysed on the basis of a stepwise, structured logistic regression model. The study
implemented the approach recommended by Hosmer and Lemeshow (2000) for the model
building.
Univariate analysis was first run for each variable, by fitting the univariate logistic regression
models to obtain preliminary diagnostics. Based on those results, variables were then selected to
build a multivariable model. To check for interactions between variables, each possible
interaction was added to the main effects model to establish significance. Those that yield
significant results to the main model were added to the ‘preliminary final model’ (p-value <
0.05). The final model was obtained by checking the goodness of fit using the svylogiggof
command on StataIC 11.
The logistic model formula was used to calculate the probability of the selected response as a
function of the values of the associated variables. The logistic formula had each continuous
associated variable, each dichotomous associated variable with a value of 0 or 1, and a dummy
variable for every category of associated variables with more than two categories and less than
one category. Linear regression was not used because there were no limits on the values

29
predicted by the linear regression. This meant that the predicted response might be less than 0 or
greater than 1, which is not a measure of probability.
The logistic model formula used was:
(Equation 3.7.1.1.) P = 1/(1+exp(-(B0 + B1*X1 + B2*X2 + ... + Bk*Xk)))
Diabetes and hypertension were generated as single variables representing chronic illnesses. The
chronic illness variable as well as diabetes and hypertension alone were used to establish whether
a relationship that exists between socioeconomic status and chronic illnesses.
3.9 Limitations of the Study
The study attempts to ascertain whether respondents suffer from a chronic illness. One of the
limitations of this stems from self-reporting which introduces bias. The second bias occurs when
looking at the question used from the survey regarding chronic illnesses. If there is a
differentiation in who presents themselves to a medical centre with these illnesses then this will
impact on the results of the study. Secondly, if the South African population tend to be
diagnosed with these illnesses when some symptoms are presented, that is, when the illness has
reached a certain level of severity, then there will be a bias associated with the study referring to
more severe cases rather than prevalence of the disease. Another limitation of the study is that
the SES model includes household income, this data studies are predominantly misrepresented
and has high nonresponse rates. Finally, since the study did not take into account mortality due
these illnesses there could be bias associated with the prevalence and therefore the odds observed
in the study.
3.10. Summary
The purpose of this chapter was to describe the research methodology and variables used in the
study; describe the procedure for designing the model for the study; and provide an explanation
of the procedures used to analyse the secondary data. Using the first wave of the National

30
Income Dynamic Study the researcher was able to investigate whether a relationship exists
between chronic health conditions and different levels of socioeconomic status. In the following
chapter 4, a detailed review of the research results obtained from the study will be provided.

31
Chapter Four
Results
4.1 Introduction
A number of studies have documented the importance of socioeconomic factors on health
outcomes however; relatively few have focused on socioeconomic position and health status
particularly in developing country contexts. In South Africa, there is a dearth of data on chronic
illnesses, which are expected to increase dramatically over the next few years. This chapter
draws on data obtained from the National Income Dynamics Study. The aim is to explore the
association between socioeconomic status and selected chronic illnesses, specifically diabetes
and hypertension, in the context of South Africa. This is analysed using the key elements
highlighted in the Adler and Ostrove, 1999 theoretical framework, namely: years of schooling,
employment status, income and place of residence. The chapter begins with an overview of the
demographic distribution of the sample. This is followed by a summary of the relationship
between socioeconomic status and chronic illness for each of the key elements. The remainder of
the chapter provides a detailed presentation of the results obtained from bivariate and
multivariate analysis. In the concluding part of the chapter, data showing the association between
socioeconomic status and both diabetes and hypertension, is presented. In light of the fact that
chronic illnesses are expected to increase, this will enable us to identify if health outcomes
follow a social gradient in South Africa.
4.2 The National Income Dynamics Study (NIDS)
This study included both males and females aged between 18 and 45+ years to explore the
relationship between socioeconomic status and chronic illness. With regard to the gender
distribution of the sample, the proportion of females is larger than that of males in each age
category. Relationship status reveals that the proportion married increases with age with the 45+
age group having the highest percentage (53%). This is not unexpected since early marriage is
not the norm in South Africa. Similarly, there is a high number of individuals never married
between the ages 35 to 44 (28%), indicative of the influence of delay in marriage worldwide.

32
Interestingly, there is also an increase in those cohabiting in this age group (14%) and then a
steep decrease to 6% from age 45 onwards. In terms of racial distribution, there is a fair
representation of the racial categories in comparison to national statistics. In relation to place of
residence, the majority of the sample resides in the rural areas followed by metropolitan and non-
metro urban areas. This dispersion is different for age cohort 35-44, where metropolitan areas
take precedence (38%) over rural (33%) and non-metro urban areas (30%), indicating the job-
seeking nature of this cohort. Employment levels peak at ages 35 to 44 (61%) with highest
unemployment rates among the 18 to 34 age cohort (25%). Inactivity, as expected, is highest
among the oldest age cohort. With regard to educational attainment, the 45+ age group have
lower educational attainment in comparison to the other cohorts, with a 27% prevalence of zero
schooling. Household income statistics, which were broken down into three categories reveal
that the middle income has the highest percentage representation with an almost equal
distribution over the lower and upper categories. Table 4.1 indicates the demographic
distribution of the sample with regard to: gender; marital status; educational attainment; place of
residence; income; employment status; and racial split in the NIDS dataset.

33
Table 4.1: Demographic distribution of the sample
Demographic
Subcategory
Age 18-34
Percentage
distribution
N=8625 (95%
CI)
Age 35-44
Percentage
distribution
N=3398 (95%
CI)
Age 45+
Percentage
distribution
N=6396 (95%
CI)
Gender Male 49 (48-50) 43 (40-45) 42 (41-44)
Female 51 (50-52) 57 (55-60) 57 (56-59)
Marital Status Married 11 (10-13) 48 (45-51) 53 (51-55)
Cohabiting 8 (7-9) 14 (12-16) 6 (5-7)
Never Married 80 (78-81) 28 (26-31) 13 (12-15)
Divorced/
Separated
1 (0.6-1.2) 10 (8-12) 28 (26-30)
Employment
Status
Employed 32 (31-34) 61 (60-66) 40 (38-42)
Unemployed 25 (23-26) 21 (19-23) 9 (8-10)
Economically
inactive
43 (41-44) 16 (14-18) 51 (49-53)
Educational
attainment
Zero schooling 1 (1-2) 8 (7-10) 27 (25-29)
Primary 12 (11-13) 25 (23-27) 31 (29-33)
Secondary 78 (77-79) 52 (49-55) 33 (31-35)
Diploma with
grade 12
7 (6-8) 11 (9-13) 5 (4-6)
Bachelor’s
degree
1 (0.5-1) 2 (1-3) 1 (1-2)
Bachelor’s + 1 (0.4-1) 2 (2-3) 3 (2-5)
Household
Income
Lower 30 (29-31) 27 (25-29) 27 (25-28)
Middle 42 (41-42) 39 (37-41) 39 (37-41)
Upper 28 (27-29) 34 (31-36) 34 (32-36)
Race African/Black 85 (84-85) 77 (74-79) 72 (71-74)
Coloured 9 (8-10) 11 (10-13) 9 (8-11)
White 5 (4-5) 9 (8-11) 16 (14-18)
Indian/Asian 1 (1-2) 3 (2-4) 2 (1-3)
Place of
Residence
Metro 34 (33-35) 38 (35-40) 35 (33-37)
Non-metro and
urban
25 (25-26) 30 (27-32) 28 (26-29)
Rural 40 (39-41) 33 (31-35) 38 (36-39)
NIDS (2009b) weighted
The total number of individuals that have been selected as representative of the national
population in the NIDS dataset is 18 419. Previous studies have indicated a low prevalence rate
of chronic illness among those aged 34 and below. As a result, this study has chosen to focus on
using those individuals aged 35 and over in the analysis. Prevalence rates of chronic illness

34
among the age-group 0 to 34 years old is minimal, approximated at 3.3 % (95% CI: 2.7-4).
Since prevalence distribution is low, analysis in this age group did not provide disparities over
the variables under study. Preliminary analysis has also shown prevalence distribution rates
among the age-groups 35-44 and 45+ as 16.1 % (95% Confidence Interval (CI): 14.0-18.5) and
38.07 % (95% CI: 33.8-37.8) respectively. Figure 4.1 shows the distribution of chronic illness
prevalence over the different age categories.
Figure 4.1: Prevalence of chronic illness distributed over age categories
NIDS (2009b) weighted
4.3 Investigating the relationship between socioeconomic status and chronic illness
4.3.1 Comparing the prevalence of chronic illness for those aged 35-44 and 45+
The disparities between age-groups are explored below to differentiate the weighted prevalence
rates, which contribute to understanding possible determinants of diabetes and hypertension to
add into the logistic regression model.
For individuals between the ages 35 to 44, prevalence of chronic illness was highest among those
that were employed (56%) followed by those that were economically inactive (22%). Among
those in the 45 and over age category, those who were economically inactive had a higher
prevalence rate (61%) followed by those that were employed (32%). Figure 4.2 shows the
percentage distribution of chronic illness over employment status. Overall, the lowest rates of

35
prevalence are found in the unemployed category in South Africa for both age groups 35 to 44
(21%) and 45+ (7%). Due to the relatively large sample size, CI for figure 4.2 is highlighted. The
estimates for the figure indicate an overlap in CI for age 35-44 between economically inactive
and unemployed. There is no overlap in any other variable indicative of the significant
differences.
Figure 4.2: Percentage distribution of chronic illness over employment status
NIDS (2009b) weighted
With regard to education level as a social determinant, individuals between the ages of 35 to 44
who possessed only a secondary education had the highest prevalence of chronic illness (40%)
while those with a bachelor’s degree had the lowest prevalence (1%). Among the 45 and over
age group, those who had only a primary school education were more likely to have the highest
prevalence of chronic illness (37%) in comparison to those with a post- matriculation who
exhibited the lowest prevalence at 5%. This is illustrated in figure 4.3. The CI estimates for
figure 4.3 also indicates an overlap in confidence intervals in age 45+ ‘Zero’ to ‘secondary’
schooling and also ‘Diploma’ to ‘bachelors plus’. Chronic illness is significantly higher in terms
of distribution in those individuals who have a lower level of education.

36
Figure 4.3: Percentage distribution of chronic illness over educational attainment
NIDS (2009b) weighted
As reflected in Figure 4.4, for people aged 45 and over, those living in a rural area had the
highest prevalence of chronic diseases (45%) followed by those living in a non-metro area
(41%). The highest prevalence rates of chronic illness for those aged between 35 and 44 were
found among those in a non-metro urban area (46%) followed by those living a rural area (36%).
Metro areas have the lowest prevalence rates across the 35-44 and 45+ age groups with 18% and
18% respectively.
Figure 4.4: Percentage distribution of chronic illness over place of residence
NIDS (2009b) weighted
Among the racial categories, the highest chronic disease prevalence rates were found among the
Black/African race group in both age categories (72% for age 35-44 and 70% for age 45+). The
Indian race group had the lowest prevalence rates (2% for age 35-44 and 2% for age 45+),

37
followed by the White and Coloured race groups at 5% for age 35-44 and 10% for age 45+ and
21% for age 35-44 and 18% for age 45+ respectively. Figure 4.5 shows the percentage
distribution of chronic illness over each of the four racial categories.
Figure 4.5: Percentage distribution of chronic illness over racial category
NIDS (2009b) weighted
Figure 4.6 shows the percentage distribution of chronic illness over household income. The
middle income category shows highest rates of prevalence in both age cohorts, with the lower
income having the lowest prevalence for age-group 45+ (26%). Age category 35 to 44 exhibits
approximately the same chronic illness prevalence rate over the upper and lower income
categories at 28% and 29% respectively.
Figure 4.6: Percentage distribution of chronic illness over household income
NIDS (2009b) weighted

38
With regard to gender, females were shown to have the highest chronic illness prevalence rates
across both age cohorts at 77% and 73% for ages 35-44 and 45+ respectively. Figure 4.7
highlights that males have lower chronic disease prevalence rates at 23% for ages 35-44 and 26%
for ages 45+.
Figure 4.7: Percentage distribution of chronic illness over gender
NIDS (2009b) weighted
4.4 Bivariable and multivariable analysis
4.4.1 Model building
Since this study had a large number of explanatory variables which may or may not be relevant
for making predictions about the response variable, a model was built, using a step-wise
regression, to contain only the variables which provide important information about the response
variable. The tables below indicate whether variables were required as significant predictors of
the relationship.

39
Table 4.2: Applied logistic regression modelling process for age group 35-44
Model F P Significant predictors
Individual Level
Variables
Educational attainment
(EA)
13.33 0.000 Keep EA
Employment status (ES) 10.66 0.000 Keep EA, ES
Household Level
Variables
Household Income (HI) 12.88 0.000 Keep EA, ES, HI
Place of Residence
(Brown, et al.)
12.92 0.000 Keep EA, ES, HI, PR
Other Control
Variables
Gender (G) 9.08 0.000 Keep EA, ES, HI, PR, G
Race (R) 13.92 0.000 Keep EA, ES, HI, PR, G,
R
Marital Status (MS) 9.10 0.000 Keep EA, ES, HI, PR, G,
R, MS
NIDS (2009b) weighted
Table 4.3: Applied logistic regression modelling process for age group 45+
Model F P Significant predictors
Individual Level
Variables
Educational attainment
(EA)
44.85 0.000 Keep EA
Employment status (ES) 56.44 0.000 Keep EA, ES
Household Level
Variables
Household Income (HI) 63.32 0.000 Keep EA, ES, HI
Place of Residence
(Brown, et al.)
63.28 0.000 Keep EA, ES, HI, PR
Other Control
Variables
Gender (G) 54.15 0.000 Keep EA, ES, HI, PR, G
Race (R) 65.64 0.000 Keep EA, ES, HI, PR, G,
R
Marital Status (MS) 21.28 0.000 Keep EA, ES, HI, PR, G,
R, MS
NIDS (2009b) weighted
Table 4.2 shows that in building the model for ages 35 to 44, all intended variables were
significant predictors. These variables were therefore included in the study taking goodness of
fit into consideration. Similarly, Table 4.3 highlights that in building the model for ages 45+, all
intended variables were shown to be significant predictors and taking goodness of fit into
consideration were hence included. The goodness of fit of the model was assessed using the Stata
function svylogitgof. This test for the 35-44 age group (F=11.79, p=0.000) and 45 + age group
(F=56.29, p=0.000) did not indicate that the overall model departed from the observed data and
the main effects model was accepted as the final model.

40
4.4.2 Bivariable and multivariable analysis of selected variables
Reference groups for the purposes of analysis were chosen on the basis of groups that were
perceived as being vulnerable, that is, females, economically inactive, those with zero schooling,
lower income households, Black/African individuals as well as rural areas.
4.4.2.1 Gender
For age group 35-44, bivariable analysis shows that females have significantly higher odds of
acquiring diabetes or hypertension than males. Specifically, females are three times (3.3) more
likely than males to acquire a chronic disease. Similarly, when controlling for the variables
specified in the model, it is noted that females are significantly more likely than males to have a
chronic illness. However, controlling for the various variables increases the odds ratio, as
females are four and a half times more likely to have a chronic illness than males in this instance.
For age group 45+, bivariable analysis similarly reveals that females have significantly higher
odds of acquiring diabetes or hypertension than males. Data suggests that females in this age
cohort are almost twice (1.8) as likely to acquire a chronic disease. After controlling for the
variables in the model, the odds ratio decreases. In this regard females are one and a half times
more likely to have a chronic illness than males.
4.4.2.2 Marital status
Prior to regression of the variables, for age group 35-44, those individuals who were cohabiting
were shown to have higher odds of acquiring a chronic disease in comparison to those who were
married. Those who were never married had lower odds of having a chronic disease with an odds
ratio of 0.7. Those who were divorced or separated had significantly lower odds of having a
chronic disease. After regression of the variables, cohabitation and married individuals had equal
odds of having a chronic disease, whereas never being married decreases those odds. In the
controlled analysis, those individuals who were divorced or separated had a significantly lower
odds ratio of having a chronic disease in comparison to other marital status variables. Overall,
even when controlling for variables, cohabitation decreases the odds of having chronic diseases

41
such as diabetes and hypertension. For age group 45+, prior to regression, those who were
cohabiting or never married had significantly lower odds with regard to acquiring a chronic
disease in comparison to those who were married. Those who were divorced have significantly
higher odds of having a chronic disease with an odds ratio of 2.2. After regression, cohabitating
and never married individuals had significantly lower odds of having a chronic disease while
those that were divorced or separated had significantly higher odds ratio.
4.4.2.3 Employment status
For age group 35-44, comparatively, both employed and unemployed individuals had
significantly higher odds (3.4 and 3.1, respectively) of having a chronic illness in comparison to
the economically inactive. Employed individuals had significantly higher odds of having
diabetes or hypertension. In the controlled analysis, there are similar results to the bivariable
analysis with those that are unemployed (2.8) having a much lower odds ratio than employed
individuals (3.4). This therefore shows that in ranking the odds, employed individuals have
significantly higher odds of having a chronic illness. In contrast, for age group 45+, both
employed (0.5) and unemployed (0.2) individuals are at significantly lower odds of having a
chronic illness in comparison to the economically inactive. Unemployed individuals in this age
cohort had significantly lower odds of having diabetes or hypertension. The controlled analysis
similarly revealed that those who are unemployed have a much lower odds ratio than employed
individuals. Overall, for the 45+ age group, economically inactive individuals have significantly
higher odds of having a chronic illness.
4.4.2.4 Educational attainment
If an individual, in the age group 35-44, had at a maximum a primary level schooling they were
at significantly higher odds (twice as more likely) of acquiring diabetes or hypertension than
those with no schooling. Secondary schooling lowered an individual’s odds ratio, with any form
of post-matric qualification increasing an individual’s odds ratio in South Africa for having a
chronic disease. Multivariable analysis produced similar results where those with a primary
schooling had significantly higher odds of having a chronic disease compared to those with no

42
schooling. The only other group with heightened odds was individuals with a post-graduate
qualification. This leaves secondary, diploma or a bachelor’s degree on approximately the same
associated odds. In the 45+ age group, if an individual had at a maximum a zero level of
schooling they were at a significantly higher odds of acquiring chronic illness than those with
any schooling. Those individuals who had, at a maximum, secondary education or a grade 12
education with a diploma had the lowest odds of having a chronic disease. Having a bachelor’s
degree or more significantly decreased the odds in comparison to those individuals with zero
schooling. Multivariable analysis also found that those with zero schooling had significantly
higher odds of disease. Overall, for individuals in the 45+ age cohort, with higher levels of
education there is a significant drop in odds of acquiring a chronic illness. The odds ratio is
constant over the higher levels of education.
4.4.2.5 Household income
Using lower income as the reference group, middle (1.3) and upper (1.1) income categories in
the 35-44 age group, show higher odds of acquiring chronic illness. Multivariable analysis
showed that those in the upper income category (0.6) had significantly lower odds of chronic
illness in comparison to the lower and middle income categories. Those in lower and middle
income categories in this instance had equivalent odds. For the age group 45+, using lower
income as the reference group, middle (1.3) and upper (1.3) income categories indicated higher
odds of acquiring chronic illness; with the middle income having similar odds to the upper
income. From the multivariable analysis, the upper income (1.5) is shown to have significantly
higher odds of chronic illness in comparison to the lower and middle (1.3) income categories.
Middle income has significantly higher odds of illness in comparison to lower income but
decreased odds in comparison to upper income households.
4.4.2.6 Race
In the 35-44 age groups, bivariable analysis indicated that in comparison to individuals from the
Black/African race group Indian and Coloured race groups have higher odds of acquiring chronic
illnesses while those from the White race group have lower odds. In a controlled environment,

43
individuals from the Black/African race group had the highest odds with the White race group
having the lowest odds ratio. In both types of analysis Indian and Coloured race groups had an
equal amount of odds. For the 45+ age cohort, bivariable analysis highlighted that in comparison
to the White race group, Indian and Coloured individuals had higher odds of acquiring chronic
illnesses than those from the Black/African race group. In contrast when controlling for the
variables, individuals from the White race group had the highest odds with Indian race group
exhibiting the lowest odds ratio.
4.4.2.7 Place of residence
For the age group 35-44, those living in a non-metro urban environment had significantly higher
odds of acquiring chronic illness (twice the odds) in comparison to those living in rural areas.
Those in metropolitan areas have higher odds after non-metro urban areas. This implies that
metro areas have significantly higher odds in comparison to rural areas to acquiring a chronic
illness. Multivariable analysis indicated the same significance and reflected similar results to the
bivariable analysis. Associated odds increased by 0.1 in both the metro and non-metro urban
areas in comparison to odds of acquiring illness in rural areas. For age group 45+, those living in
a non-metro urban or metropolitan environment had significantly the higher odds (0.2) of
acquiring chronic illness compared to those in rural areas. Non-metro urban and metro areas had
the same odds. Multivariable analysis for this age cohort indicated that metro areas had
significantly higher levels of odds, followed by non-metro urban and finally, rural areas. In this
regard metro areas had double the odds in comparison to rural areas.
These results show that in South Africa, for individuals between 35 and 44 years of age, those
with only a primary school education, who are unemployed, and have a lower or middle
household income are more likely to have a chronic illness. With regard to gender and race
Black/African females are at greatest risk. Those that are married or cohabiting or living in a
metro or non-metro were also shown have an increased risk of acquiring chronic illnesses such
as diabetes or hypertension. Table 4.4 summarizes the findings for the 35-44 age groups. For
those individuals in the 45+ age cohort, those who were divorced or separated, based in a
metropolitan area, economically inactive, living in an upper income household and with a

44
maximum of zero years of schooling were at increased risk for acquiring chronic illness. In this
age cohort again Black/African females were at greatest risk. These findings are highlighted in
Table 4.5.
Table 4.4: Relationship between socioeconomic status and chronic illness for age 35-44
Bivariable Analysis Multivariable Analysis
Variables Sub-
categories
Odds ratio (95%CI) Odds Ratio (95%CI)
Gender Male Reference Reference
Female 3.3 (2.3-4.7)*** 4.5 (3.1-6.5)***
Marital
Status
Married Reference Reference
Cohabiting 1.3 (0.8-2.2) 1.0 (0.6-1.7)
Never Married 0.7 (0.4-1.3) 0.5 (0.3-1.0)
Divorced/
Separated
0.3 (0.2-0.4)*** 0.3 (0.2-0.4)***
Employment
Status
Economically
inactive
Reference Reference
Employed 3.4 (2.3-4.9)*** 3.4 (2.3-5.3)***
Unemployed 3.1 (2.0-4.9)*** 2.8 (1.7-4.5)***
Educational
attainment
Zero schooling Reference Reference
Primary 2.0 (1.2-3.4)** 1.7 (1.0-2.9)*
Secondary 0.9 (0.6-1.6) 0.9 (0.5-1.5)
Diploma with
grade 12
1.6 (0.8-3.3) 1.1 (0.5-2.5)
Bachelor’s
degree
1.5 (0.5-4.8) 0.9 (0.2-3.8)
Bachelor’s
plus
2.1 (0.9-5.1) 1.7 (0.6-5.0)
Household
Income
Lower Reference Reference
Middle 1.3 (0.9-1.9) 1.0 (0.7-1.4)
Upper 1.1 (0.7-1.6) 0.6 (0.4-1.0)*
Race African/Black Reference Reference
Coloured 1.2 (0.8-1.8) 0.9 (0.5-1.4)
White 0.9 (0.4-2.1) 0.8 (0.3-1.9)
Indian/Asian 1.2 (0.5-3.1) 0.9 (0.3-2.4)
Place of
Residence
Rural Reference Reference
Non-metro
Urban
2.1 (1.5-2.9)*** 2.2 (1.5-3.2)***
Metro 2.0 (1.4-2.9)*** 2.1 (1.4-3.1)***
***p<0.001 **p<0.01 *p<0.05 N=3398

45
Table 4.5: Relationship between socioeconomic status and chronic illness for age 45+
Bivariable Analysis Multivariable Analysis
Variables Sub-categories Odds ratio (95%CI) Odds Ratio (95%CI)
Gender Male Reference Reference
Female 1.8 (1.6-2.2)*** 1.5 (1.3-1.8)***
Marital
Status
Married Reference Reference
Cohabiting 0.4 (0.3-0.5)*** 0.4 (0.3-0.6)***
Never Married 0.1 (0.1-0.2)*** 0.2 (0.1-0.2)***
Divorced/
Separated
2.2 (1.8-2.6)*** 1.5 (1.2-1.9)***
Employment
Status
Economically
inactive
Reference Reference
Employed 0.5 (0.5-0.6)*** 0.5 (0.4-0.6)***
Unemployed 0.2 (0.2-0.3)*** 0.3 (0.2-0.4)***
Educational
attainment
Zero schooling Reference Reference
Primary 0.6 (0.5-0.8)*** 0.8 (0.7-1.1)
Secondary 0.2 (0.2-0.2)*** 0.3 (0.2-0.3)***
Diploma with
grade 12
0.2 (0.1-0.3)*** 0.1 (0.1-0.2)***
Bachelor’s
degree
0.4 (0.1-1.2) 0.2 (0.0-0.6)**
Bachelor’s + 0.5 (0.2-1.0)* 0.2 (0.1-0.5)***
Household
Income
Lower Reference Reference
Middle 1.3 (1.1-1.5)** 1.3 (1.1-1.6)**
Upper 1.3 (1.1-1.6)** 1.5 (1.2-2.0)***
Race African/Black Reference Reference
Coloured 1.5 (1.2-1.9)*** 1.1 (0.9-1.5)
White 2.2 (0.8-2.2)*** 2.0 (1.4-2.9)***
Indian/Asian 1.3 (1.7-2.9) 0.9 (0.5-1.6)
Place of
Residence
Rural Reference Reference
Non-metro 1.2 (1.0-1.4)* 1.7 (1.4-2.1)***
Metro 1.2 (1.0-1.4) 1.9 (1.5-2.3)***
***p<0.001 **p<0.01 *p<0.05 N=6396
4.5 The impact of socioeconomic status on acquiring hypertension and diabetes
The impact of socioeconomic variables on acquiring diabetes or hypertension may differ for the
two diseases. This study therefore chose to focus on these specific chronic conditions, away from
the general category of chronic illness. Table 4.6 below highlights the relationship between
diabetes and the various socioeconomic variables separated by age category.

46
Table 4.6: Relationship between socioeconomic status and diabetes through multivariable
analysis
Variables Sub-categories Odds ratio 35 – 44
(95%CI) (N=3398)
Odds Ratio 45+
(95%CI) (N=6396)
Gender Male Reference Reference
Female 2.8 (1.4-5.6)** 1.2 (0.9-1.7)
Marital
Status
Married Reference Reference
Cohabiting 0.5 (0.1-1.7) 0.2 (0.1-0.4)***
Never Married 0.5 (0.2-1.1) 0.2 (0.1-0.3)***
Divorced/
Separated
0.5 (0.2-1.4) 1.4 (1.0-1.9)*
Employment
Status
Economically
inactive
Reference Reference
Employed 3.9 (1.6-9.6)** 0.5 (0.1-0.3)***
Unemployed 0.5 (0.1-2.0) 0.2 (0.3-0.7)***
Educational
attainment
Zero schooling Reference Reference
Primary 2.7 (0.5-13.7) 1.0 (0.7-1.4)
Secondary 2.0 (0.4-10.4) 0.5 (0.3-0.7)***
Diploma with
grade 12
1.8 (0.3-12.1) 0.3 (0.1-0.6)***
Bachelor’s
degree
6.8 (0.6-73.5) 0.03 (0.0-0.2)***
Bachelor’s + 8.7 (1.0-73.0)* 0.3 (0.1-0.8)
Household
Income
Lower Reference Reference
Middle 0.4 (0.2-1.0)* 1.2 (0.8-1.7)
Upper 0.4 (0.2-1.0) 2.1 (1.4-3.2)***
Race African/Black Reference Reference
Coloured 0.7 (0.3-1.6) 1.0 (0.6-1.5)
White 0.5 (0.1-1.9) 0.9 (0.4-1.6)*
Indian/Asian 1.9 (0.4-8.9) 1.9 (1.0-3.8)
Place of
Residence
Rural Reference Reference
Non-metro 2.0 (0.9-4.5) 1.5 (1.1-2.0)**
Metro 2.4 (1.0-5.6)* 1.7 (1.2-2.5)**
***p<0.001 **p<0.01 *p<0.05
In terms of gender disparities, the odds of having diabetes in both age categories, that is, age 35
to 44 and 45+ are higher for females in comparison to males in South Africa. In the age category
35 to 44 females had almost three times higher odds of having diabetes than males. Marital status
indicates lower odds of having diabetes in being never married, divorced or separated and
cohabiting in comparison to those that are married in the 35 to 44 age cohort. Married
47
individuals showed a 2 is to 1 odds ratio over all other marital status categories. In the 45+
cohort those cohabiting and never married had significantly a fifth of the odds of having diabetes
in comparison to married individuals. In contrast to the younger cohort, those individuals that are
divorced had significantly higher odds of acquiring diabetes.
Individuals that were employed in South Africa had the highest odds of having diabetes in the
younger age cohort (four times the odds) in comparison to those that were economically inactive.
Unemployed individuals had the lowest odds in the 35 to 44 age group. In the 45 and over
category, employed individuals had half the odds and unemployed individuals indicating a fifth
of the odds in comparison to those that were economically inactive. These results for the oldest
age category can be attributed to the fact that 45 and over would have the highest proportion of
people who are retired or economically inactive. In terms of educational attainment, those found
in the zero schooling categories had the lowest odds of acquiring diabetes in the 35 to 44 age
cohort. Those having a post-graduate qualification had nine times the odds of having diabetes in
comparison to those with zero schooling. In contrast, for the 45 and over age cohort, zero
schooling has the highest odds in comparison to other categories. Most had significantly lower
odds, specifically those found between secondary schooling individuals and those with a
bachelor’s degree. Across income categories, individuals that were in the middle and upper
income categories had lower odds in the 35 to 44 age group. In this regard those in the middle
income category had significantly lower odds with a 0.4 ratio. In the oldest age cohort, those in
the upper income category had twice the odds of having diabetes in comparison to those in the
lower income category.
In the 35 to 44 age group, across the different race categories, individuals from the Indian race
group had the highest odds of having diabetes followed by those in the Black/African, Coloured
and White race group. In the age cohort 45 and over individuals from the White race group had
the lowest odds of having diabetes, while those in the Indian race group had the highest odds.
For place of residence, individuals between 35 to 44 years that live in metropolitan areas had two
and a half times the odds of acquiring diabetes than those living in rural areas. Those in non-
metro urban areas had double the odds in comparison to those in rural areas for the younger age

48
cohort. Those aged 45 and over had significantly higher odds of acquiring diabetes in both metro
and non-metro urban areas in comparison to rural areas.
Table 4.7: Relationship between socioeconomic status and hypertension through multivariable
analysis
Variables Sub-categories Odds ratio 35 – 44
(95%CI) (N=3398)
Odds Ratio 45+
(95%CI) (N=6396)
Gender Male Reference Reference
Female 5.1 (1.4-5.6)*** 1.6 (1.3-1.9)***
Marital
Status
Married Reference Reference
Cohabiting 1.0 (0.6-1.7) 0.5 (0.3-0.7)***
Never Married 0.3 (0.2-0.4)*** 0.2 (1.2-1.9)***
Divorced/
Separated
0.5 (0.3-1.1) 1.5 (0.2-0.3)***
Employment
Status
Economically
inactive
Reference Reference
Employed 3.7 (2.4-5.6)*** 0.5 (0.4-0.6)***
Unemployed 3.1 (1.9-5.1)*** 0.3 (0.2-0.5)***
Educational
attainment
Zero schooling Reference Reference
Primary 1.7 (1.0-2.8) 0.8 (0.7-1.0)
Secondary 0.8 (0.5-1.5) 0.2 (0.2-0.3)***
Diploma with
grade 12
1.0 (0.5-2.4) 0.1 (0.1-0.2)***
Bachelor’s
degree
0.9 (0.2-3.8) 0.2 (0.05-0.6)**
Bachelor’s + 1.4 (0.4-4.3) 0.2 (0.1-0.5)***
Household
Income
Lower Reference Reference
Middle 1.0 (0.7-1.6) 1.3 (0.8-1.7)**
Upper 0.7 (0.4-1.1) 1.4 (1.4-3.2)**
Race African/Black Reference Reference
Coloured 1.0 (0.6-1.7) 1.2 (0.9-1.6)
White 0.7 (0.3-1.9) 2.2 (1.6-3.2)***
Indian/Asian 0.5 (0.1-1.7) 1.0 (0.5-1.7)
Place of
Residence
Rural Reference Reference
Non-metro 2.2 (1.5-3.2)*** 1.7 (1.4-2.0)***
Metro 2.3 (1.5-3.5)*** 1.8 (1.1-1.9)***
***p<0.001 **p<0.01 *p<0.05
With regard to gender disparities, the odds of having hypertension in both age categories are
higher for females in comparison to males in South Africa. Females in the 35 to 44 age group
49
had five times higher odds of having hypertension than males. In the 45 and over age cohort
females had one and half times more odds than males. With regard to marital status, those who
were ‘never married’, divorced or separated in the 35 to 44 age cohort had lower odds in
comparison to those that are married or cohabiting. Married individuals had a 2 is to 1 odds ratio
in comparison to divorced or separated individuals and less than a third in comparison to those
never married. In the oldest cohort those that were cohabiting and never married had
significantly half and one-fifth, respectively, of the odds of having diabetes in comparison to
married individuals. In contrast to the younger cohort, those individuals that were divorced had
one and a half times the odds of acquiring hypertension than those who are married.
Individuals that are employed in South Africa had the highest odds of having hypertension in the
younger age cohort (three and a half times the odds) than those that were economically inactive.
Unemployed individuals had three times the odds of having hypertension than those who were
economically inactive. In the 45 and over category, employed individuals had half the odds and
unemployed individuals had a fifth of the odds in comparison to those that were economically
inactive. With regard to educational attainment, those with a primary education had the highest
odds ratio of acquiring hypertension in the 35 to 44 age cohort followed by post-graduates, zero
years of schooling, diplomacy and bachelor’s degree. In the 45 and over age cohort, those with
zero schooling had the highest odds in comparison to the other categories. For income, those
individuals in the middle and lower income categories had higher odds in the 35 to 44 age group
with upper income having the lowest odds (0.7). In the oldest age cohort, upper and middle
income categories had significantly higher odds of having hypertension in comparison to the
lower income.
Blacks/Africans and Coloured race groups had the highest odds of having hypertension followed
by Indian race group and White race group in the 35 to 44 age cohort. For the 45 and over group
the White race group had significantly higher odds of having hypertension (two-times higher
odds) than Black/African individuals. The remaining categories have approximately the same
odds as those in the as Black/African race group. Individuals that live in metropolitan and non-
metro urban areas had two and a half times the odds of acquiring hypertension than those living

50
in rural areas in the younger cohort. Those aged 45 and over showed significantly higher odds in
both metro and non-metro urban areas in comparison to rural areas with regard to hypertension.
In the 35 to 44 age cohort individuals that that were married, employed, with a lower household
income, living in a metropolitan area, had a post-graduate degree, had the highest odds of having
diabetes in that age cohort. In particular females and those individuals in the Indian race group
had a greater chance of acquiring diabetes. Among the 35 to 44 year old, those from the
Black/African or Coloured race groups, those that were married or cohabiting, employed, in the
lower or middle income category, living in a metro area, with primary school as the highest level
of education attained, had the highest odds of having hypertension. Here again females had a
greater chance.
In the 45+ age group those that were divorced or separated, economically inactive, living in an
upper income household with a zero to primary level of schooling, based in a metropolitan area
had highest odds of having diabetes. While those who were divorced or separated, economically
inactive, in the middle or upper income category, with zero years of education, and living in
either a non-metro urban or metro area had the highest odds of having hypertension in this age
cohort.
4.6 Conclusion
In this chapter a detailed review of the research results was presented revealing that there is a
significant relationship between socioeconomic status and chronic illness. Although the
relationship is not constant over age or sub-categories of chronic illness, a relationship does exist
between the dependent and independent variables in all of the applied regressions. Through
significant differences between sub-categories of variables, the relationships can be compared
and analysed to create the basis for further research. The concluding chapter, chapter 5, will
provide a summary of the research and highlight recommendations for future research.
51
Chapter Five
Discussion and conclusion
5.1. Introduction
Recently, the prevalence of chronic illnesses has increased significantly in developing country
contexts. South Africa is one such country that is expected to experience an increase in
conditions, such as diabetes and hypertension, threatening the country’s ability to improve the
health of its population. One of the reasons attributed to this change in heath patterns is the
complex association between socioeconomic factors and heath (National Research Council,
2006)
The first part of this chapter seeks to expand knowledge on the relationship between
socioeconomic factors and health, using the NIDS data. This will provide insight into the extent
to which chronic illness may follow a social gradient in the South African context. The latter part
of the chapter will present the major conclusions reached by the research. Given the fact that
chronic illnesses are expected to increase over the next few years, this will draw attention to the
socioeconomic and health issues that demand priority in South Africa. Based on the conclusions
made, recommendations and policy implications will be suggested for future studies in this field
of research.
5.2 Discussion
The study presented focussed on the context of South Africa, a country characterised by
increasing levels of chronic disease prevalence. Existing data shows that non-communicable
chronic conditions such as hypertension and diabetes are contributing to a large proportion of the
disease burden in this context (Puoanei, et al., 2008). These changes are occurring in tandem
with shifts in the socioeconomic profile of the country. Though a correlation between poverty
and ill-health has been observed throughout the world, data on this relationship is scarce in the
South African context. This study aimed to address this research gap by focussing on the
association between socioeconomic status and chronic illnesses. In particular the study focused

52
on hypertension and diabetes, rated among the top ten diseases and conditions contributing to
mortality, in South Africa (Puoanei, et al., 2008). As a country known for its extreme disparities
in wealth, the evidence obtained can be beneficial to other countries with similar economic and
health profiles among its population. In the long term this can be used to guide health and policy
initiatives towards launching more effective ways of reaching people at risk of chronic illnesses
while reducing socioeconomic and health inequalities.
With regard to the demographic characteristics of the sample, the research findings showed that
there is a low prevalence rate of chronic illness among those aged 34 years and below (3.3%) in
South Africa. Prevalence distribution rates among those aged 35 to 44 years and 45+ were found
to be higher at 16.1 % and 38.1 % respectively. This agrees with findings from previous studies
which have indicated a high prevalence rate of chronic illness among adults and those in the
older age cohort (Motala and Ramaiya, 2010). With data derived from South Africa, Tanzania,
Ghana, Cameroon and Sudan the Diabetes Atlas (WHO, 2011) estimated that 10.4 million
people, constituting 3.1 % of the adult population, had diabetes in the African Region in 2007.
The chronic illness rates among those aged 35 to 44 years in this study are concerning since
many of these people are in their productive years. This reduces productive labor and earning
capacity at a household level (Puoanei, et al., 2008). In the long term, investing in interventions
that aim to control the burden of chronic diseases can therefore benefit the economy. At the same
time there is a need for chronic health initiatives that target the older population. Existing
evidence suggests that as a result of a changing population age structure the proportion of older
people are expected to increase (Joubert and Bradshaw, 2005). With a growing older population,
countries will be faced with a cumulative burden of communicable and chronic diseases. As a
result of reduced ability to generate resources the older population lack basic needs that affect
their health status and are often faced with the burden of health issues. Existing studies are
suggesting that traditional caring and social support systems are also becoming increasingly
strained (Robinson, et al., 2007). Providing insight into the causes of chronic diseases health can
help guide policy development and strengthen institutions to respond effectively to population
aging.

53
In terms of gender, females were shown to have the highest chronic illness prevalence rates
across both age cohorts. Among males the chronic disease prevalence rates were lower at 23%
for ages 35 to 44 and 26% for ages 45+. This is in line with previous studies on chronic illness in
South Africa which show that women have higher prevalence rates of hypertension and diabetes
(Puoanei, et al., 2008). One of the reasons for this could be behavioral risk factors such as
physical inactivity. For instance data from a comparative study of 51 countries showed that
women (47.6%) were more physically inactive than men (44.7%) (Guthold, et al., 2008). A
similar pattern was found among young people in the 2002 South African Youth Risk Behavior
Survey where 43% of females participated in insufficient or no physical activity compared to
30.5% of males (Puoanei, et al., 2008). From a socio-cultural viewpoint these findings are not
surprising since gender is often highlighted as one of the most significant factors influencing
health (Evans, Frank, Oliffe, and Gregory, 2011). For instance masculinity is believed to play an
important role in men reporting better health status than women since men ascribe to a masculine
role of being strong (Evans, et al., 2011; Holroyd, 2005). This contributes to men’s experience
and perceptions of their own health thereby creating health disparities among men (Evans, et al.,
2011). Another reason for these health disparities are gender patterns in society which result in
women being less educated than men, less likely to participate in the workforce and having less
access to income (Joubert and Bradshaw, 2005). As a consequence of these outcomes, numerous
studies suggest that women report poorer health than men (Kuate-Defo, 2006). This study
similarly showed that females had significantly higher odds of acquiring diabetes and
hypertension in comparison to their male counterparts. In light of this, there is a need for the
increased provision of gender sensitive health promotion strategies particularly with regard to
poverty related diseases. This will need to be done against the background of wider initiatives
aimed at addressing gender and socioeconomic inequalities (Doyle and Hoffman, 2009).
The prevalence of chronic diseases among different race groups derived from the NIDS data
revealed that, the highest chronic disease prevalence rates were found among the African race
group in both age categories (72% for age 35-44 and 70% for age 45+). The Indian race group
had the lowest prevalence rates with (2% for age 35-44 and 2% for age 45+), followed by the
White and Coloured race groups. This data is in contrast with previous research such as self-
reported data based on the the 1998 and 2003 South Africa Demographic and Health Surveys

54
which showed that the Indian and White race groups had higher chronic disease prevalence rates
while the Black/African race group had the lowest prevalence rates (Puoanei, et al., 2008). One
the key reasons for this is the change in lifestyle patterns among the Black/African race group.
Studies show that in the past when the African population followed a traditional lifestyle,
diabetes was virtually absent (Bourne, Lambert, and Steyn, 2002). However, in South Africa,
rapid urbanization of the African population in the context of globalization has been
accompanied by shifts in health patterns increasing. Diets that are rich in fat, sugar and salt are
becoming more common thus increasing the prevalence of chronic diseases such as diabetes and
hypertension (Puoanei, et al., 2008). These findings draw attention to the need for public health
policy to intensify the promotion of healthy lifestyles among all race groups.
Education was found to be a key social determinant in health status across all age groups in the
study. Agreeing with findings from previous research, individuals with higher levels of education
exhibited lower rates of chronic illness than those with a lower level of education (Cutler, 2007).
For instance, only 1% of people with a bachelor’s degree aged 34 to 44 had a chronic illness
while only 5% of people aged 45 and over with a post-matriculation qualification had a chronic
illness. In contrast, the highest levels of chronic illness were found among those who had only a
secondary education in the 34 to 44 age group (40%) and those who had only a primary school
education in the 45 and over age (37%) group. Previous studies highlight that these findings are
a result of healthy lifestyles and positive health behaviours which are more prevalent in better
educated men and women since they more likely to have a greater awareness of health problems
and benefit from health information (Chaturvedi, et al., 2011; Deaton, 2002). Income is also an
important determinant of chronic disease prevalence. An analysis of chronic illness over
household income showed that those in the middle income category had the highest rates of
prevalence in both age cohorts in South Africa. The lower income group was found to have the
lowest prevalence for age-group 45+ (26%). These results prove that chronic diseases are no
longer the preserve of the wealthy income groups (Puoanei, et al., 2008), with diseases such as
diabetes and hypertension evident across all income groups. Given the cross sectional nature of
the data analysed, one of the limitations of the data was that it was difficult to identify whether a
causal relationship exists between socioeconomic status and chronic illness. Therefore, the
results of the study cannot be used to infer that it is socioeconomic status differences that results
55
in people acquiring diabetes or hypertension, or alternatively that having a chronic illness has the
effect of lowering an individual’s socioeconomic status. This study investigated whether there
was a significant association between the two variables when controlling for other distal effects.
With regard to employment, those who were economically inactive in the 45 and over age
category had the highest prevalence rate of chronic illness at 61%. However, among the 35 to 44
age group the highest prevalence was found among employed individuals at 56% followed by
those that were economically inactive. Unlike in other studies, this study revealed that the lowest
rates of prevalence are found in the unemployed category in South Africa for both age groups.
This was an interesting finding since unemployment has often been linked with negative health
behaviours which predispose individuals to poor health outcomes (Doyle, et al., 2005; Virtanen,
et al., 2008). However, one of the limitations of this study was that employment status as a
variable was defined under three categories, employed, unemployed and economically inactive.
In reality, employment status can be broken down further into skilled, unskilled, semi-skilled and
the unemployed. Economically inactive as a sub category can be used as a variable on its own as
there are many categories in the economically inactive group, such as, the retired and the
disabled. The broad categories of employment status were used in the study to establish whether
a basic relationship exists between socioeconomic status and chronic illness. There is e a need
for further research on employment and chronic disease prevalence particularly in the context of
South Africa.
An important finding in the study was that the highest prevalence of chronic illness was found
among those individuals living in rural areas. With people aged 45 and over, (45%) who had a
chronic illness lived in a rural area while (36%) of 35 to 44 year olds had a chronic illness. Metro
areas had the lowest prevalence rates across the 35 to 44 and 45+ age groups with 18% and 18%
respectively. This is contrast to the results from the multivariable and bivariable analysis which
showed that, for individuals across both age cohorts, those living in metropolitan and non-metro
urban environments had significantly higher odds of acquiring chronic illness in comparison to
those living in rural areas. For instance, existing data from South Africa shows that shifts in
dietary intake and eating patterns are particularly visible in urban areas (Bourne, et al., 2002;
Tsolekile, 2007). Lifestyles of individuals who live in urban areas are also characterized by a

56
decrease in physical activity and an increase in tobacco and alcohol use (Steyn, 2006; Tsolekile,
2007). Consequently, urban dwellers are more likely to be vulnerable to acquiring non-
communicable diseases compared to the more traditional lifestyle of rural areas, which is more
often characterized by physical activity. However, more recently shifts towards a western diet
and lifestyle are apparent in rural areas as well (Steyn, 2006). The results of this study reaffirm
these findings. Aside from diet and lifestyle, other reasons for the high prevalence of ill-health in
rural areas could be barriers to accessing health care including transport constraints, geographical
constraints and lack of appropriate health workers and coverage (Kuate-Defo, 2006). At the
same time however these constraints would also be expected to lead to under diagnosis of
conditions such as diabetes and hypertension.
The fact that the highest prevalence of chronic illness was found among individuals living in
rural areas therefore draws attention to the need for health initiatives to focus on non-
communicable diseases in these settings. Policy makers need to ensure that the correct
information on the determinants of chronic diseases, such as diet and lifestyle, as well as related
services is available in all settings. This is particularly relevant in rural areas where a large
majority of people survive on an income of less than R1 000 per month (Steyn, 2006).
From a theoretical view point, the Adler and Ostrove model provides a framework for
understanding the links between socioeconomic status and health. The model provides a basis
for interpreting the results of the study as it highlights how years of schooling, employment
status, income and place of residence are key social determinants of health. As reflected in the
model there are various pathways through which the socioeconomic status of individuals were
found to indirectly influence patterns their patterns of health. The results of this study also
reiterate that these dimensions of socioeconomic status are interrelated. At the same time
however each reflects differently in the individual and societal forces associated with chronic
disease and health. For instance the relationship between many of these determinants and health
outcomes was not as simplified as the model highlights. There are many external influences
including the context in which the model is used that draw attention to the need to modify the
model and its causal pathways.

57
5.3 Recommendations and Conclusion
The findings of the study revealed that a significant relationship exists between socioeconomic
factors and health. The prevalence of chronic disease varies across the socioeconomic gradient
for specific non-communicable diseases as well as for important chronic disease risk factors.
Aside from a country with huge disparities in income distribution, South Africa is characterized
by a mix of developed and developing areas in terms of its population as well. This element of
unequal distribution is evident across all aspects of society including health. Policy interventions
which address the impact of chronic disease at a population level need to therefore take into
account these socioeconomic inequalities. In South Africa, policies that reduce inequities across
the population need to be developed. According to Glover et al (2004) the socioeconomic
environment is a potentially modifiable factor thus public policy can play an instrumental role in
improving this environment in areas such as housing, education, work and social security. The
results of the study reiterate the need to make health inequalities a research priority for future
studies. With an aging population, future research should focus on these inequalities across the
life course. Aside from assessing the extent of socioeconomic and health disparities studies are
also needed on preventive approaches and policy interventions aimed at reducing these
inequities.
Though the socioeconomic circumstances of individuals still impact significantly on their health
outcomes, the data obtained also reaffirms that chronic diseases are no longer the preserve of the
wealthy. Rapid urbanization, changes in lifestyle and diet in the context of globalization has
contributed to a shift in health patterns. Consequently, there has been an increase in the
prevalence of chronic diseases such as diabetes and hypertension across all sectors of South
African society. In a country burdened with multiple diseases, there is a need for further
research and data on chronic conditions such as diabetes and hypertension. This will serve as a
basis for health and policy initiatives towards reaching people at risk of chronic illnesses while
reducing socioeconomic inequalities. Evidence from other countries reveals that population-
wide approaches to reducing the risk throughout the whole population are effective. Unlike most
approaches, these interventions address the causes as opposed to the consequences of chronic

58
disease. By addressing the causes we can aim to prevent the emergence of future epidemics
(Puoanei, et al., 2008).

59
Reference List
Abubakari, A. R., Lauder, W., Jones, M. C., Kirk, A., Agyemang, C., and Bhopal, R. S. (2009).
Prevalence and time trends in diabetes and physical inactivity among adult West African
populations: the epidemic has arrived. Public Health, 123(9), 602-614.
Adda, J., Chadola, T., and M., M. (2002). Socio-economic status and health: causality and
pathways. Journal of Econometrics, 121(1), 7.
Addo, J., Smeeth, L., and Leon, D. A. (2007). Hypertension in sub-saharan Africa: a systematic
review. Hypertension, 50(6), 1012-1018.
Adler, N. E., and Ostrove, J. M. (1999). Socioeconomic status and Health: What We Know and
What We Don’t. California: Uiversity of California.
Agardh, E. E., Ahlbom, A., Andersson, T., Efendic, S., Grill, V., Hallqvist, J., and Ostenson, C.
G. (2004). Explanations of socioeconomic differences in excess risk of type 2 diabetes in
Swedish men and women. Diabetes Care, 27(3), 716-721.
Armstrong, P., Lekezwa, B., and Siebrits, K. (2009). Poverty in South Africa: A profile based on
recent household surveys Retrieved 10 November, 2011, from
http://www.ngopulse.org/article/poverty-remains-priority-sa
Azevedo, M., and Alla, S. (2008). Diabetes in sub-saharan Africa: kenya, mali, mozambique,
Nigeria, South Africa and zambia. International Journal of Diabetes in Developing
Countries, 28(4), 101-108.
Bewick, V., Cheek, L., and Ball, J. (2005). Statictics Review 14: Logistic regression. Critical
Care 2005, 9(1), 7.
Bourne, L. T., Lambert, L. V., and Steyn, K. (2002). Where does the black population of South
Africa stand on the nutrition transition? Public Health Nutrition, 5(1A), 6.
Brown, A. F., Ettner, S. L., Piette, J., Weinberger, M., Gregg, E., Shapiro, M. F., and Beckles, G.
L. (2004). Socioeconomic position and health among persons with diabetes mellitus: a
conceptual framework and review of the literature. Epidemiological Review, 26, 63-77.
Case, A. (2004). Does Money Protect Health Status: Evidence from south African pensions. In
D. A. Wise (Ed.), Perspectives on the Economics of Aging: University of Chicago Press.
Chaturvedi, N. (2004). Socioeconomic status and diabetes outcomes; what might we expect and
why don't we find it? International Journal of Epidemiology, 33(4), 4.
Cortinovis, I., Vela, V. and Ndiku, J. (1993). Construction of a socio-economic index to
facilitate analysis of health in data in developing countries. Social Science and
Medicine. (36).1087-1097.
Cremeens, J. L., Nelson, D., Naimi, T.S., Brewer, R.D., Pearson, W.S. and Chavez, P.R. (2009).
Sociodemographic Differences in Binge Drinking Among Adults-14 States, 2004.
Morbidity and Mortality Weekly Report, 58(12), 4.
CureResearch. (2008). Statistics by Country for Hypertension. Retrieved Accessed 25 January,
2010, from http://www.CureResearch.com
Cutler, D. M., and Lleras-Muney, A. (2007). Education and health. National Poverty Center
Policy Brief number 9. Retrieved 18 March, 2011, from
http://www.npc.umich.edu/publications/policy_briefs/brief9/policy_brief9.pdf
de-Graft Aikins, A., Unwin, N., Agyemang, C., Allotey, P., Campbell, C., and Arhinful, D.
(2010). Tackling Africa's chronic disease burden: From the local to the global.
Globalization and Health, 6(5).

60
de Ramirez, S. S., Enquobahrie, D. A., Nyadzi, G., Mjungu, D., Magombo, F., Ramirez, M. and
Willett, W. (2010). Prevalence and correlates of hypertension: a cross-sectional study
among rural populations in sub-Saharan Africa. Journal of Human Hypertension, 24(12),
786-795.
Deaton, A. (2002). Policy implications of the gradient of health and wealth. Health Aff
(Millwood), 21(2), 13-30.
Department of Health. (2006). London health Commission: Sustainable Local Economies for
health project DOH.
Donjeany, J. (2008). Chronic Disease: Shock Statistics on heart Disease and stroke in South
Africa. Retrieved 25 January, 2010, from www.bizcommunity.com
Doyle, C., Kavanagh, P., Metcalfe, O., and Lavin, T. (2005). Health Impacts of Employment: A
review. Ireland: Institute of Public Health in Ireland.
Doyle, L., and Hoffman, M. (2009). The growing burden of chronic diseases among South
African women. Chronic Diseases, 27(10), 3.
Evans, J., Frank, B., Oliffe, J. L., and Gregory, D. (2011). Health, Illness, Men and Masculinities
(HIMM): a theoretical framework for understanding men and their health. Journal of
Men’s Health, 8(1), 9.
Feinstein, L., Sabates, R., Anderson, T. M., Sorhaindo, A., and Hammond, C. (2006). What are
the effects of education on health? Measuring the effects of Education on health and
Civic Engagement proceedings of the Copenhagen Symposium.
Filmer D. and Pritchett L.H. (2001). Estimating wealth effect without expenditure data – or
tears: an application to educational enrolments in states of India. Demography. (38).115-
132
Frolich, K. L., Ross, N., and Richmond, C. (2006). Health disparities in Canada today: Some
evidence and a theoretical framework. Health Policy, 79(2), 12.
Glover, J.D., Hetzel, D.M.S. and Tennant, S.K. (2004). The socioeconomic gradient abd chronic
illness and associated risk factors in Australia. Aust New Zealand Health Policy.(1). 1-8.
Gokah, T. K., and Gumpo, R. (2010). Enabling and empowering--the need for an integrated
approach to address hypertension among African adults. Health Education, 25(3), 510-
518.
Guthold, R., Ono, T., Kathleen, L., Strong, K. L., Chatterji, S., and Morabia, A. (2008).
Worldwide variability in physical inactivity A 51-country survey. American Jounal of
Prev Medicine, 34(6), 9.
Hallman, K. (2005). Gendered socioeconomic conditions and HIV risk behaviours among young
people in South Africa. African Journal of AIDS Researc,h 4(1), 14.
Health24. (2006). Diabetes South Africa: Living with Diabetes Retrieved 20 February, 2010,
from www.health24.com/diabetes
Holroyd, G., Richardson, D., and Webb, J. (2005). Recasting masculinity: mapping out
challenges and opportunities for public health. Retrieved 20 June, 2011, from
http://www.radcliffe-oxford.com/books/samplechapter/0347/Sexual%20Health_013-026-
6a71b780rdz.pdf.
Hosmer, D. W., and Lemeshow, S. (2000). Applied Logistic Regression. Canada: John Wiley and
Sons, Inc.
Joubert, J., and Bradshaw, D. (2005). Population aging and health challenges in South Africa
Chronic Diseases of Lifestyle in South Africa since 1995-2005, 204-219.

61
Kearney, P. M., Whelton, M., Reynolds, K., Muntner, P., Whelton, P. K., and He, J. (2005).
Global burden of hypertension: analysis of worldwide data. Lancet, 365, 7.
Kelly, K., Freeman, M., Nkomo, N., and Ntlabati, P. (2009). The vicious circularity of mental
health effects of HIV/AIDS: Symptom and cause of poor responses to the epidemic.
Retrieved 15 January, 2010, from
http://www.cadre.org.za/files/Mental%20Health%20Kelly%20et%20al.pdf
Kingdon, G. a. K., J. (2006). The measurement of unemployment when unemployment is high.
Labour Economics, 13(3), 25.
Kolling, M., Winkley, K., and von Deden, M. (2010). "For someone who's rich, it's not a
problem". Insights from Tanzania on diabetes health-seeking and medical pluralism
among Dar es Salaam's urban poor. Global Health, 6, 8.
Kuate-Defo, B. (2006). Interactions between socio-economic status and living arrangements in
predicting gender-specific health status among the elderly in Cameroon. In B. Cohen and
J. Menken (Eds.), Aging in Sub-Saharan Africa: Recommendations for Furthering
Research. Washington DC: The National Academic Press.
Lehohla, P. (2006). Knowing causes of death is crucial for planning Retrieved 25 January 2010
from www.statssa.gov
Lleras-Muney, A. (2005). The relationship between education and adult mortality in the United
States. Review of Economics Studies. 72, 33.
Low, M. D., Low, B. J., Baumler, E. R., and Huynh, P. T. (2005). Can education policy be health
policy? Implications of research on the social determinants of health. Journal of Health
Political Policy Law, 30(6), 1131-1162.
Mayosi, B. M., Flisher, A. J., Lalloo, U. G., Sitas, F., Tollman, S. M., and Bradshaw, D. (2009).
The Burden of Non-communicable Diseases in South Africa. Lancet, 374(9693), 14.
Montgomery, M.R., Gragnolati, K., Burke, A. and Paredes, E. (2000). Measuring living
standards with proxy variables. Demography. (37).155-174.
McClinton, F., and Zuberi, T. (2006). Racial Residential Segregation in South Africa and the
United States Retrieved 15 March, 2010, from
http://paa2006.princeton.edu/download.aspx?submissionId=61673
McLaren, L. (2007). Socioeconomic status and obesity. Epidemiol Review, 29, 29-48.
Medicinenet. (2000). Websters New World medical Diction Retrieved 13 July, 2010, from
www.medterms.com/main/art.asp?articlekey=2731
Mezuk, B., Eaton, W. W., Golden, S. H., and Ding, Y. (2008). The influence of educational
attainment on depression and risk of type 2 diabetes. American Journal of Public Health,
98(8), 1480-1485.
Minh, H. V., Byass, P., Chuc, N. T., and Wall, S. (2006). Gender differences in prevalence and
socioeconomic determinants of hypertension: findings from the WHO STEPs survey in a
rural community of Vietnam. Journal of Human Hypertension, 20(2), 109-115.
Motala, A., and Ramaiya, K. (2010). Diabetes the hidden pandemic and its impact on sub-
Saharan Africa. Retrieved 5 July, 2011, from
http://www.changingdiabetesbarometer.com/docs/Diabetes%20in%20sub-
saharan%20Africa.pdf.
National Research Council. (2006). Panel on policy research and data needs to meet the
challenge of aging in Africa. In B. a. M. Cohen, J. (Ed.), Aging in sub-Saharan Africa:
Recommendations for furthering research. Washington (DC): The National Academic
Press.

62
Nawi, N. G., Kowal, P. and Kahn, K. (2010). Health inequalities among older men and women
in Africa and Asia: Evidence from eight health and demographic surveillance system
sites in the in-depth WHO-SAGE study. Global Health Action, 2, 12.
National Income Dynamics Study. (2009a). Methodology: Report on NIDS Wave 1: Technical
Paper no. 1
National Income Dynamics Study. (2009b). National Income Dynamic Study: Wave 1 dataset.
Puoanei, T., Tsolekilei, L., Sandersi, D., and Parkerii, W. (2008). Chronic and Non-
communicable diseases in South Africa.
Nugent, R. (2008). Chronic Diseases in Developing Countries: Health and Economic Burdens.
Ann. N.Y. Academic Sciences, 1136, 10.
Rabi, D. M., Edwards, A. L., Southern, D. A., Svenson, L. W., Sargious, P. M., Norton, P., . . .
Ghali, W. A. (2006). Association of socio-economic status with diabetes prevalence and
utilization of diabetes care services. BMC Health Service Research, 6, 124.
Ramin, B. (2009). Slums, climate change and human health in sub-Saharan Africa. Bull World
Health Organ, 87(12), 886.
Rao, C., Lopez, A.D. and Hemed, Y. . (2006). Causes of death. In D. T. DT Jamison, Feachem,
R.G. and Makgoba M.W. (Ed.), Disease and Mortality in sub-Saharan Africa.
Washington (DC): The World Bank.
Raphael, D. (2006). Social Determinants of Health: Present Status, Unanswered Questions and
Future Directions. International Journal of Health Services, 36(4), 27.
Reine, I., Novo, M., and Hammarstrom, A. (2008). Does transition from an unstable labour
market position to permanent employment protect mental health? Results from a 14-year
follow-up of school-leavers. BMC Public Health, 8, 159.
Robinson, M. N., W., Pearson, C., and Norris, L. (Eds.). (2007). Global health and global aging.
San Francisco (CA): Jossey-Bass.
Ross, N. A., Garner, R., Bernier, J., Feeny, D. H., Kaplan, M. S., McFarland, B., . . . Oderkirk, J.
(2011). Trajectories of health-related quality of life by socio-economic status in a
nationally representative Canadian cohort. Journal of Epidemioical Community Health.
Rueda, S., Raboud, J., Mustard, C., Bayoumi, A., Lavis, J. N., and Rourke, S. B. (2011).
Employment status is associated with both physical and mental health quality of life in
people living with HIV. AIDS Care, 23(4), 435-443.
Sanchez-Vaznaugh, E. V., Kawachi, I., Subramanian, S. V., Sanchez, B. N., and Acevedo-
Garcia, D. (2009). Do socioeconomic gradients in body mass index vary by
race/ethnicity, gender, and birthplace? American Journal of Epidemiology, 169(9), 1102-
1112.
Schellenberg, J.A., Victora, C.G. and Mushi, A. (2003). Inequities among the very poor:
health care for children in southern Tanzania. The Lancet. (361), 561-566.
Schmittdiel, J., Bodenheimer, T., Solomon, N. A., Gillies, R. R., and Shortell, S. M. (2005).
Brief Report: The Prevalence and Use of Chronic Disease Registries in Physician
Organizations: A National Survey. Journal of Gen International Medicine, 20(9), 4.
Schneider, M., Manabile, E., and Tikly, M. (2008). Social Aspects of Living with rheumatoid
arthritis: a qualitative descriptive Study in Soweto, South Africa: a low resource context.
Health and Quality of Life Outcomes, 6(54).
Shavers, V. L. (2007). Measurement of Socioeconomic Status in Health Disparities Research.
Journal Of The National Medical Association, 99(9), 11.
63
Shaw, J. E., Sicree, R. A., and Zimmet, P. Z. (2010). Global estimates of the prevalence of
diabetes for 2010 and 2030. Diabetes Res Clin Pract, 87(1), 4-14.
Smith, B. T., Lynch, J. W., Fox, C. S., Harper, S., Abrahamowicz, M., Almeida, N. D., and
Loucks, E. B. (2011). Life-course socioeconomic position and type 2 diabetes mellitus:
The Framingham Offspring Study. American Journal Epidemiology, 173(4), 438-447.
Stern, R., Puoane, T., and Tsolekile, L. (2010). An exploration into the determinants of
noncommunicable diseases among rural-to-urban migrants in periurban South Africa.
Prev Chronic Dis, 7(6).
Steyn, K. (2006). Hypertension in South Africa Chronic Diseases of Lifestyle in South Africa
since 1995 - 2005.
Steyn, K., and Bradshaw, D. (2001). Poverty and Chronic Disease in South Africa. Technical
Report.
Steyn, N. P. (2006). Nutrition and the chronic diseases of lifestyle in South Africa. Chronic
Diseases of Lifestyle in South Africa since 1995 - 2005.
Tesfaye, F., Byall,. P. and Wall, S. . (2009). Population based prevalence of high blood pressure
among adults in Addis Ababa: uncovering a silent epidemic. BMC Cardiovascular
Disorders, 9(39).
Tsolekile, L. P. (2007). Urbanization and lifestyle changes related to non-communicable
diseases: An exploration of experiences of urban residents who have relocated from the
rural areas to Khayelitsha, an urban township in Cape Town.
Wallach, J. B., and Rey, M. J. (2009). A socioeconomic analysis of obesity and diabetes in New
York City. Prevalent Chronic Diseases, 6(3).
Wamala, J. F., Karyabakabo, Z., Ndungutse, D., and Guwatudde, D. (2009). Prevalence factors
associated with hypertension in Rukungiri district, Uganda--a community-based study.
African Health Science, 9(3), 153-160.
World Bank (2008). Health Workers Needed: Poor Left Without Care in Africa’s Rural Areas,
from
http://web.worldbank.org/WBSITE/EXTERNAL/COUNTRIES/AFRICAEXT/0,,menuP
K:258649~pagePK:158889~piPK:146815~theSitePK:258644,00.html
World Health Organisation, (2005). Preventing Chronic Diseases: A Vital Investment. World
Health Organization and the Public Health Agency of Canada.
World Health Organisation.(2008a). Social determinants of health. Retrieved 6 April, 2011,
from http://www.who.int/social_determinants/en/
WHO. (2011). ATLAS Report of headache disorders and resources: WHO.
Winkelby, M. A., Jatulis, D.E., Frank, E., Fortmann, S.P. . (1992). Socieconomic status and
health: How education, income and occupation contribute to risk factors for
cardiovascular disease. American Journal of Public Health (82), 5.
Yach, D. (2004). The Global Burden of Chronic Diseases. The Journal of the American Medical
Association., 291(21), 7.

64
Appendix
Appendix 1: National Income Dynamics. Study Wave 1: 2008. Adult (15+)
Questionnaire
Appendix 2: National Income Dynamics. Study Wave 1: 2008. Household Questionnaire

National Income Dynamics Study Wave 1: 2008 Adult (15+) Questionnaire Cover
A1 PSU number A2 Household questionnaire number
A3 Household control sheet number A4 Pcode from the household roster
Respondent details A5 Name
A6 Surname
A7 Any other names by which this respondent is known?
A8 Telephone number (Home) (___ ___ ___) ___ ___ ___ - ___ ___ ___ ___
A9 Telephone number (Work) (___ ___ ___) ___ ___ ___ - ___ ___ ___ ___
A10 Telephone number (Cell phone) (___ ___ ___) ___ ___ ___ - ___ ___ ___ ___
A11 Email address
A12 Preferred languages (See code sheet for Language codes)
Interviewer Details A13 Interviewer name
A14 Date of interview (dd/mm/yyyy) __ __/__ __/__ __ __ __ A15 Interview start time __ __:__ __
Appointments Log Date (dd/mm/yyyy) Time Reason for appointment
A16.1 __ __/__ __/__ __ __ __ A16.2 __ __:__ __ A16.3:
A17.1 __ __/__ __/__ __ __ __ A17.2 __ __:__ __ A17.3:
A18.1 __ __/__ __/__ __ __ __ A18.2 __ __:__ __ A18.3:
A19.1 __ __/__ __/__ __ __ __ A19.2 __ __:__ __ A19.3:
A20.1 __ __/__ __/__ __ __ __ A20.2 __ __:__ __ A20.3: Refusals (if applicable) A21 What is the main reason for refusal? Too busy 1
Not interested/waste of time 2 Questionnaire too personal/too intrusive 3 Don’t trust surveys 4 Never do surveys 5 Too old 6 Other (specify) 7
A22 What degree of interaction did you have with the person doing the refusing?
None – Refused calling card 1 Very little – they cut me short, said no thanks 2 Some – Got to say I was doing an important survey 3 A fair bit – got to show them the brochure, and spend a bit of time trying to talk them around 4
A23: Comments regarding the refusal.................................................................................................................................................
.................................................................................................................................................................................................................
................................................................................................................................................................................................................
................................................................................................................................................................................................................
................................................................................................................................................................................................................

National Income Dynamics Study
Consent Form: Adult (15+) Questionnaire This is a study about household composition and migration, household income and expenditure, employment and schooling in South Africa. This project is run by researchers at the University of Cape Town on behalf of the South African Presidency. The purpose of this study is to learn more about how people in South Africa are faring over time. As part of this study, we would like to ask you some questions about your parents and your own education, activities, employment, income and health. We would like to measure your height, weight and blood pressure and will give you these measurements. If you are between the ages of 15 and 59, we would also like you to complete a short numeracy test yourself. The interviewer will not see your answers as you will place this in a self-seal envelope. If you are a woman, we would also like to ask you about any children that you have had. Before we begin the interview, we want to make sure you understand the following information about the study:
• Your participation is entirely voluntary. You may refuse to take part in the interview, and you may stop at any time if you do not want to continue. You also have the right to skip any particular question or questions if you do not wish to answer them.
• The time it takes to complete the interview will vary depending on how many sections of the questionnaire are relevant to you, but the average amount of time for this interview is about 45 minutes.
• You have the right to ask questions at any point before the interview, during the interview, or after the interview is completed.
• All information collected for this study will be kept strictly confidential. While the data collected will be used for research purposes, information that could identify you or your household will never be publicly released in any research report or publication.
• The intention of the study is to conduct further interviews with you in the future. As a result, your personal details will be kept on record in order that you can be re-contacted to participate in future studies that form part of this project. However, we will ask your permission to participate in the survey again each time. Agreeing to participate now does not mean you have to participate in future surveys.
By signing below, you signify that you agree to participate in the study, and that your participation is entirely voluntary: SIGNATURE DATE Signature of caregiver if respondent is younger than 18 years of age: _______ SIGNATURE: CAREGIVER DATE Fieldworker and supervisor to countersign below if respondent is not able to sign: _________________________________________ ____________________________________ SIGNATURE: FIELDWORKER SIGNATURE: SUPERVISOR If you have questions about this interview or the NIDS project you can call us at 0800 11 NIDS (6437), fax us on 021-650-5697 or email us at [email protected].
This study has been reviewed and approved by the ethical review committee of the University of Cape Town. Feel free to contact Sharon Apolles, Senate Officer, Bremner Building, email: [email protected], Tel: 021-650 2191 should you have any queries or complaints.

Adult (15+) Questionnaire Wave 1: 2008
Contents Section B: Demographics .................................................................................................................................................. 1
Section C1: Children ever born ......................................................................................................................................... 2
Section C2: Birth history .................................................................................................................................................... 3
Section D: Parent’s education, living arrangements and vital status ................................................................................ 4
Section E: Labour market participation ............................................................................................................................. 5
Section F1: Individual income from non-employment sources ....................................................................................... 11
Section F2: Contributions received ................................................................................................................................. 12
Section F3: Contributions given ...................................................................................................................................... 13
Section G: Personal ownership and debt ........................................................................................................................ 14
Section H: Education ....................................................................................................................................................... 15
Section J: Health ............................................................................................................................................................. 19
Section K: Emotional health ............................................................................................................................................ 22
Section L: Household decision-making ........................................................................................................................... 23
Section M: Well-being and social cohesion .................................................................................................................... 23
Section N: Measurements ............................................................................................................................................... 25
Section P: Numeracy module .......................................................................................................................................... 26
Section R: Alternative contact information ...................................................................................................................... 27
Section S: Interview evaluation ....................................................................................................................................... 28
For Office use only
Pcode from household roster Household control sheet number
Household questionnaire number

1
Section B: Demographics INTERVIEWER READ OUT: We would like to ask you some questions about your background.
B1 What is your date of birth? dd mm year
B2 What is your gender? Male 1 Female 2
B3 What population group would you describe yourself as belonging to?
African 1 Coloured 2 Asian/Indian 3 White 4 Other (specify) 5 Refused 8
B4 Which language do you usually speak at home? Interviewer: See code sheet for Language codes
Language
If other, specify
B5
What is your current marital status?
Married 1 Living with partner 2 Widow/Widower → SKIP TO B7 3 Divorced or separated → SKIP TO B7 4 Never married → SKIP TO B8 5
B6
How many years have you been married or living together (with this partner)? Interviewer: If less than 1 year, write 1
Number of years → SKIP TO B8
B7 How long have you been widowed, divorced or separated from your last partner? Interviewer: If less than 1 year, write 1
Number of years
B8 Over the past 7 nights, how many nights did you sleep under this roof? Interviewer: If all, write 7
B9 Over the past month, how many nights did you sleep under this roof? Interviewer: If all, write 31
B10
In what year did you move to this place? Interviewer: Emphasise we are collecting information on change of PLACE, not change of house or suburb within a place/town/city. If never moved, write 7777 and go to Section C1
INTERVIEWER READ OUT: Now we would like to know about the different places that you have lived. In each instance please give the suburb, town, province and country if not South Africa.
Suburb Town/City
Province See code sheet for Province
codes
Country (If not South Africa)
Geo Code (For
office use only)
B11 Where were you born?
B12 Where did you live before moving to the place where you are living now? Interviewer: If the same as B11, write 7777
B13 Where were you living in 1994? Interviewer: If the same as current location, write 7777.
B14 Where were you living in February 2006? Interviewer: If the same as current location, write 7777

2
Section C1: Children ever born C1.1
INTERVIEWER CHECK! Is the respondent female?Yes 1
No → SKIP TO D1 2
INTERVIEWER READ OUT: Now we would like to ask you about all the children that you have ever given birth to.
C1.2
Have you ever given birth? Yes 1
No → SKIP TO C1.9 2
C1.3
Do you have any biological children to whom you have given birth who are currently living with you? Yes 1
No → SKIP TO C1.5 2
C1.4 How many biological children are now living with you? Number
C1.5
Do you have any biological children who are still alive, but are not living with you? Yes 1
No → SKIP TO C1.7 2
C1.6 How many biological children are still alive, but do not live with you? Number
C1.7
Have you ever given birth to a son or a daughter who was born alive (cried out), but later died? Please tell us about a child even if he/she died after only a few hours or days.
Yes 1
No → SKIP TO C1.9 2
C1.8 How many children were born alive but passed away later? Number
C1.9
INTERVIEWER CHECK! Is this respondent 49 years old or younger? Yes 1
No → SKIP TO C1.11 2
C1.10 Are you currently pregnant? Yes 1 No 2 Refused 8 Don’t know 9
C1.11 INTERVIEWER CHECK! Add up C1.4, C1.6 and C1.8. How many children has this person given birth to? Number
C1.12 I would like to check: is it correct that you have given birth [...] times? Interviewer: If no, probe to make the numbers correct
Yes 1
No 2 C1.13
INTERVIEWER CHECK! Has this respondent ever given birth, i.e. C1.2 = Yes? Yes 1
No → SKIP TO D1 2

3
Section C2: Birth history INTERVIEWER READ OUT: Now we would like to ask you more questions about all children born alive, even if the child only lived for a few hours or days.
C2.1Starting with the first birth, what
was the name given to that child?
Interviewer: Complete column
C2.1 before continuing with the rest of the table
If child had no name, write X
C2.2Was [...] a male or a female?
Male = 1
Female = 2
C2.3What date was [...]
born?
Interviewer: Write 99/99/9999 if don’t
know
dd/mm/yyyy
C2.4Is [...] still
alive?
→ If yes, skip to C2.7
Yes No
C2.5How old was [...] when
he/she died?
→ Skip to next child
C2.6
Circle One
C2.7Is [...] still living with you?
→ If no, skip to next child
Yes No
C2.8 Interviewer: What is the
Pcode for this child
Pcode
1 1 2 __ __/__ __/__ __ __ __
1 2 Days 1 Months 2 Years 3
1 2
2
1 2 __ __/__ __/__ __ __ __
1 2 Days 1
Months 2 Years 3
1 2
3
1 2 __ __/__ __/__ __ __ __
1 2 Days 1
Months 2 Years 3
1 2
4
1 2 __ __/__ __/__ __ __ __
1 2 Days 1
Months 2 Years 3
1 2
5
1 2 __ __/__ __/__ __ __ __
1 2 Days 1
Months 2 Years 3
1 2
6
1 2 __ __/__ __/__ __ __ __
1 2 Days 1
Months 2 Years 3
1 2
7 1 2 __ __/__ __/__ __ __ __
1 2 Days 1 Months 2 Years 3
1 2
8 1 2 __ __/__ __/__ __ __ __
1 2 Days 1 Months 2 Years 3
1 2
9 1 2 __ __/__ __/__ __ __ __
1 2 Days 1 Months 2 Years 3
1 2
10 1 2 __ __/__ __/__ __ __ __
1 2 Days 1 Months 2 Years 3
1 2
C2.9 INTERVIEWER CHECK! How many children are reported in this table? Number
C2.10 INTERVIEWER CHECK! Are the number in C1.11 and C2.9 the same? If no, probe to get the correct information
Yes 1
No 2

4
Section D: Parents’ education, living arrangements and vital status INTERVIEWER READ OUT: Now I would like to ask about your biological parents. Interviewer: Complete the column on the mother first, then the column on the father. Biological
Mother Biological
Father D1
Is your […] alive now? Yes 1
→ SKIP TO D6 1
→ SKIP TO D6 No 2 2 Refused 8 8 Don’t know 9 9
D2 How old was your [...] when he/she died? Age
Refused -8 -8
Don’t know -9 -9 D3
In what year did your [...] die?
Year of death → SKIP TO D7 → SKIP TO D7
Don’t know 9999 9999
D4
Did your [...] die before you were 15 years old? Yes 1 1
No 2 → SKIP TO D7
2 → SKIP TO D7
Don’t know 9 9 D5 Did your [...] die before you were 5 years old?
→ SKIP TO D7
Yes 1 1 No 2 2 Don’t know 9 9
D6
Does your [...] live in this household? Yes
1 → SKIP TO
FATHER
1 → SKIP TO E1
No 2 2 Don’t know 9 9
D7 In what year was your [...] born Interviewer: Write 9999 if don’t know Year
D8 What is the highest grade in school that your [...] successfully completed? Interviewer: See code sheet for Education codes. Codes 17 to 24 are not applicable
Highest school grade
If other, specify here
D9 Did your [...] successfully complete any diplomas, certificates, degrees outside of school? If yes, what is the highest level of education your [...] successfully completed? Interviewer: See code sheet for Education Codes. Codes 00 to 16 and 25 are not applicable. If none, write 55
Higher education
If other, specify here
D10
What kind of work does/did your [...] usually do in their current or last job? In other words, what is/was your [...]’s occupation or job title? Interviewer: Record at least two words: car sales person, office cleaner, vegetable farmer, primary school teacher, etc. If never worked, write 7777, go to next
Job title
D11 What were/are your [...]’s main tasks or duties in this work? For example some people sell fruit or, repair machines or keep accounts or deliver things or look after cattle.
Main duties

5
Section E: Labour market participation INTERVIEWER READ OUT: In this section we find out whether you are working or unemployed or not wanting to work right now. We start by asking questions for those who are being paid a wage or salary to work regularly, whether full-time or part-time.
E1
Are you currently being paid a wage or salary to work on a regular basis for an employer (that is not yourself) whether full time or part time? If you work for yourself, we will ask about this later.
Yes 1
No →SKIP TO E28 2
INTERVIEWER READ OUT: If you have more than one wage job, tell us about your main job now. We will ask about your second (or next most important) wage job after this. If you have more than two jobs, then tell us about the rest when we ask about casual work.
E2 When did you start this job? Interviewer: Write month in two figures, e.g. 08 for August and year in four figures, e.g. 2001 Write 99 if month unknown and/or 9999 if year unknown
month year
E3 How did you find out about this job?
Saw an advert in a newspaper or on the internet 01 Saw an advert on a notice board in a community centre/shopping centre, shop etc. 02 A household member told me about the job 03 A friend/relative (in a different household) told me about the job 04 I went to a factory and waited for a job 05 I knocked on factory gates and visited private homes and shops until I got the job 06 Through an employment agency 07 I asked someone who had employed me before about a job 08 I waited on the side of the road 09 Other (specify) 10
E4 What kind of work do you usually do in this job? In other words, what is your occupation or job title? Interviewer: Record at least two words: car sales person, office cleaner, vegetable farmer, primary school teacher, etc.
E5 What are your main tasks or duties in this work? For example some people sell fruit or repair machines or keep accounts or deliver things or look after cattle.
E6 What is the name of your place of work? For example, it might be Pick ‘n’ Pay or a government department or a bank or your own home? Interviewer: For government or large organisations, give the name of the establishment and branch or division: e.g. Education Dept – Rapele Primary School; ABC Gold Mining - Maintenance Div. Write “Own house” or “No fixed location”, if relevant. For domestic workers write “private household”.
E7 What are the main goods and services produced at your place of work or what are its main functions? Examples could be making electrical appliances or repairing cars or selling houses or primary education? Interviewer: For domestic workers write “private household”.
E8 How much did you earn last month at your main job before any deductions for tax, medical aid or pension? Amount R
Refused -8
Don’t know -9 E9
How much was your take-home pay? Amount → SKIP TO E11 R
Refused -8
Don’t know -9 E10 Please would you look at the show card and point out the most
accurate earnings category for last month’s take home pay? Interviewer: Show the income categories on the show card and record the appropriate code for the respondent’s monthly earnings
Income category code
Refused 88
Don’t know 99
E11 How many hours do you work at this job in a typical week? Hours

6
E12 Yes No
Amount in last month
Amount in last 12 months
Refused Don’t Know
E12.1.1
Did you get a 13th cheque or an annual bonus in the last 12 months?
1 2
→ SKIP TO NEXT
E12.1.2 R -8 -9
E12.2.1
Did you get a share of profits in the last 12 months? 1
2 → SKIP TO
NEXT E12.2.2 R -8 -9
E12.3.1
Did you get any other bonus payments in the last 12 months?
1 2
→ SKIP TO NEXT
E12.3.2 R -8 -9
E12.4.1
Did you get extra money on a piece rate basis in the last month?
1 2
→ SKIP TO NEXT
E12.4.2 R -8 -9
E12.5 Is anything deducted from your salary for medical aid? 1 2
E12.6 Is anything deducted from your salary for pension/ provident fund contributions?
1 2
E12.7 Is anything deducted from your salary for UIF? 1 2
E13.1 Are you employed on the basis of a written contract or a verbal agreement?
A written contract 1 A verbal agreement 2
E13.2 Is the contract/agreement of a limited duration or unspecified duration or is it permanent?
Limited duration 1 Unspecified duration 2 Permanent 3
E14 Do you belong to a trade union? Yes 1 No 2
E15 How much did you spend last month on transport to and from this job?
Amount R Don’t Know -9
E16
Were you unemployed and wanting a job before you got your current job?
Yes 1
No → SKIP TO E18 2 E17 If yes, for how long were you unemployed before starting your
current job?
years OR monthsE18
INTERVIEWER READ OUT: We are now going to ask you questions about your second (or next) most important wage job. If you have more than two jobs, then tell us about the rest when we talk about casual work. Do you currently have a second job where you are paid a wage or salary to work for an employer on a regular basis?
Yes 1
No → SKIP TO E28 2 E19 When did you start this job?
Interviewer: Write month in two figures, e.g. 08 for August and year in four figures, e.g. 2001 Write 99 if month unknown and/or 9999 if year unknown
month year
E20 What kind of work do you usually do in this job? In other words, what is your occupation or job title? Interviewer: Record at least two words: car sales person, office cleaner, vegetable farmer, primary school teacher, etc.
E21 What are your main tasks or duties in this work? For example some people sell fruit or, repair machines or keep accounts or deliver things or look after cattle.
E22 What is the name of your place of work? For example, it might be Pick ‘n’ Pay or a government department or a bank or your own home? Interviewer: For government or large organisations, give the name of the establishment and branch or division: e.g. Education Dept – Rapele Primary School; ABC Gold Mining; Maintenance Div. Write “Own house” or “No fixed location”, if relevant For domestic workers write “private household”
E23 What are the main goods and services produced at your place of work or what are its main functions? Examples could be making electrical appliances or repairing cars or selling houses or primary education? Interviewer: For domestic workers write “private household”

7
E24 How much did you earn last month at this job before any deductions for tax, medical aid or pension?
Amount R Refused -8 Don’t know -9
E25
How much was your take-home pay from this job? Amount → SKIP TO E27 R Refused -8 Don’t know -9
E26 Please would you look at the show card and point out the most accurate earnings category for last month’s take home pay from this job? Interviewer: Show the income categories on the show card and record the appropriate code for the respondent’s monthly earnings
Income category code
Refused 88
Don’t know 99
E27 How many hours do you work at this job in a typical week? Hours E28
INTERVIEWER READ OUT: We now want to ask you some questions about self-employment – that is if you work for yourself, even if this is in partnership with other people. The questions are for all people, even if you have a main job or are in full-time education, and therefore can only do this kind of work on the side. Have you engaged in any self-employment activities during the last 30 days? For example, you might buy and sell goods, be a commercial farmer, work for yourself as a doctor or hairdresser or be a freelance consultant.
Yes 1
No → SKIP TO E40 2
E29 Describe your main self-employment activity Interviewer: Record at least two words
E30
Do you do any other self-employment activities? Yes 1
No → SKIP TO E32 2 E31 Please describe your other self-employment activities
Interviewer: Record at least two words for each activity
E32 For how many months out of the last twelve were you engaged in any self-employment activities? Months
E33
In the last month, how much money did you keep for yourself after paying expenses out of all of your businesses?
Amount→ SKIP TO E35 R Refused -8 Don’t know -9
E34 Please would you look at the show card and point out the most accurate earnings category for the amount you kept for yourself last month? Interviewer: Show the income categories on the show card and record the appropriate code for the respondent’s monthly earnings
Income category
Refused 88
Don’t know 99
E35
In the last 12 months, how much money did you keep for yourself after paying expenses out of all your businesses?
Amount R Refused -8 Don’t know -9
E36 How many hours do you spend doing all these self-employment activities in a typical week? Hours
E37 Is the business registered for income tax and/or VAT? Yes 1 No 2
E38
Do you have any tools or machinery that you use in these activities?
Yes 1
No→ SKIP TO E40 2 E39 Approximately how much would it cost you to replace these
tools and machines if you had to buy them today? Amount R
E40
INTERVIEWER READ OUT: This section covers casual work, that is work that is irregular and short-term, or any work that you do in addition to any work that you told us about earlier. These questions are for all people - even if you have a main job or are self-employed or are in full-time education and therefore can only do casual work on the side. Have you done any casual work to earn money in the past 30 days?
Yes 1
No → SKIP TO E45 2
E41 What was your main form of casual work during the past 30 days? For example, was it construction work, waitressing, gardening, or paid domestic work?
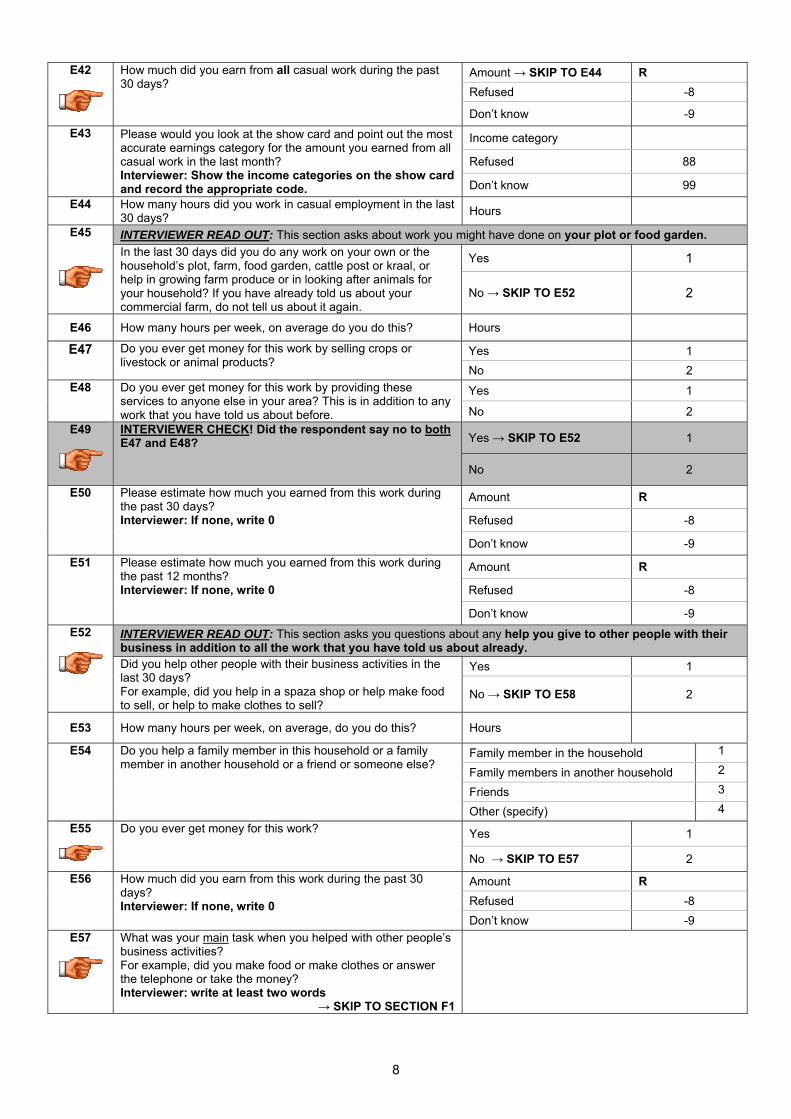
8
E42
How much did you earn from all casual work during the past 30 days?
Amount → SKIP TO E44 R Refused -8
Don’t know -9 E43 Please would you look at the show card and point out the most
accurate earnings category for the amount you earned from all casual work in the last month? Interviewer: Show the income categories on the show card and record the appropriate code.
Income category
Refused 88
Don’t know 99 E44 How many hours did you work in casual employment in the last
30 days? Hours
E45
INTERVIEWER READ OUT: This section asks about work you might have done on your plot or food garden. In the last 30 days did you do any work on your own or the household’s plot, farm, food garden, cattle post or kraal, or help in growing farm produce or in looking after animals for your household? If you have already told us about your commercial farm, do not tell us about it again.
Yes 1
No → SKIP TO E52 2
E46 How many hours per week, on average do you do this? Hours
E47 Do you ever get money for this work by selling crops or livestock or animal products?
Yes 1 No 2
E48 Do you ever get money for this work by providing these services to anyone else in your area? This is in addition to any work that you have told us about before.
Yes 1
No 2 E49
INTERVIEWER CHECK! Did the respondent say no to bothE47 and E48? Yes → SKIP TO E52 1
No 2
E50 Please estimate how much you earned from this work during the past 30 days? Interviewer: If none, write 0
Amount R
Refused -8
Don’t know -9 E51 Please estimate how much you earned from this work during
the past 12 months? Interviewer: If none, write 0
Amount R
Refused -8
Don’t know -9 E52
INTERVIEWER READ OUT: This section asks you questions about any help you give to other people with their business in addition to all the work that you have told us about already. Did you help other people with their business activities in the last 30 days? For example, did you help in a spaza shop or help make food to sell, or help to make clothes to sell?
Yes 1
No → SKIP TO E58 2
E53 How many hours per week, on average, do you do this? Hours
E54 Do you help a family member in this household or a family member in another household or a friend or someone else?
Family member in the household 1
Family members in another household 2
Friends 3
Other (specify) 4 E55
Do you ever get money for this work?
Yes 1
No → SKIP TO E57 2 E56 How much did you earn from this work during the past 30
days? Interviewer: If none, write 0
Amount R Refused -8 Don’t know -9
E57
What was your main task when you helped with other people’s business activities? For example, did you make food or make clothes or answer the telephone or take the money? Interviewer: write at least two words
→ SKIP TO SECTION F1

9
Interviewer: Check that the respondent does not have any employment by answering the following questions for yourself.
E58
INTERVIEWER CHECK! Does this respondent have regular employment, i.e. Question E1 = Yes?
Yes → SKIP TO SECTION F1 1
No 2
E59
INTERVIEWER CHECK! Is this respondent self-employed, i.e. Question E28 = Yes?
Yes → SKIP TO SECTION F1 1
No 2
E60
INTERVIEWER CHECK! Does this respondent have a casual job, i.e. Question E40 = Yes?
Yes → SKIP TO SECTION F1 1
No 2
E61
INTERVIEWER CHECK! Does this respondent work on their plot or food garden, i.e. Question E45 = Yes?
Yes → SKIP TO SECTION F1 1
No 2
INTERVIEWER READ OUT: You have just told us that you are not doing any form of work at the moment. E62 Have you ever worked for pay or profit or
helped unpaid in a household business? Yes 1 No → SKIP TO E66 2
E63
How long ago was it since you last worked? Less than 3 months 1 3 months – less than 6 months 2 6 months – less than 9 months 3 9 months – less than 1 year 4 1 year – less than 3 years 5 3 years – less than 5 years → SKIP TO E66 6 More than 5 years → SKIP TO E66 7 Don’t know 9
E64 What kind of work did you usually do in this job? In other words, what was your occupation or job title? Interviewer: Record at least two words: car sales person, office cleaner, vegetable farmer, primary school teacher, etc.
E65 What was the main reason you stopped working in your last job/business?
Health reasons 01 Caring for own children/relatives 02 Pregnancy 03 Other family/ community responsibilities 04 Going to school 05 Lost job/ job ended/ laid off/ business sold/ closed down 06 Changed residence 07 Dissatisfied with the job 09 Retired 10 Other (specify) 11
E66
In the last 4 weeks, would you have liked to work for pay, profit or family gain? Yes 1
No → SKIP TO E76 2
E67 How long have you been wanting work and been without any paid employment? Interviewer: state number of years OR number of months
Years OR Months
E68
Did you turn down any job offers during this time period? Yes 1
No → SKIP TO E70 2
E69 What was the main reason you chose not to accept this job offer? Interviewer: One mention only
The job was too far away 1
The wage offered was too low 2
The cost of travel would have been too high 3
The job was below my educational/skill level 4
I did not like the job 5
Family commitments prevented me from accepting 6
I wanted to further my studies 7
Other (specify) 8

10
E70 INTERVIEWER READ OUT: We now want to ask you how long you think it will be before you get a job. Yes No Don’t Know
E70.1
Do you think there is a realistic possibility that you will get a job in the next month? 1
→ SKIP TO E71 2 9
E70.2
Do you think there is a realistic possibility that you will get a job in the next 6 months? 1
→ SKIP TO E71 2 9
E70.3
Do you think there is a realistic possibility that you will get a job in the next year? 1
→ SKIP TO E71 2 9
E70.4
Do you think there is a realistic possibility that you will get a job in the next 2 years? 1 2 9
E71
In the last four weeks, what are all the things that have you done to search for work or to start a business? Interviewer: Multiple mentions allowed
Registered at an employment agency 01 Enquired at workplaces, farms, factories, or called on other possible employers 02
Placed advertisement (s) 03 Answered advertisements 04 Searched through job advertisement (s) on the internet 05 Sought assistance from relatives or friends 06 Looked for land, building, equipment or applied for permit to start own business or farming 07
Waited at the side of the road 08 Sought financial assistance to start a business 09 Other (specify) 10 Nothing → SKIP TO E74 11
E72
How much did you spend on travel costs associated with looking for work last week? Interviewer: If none, write 0 and
→ SKIP TO E74 Amount R
E73 Where did the money for travel come from? A family member in the household 1 A family member outside the household 2 A friend in the household 3 A friend outside the household 4 A money lender 5 My savings 6 Other (savings) 7
E74 If a suitable job had been offered to you, would you have been able to start work in the last four weeks?
Yes 1
No → SKIP TO E76 2 E75
If you were to find a job, what do you think would be a reasonable take-home monthly wage for you, given your age, education and skills?
Amount (per month) → SKIP TO SECTION F1 R
E76
INTERVIEWER READ OUT: You have just told us that you are not working at the moment and not looking for work. What is the main reason you were not available to work in the last four weeks? Interviewer: One mention only.
I am too old → SKIP TO SECTION F1 01 I am a full-time student/learner → SKIP TO SECTION F1 02 I am sick/disabled → SKIP TO SECTION F1 03 I do not like the available jobs and would rather not work 04 I do not like working 05 I do domestic duties and look after children and or elderly/disabled family members 06
I look after children 07 It costs too much to look for work 08 The wages are too low, it is not worth my time working 09 I spend my time cooking and cleaning, shopping etc. 10 Other (specify) 11

11
E77
Have you ever looked for a job? Yes 1
No → SKIP TO SECTION F1 2
E78 If yes, in which year did you last look? Year
E79 What was the main reason you stopped looking? Interviewer: One mention only.
I became discouraged (I did not think I would ever find a job / Job search was pointless / There are no jobs to be had / It was a waste of time)
01
I got pregnant/ had a child 02 I had family responsibilities that prevented me from looking for a job 03
I got married 04 I could not afford the costs of looking for work 05 I decided to go back to school/study further 06 I became disabled 07 I decided I was too old to work anymore 08 The wages were too low 09 I chose not to look for work 10 Other (specify) 11
Section F1: Individual income from non-employment sources
INTERVIEWER READ OUT: In this section we are going to talk about any money or any form of assistance that you may have received which does not involve employment of some kind. As I read a list of the different ways in which people can receive money or assistance, I'd like you to indicate whether you did, in fact, receive such income or assistance or not in the last month. 1.
Did you receive income or assistance from [ .. ] in the last month ?
Interviewer: If no, → SKIP TO NEXT
2. How much did you receive last month?
Yes No Rand
F1.1 State (South African Government) old age pension 1 2
F1.2 Private pension or foreign pension 1 2
F1.3 Private retirement annuity 1 2
F1.4 Retirement gratuity or retirement package 1 2
F1.5 Unemployment insurance (UIF) 1 2
F1.6 Workmen’s compensation 1 2
F1.7 Disability grant 1 2
F1.8 Child support grant 1 2
F1.9 Foster care grant 1 2
F1.10 Care dependency grant 1 2
F1.11 Interest earnings including dividends, interest from savings, loans 1 2
F1.12 Inheritances 1 2
F1.13 War veterans pension 1 2
F1.14 Rental income 1 2
F1.15 Retrenchment package 1 2
F1.16 Lobola or bride wealth payments 1 2
F1.17 Gifts 1 2
F1.18 Repayments of loans to you 1 2
F1.19 Sale of household goods (e.g. car, television, refrigerator) 1 2
F1.20 Other (specify) 1 2

12
Section F2: Contributions received F2.1
In the last 12 months, did you receive money, food or any other kind of contribution from people who do not usually sleep under this roof for four nights a week? If you receive maintenance for you or your child, please include it here. Yes 1
No→ SKIP TO SECTION F3 2
F2.2
Please name each person who has sent money, food,
or any other kind of contribution to you in the last
12 months.
Interviewer: Complete column F2.2 before
continuing with the rest of the table
F2.3 Contributor’s
Person Code
Interviewer: write 77 if not listed on roster
F2.4 In which
province or other country is [.. ] now?
Interviewer: See code sheet for Province
codes
F2.5 What is the contributor’s
relationship to you?
This person is
your [...]?
Interviewer: See code sheet for Relationship
codes
F2.6 In the past 12 months, how
many times did [...] send you
money?
Interviewer: If none, write 0 and → SKIP
TO F2.9
F2.7 In the
past 12 months
how much money in total did [..] send to you?
Rand
F2.8 In the past
30 days how much money in
total did [..] send to you?
Rand
F2.9 In the past 12 months, how many times
did [...] make a contribution in kind to you?
Interviewer: If none, write 0 and → SKIP
TO NEXT
F2.10 In the past 12 months, what was the total
monetary value of
[..]’s in kind contribution
s to you
Rand
F2.11 In the past 30 days,
what was the total
monetary value of [..]’s
in kind contributions
to you
Rand
F2.12 What
types of items were
received?
Item Code
(see box below)
1
2
3
4
5
6
7
8
9
10
Item code for F2.12
1 - Clothing for adults 6 - Linen 2 - Clothing for children 7 - Building materials 3 - Groceries 8 - Livestock 4 - Airtime 9 - Other 5 - Furniture or appliances

13
Section F3: Contributions given F3.1
In the last 12 months, did you send money, food or any other kind of contribution to other people, who do not usually sleep under this roof four nights a week? If you send maintenance or child support payments, please include it here.
Yes 1
No→ SKIP TO SECTION G 2
F3.2
Please name each person who receives money, food, or any other kind of contribution
from you.
Interviewer: Complete column F3.2 before
continuing with the rest of the table
F3.3 Receiver’s
Person code
Interviewer: write 77 if not listed on roster
F3.4 In which
province or other country is [.. ] now?
Interviewer: See code sheet for Province
codes
F3.5 What is the receiver’s
relationship to you?
This person is
your [...]?
Interviewer: See code sheet for Relationship
codes
F3.6 In the last 12 months, how many times
did you send money to
[...]?
Interviewer: If none, write
0 and → SKIP TO F3.9
F3.7 In the past 12 months how much money in total did
you send to [..]?
Rand
F3.8 In the past
30 days how much money in total did
you send to [..]?
Rand
F3.9 In the last 12 months how many times
did you make a contribution
in kind to [...]?
Interviewer: If none, write 0 and → SKIP
TO NEXT
F3.10 In the past 12 months, what was the total
monetary value of
your in kind contribution
s to [..]?
Rand
F3.11 In the past
30 days what was the
total monetary
value of your in kind
contributions to [..]?
Rand
F3.12 What
types of items were sent?
Item Code
(see box below)
1
2
3
4
5
6
7
8
9
10
Item code for F3.12
1 - Clothing for adults 6 - Linen 2 - Clothing for children 7 - Building materials 3 - Groceries 8 - Livestock 4 - Airtime 9 - Other 5 - Furniture or appliances

14
Section G: Personal ownership and debt INTERVIEWER READ OUT: Now we would like to ask you about certain items that you may or may not own. 1
Do you personally own at least one [...] in good
working order?
Interviewer: If no, → SKIP
TO NEXT
Yes No
2 What is the current total resale value for
all [...]?
Interviewer: If don’t know, write -9
Rands
G1 Radio 1 2
G2 Hi-Fi Stereo, CD player, MP3 player 1 2
G3 Sewing/knitting machine 1 2
G4 Motor vehicle (Private) in running condition 1 2
G5 Motor vehicle (Commercial) in running condition 1 2
G6 Motorcycle/scooter 1 2
G7 Bicycle 1 2
G8 Computer 1 2
G9 Camera 1 2
G10 Cell phone 1 2
INTERVIEWER READ OUT: Now we would like to ask about certain financial assets or debt you may have. 1
Do you personally have a [...]?
Interviewer: If no, →
SKIP TO NEXT
Yes No
2 What was the value of your payment on your
[...] last month?
Interviewer: If don’t know, write -9 If none, write 0
Rands
3 What is the remaining outstanding balance
on your [...]?
Interviewer: If don’t know, write -9 If none, write 0
Rands
G11 Home loan / Bond 1 2
G12 Personal loan from a bank 1 2
G13 Personal loan from a micro-lender 1 2
G14 Loan with a Mashonisa 1 2
G15 Study loan with a bank 1 2
G16 Study loan with an institution other than a bank 1 2
G17 Vehicle finance (car payment) 1 2
G18 Credit card 1 2
G19 Store card (For example, Edgars, Foschini or Woolworths store card) 1 2
G20 Hire purchase agreement 1 2
G21 Loan from a family member or friend 1 2
G22 Bank account 1 2
G23 Pension or retirement annuity 1 2
G24 Unit trusts, stocks and shares 1 2

15
Section H: Education INTERVIEWER READ OUT: We would like to ask you about your education.
H1
What is the highest grade in school that you have successfully completed? Do not count the final year you were in school if you did not successfully complete the year. Interviewer: See code sheet for Education Codes Codes 16 to 24 are not applicable
Highest school grade →If 25, SKIP TO H34
If other, specify here
H2 In what year did you successfully complete this grade? If you do not know the year, how old were you when you successfully completed this grade?
H2.1 Year
H2.2 Age
Don’t know -9 H3 Name of school or educational institution where you completed this
grade?
H4 What is the location of this educational institution? Interviewer: Please get street address, neighbourhood (Such as Rondebosch, Hanover Park or Athlone) or any other identifying information and name of nearest town or city (such as Worcester, Durban or Umtata)
H5 In what year did you first attend Grade 1/Sub A? Interviewer: Write 9999 if don’t know Year
H6 What is the highest grade or level at school in which you studied mathematics? This refers to highest grade studied and not necessarily highest grade passed. Incomplete years should also be included. Interviewer: See code sheet for Education Codes Codes 16 to 24 are not applicable
Highest grade Mathematics
H7
Have you successfully completed any diplomas, certificates or degrees outside of school?
Yes 1 No→ SKIP TO H10 2
Don’t know → SKIP TO H10 9 H8 If yes, what is the highest level of education you have successfully
completed? Do not include any courses that you did not successfully complete. Interviewer: See code sheet for Education Codes. Codes 00 to 15 and 25 are not applicable.
Higher education
If other, specify here
H9 At what institution did you successfully complete the diploma, certificate or degree?
H10
INTERVIEWER CHECK! Is this respondent aged between 15 and 30? Yes 1
No→ SKIP TO H34 2
H11
Were there any grades at school that you repeated? Yes 1 No → SKIP TO H13 2 Refused → SKIP TO H13 8 Don’t know → SKIP TO H13 9
H12 What grade(s) did you repeat and how many times did you repeat that grade?
Grade Times Repeated
Grade Times Repeated
Grade Times Repeated
Grade Times Repeated H13
Did you attend any school or classes or correspondence courses of any kind at any time in 2007? Include university, technical colleges or any courses as well as school.
Yes → SKIP TO H15 1 No 2 Refused 8 Don’t know 9

16
H14
What was the main reason you were never enrolled in school or attending classes during 2007? → SKIP TO H24
Had finished schooling/education 01 I was working 02 Could not afford to stay at school 03 Wanted to look for a job 04 Was pregnant/had a baby 05 Was needed at home 06 Was ill/sick 07 I got married 08 Grades were very poor/ was not allowed to continue 09 Was suspended/expelled 10 Other (specify) 11 Don’t know 99
H15 What level were you enrolled in during 2007? Interviewer: See code sheet for Education Codes
2007 enrolment
If other, specify here H16
INTERVIEWER CHECK! Is H15 less than 16? Yes → SKIP TO H18 1
No 2
H17 What subject or programme were you studying in 2007?
Arts / humanities 01 Science 02 Social science 03 Law 04 Theology 05 Commerce / management 06 Education 07 Medical services (incl. dentistry) 08 Engineering 09 Administration / clerical 10 Protection 11 Building sciences 12 Technical 13 Computing 14 Veterinary 15 Tourism 16 Beauty / hair / cosmetology 17 Other (specify) 18 Don’t know 99
H18 Name of school or educational institution attended for most of 2007?
H19 What is the location of this educational institution? Interviewer: Please get street address, neighbourhood (such as Rondebosch, Sandton, Langa or Soweto) or other identifying information of the nearest town or city (such as Worcester, Durban, Umtata, or Cofimvaba).
H20 How much was spent on your [...] in 2007? Interviewer: If don’t know, write ‘-9’
1. School fees R 2. Uniform R 3. Books and Stationery R 4. Transport to school R 5. Allowances and other school related expenses R
H21 Who paid for your educational expenses in 2007? Interviewer: If the person is not a household member, Pcode = 77 See code sheet for Relationship Codes Multiple responses allowed
Relationship code Pcode Person #1 Person #2 Person #3 Self 00 NGO 60 Bursary/Scholarship 70 Refused 88 Don’t know 99

17
H22
What was the result of your schooling in 2007?
Withdrew from school before completing the year 1 Failed the grade or programme → SKIP TO H24 2 Passed the grade or programme → SKIP TO H24 3 Continuing in programme, no grade given → SKIP TO H24 4 Don’t know → SKIP TO H24 9
H23 What is the main reason that you withdrew before completing the educational year? Interviewer: Only one answer allowed
Could not afford to stay at school 01 Wanted to look for a job 02 Was pregnant/had a baby 03 Was needed at home 04 Was ill/sick 05 I got married 06 I got a job/work 07 Grades were very poor/Was not allowed to continue 08 Suspended/expelled 09 Other (specify) 10
Don’t know 99 H24
Are you currently enrolled? Yes → SKIP TO H26 1
No 2
H25
What was the main reason you did not enrol in school or attend classes in 2008? → SKIP TO H34
Finished school / education 01 I was working 02 Could not afford to stay at school 03 Wanted to look for a job 04 Was pregnant/had a baby 05 Was needed at home 06 Was ill/sick 07 I got married 08 Grades were very poor/ was not allowed to continue 09 Was suspended/expelled 10 Other (specify) 11 Don’t know 99
H26
Name of school or educational institution you currently attend? Interviewer: If the same as 2007, write 7777 and → SKIP TO H28
H27 What is the location of this educational institution? Interviewer: Please get street address, neighbourhood (such as Rondebosch, Hanover Park, or Athlone) or other identifying information and name of the nearest town or city (such as Worcester, Durban, Umtata, or Cofimvaba).
H28 What level are you currently enrolled in? Interviewer: See code sheet for Education Codes
Current enrolment
If other, specify here
H29
INTERVIEWER CHECK! IS H28 less than 16? Yes → SKIP TO H32 1
No 2

18
H30 What subject or programme are you studying?
Arts / humanities 01 Science 02 Social science 03 Law 04 Theology 05 Commerce / management 06 Education 07 Medical services (incl. dentistry) 08 Engineering 09 Administration / clerical 10 Protection 11 Building sciences 12 Technical 13 Computing 14 Veterinary 15 Tourism 16 Beauty / hair / cosmetology 17 Other (specify) 18 Don’t know 99
H31
Does this institution require you to have a matric? If yes, does it require you to have matric exemption?
→ SKIP TO H34
Yes, with matric exemption 1 Yes, but no exemption required 2 No 3 Refused 8 Don’t know 9
H32 Taking everything into account, do you intend to continue at school until you have successfully completed matric?
Yes 1 No 2 Don’t know 9
H33 Taking everything into account, do you intend to continue studying after matric, that is, after leaving school?
Yes 1 No 2 Don’t know 9
H34 Are you computer literate? Interviewer: read out options
Yes highly literate 1 Yes basic use 2 No 3 Refused 8 Don’t know 9
H35 Do you have a driver’s licence? Yes 1 No 2 Refused 8 Don’t know 9
H36 How well can you read in your home language?
Very well 1 Fair 2 Not well 3 Not at all 4 Refused 8
H37 How well can you write in your home language?
Very well 1 Fair 2 Not well 3 Not at all 4 Refused 8
H38 How well can you read in English? Very well 1 Fair 2 Not well 3 Not at all 4 Refused 8
H39 How well can you write in English? Very well 1 Fair 2 Not well 3 Not at all 4 Refused 8
PLEASE NOTE THERE IS NO SECTION I.

19
Section J: Health INTERVIEWER READ OUT: We would like to ask you some questions about your health.
J1 How would you describe your health at present? Would you say it is excellent, very good, good, fair, or poor?
Excellent 1 Very good 2 Good 3 Fair 4 Poor 5 Don’t know 9
INTERVIEWER READ OUT: Now I would like to ask you about some health conditions that people sometimes complain about..
J2 In the last 30 days, have you experienced [...]? Yes No 1. Flu symptoms 1 2 2. Fever 1 2 3. Persistent cough 1 2 4. Cough with blood 1 2 5. Tight chest 1 2 6. Chest pain 1 2 7. Body ache 1 2 8. Headache 1 2 9. Back ache 1 2 10. Joint pain / Arthritis 1 2 11. Vomiting 1 2 12. Diarrhoea 1 2 13. Felt weak 1 2 14. Pain in upper abdomen 1 2 15. Pain in lower abdomen 1 2 16. Painful urination 1 2 17. Swelling ankles 1 2 18. Rash 1 2 19. Skin disorders 1 2 20. Conjunctivitis or eye infection 1 2 21. Severe weight loss 1 2 22. Yellow eyes 1 2 23. Memory loss 1 2 24. Serious injury (as the result of an accident or act of violence)? 1 2
J3
When did you last consult someone about your health?
In the last 30 days 1 One to five months ago 2 Six to twelve months ago 3 More than one and less two years ago → SKIP TO J13 4 Two to four years ago → SKIP TO J13 5 Five to ten years ago → SKIP TO J13 6 More than ten years ago → SKIP TO J13 7 Never → SKIP TO J13 8 Don’t know → SKIP TO J13 9
J4
Where did this consultation take place? Interviewer: Read out options. One answer only.
Public hospital 1 Private hospital 2 Public health clinic 3 Private clinic 4 Private doctor → SKIP TO J7 5 Nurse or chemist → SKIP TO J7 6 Traditional healer → SKIP TO J7 7 Do not remember 8
J5 Name of hospital/clinic that you consulted?

20
J6 What is the location of this hospital/clinic? Interviewer: Please get street address, neighbourhood (Such as Rondebosch, Hanover Park or Athlone) or any other identifying information or name of nearest town or city (such as Worcester, Umtata or Cofimvaba)
J7
Was there a consultation fee for the visit? Yes 1
No → SKIP TO J10 2
J8 What was the fee for the consultation? Amount R
J9 Who paid for it? Shared household money 1 Respondent 2 Other household member 3 Money from outside household 4 Employer 5 Medical aid 6 Other (Specify) 7
J10
Was medicine prescribed? Yes 1
No → SKIP TO J13 2
J11 If yes, how much was spent on medicine? Interviewer: If nothing was spent, write 0 Amount R
J12 Who paid for the medicine? Medicine is free 1 Shared household money 2 Respondent 3 Other household member 4 Money from outside household 5 Employer 6 Medical Aid 7 Don’t know 9
INTERVIEWER READ OUT: Now we would like to ask you about some particular health conditions.
J13 Have you ever been told by a doctor, nurse or health care professional that you have [...] (If No move to the next condition)
J14 In which year were you diagnosed with this condition?
J15 Are you currently taking medication for this condition? (If Yes, move to the next condition)
J16 Do you still have this condition?
Yes No Yes No Yes No 1. Tuberculosis / TB 1 2 1 2 1 2 2. High blood pressure 1 2 1 2 1 2 3. Diabetes or high blood sugar 1 2 1 2 1 2 4. Stroke 1 2 1 2 1 2 5. Asthma 1 2 1 2 1 2 6. Heart Problems 1 2
7. Cancer 1 2
J17
Do you have any other major illnesses or disability not mentioned above?
Yes 1 No → SKIP TO J19 2 Refused → SKIP TO J19 8 Don’t know → SKIP TO J19 9
J18 If yes, what are they? Interviewer: Do not read out Multiple mentions allowed
Physically handicapped 01 Problems with sight, hearing or speech 02 Psychological or psychiatric disorder 03 HIV/AIDS 04 Epilepsy/ fits 05 Emphysema 06 Alzheimer’s disease 07 Other (Specify) 08 Refused 88

21
J19 Do you use spectacles, glasses, or contact lenses,
including for reading? Yes 1 No 2
J20 When was your vision last tested? Year
Never 7777 Can’t remember 5555
J21 How is your vision? If you wear glasses, how is your vision with your glasses?
Excellent 1 Very good 2 Good 3 Fair 4 Poor 5 Blind 6 Don’t know 9
J22 Do you use a hearing aid? Yes 1 No 2 Don’t know 3
J23 How is your hearing? If you use a hearing aid how is your hearing with the hearing aid?
Excellent 1 Very good 2 Good 3 Fair 4 Poor 5 Deaf 6 Don’t know 9
INTERVIEWER READ OUT: Now we would like to know what level of difficulty you have in carrying out the following activities by yourself. I am going to read out a list of activities. Using the show card, please indicate the level of difficulty you have with each activity. Interviewer: Circle one number on each line
J24 No difficulty
Difficult, but can do with no help
Can do, only with help
Can’t do
Able to, but never do
Don’t know
J24.1 Dressing 1 2 3 4 5 9 J24.2 Bathing 1 2 3 4 5 9 J24.3 Eating 1 2 3 4 5 9 J24.4 Toiletting 1 2 3 4 5 9 J24.5 Taking a bus, taxi or train by yourself 1 2 3 4 5 9 J24.6 Doing light work in or around the house (if you had to) 1 2 3 4 5 9 J24.7 Managing money (if you had to) 1 2 3 4 5 9 J24.8 Climbing a flight of stairs (if you had to) 1 2 3 4 5 9 J24.9 Lifting or carrying heavy objects (e.g. a bag weighing 5 kg) 1 2 3 4 5 9 J24.10 Walking 200-300 meters 1 2 3 4 5 9 J24.11 Cooking for yourself (if you had to) 1 2 3 4 5 9
J25 How regularly do you exercise? Interviewer: Read out options. One answer only.
Never 1 Less than once a week 2 Once a week 3 Twice a week 4 Three or more times a week 5
J26
Do you smoke cigarettes? Yes → SKIP TO J29 1
No 2 J27
Did you ever smoke cigarettes regularly? Yes 1
No → SKIP TO J31 2 J28 How old were you when you last smoked cigarettes
regularly? Age
J29 How old were you when you first smoked cigarettes regularly? Age
J30 On average, how many cigarettes per day did you/ do you smoke? Number of cigarettes

22
J31
How often do you drink alcohol? I have never drunk alcohol→ SKIP TO J33 1 I no longer drink alcohol→ SKIP TO J33 2 I drink very rarely 3 Less than once a week 4 On 1 or 2 days a week 5 On 3 or 4 days a week 6 On 5 or 6 days a week 7 Every day 8
J32 On a day that you have an alcoholic drink, how many standard drinks do you usually have? A standard drink is a small glass of wine; a 330 ml can of regular beer, a tot of spirits, or a mixed drink.
13 or more standard drinks 1 9 to 12 standard drinks 2 7 to 8 standard drinks 3 5 to 6 standard drinks 4 3 or 4 standard drinks 5 1 or 2 standard drinks 6
J33
Are you covered by medical aid? Yes 1
No → SKIP TO SECTION K1 2
J34 Which person in the household pays for medical aid for you? Interviewer: If self, write 00. If person not in household, write 77
Pcode
Section K: Emotional health INTERVIEWER READ OUT: We would like to know how your general well-being has been over the past week. I am going to read a list of some of the ways you may have felt or behaved during the last week. Using the showcard, please indicate how often you have felt this way during the past week. Interviewer: Circle one number on each line
During the past week...
Rarely or none of the time
(less than 1 day)
Some or little of the time
(1-2 days)
Occasionally or a moderate
amount of time
(3-4 days)
All of the time
(5-7 days) K1 I was bothered by things that usually don’t bother me 1 2 3 4
K2 I had trouble keeping my mind on what I was doing 1 2 3 4
K3 I felt depressed 1 2 3 4
K4 I felt that everything I did was an effort 1 2 3 4
K5 I felt hopeful about the future 1 2 3 4
K6 I felt fearful 1 2 3 4
K7 My sleep was restless 1 2 3 4
K8 I was happy 1 2 3 4
K9 I felt lonely 1 2 3 4
K10 I could not “get going” 1 2 3 4

23
Section L: Household decision-making INTERVIEWER READ OUT: In this section we want to ask you how decisions are made within your household.
Interviewer: Write the Pcode of the main decision maker
L1
Main decision maker
Pcode
L2
If joint, who is the second
decision maker? Pcode
1 Who makes decisions about day-to-day household expenditures (e.g. groceries)?
2 Who makes decisions about large, unusual purchases such as appliances, vehicles or furniture?
3 Who makes decisions about where your children should go to school? Interviewer: If no school-age children, write 77
4 Who makes decisions about who is allowed to live in the household as part of the household (for example, if a relative or family member does not have a place to stay)?
5 Who makes decisions about where the household should live?
Section M: Well-being and social cohesion INTERVIEWER READ OUT: Next, we want to ask you some questions about your relationship with your neighbours and the social interactions that you have with those around you. M1 Think about the area (village or suburb) in which
you live. How strong is your preference to continue living in this area? Interviewer: Read out options
Strong preference to stay 1 Moderate preference to stay 2 Unsure (no strong preference to stay or leave) 3 Moderate preference to leave 4 Strong preference to leave 5
M2 How would you classify your household in terms of income, compared with other households in your village/suburb? Interviewer: Read out options
Much above average income 1 Above average income 2 Average income 3 Below average income 4 Much below average income 5 Don’t know 9
M3 Please imagine a six step ladder where the poorest people in South Africa stand on the bottom (the first step) and the richest people in South Africa stand on the highest step (the sixth step).
Poorest 1 2 3 4 5
Richest 6
M3.1 On which step was your household when you were 15? 1 2 3 4 5 6 M3.2 On which step are you today? 1 2 3 4 5 6 M3.3 On which step do you expect to be 2 years from now? 1 2 3 4 5 6 M3.4 On which step do you expect to be 5 years from now? 1 2 3 4 5 6 M4 You expect to be on step [...] in 5 years. In terms of today’s Rands,
approximately how much income per month do you expect that your household will have in 5 years?
Amount R
Don’t know -9 M5 Using a scale of 1 to 10 where 1 means “Very
dissatisfied” and 10 means “Very satisfied”, how do you feel about your life as a whole right now?
Satisfaction level Refused 88 Don’t know 99
M6 Are you happier, the same or less happy with life than you were 10 years ago?
Happier 1 The same 2 Less happy 3 Don’t know 9
M7 How important are religious activities in your life? Not important at all 1 Unimportant 2 Important 3 Very important 4

24
M8 What religion are you? No religion 1
Christian 2 Jewish 3 Muslim 4 Hindu 5 African traditional spiritual beliefs 6 Other (specify) 7
M9 Please indicate if you belong to any of the following groups? Interviewer: Read out each option
Yes No 1.Stokvel 1 2 2. Burial Society 1 2 3. Community Garden group 1 2 4. Farmer’s Association 1 2 5. Sewing group 1 2 6. Sports group 1 2 7. Study group 1 2 8. Singing or music group 1 2 9. Youth Group 1 2 10. Informal trader’s group 1 2 11. Men’s association 1 2 12. Women’s association 1 2 13. School Committee 1 2 14. Water Committee 1 2 15. Development Committee 1 2 16. Tribal Authority 1 2 17. Other (specify) 1 2
M10 Imagine you lost a wallet or purse that contained R200 and it was found by someone who lives close by. Is it very likely, somewhat likely or not likely at all to be returned with the money in it?
Very likely 1 Somewhat likely 2 Not likely at all 3 Refused 8 Don’t know 9
M11 Imagine you lost a wallet or purse that contained R200 and it was found by a complete stranger. Is it very likely, somewhat likely or not likely at all to be returned with the money in it?
Very likely 1 Somewhat likely 2 Not likely at all 3 Refused 8 Don’t know 9

25
Section N: Measurements INTERVIEWER READ OUT: Now we would like to take your height, weight, waist and blood pressure measurements.
N1.1 Respondent’s Height – Measure 1 ___ ___ ___ • ___ centimetres
INTERVIEWER CHECK! Is the height measurement less than 130.0cm?
Yes → Re-do height measure, you may cross out and correct N1.1 if appropriate 1
No 2 N1.2 Respondent’s Height – Measure 2
___ ___ ___ • ___ centimetres
INTERVIEWER CHECK! Is the difference between N1.1 and N1.2 more than 1cm?
Yes 1
No → SKIP TO N2.1 2
N1.3 Respondent’s Height – Measure 3 ___ ___ ___ • ___ centimetres
N2.1 Respondent’s Weight – Measure 1 ___ ___ ___ • ___ kilograms
INTERVIEWER CHECK! Does the scale display a figure of more than 150?
Yes → Reset the scale to kilograms. You may cross out and correct N2.1 1
No 2 N2.2 Respondent’s Weight – Measure 2
___ ___ ___ • ___ kilograms
INTERVIEWER CHECK! Is the difference between N2.1 and N2.2 more than 1 kg?
Yes 1
No → SKIP TO N3.1 2 N2.3 Respondent’s Weight – Measure 3
___ ___ ___ • ___ kilograms
N3.1 Respondent’s Waist – Measure 1 ___ ___ ___ • ___ centimetres
N3.2 Respondent’s Waist – Measure 2 ___ ___ ___ • ___ centimetres
INTERVIEWER CHECK! Is the difference between N3.1 and N3.2 more than 2cm?
Yes 1
No → SKIP TO N4.1 2 N3.3 Respondent’s Waist – Measure 3
___ ___ ___ • ___ centimetres
N4.1 Blood pressure – Reading 1 N4.2 Blood pressure – Reading 2 1. SYSTOLIC ______ ______ ______ 2. DIASTOLIC ______ ______ ______ 3. PULSE ______ ______ ______
1. SYSTOLIC ______ ______ ______ 2. DIASTOLIC ______ ______ ______ 3. PULSE ______ ______ ______
N5 INTERVIEWER CHECK! Have you filled out the health information sheet and given it to the respondent?
Yes 1
No 2
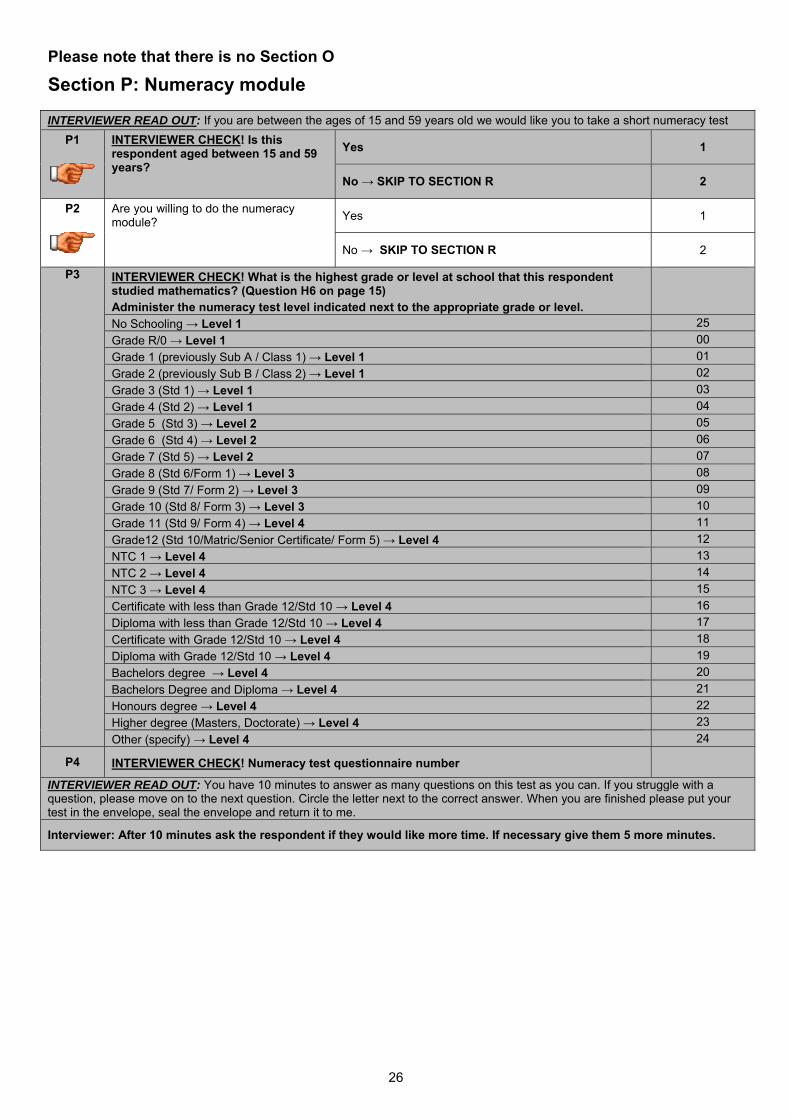
26
Please note that there is no Section O
Section P: Numeracy module INTERVIEWER READ OUT: If you are between the ages of 15 and 59 years old we would like you to take a short numeracy test
P1
INTERVIEWER CHECK! Is this respondent aged between 15 and 59 years?
Yes 1
No → SKIP TO SECTION R 2
P2
Are you willing to do the numeracy module? Yes 1
No → SKIP TO SECTION R 2
P3 INTERVIEWER CHECK! What is the highest grade or level at school that this respondent studied mathematics? (Question H6 on page 15) Administer the numeracy test level indicated next to the appropriate grade or level.
No Schooling → Level 1 25 Grade R/0 → Level 1 00 Grade 1 (previously Sub A / Class 1) → Level 1 01 Grade 2 (previously Sub B / Class 2) → Level 1 02 Grade 3 (Std 1) → Level 1 03 Grade 4 (Std 2) → Level 1 04 Grade 5 (Std 3) → Level 2 05 Grade 6 (Std 4) → Level 2 06 Grade 7 (Std 5) → Level 2 07 Grade 8 (Std 6/Form 1) → Level 3 08 Grade 9 (Std 7/ Form 2) → Level 3 09 Grade 10 (Std 8/ Form 3) → Level 3 10 Grade 11 (Std 9/ Form 4) → Level 4 11 Grade12 (Std 10/Matric/Senior Certificate/ Form 5) → Level 4 12 NTC 1 → Level 4 13 NTC 2 → Level 4 14 NTC 3 → Level 4 15 Certificate with less than Grade 12/Std 10 → Level 4 16 Diploma with less than Grade 12/Std 10 → Level 4 17 Certificate with Grade 12/Std 10 → Level 4 18 Diploma with Grade 12/Std 10 → Level 4 19 Bachelors degree → Level 4 20 Bachelors Degree and Diploma → Level 4 21 Honours degree → Level 4 22 Higher degree (Masters, Doctorate) → Level 4 23 Other (specify) → Level 4 24
P4 INTERVIEWER CHECK! Numeracy test questionnaire number
INTERVIEWER READ OUT: You have 10 minutes to answer as many questions on this test as you can. If you struggle with a question, please move on to the next question. Circle the letter next to the correct answer. When you are finished please put your test in the envelope, seal the envelope and return it to me.
Interviewer: After 10 minutes ask the respondent if they would like more time. If necessary give them 5 more minutes.

27
Section R: Alternative contact information INTERVIEWER READ OUT: Because the survey is designed to measure change over time we would like to contact you again in two years time. R1
What is the likelihood that you will move during the next two years?
Definitely 1 Possibly → SKIP TO R5 2 Unlikely → SKIP TO R5 3 Definitely not → SKIP TO R5 4
INTERVIEWER READ OUT: If you already know your new address, can you please give it to us?
R2: Street address (or physical description)
R3: Community/Suburb R4: Postal code
INTERVIEWER READ OUT: If we are not able to find you again in 2 years time, are there three people who would know where you are? These people must not be currently living with you. All information you provide is kept confidential. No one outside of the research team will have access to this information, and the information will only be used for research purposes. No identification will be used in printed reports. Contact 1 R5: Title R6: Surname R7: First name
R8: Street address (or physical description)
R9: Community/Suburb R10: Postal code
R11: Phone number R12: Cell phone number
R13: Email address R14: Relationship to respondent
Contact 2 R15: Title R16:Surname R17: First name
R18: Street address (or physical description)
R19: Community/Suburb R20: Postal code
R21: Phone number R22: Cell phone number
R23: Email address R24: Relationship to respondent
Contact 3 R25: Title R26:Surname R27: First name
R28: Street address (or physical description)
R29:Community/Suburb R30:Postal code
R31: Phone number R32: Cell phone number
R33: Email address R34: Relationship to respondent
THANK YOU!
R35 Interview end time __ __:__ __
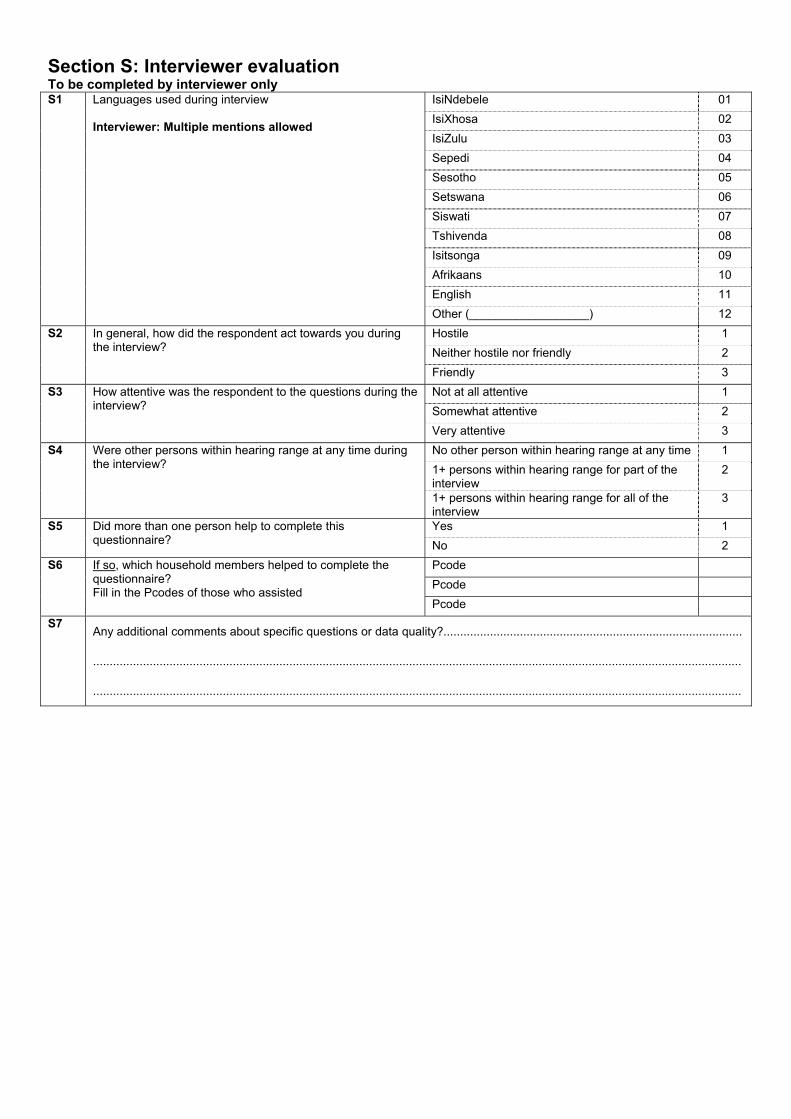
Section S: Interviewer evaluation To be completed by interviewer only S1 Languages used during interview
Interviewer: Multiple mentions allowed
IsiNdebele 01 IsiXhosa 02 IsiZulu 03 Sepedi 04 Sesotho 05 Setswana 06 Siswati 07 Tshivenda 08 Isitsonga 09 Afrikaans 10 English 11 Other (__________________) 12
S2 In general, how did the respondent act towards you during the interview?
Hostile 1 Neither hostile nor friendly 2 Friendly 3
S3 How attentive was the respondent to the questions during the interview?
Not at all attentive 1 Somewhat attentive 2 Very attentive 3
S4 Were other persons within hearing range at any time during the interview?
No other person within hearing range at any time 1 1+ persons within hearing range for part of the interview
2
1+ persons within hearing range for all of the interview
3
S5 Did more than one person help to complete this questionnaire?
Yes 1 No 2
S6 If so, which household members helped to complete the questionnaire? Fill in the Pcodes of those who assisted
Pcode Pcode Pcode
S7 Any additional comments about specific questions or data quality?..........................................................................................
...................................................................................................................................................................................................
...................................................................................................................................................................................................

QUALITY CONTROL RECORD SHEET
PROBLEM CORRECTION CORRECTION CHECKED
Q number
Date Initial Description of problem Date Initial Action taken (See code box)
Date Initial
Quality control actions taken
NN None RV Revisit CB Call back OQ Corrected from other questionnaire OT Other (specify)

National Income Dynamics Study Wave 1: 2008 Household Questionnaire Cover
This questionnaire is to be administered to the oldest woman in the household and/or another household member who is knowledgeable about the living arrangements and spending patterns of the household.
A1 PSU number
A3 Household control sheet number A4 Pcode of main respondent
Respondent details
A5 Name
A6 Surname
A7 Street address
A8 Suburb/community
A9 Town/city
A10 Postal code
A11 Telephone number (home) (___ ___ ___) ___ ___ ___ - ___ ___ ___ ___
A12 Telephone number (work) (___ ___ ___) ___ ___ ___ - ___ ___ ___ ___
A13 Telephone number (cell phone) (___ ___ ___) ___ ___ ___ - ___ ___ ___ ___
A14 Email address
A15 Preferred languages (see code sheet for Language codes)
Interviewer Details
A16 Interviewer name
A17 Date of interview (dd mm/yyyy) __ __/__ __/__ __ __ __
A18 Interview start time __ __:__ __

National Income Dynamics Study
Consent Form: Household Questionnaire This questionnaire is to be administered to the oldest woman in the household and/or another household member who is knowledgeable about the living arrangements and spending patterns of the household. While participation from other household members is encouraged, this consent form should be signed by the main respondent. This is a study about household composition and migration, household income and expenditure, employment and schooling in South Africa. This project is run by researchers at the University of Cape Town on behalf of the South African Presidency. The purpose of this study is to learn more about how people in South Africa are faring over time. As part of this study we will be asking to interview each member of this household. Before we do that, we will be asking you to provide some background information about your household, such as who usually lives here, whether you have access to services such as water and electricity and which assets you own. Before we begin the interview, we want to make sure you understand the following information about the study:
• Your participation is entirely voluntary. You may refuse to take part in the interview, and you may stop at any time if you do not want to continue. You also have the right to skip any particular question or questions if you do not wish to answer them.
• The time it takes to complete the interview will vary depending on how many people live in your household and whether all the sections of the questionnaire are relevant to your household, but the average amount of time for this interview is 40 minutes.
• You have the right to ask questions at any point before the interview, during the interview, or after the interview is completed.
• All information collected for this study will be kept strictly confidential. While the data collected will be used for research purposes, information that could identify you or your household will never be publicly released in any research report or publication.
• The intention of the study is to conduct further interviews with you in the future. As a result, your personal details will be kept on record in order that you can be re-contacted to participate in future studies that form part of this project. However, we will ask your permission to participate in the survey again each time. Agreeing to participate now does not mean you have to participate in future surveys.
By signing below, you signify that you agree to participate in the study and that your participation is entirely voluntary. SIGNATURE DATE Fieldworker and supervisor to countersign below if respondent is not able to sign: _________________________________________ ____________________________________ SIGNATURE: FIELDWORKER SIGNATURE: SUPERVISOR If you have questions about this interview or the NIDS project you can call us at 0800 11 NIDS (6437), fax us on 021-650-5697 or email us at [email protected].
This study has been reviewed and approved by the ethical review committee of the University of Cape Town. Feel free to contact Sharon Apolles, Senate Officer, Bremner Building, email: [email protected], Tel: 021-650-2191 should you have any queries or complaints.
Household Questionnaire Wave 1:2008
Contents Section B: Household roster ........................................................................................................................................... 1
Section C: Mortality history ............................................................................................................................................. 1
Section D: Household living standards ........................................................................................................................... 4
Section E1: Food spending and consumption ................................................................................................................. 9
Section E2: Non-food spending and consumption ......................................................................................................... 11
Section F: Durable goods ............................................................................................................................................. 14
Section G1: Negative events .......................................................................................................................................... 15
Section G2: Positive events ........................................................................................................................................... 15
Section H: Agriculture .................................................................................................................................................. 16
Section J: Interviewer evaluation ................................................................................................................................ 23
For Office use only
Pcode of main respondent Household control sheet number

1
0B0B0BSection B: Household roster UUUINTERVIEWER READ OUT UUU: We would like to start by asking you questions about the people who are part of your household. Interviewer: Read out the membership criteria before proceeding.
B1
B2 Interviewer:
List names of all individuals who meet the 3 membership criteria below.
First list the names of all household members
List household head first
Use first names only Don’t forget babies
Interviewer check! Live-in domestic workers and lodgers are separate households: a separate household questionnaire should be completed for them.
B3 What is [ .. ]’s relationship
to household head?
Interviewer: See code
sheet Relationship
codes
B4Gender
B5Date of Birth
B6 Age in
YEARS
B7 What is the
highest educational qualification attained by
[ .. ]?
Interviewer: See code sheet for
Education codes
B8 What is [ .. ]’s
current marital status?
Interv’r: See code sheet for Marital
status codes
Pcode Name Relationship code
Male = 1 Female = 2
dd/mm/yyyy Years Education code
Marital status code
01. 1 2 _ _ / _ _ / _ _ _ _
02. 1 2 _ _ / _ _ / _ _ _ _
03. 1 2 _ _ / _ _ / _ _ _ _
04. 1 2 _ _ / _ _ / _ _ _ _
05. 1 2 _ _ / _ _ / _ _ _ _
06. 1 2 _ _ / _ _ / _ _ _ _
07. 1 2 _ _ / _ _ / _ _ _ _
08. 1 2 _ _ / _ _ / _ _ _ _
09. 1 2 _ _ / _ _ / _ _ _ _
10. 1 2 _ _ / _ _ / _ _ _ _
11. 1 2 _ _ / _ _ / _ _ _ _
12. 1 2 _ _ / _ _ / _ _ _ _
13. 1 2 _ _ / _ _ / _ _ _ _
14. 1 2 _ _ / _ _ / _ _ _ _
15. 1 2 _ _ / _ _ / _ _ _ _
16. 1 2 _ _ / _ _ / _ _ _ _
17. 1 2 _ _ / _ _ / _ _ _ _
Membership Criteria
You are a household member if: (i) You have lived under this "roof" or within the same compound/homestead/stand at least 15
days during the last 12 months OR you arrived here in the last 15 days and this is now your usual residence and
(ii) when you are together you share food from a common source with other household members and
(iii) you contribute to or share in a common resource pool.

2
B9 Is [ .. ]’s
spouse or partner listed
on this roster? If yes, write
the spouse or partner’s pcode.
Interv’r: If absent, code 77; if deceased,
code 44. If no spouse, write
00
B10 Is [ .. ]’s
biological father listed
on this roster? If yes, write the father's
pcode.
Interv’r: If absent, code 77; if deceased, code 44.
B11 Is [ .. ]’s
biological mother listed
on this roster? If yes, write the mother's
pcode.
Interv’r: If absent, code 77; if deceased code 44.
B12 Does [ .. ]
usually reside here at least 4
nights a week?
Interv’r: If yes, circle
code in column B1
B13 How many months did [ .. ] spend
away from the household in the last 12 months?
Interv’r: If less than 1
month or none, write 0
and go to next person
B14 What was the main reason for his/her absence?
Interv’r: Use code box B14
B15 If still absent,
in which province does [ .. ] stay now?
Interv’r: See code sheet for Province
codes
B16 If still absent,
in what kind of accomm-
odation is [ .. ] staying?
Interviewer: Use code
box B16. If code 1, 2, 5 or 6, circle
code in column B1
Pcode Pcode Pcode Yes No Months Code Province code
Code
1 2
1 2
1 2
1 2
1 2
1 2
1 2
1 2
1 2
1 2
1 2
1 2
1 2
1 2
1 2
1 2
Codes for Question B14 Codes for Question B16
01 = Employment 09 = Living elsewhere 01 = Boarding school 02 = Looking for employment 10 = Prison 02 = Hall of residence 03 = Schooling 11 = Vacation 03 = Old age home 04 = Student 12 = In hospital or clinic 04 = Retirement village 05 = Personal reasons 13 = Away on business 05 = Prison 06 = Escape violence or political problems 15 = Other (specify) 06 = Hospital or clinic 07 = Visiting spouse or family 07 = Private house 08 = Visiting friends 08 = Other (specify)
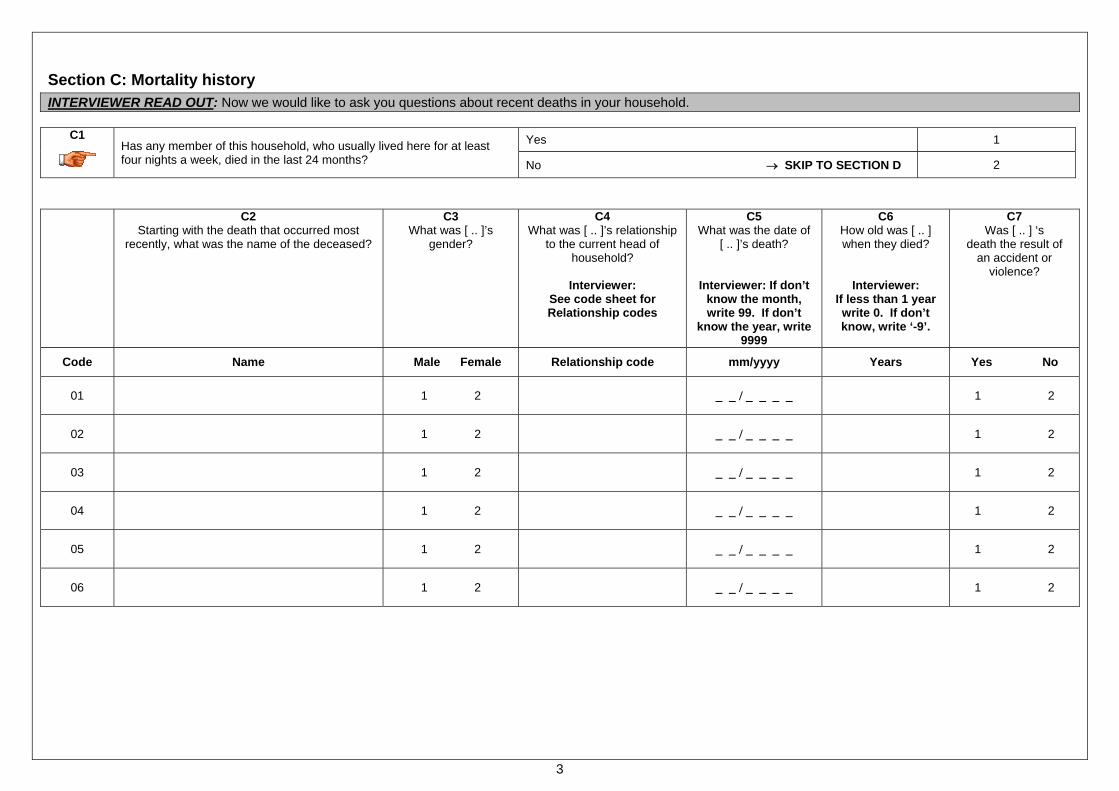
3
Section C: Mortality history INTERVIEWER READ OUT: Now we would like to ask you questions about recent deaths in your household.
C1
Has any member of this household, who usually lived here for at least four nights a week, died in the last 24 months?
Yes 1
No → SKIP TO SECTION D 2
C2
Starting with the death that occurred most recently, what was the name of the deceased?
C3What was [ .. ]’s
gender?
C4What was [ .. ]’s relationship
to the current head of household?
Interviewer:
See code sheet for Relationship codes
C5What was the date of
[ .. ]’s death?
Interviewer: If don’t know the month, write 99. If don’t
know the year, write 9999
C6How old was [ .. ] when they died?
Interviewer: If less than 1 year write 0. If don’t know, write ‘-9’.
C7 Was [ .. ] ‘s
death the result of an accident or
violence?
Code Name Male Female Relationship code mm/yyyy Years Yes No
01
1 2
_ _ / _ _ _ _ 1 2
02
1 2
_ _ / _ _ _ _ 1 2
03
1 2
_ _ / _ _ _ _ 1 2
04
1 2
_ _ / _ _ _ _ 1 2
05
1 2
_ _ / _ _ _ _ 1 2
06
1 2
_ _ / _ _ _ _ 1 2

4
Section D: Household living standards
INTERVIEWER READ OUT: We would now like to ask you questions about your dwelling, your access to services and your households’ income in the last month.
D1 Interviewer check! Indicate the type of main dwelling that the household occupies. Dwelling/house or brick structure on a separate stand or yard or on farm 01
Traditional dwelling/hut/structure made of traditional materials 02 Flat or apartment in a block of flats 03 Town/cluster/semi-detached house (simplex, duplex or triplex) 04 Unit in retirement village 05 Dwelling/house/flat/room in backyard 06 Informal dwelling/shack in backyard 07 Informal dwelling/shack not in backyard, e.g. in an informal/ squatter settlement or on farm 08
Room/flatlet 09 Caravan/tent 10 Other (specify) 11
D2 What is the total number of rooms that the household occupies in all structures in this dwelling? Please note this excludes bathrooms and toilets.
D3 What is the main material used for the roof and the walls of the main dwelling? Interviewer: mark one code in each column Type of material
D3.1 Roof
D3.2 Walls
Bricks 01 01 Cement block/concrete 02 02 Corrugated iron/zinc 03 03 Wood 04 04 Plastic 05 05 Cardboard 06 06 Mixture of mud and cement 07 07 Wattle and daub 08 08 Tile 09 09 Mud bricks 10 10 Thatching 11 11 Asbestos/cement roof sheeting 12 12 Stone and rock 13 13
D4
Does a household member own this dwelling? Yes 1 No → SKIP TO D10 2
D5 Who in this household owns the dwelling? Pcode Person #1 Person #2 Person #3
D6
Is this property fully paid off? Yes → SKIP TO D9 1
No 2
Refuse -8 D7
What is the amount of the bond still owing on this property?
Amount R
Refuse -8 Don’t know -9
D8
What is the amount of the monthly bond payment on this property?
Amount R
Refuse -8 Don’t know -9
D9
What is the value of rent you could collect per month, if you were to rent this dwelling out?
Amount → SKIP TO D13 R
Refuse → SKIP TO D13 -8 Don’t know → SKIP TO D13 -9
D10
Does this household pay rent? Yes 1
No → SKIP TO D12 2
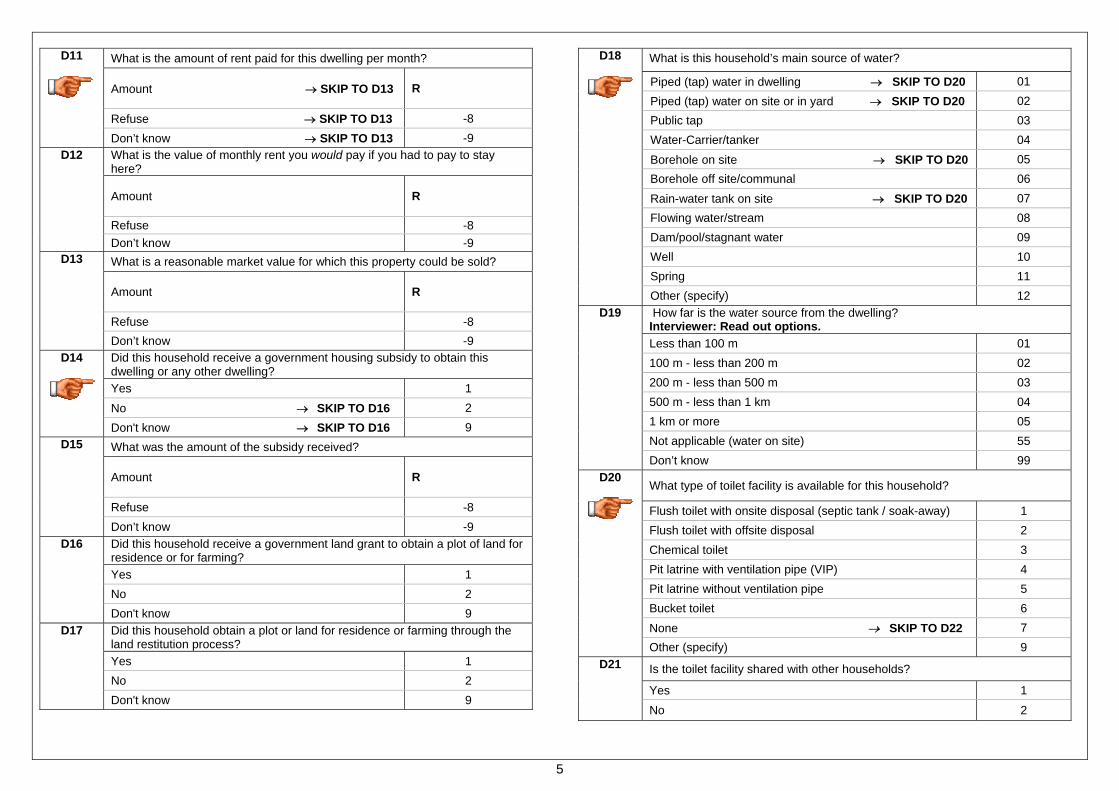
5
D11
What is the amount of rent paid for this dwelling per month?
Amount → SKIP TO D13 R
Refuse → SKIP TO D13 -8 Don’t know → SKIP TO D13 -9
D12 What is the value of monthly rent you would pay if you had to pay to stay here?
Amount R
Refuse -8 Don’t know -9
D13 What is a reasonable market value for which this property could be sold?
Amount R
Refuse -8 Don’t know -9
D14
Did this household receive a government housing subsidy to obtain this dwelling or any other dwelling? Yes 1 No → SKIP TO D16 2 Don't know → SKIP TO D16 9
D15 What was the amount of the subsidy received?
Amount R
Refuse -8 Don’t know -9
D16 Did this household receive a government land grant to obtain a plot of land for residence or for farming? Yes 1 No 2 Don't know 9
D17 Did this household obtain a plot or land for residence or farming through the land restitution process? Yes 1 No 2 Don't know 9
D18
What is this household’s main source of water?
Piped (tap) water in dwelling → SKIP TO D20 01 Piped (tap) water on site or in yard → SKIP TO D20 02 Public tap 03 Water-Carrier/tanker 04 Borehole on site → SKIP TO D20 05 Borehole off site/communal 06 Rain-water tank on site → SKIP TO D20 07 Flowing water/stream 08 Dam/pool/stagnant water 09 Well 10 Spring 11 Other (specify) 12
D19 How far is the water source from the dwelling? Interviewer: Read out options. Less than 100 m 01 100 m - less than 200 m 02 200 m - less than 500 m 03 500 m - less than 1 km 04 1 km or more 05 Not applicable (water on site) 55 Don’t know 99
D20
What type of toilet facility is available for this household?
Flush toilet with onsite disposal (septic tank / soak-away) 1 Flush toilet with offsite disposal 2 Chemical toilet 3 Pit latrine with ventilation pipe (VIP) 4 Pit latrine without ventilation pipe 5 Bucket toilet 6 None → SKIP TO D22 7 Other (specify) 9
D21 Is the toilet facility shared with other households?
Yes 1
No 2

6
D22 Does this household have electricity even if currently disconnected?
Yes 1 No 2
D23 What is the main source of energy/fuel for this household for ________?
D23.1 Cooking
D23.2 Heating
D23.3Lighting
Electricity from mains 01 01 01
Electricity from generator 02 02 02
Gas 03 03 03
Paraffin 04 04 04
Wood 05 05
Coal 06 06
Candles 07
Animal Dung 08 08
Solar Energy 09 09 09
Other (specify) 10 10 10
None 11 11 11 D24 Does this household have a landline telephone in the dwelling?
Yes -Currently in working condition 1 Yes – Currently not in working condition 2 No 3
D25 Is there a cellular telephone available to this household for regular use? Yes 1 No 2
D26 If you were to walk, how many minutes would it take from here to reach the following public transport services by foot? Interviewer: Write ‘-5’ for Not applicable, ‘-8’ for Refuse or ‘-9’ for Don’t know. 1 - Train min2 - Bus min3 - Minibus Taxi min
D27 Is your refuse or rubbish removed at least once a week by local authorities? Yes 1 No 2
D28 Do you have any street lighting where you live?
Yes - Currently in working condition 1 Yes - Not currently in working condition 2 No 3
D29 In the past 12 months, how often did any adult in this household go to bed hungry because there wasn’t enough food? Never 01 Seldom 02 Sometimes 03 Often 04 Always 05 Not applicable (No adults in the household) 55
D30 In the past 12 months, how often did any child in this household go to bed hungry because there wasn’t enough food? Never 01 Seldom 02 Sometimes 03 Often 04 Always 05 Not applicable (No children in the household) 55
D31 How much money did this household spend on all its expenses in the last 30 days?
Amount R
Refuse -8 Don’t know -9

7
INTERVIEWER READ OUT: Next, we want to ask you some questions about your households’ standard of living. Interviewer: Read out question first and then each response option.
It was less than
adequate for your house-hold’s needs
It was just adequate for your house-hold’s needs
It was more than
adequate for your house-hold’s needs
Not applicable
D32.1
Concerning your household’s food consumption over the past month, which of the following is true?
1 2 3
D32.2
Concerning your household’s housing, which of the following is true?
1 2 3
D32.3
Concerning your household’s clothing, which of the following is true?
1 2 3
D32.4
Concerning your household’s health care cover, which of the following is true?
1 2 3
D32.5
Concerning the schooling of children in the household, which of the following is true?
1 2 3 5
INTERVIEWER READ OUT: Next, we want to ask you some questions about your relationship with your neighbours and the social interactions that you have with those around you. Interviewer: Read out question first and then each response option.
Never happens
Very Rare
Not common
Fairly common
Very common
Don’t know
D33.1
How common is it that neighbours help each other out?
1 2 3 4 5 9
D33.2
How common is it that neighbours do things together?
1 2 3 4 5 9
D33.3
How common is it that people in your neighbour-hood are aggressive?
1 2 3 4 5 9
D33.4
How common is burglary and theft in your neighbour-hood?
1 2 3 4 5 9

8
D34 Did anyone in this household receive income from employment or self
employment last month?
Yes 1 No 2
D35 Did anyone in this household receive rental income in the last month? Please note that this includes income from backyard shacks, boarders, flats and/or homes people own.
Yes 1 No 2
D36 Did anyone in this household receive income from government grants last month? Please note that this includes the old age pension, the child support the disability grant, the care dependency grant or any other kind of grant.
Yes 1 No 2
D37 Did anyone in this household receive income from private pensions, dividends and interest on investments last month?
Yes 1 No 2
D38
What was the total amount of income (after income tax) that this household received last month? Please note this includes all the household members’ salaries and wages, grants, interest, rental income and income from agriculture earned by household members in the last month.
Amount → SKIP TO SECTION E R
Refuse -8 Don’t know -9
D39 Please would you look at the show card and point out the most accurate earnings category for last month’s household income? Interviewer: Show the income categories on the show card and record the appropriate code for the household’s monthly income
Income category
Refuse 88 Don’t know 99

9
Section E1: Food spending and consumption INTERVIEWER READ OUT: Now we would like to ask questions about some specific food that may have been eaten in the LAST 30 DAYS. It should not include food that has been bought for resale or exchanged for commercial purposes.
E1.1 What was the total food expenditure of this household in the last 30 days? Amount R
Refuse -8 Don’t know -9
Interviewer:
Read out each item. For each of the items marked with a yes, ask the other questions. For E1.3 to E1.6, write ‘-8’ for Refuse or ‘-9’ for Don’t know. E1.2
Was [ .. ] eaten by this household in the
last 30 days?
E1.3 How much was spent on [ .. ] in the last 30
days?
E1.4 What was the value of [ .. ] received as gifts in
the last 30 days?
E1.5 What was the value of
[ .. ] received as payment in the last 30
days?
E1.6 What was the value of [ .. ] eaten from own production and/or
from own shop stock in the last 30 days?
Code Food Item Yes No Rands Rands Rands Rands
01 Mealie meal 1 2 02 Samp 1 2 03 Flour and bread 1 2 04 Rice 1 2
05 Pasta 1 2
06 Biscuits, cakes, rusks 1 2
07 Red meat (beef, mutton, pork, etc) 1 2
08 Canned red meat 1 2
09 Chicken 1 2
10 Fresh fish and shell fish 1 2
11 Tinned fish 1 2 12 Dried peas, lentils, beans 1 2 13 Potatoes 1 2 14 Other vegetables 1 2

10
Section E1: Food spending and consumption (continued) Interviewer:
This is a continuation from the previous page. For E1.3 to E1.6, write ‘-8’ for Refuse or ‘-9’ for Don’t know. E1.2
Was [ .. ] eaten by this household in the
last 30 days?
E1.3 How much was spent on [ .. ] in the last 30
days?
E1.4 What was the value of [ .. ] received as gifts in
the last 30 days?
E1.5 What was the value of
[ .. ] received as payment in the last 30
days?
E1.6 What was the value of [ .. ] eaten from own production and/or
from own shop stock in the last 30 days?
Code Food Item Yes No Rands Rands Rands Rands
15 Fruits and nuts 1 2 16 Oil for cooking 1 2 17 Margarine, butter, ghee, other fats 1 2 18 Peanut butter 1 2
19 Milk, cheese, yoghurts and dried milk 1 2
20 Eggs 1 2
21 Sugar, jam, honey, chocolates and sweets 1 2
22 Soft drinks and juices 1 2
23 Tinned fruit and vegetables 1 2
24 Breakfast cereal and porridge 1 2
25 Baby food and baby formula 1 2
26 Salt and spices 1 2
27 Soya products 1 2
28 Coffee and tea 1 2
29 Food hampers 1 2
30 Readymade meals brought into the household 1 2
31 Meals prepared outside the home (incl. restaurants and take-aways) 1 2
32 Other food expenditure 1 2

11
Section E2: Non-food spending and consumption INTERVIEWER READ OUT: Now we would like to ask questions about some specific household items on which the household may have spent money in the LAST 30 DAYS and how much was spent on these items. It should not include items that has been bought for resale or exchanged for commercial purposes. Interviewer:
Read out each item. For each of the items marked with a yes, ask the other questions. For E2.2 write ‘-8’ for Refuse or ‘-9’ for Don’t know.
E2.1 Did the household spend money on [...] in
the last 30 days?
E2.2 How much was spent on [ .. ] in
the last 30 days?
Code Yes No Rands
Personal items:
01 Cigarettes and tobacco 1 2
02 Beer, wine and spirits 1 2
03 Entertainment such as cinema, music, MNET and DSTV 1 2
04 Sport including sporting equipment, gym and club membership 1 2
05 Personal care items such as cosmetics, soap, shampoo and haircuts 1 2
06 Jewellery and watches 1 2
07 Newspapers, stationery, envelopes, stamps and books excluding school books 1 2
08 Cell phone account and/or airtime 1 2
09 Telephone account 1 2
10 Lotto, gambling and horse-racing 1 2
11 Internet if not included in the telephone account 1 2
12 Trips and holidays excluding transport costs 1 2
13 Ceremonies such as weddings and funerals 1 2
Transport costs:
14 Car payments excluding insurance 1 2
15 Petrol, oil and car service 1 2
16 Buses, taxis, trains and air tickets including transport to school 1 2

12
Section E2: Non-food spending and consumption (continued)
Interviewer: This is a continuation from the previous page. For E2.2 write ‘-8’ for Refuse or ‘-9’ for Don’t know.
Code
E2.1 Did the household spend money on [...] in
the last 30 days?
E2.2 How much was spent on [ .. ] in
the last 30 days?
Yes No Rands Energy, water and municipal rates:
17 Water 1 2
18 Electricity 1 2
19 Other energy sources such as wood, paraffin, charcoal/coal, candles, gas, purchasing/charging batteries and diesel oil for generators 1 2
20 Municipal rates 1 2
21 Levies for example sectional title, share block and timeshare 1 2
Insurance:
22 Life insurance 1 2
23 Funeral policies or burial societies 1 2
24 Educational policies 1 2
25 Short-term insurance for example car, property & fire and crop insurance 1 2
Household items:
26 Kitchen equipment, like pots and pans, cutlery and crockery 1 2
27 Home maintenance and repairs to the dwelling 1 2
28 Bedding, sheets, blankets and towels 1 2
29 Material to make curtains and other household items 1 2
30 Hire purchase (HP) payments on furniture and other household appliances 1 2
31 Furniture and other household appliances bought with cash or by credit card 1 2
Clothing and shoes:
32 Shoes and clothes (excluding school uniforms) bought with cash or by credit card 1 2
33 Account payments on shoes and clothes excluding school uniforms 1 2
34 Material to make clothing 1 2

13
Section E2: Non-food spending and consumption (continued)
Interviewer: This is a continuation from the previous page. For E2.2 write ‘-8’ for Refuse or ‘-9’ for Don’t know.
E2.1
Did the household spend money on [...] in the last 30 days?
E2.2 How much was spent on [ .. ] in
the last 30 days?
Code Yes No Rands
Health care:
35 Medical aid schemes/medical insurance such as hospital plan 1 2
36 Dentists, doctors or nurses 1 2
37 Hospital fees 1 2
38 Medical supplies, for example, medicines and bandages 1 2
39 Traditional healer's fees 1 2
40 Homeopaths, physiotherapists, dieticians 1 2
Education:
41 School fees and tuition 1 2
42 School books including stationery 1 2
43 Uniforms 1 2
44 Other school expenses such as school outings, meals at school, boarding fees, contributions to school buildings, extra costs for teachers and extramural activities 1 2
Miscellaneous:
45 Washing powder, dishwashing liquid, polish and all household cleaners 1 2
46 Crèche and childcare 1 2
47 Religious and membership dues of organisations, donations to charity 1 2
48 Domestics, gardeners and other household help 1 2
49 Swimming pool maintenance 1 2
50 Pets 1 2
51 Toys 1 2
52 Gifts 1 2
53 Income tax payments 1 2

14
Section F: Durable goods INTERVIEWER READ OUT: Now we would like to ask you questions about household items which the household may or may not own.
Type of Good
F1Does the household own at least one [ .. ] ?
Yes No
01 - Radio 1 2 02 - Hi-Fi stereo , CD player, MP3 player 1 2 03 - Television 1 2 04 - Satellite dish 1 2 05 - Video cassette recorder, DVD player 1 2 06 - Computer 1 2 07 - Camera 1 2 08 - Cell phone 1 2 09 - Electric stove 1 2 10 - Gas stove 1 2 11 - Paraffin stove 1 2 12 - Microwave 1 2 13 - Fridge/ freezer 1 2 14 - Washing machine 1 2 15 - Sewing/knitting machine 1 2 16 - Lounge suite 1 2 17- Private motor vehicle in running condition 1 2 18 - Commercial motor vehicle in running condition 1 2 19 - Motorcycle/scooter 1 2 20 - Bicycle 1 2 21 - Non-motorised boat 1 2 22 - Motor boat 1 2 23 - Donkey cart or ox cart 1 2 24 - Plough 1 2 25 - Tractor 1 2 26 - Wheelbarrow 1 2 27 - Grinding mill 1 2
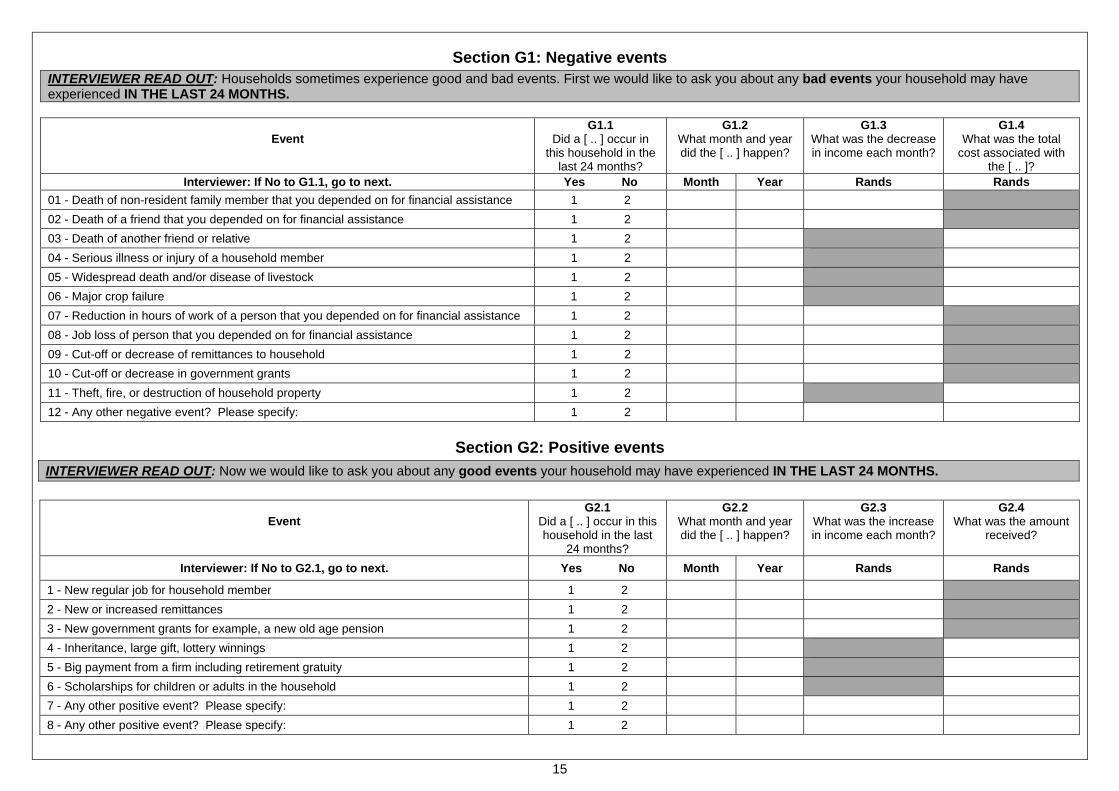
15
Section G1: Negative events INTERVIEWER READ OUT: Households sometimes experience good and bad events. First we would like to ask you about any bad events your household may have experienced IN THE LAST 24 MONTHS.
Event
G1.1 Did a [ .. ] occur in
this household in the last 24 months?
G1.2What month and year did the [ .. ] happen?
G1.3 What was the decrease in income each month?
G1.4 What was the total
cost associated with the [ .. ]?
Interviewer: If No to G1.1, go to next. Yes No Month Year Rands Rands 01 - Death of non-resident family member that you depended on for financial assistance 1 2
02 - Death of a friend that you depended on for financial assistance 1 2
03 - Death of another friend or relative 1 2
04 - Serious illness or injury of a household member 1 2
05 - Widespread death and/or disease of livestock 1 2
06 - Major crop failure 1 2
07 - Reduction in hours of work of a person that you depended on for financial assistance 1 2
08 - Job loss of person that you depended on for financial assistance 1 2
09 - Cut-off or decrease of remittances to household 1 2
10 - Cut-off or decrease in government grants 1 2
11 - Theft, fire, or destruction of household property 1 2
12 - Any other negative event? Please specify: 1 2
Section G2: Positive events
INTERVIEWER READ OUT: Now we would like to ask you about any good events your household may have experienced IN THE LAST 24 MONTHS.
Event
G2.1Did a [ .. ] occur in this household in the last
24 months?
G2.2What month and year did the [ .. ] happen?
G2.3What was the increase in income each month?
G2.4 What was the amount
received?
Interviewer: If No to G2.1, go to next. Yes No Month Year Rands Rands
1 - New regular job for household member 1 2
2 - New or increased remittances 1 2
3 - New government grants for example, a new old age pension 1 2
4 - Inheritance, large gift, lottery winnings 1 2
5 - Big payment from a firm including retirement gratuity 1 2
6 - Scholarships for children or adults in the household 1 2
7 - Any other positive event? Please specify: 1 2
8 - Any other positive event? Please specify: 1 2

16
Section H: Agriculture INTERVIEWER READ OUT: We would like to ask some questions about agricultural production by your household in the last 12 months. The questions are about anything that has been planted or any animals that have been kept or used or taken care of on your households’ fields and gardens or on land your household has access to.
H1 Over the last 12 months has anyone in this household participated in growing food or raising livestock other than as part of paid employment?
Yes 1
No → SKIP TO SECTION J 2
H2
Are these agricultural activities all part of a commercial farming enterprise which is run as a separate business with its own accounts?
Yes → SKIP TO SECTION J 1
No 2
H3 Has anyone in the household grown crops or taken care of animals on any of the following types of land in the last 12 months? Yes No
H3.1 A commercial farm which is owned by a member of this household 1 2
H3.2 Land to which a member of this household has access because of his/her status as employee on a commercial farm 1 2
H3.3 A land reform project on state land 1 2
H3.4 An equity share scheme on a commercial farm 1 2
H3.5 On a portion of land that falls in a communal area 1 2
H3.6 Land in / near an informal or urban settlement in which the household lives 1 2

17
INTERVIEWER READ OUT: Now we would like to ask you some questions about everything this household grew in the last 12 months even if you did not sell any of it. This includes things you grew in your garden.
H4.1
Over the last 12 months, did any member of this household grow any crops?
Yes 1
No → SKIP TO H5.1 2
INTERVIEWER READ OUT: What crops have these resident household members been growing or cultivating in the last 12 months?
Crop type
H4.2 Did anyone in this household grow
[ .. ] in the last 12 months?
Yes = 1
No = 2 SKIP TO NEXTCROP
H4.3In what units does
the household usually measure
this harvest?
Interviewer: See code sheet for Unit codes
H4.4How many [UNITS]
of this crop have been harvested over the last 12
months?
Interviewer:
If none harvested, write ‘0’ and SKIP TO NEXT CROP
H4.5 Of the amount harvested, how
many [UNITS] of [CROP] did the
household sell in the last 12 months?
H4.6What is the total amount you got from selling your harvest in the last
12 months?
Interviewer: If none sold, write
‘0’
H4.7Of the amount harvested, how
many [UNITS] of [CROP] did the household give
away in the last 12 months?
H4.8 Of the amount
harvested, how many [UNITS] of [CROP] did the household
retain for own consumption in the
last 12 months?
Yes No Unit code Number of Units Number of units Rands Number of Units Number of Units
01 Mealies 1 2
02 Sorghum 1 2
03 Wheat 1 2
04 Millet 1 2
05 Pasture crops such as lucerne 1 2
06 Cotton 1 2
07 Sugar cane 1 2
08 Tea 1 2
09 Timber 1 2
10 Other grains or field crops such as canola or hops
1 2
11
Deciduous fruit such as apples, pears, apricots, peaches, plums or grapes
1 2

18
Interviewer: This is a continuation from the previous page.
Crop type
H4.2 Did anyone in this household grow
this crop in the last 12 months?
Yes = 1
No = 2 SKIP TO NEXTCROP
H4.3In what units does
the household usually measure
this harvest?
Interviewer: See code sheet for Unit codes
H4.4How many [UNITS]
of this crop have been harvested over the last 12
months?
Interviewer:
If none harvested, write 0 and SKIP TO NEXT CROP
H4.5 Of the amount harvested, how
many [UNITS] of [CROP] did the
household sell in the last 12 months?
H4.6What is the total amount you got from selling your harvest in the last
12 months?
Interviewer: If none sold, write
0
H4.7Of the amount harvested, how
many [UNITS] of [CROP] did the household give
away in the last 12 months?
H4.8 Of the amount
harvested, how many [UNITS] of [CROP] did the household
retain for own consumption in the
last 12 months?
Yes No Unit code Number of Units Number of units Rands Number of Units Number of Units
12 Citrus fruit such as oranges, naartjies or grapefruit
1 2
13
Subtropical fruit such as bananas, mangos, pineapples, avocados or lichis
1 2
14 Other fruit such as nuts, olives, etc 1 2
15 Tomato 1 2
16 Spinach 1 2
17 ‘Wild Spinach’, Morogo or Imifino 1 2
18 Cabbages 1 2
19 Potatoes or sweet potato 1 2
20 Pumpkin or butternut or squash 1 2
21 Carrots 1 2
22 Madumbe or other tubers 1 2
23 Onions 1 2
24 Green beans 1 2
25 Legumes or dry beans 1 2
26 Lettuce and greens 1 2
27
Other vegetables (specify in column)
1 2

19
INTERVIEWER READ OUT: Now we would like to ask you some questions about all livestock owned by the household in the last 12 months.
H5.1
Has anyone in the household owned any livestock or poultry in the last 12 months? Yes 1
No → SKIP TO H7.1 2
Type of Animal
H5.2 Has a household member owned
[ .. ] during the last 12 months?
Yes = 1
No = 2 SKIP TO NEXT
H5.3 How many [ .. ]
are in the household’s
possession at the moment?
H5.4 In the past 12
months how many [ .. ] did the
household sell?
Interviewer: If none, write 0
H5.5 What is the total amount you got
from selling [ .. ]?
Interviewer: If none, write 0
H5.6 In the past 12
months how many [ .. ] did the
household give away?
Interviewer: If none, write 0
H5.7 In the past 12
months how many [ .. ] did the
household lose due to theft, illness or
other loss?
Interviewer: If none, write 0
H5.8 In the past 12
months, how many [ .. ] did the
household slaughter or use for own consumption?
Interviewer:
If none, write 0
Yes No Number Number Rands Number Number Number
01 Cattle 1 2
02 Sheep 1 2
03 Goats 1 2
04 Pigs 1 2
05 Horses 1 2
06 Donkeys and Mules 1 2
07 Chickens 1 2
08 Ducks and Geese 1 2
09 Ostriches 1 2
10 Other, specify:
1 2
11 Other, specify:
1 2
12 Other specify:
1 2

20
H6.1
INTERVIEWER CHECK! Did this household own chickens in the last 12 months?
Yes 1
No → SKIP TO H6.2 2
Type of product
How many [UNITS] of eggs did you produce
per month?
Interviewer:
If none, write 0 and SKIP TO H6.2
H6.1.3Of the amount produced,
how many [UNITS] of eggs did you sell in a typical
month?
H6.1.4 What is the total amount you got from selling your eggs in
a typical month?
Interviewer: If none, write 0
H6.1.5Of the amount produced,
how many [UNITS] of eggs did you typically give away
in a month?
Interviewer: If none, write 0
H6.1.6 Of the amount produced,
how many [UNITS] of eggs did you keep for your own consumption in a typical
month?
Interviewer: If none, write 0
H6.1.1
Unit Code
Interviewer: Circle one option only
H6.1.2
Number of Units per month
Number of Units per month Rands Number of Units per
month Number of Units per
month
1 - Eggs 1 – Dozen
2 – Single Unit
H6.2
INTERVIEWER CHECK! Did this household own cattle or goats in the last 12 months? Yes 1
No → SKIP TO H6.3 2
Type of product
H6.2.1 How many months of the
year did you get [ .. ]?
Interviewer: If none, write 0 and
SKIP TO NEXT
In the months when you did
produce [ .. ] how much did you produce per month?
Interviewer: See code sheet for Unit codes
H6.2.4 Of the amount of
[ .. ] produced, how much did you
typically sell in a month?
Interviewer: If none, write 0
H6.2.5What is the total amount you got
from selling [ .. ] in a typical month?
Interviewer: If none, write 0
H6.2.6Of the amount
produced, how much [ .. ] did you give away
in a typical month?
Interviewer: If none, write 0
H6.2.7 Of the amount produced, how
much [ .. ] did you keep for your own consumption in a typical month?
Interviewer:
If none, write 0
Number of months
H6.2.2
Unit Code
H6.2.3
Number of Units per month
Number of Units per month Rands Number of Units per
month Number of Units
per month
1 - Milk Litres
2 - Butter
3 - Other dairy

21
H6.3
INTERVIEWER CHECK! Did this household own sheep or goats in the last 12 months? Yes 1
No → SKIP TO H7.1 2
Type of product
H6.3.1 How many months of the
year did you get [ .. ]?
Interviewer: If none, write 0 and
SKIP TO NEXT
In the months when you did
produce [ .. ] how much did you produce per month?
Interviewer: See code sheet for Unit codes
H6.3.4 Of the amount of
[ .. ] produced, how much did you
typically sell in a month?
Interviewer: If none, write 0
H6.3.5What is the total amount you got
from selling [ .. ] in a typical month?
Interviewer: If none, write 0
H6.3.6Of the amount
produced, how much [ .. ] did you give away
in a typical month?
Interviewer: If none, write 0
H6.3.7 Of the amount produced, how
much [ .. ] did you keep for your own consumption in a typical month?
Interviewer:
If none, write 0
Number of months
H6.3.2
Unit Code
H6.3.3
Number of Units per month
Number of Units per month Rands Number of Units per
month Number of Units
per month
1 - Wool
2 - Mohair

22
INTERVIEWER READ OUT: In the next question we want to know about the things you had to do to produce the crops or products we have been talking about. Interviewer:
Read out each item. For each of the items marked with a yes, ask H7.2. For H7.2 write ‘-8’ for Refuse or ‘-9’ for Don’t know.
H7.1In the last 12 months did your
household [ .. ]?
Yes = 1
No = 2 SKIP TO NEXT
H7.2What was the amount spent on
[ .. ] in the last 12 months?
Type of input Yes No
01 - Buy or acquire hired labour 1 2
02 - Buy or acquire fertilizer 1 2
03 - Buy or acquire manure, such as animal dung 1 2
04 - Buy or acquire other agro-chemicals, such as sprays, herbicides, insecticides and blue death 1 2
05 - Buy or acquire ploughing services for example tractors, ploughs, planters or animals 1 2
06 - Buy or acquire seeds and seedlings 1 2
07 - Buy or acquire dipping services 1 2
08 - Buy or acquire other veterinary services and products, such as medicines and veterinary care 1 2
09 - Buy or acquire animal feed for example chicken feed 1 2
10 - Make investments in your agricultural activities such as such as orchard development, building or machinery 1 2
11 - Repair and maintain machinery, fences, buildings and hand tools 1 2
PLEASE NOTE: THERE IS NO SECTION I

23
Section J: Interviewer evaluation To be completed by interviewer only J1 Languages used during interview
Interviewer: Multiple mention allowed
IsiNdebele 01 IsiXhosa 02 IsiZulu 03 Sepedi 04 Sesotho 05 Setswana 06 Siswati 07 Tshivenda 08 Isitsonga 09 Afrikaans 10 English 11 Other (__________________) 12
J2 In general, how did the respondent act towards you during the interview?
Hostile 01 Neither hostile nor friendly 02 Friendly 03
J3 How attentive was the respondent to the questions during the interview?
Not at all attentive 01 Somewhat attentive 02 Very attentive 03
J4 Were other persons within hearing range at any time during the interview?
No other person within hearing range at any time 01 1+ persons within hearing range for part of the interview 02 1+ persons within hearing range for all of the interview 03
J5 Did more than one person help to complete this questionnaire?
Yes 01 No 02
J6 If so, which household members helped to complete the questionnaire? Fill in the Pcodes of those who assisted
Pcode Pcode Pcode
J7 Are any of the following evident at this address? Interviewer: Multiple responses allowed
Locked gate (no intercom access) 01 Locked door/gate (with intercom access) 02 Security guard/doorman/on-site manager - gatekeeper 03 Security door 04 No trespassing sign 05 Beware of dog sign 06 Evidence of a dangerous dog (i.e. witnessing it) 07 No junk mail/no hawker sign 08 Neighbourhood watch sign 09 Bars on windows 10 None of the above 11
J8 Any additional comments about specific questions or data quality?.......................................................................................... ................................................................................................................................................................................................... ................................................................................................................................................................................................................................................................................................................................................................................................................................................................................................................................................................................................................................................................................................................................................................................................................
J9 End time of interview ____:____
QUALITY CONTROL RECORD SHEET
PROBLEM CORRECTION CORRECTION CHECKED
Q number
Date Initial Description of problem Date Initial Action taken (See code box)
Date Initial
Quality control actions taken
NN None RV Revisit CB Call back OQ Corrected from other questionnaire OT Other (specify)