Embed Size (px)
Citation preview

TRANSITIONS PATHWAYS AND RISK ANALYSIS FOR CLIMATE
CHANGE MITIGATION AND ADAPTATION STRATEGIES
Socioeconomic Impacts of Air Pollution in the Chilean
Metropolitan Area
Project Coordinator: SPRU, Science Policy Research Unit, (UoS) University of Sussex
Work Package 4 Leader Organisation: Mikel Gonzalez (BC3)
Contributing authors: Rodrigo Cerda and Luis Gonzales (ClapesUC)
May 2017

D4.4.2 Socioeconomic Impacts of Air Pollution in the Chilean Metropolitan Area
TRANSrisk
Transitions pathways and risk analysis for climate
change mitigation and adaptation strategies
GA#: 642260
Funding type: RIA
Deliverable number
(relative in WP) 4.4 (sub-report 4.4.2)
Deliverable name: Socioeconomic Impacts of Air Pollution in the Chilean Metropolitan Area
WP / WP number: 4
Delivery due date: May 2017
Actual date of submission: 09/05/2017
Dissemination level:
Lead beneficiary: BC3
Responsible scientist/administrator: Rodrigo Cerda
Estimated effort (PM): 5
Contributor(s): Rodrigo Cerda and Luis Gonzales
Estimated effort contributor(s) (PM): 10
Internal reviewer: Jon Sampedro, Ed Dearnley.

D4.4.2 Socioeconomic Impacts of Air Pollution in the Chilean Metropolitan Area
Preface
Both the models concerning the future climate evolution and its impacts, as well as the models
assessing the costs and benefits associated with different mitigation pathways face a high degree
of uncertainty. There is an urgent need to not only understand the costs and benefits associated
with climate change but also the risks, uncertainties and co-effects related to different mitigation
pathways as well as public acceptance (or lack of) of low-carbon (technology) options. The main
aims and objectives of TRANSrisk therefore are to create a novel assessment framework for
analysing costs and benefits of transition pathways that will integrate well-established approaches
to modelling the costs of resilient, low-carbon pathways with a wider interdisciplinary approach
including risk assessments. In addition TRANSrisk aims to design a decision support tool that should
help policy makers to better understand uncertainties and risks and enable them to include risk
assessments into more robust policy design.
PROJECT PARTNERS
No Participant name Short Name Country code Partners’ logos
1 Science Technology Policy Research, University of Sussex
SPRU UK
2 Basque Centre for Climate Change BC3 ES
3 Cambridge Econometrics CE UK
4 Energy Research Centre of the Netherlands ECN NL
5 Swiss Federal Institute of Technology (funded by Swiss Gov’t)
ETH Zurich CH
6 Institute for Structural Research IBS PL
7 Joint Implementation Network JIN NL
8 National Technical University of Athens NTUA GR
9 Stockholm Environment Institute SEI SE, KE
10 University of Graz UniGraz AT
11 University of Piraeus Research Centre UPRC GR
12 Pontifical Catholic University of Chile CLAPESUC CL

D4.4.2 Socioeconomic Impacts of Air Pollution in the Chilean Metropolitan Area
Executive Summary
This section identifies the main impacts of air quality on people and the environment by reviewing
relevant literature, with a special focus on Latin America and Chile. We evaluate the impact of
air pollution in four areas: Health; Social Issues; Human Capital plus labour supply, and Climate
Change. The effects on human health are well documented; the main effects of long and short
term exposure to PM10 and PM2.5 are respiratory and cardiovascular morbidity, mortality due to
cardiovascular and respiratory diseases, and lung cancer1. The case of Chile is consistent with
international evidence: a variation equal to 10-microgram-per-cubic-meter on average PM10 for a
three-day period is associated with a 1.1 percent increase in mortality. According to the 2017
report on the State of Global Air, produced by the Health Effects Institute, in Chile in 2015, 5,900
deaths were caused by bad air quality, contrasting with 3,723 deaths according to the Chilean
Ministry of Environment, and 2,822 by the WHO.
In relation to socioeconomic impacts, international evidence suggests that despite not being
consistently more exposed to air pollution, people from less advantaged socio-economic status
experience greater negative health effects. It has been found that vulnerable areas in Chile reach
higher levels than the current 24-hour standard for fine particles, and have longer time periods of
unhealthy air and 21% more days with higher levels of air pollution.
We discuss the impact of air pollution on school attendance and cognitive skills as a way of
addressing the impact on human capital. International evidence suggests that high levels of air
pollution are correlated with absenteeism due to respiratory diseases in children. There is also
evidence that clinically healthy children living in a highly polluted urban environment exhibit
deficits in fluid cognition, memory, and executive functions compared to healthy children living
in less polluted environments. Similarly, labour supply is also affected by air pollution in two ways:
worker productivity and job absenteeism. There is compelling evidence supporting a large
correlation between job absenteeism and poor air quality levels.
Particulate Matter also has an impact on climate change. Particles can either absorb or reflect
light depending on their albedo2, which can either enhance or moderate temperature increases.
The overall impact depends on the source and the type of particles emitted; however, there is
strong evidence, around the world, that black carbon is the second largest contributor of
greenhouse effect, after CO2. In the case of Chile, more than half of PM2.5 is emitted from mobile
combustion sources (diesel and gasoline) or households (combustion of firewood), which are rich
1 Recent evidence calculate health impacts using Burnett IER functions (WHO 2016) so many comparisons will change
over the time. 2 Albedo is the property of reflectivity of a surface, a higher level of albedo means that more light is reflected, and
therefore less heat is stored.

D4.4.2 Socioeconomic Impacts of Air Pollution in the Chilean Metropolitan Area
emitters of black carbon. As the government states in their Intended Nationally Determined
Contribution3_, black carbon is a significant part of PM2.5 in Chilean cities.
Since air pollution is a global phenomenon, it is important to review evidence of policies and
regulations in the rest of the world. We analysed the case of the U.S. State of California, which
has similar climate and geography, and we compare it to Chile. Based on case study evidence, the
key to effective policy in the regulation of stationary sources seems to be a combination of
institutional strength (monitoring systems with good frequency and quality data) with flexible use
of tradable emission permits. California and Chile make special efforts on the regulation of mobile
sources due to their significant contribution to air pollution. In the case of Santiago, the
management of critical episodes has demonstrated to be successful in the short run, but is not
effective in the long run mainly because a lack of commitment in the implementation of new
policies. On the other hand, stricter goals regarding the use of less polluting vehicles, seems to
be a successful path to achieve a long term reduction in pollution.
We discuss the current air quality improvement plan for Santiago “Santiago Respira,” developed
to achieve national air quality targets for PM2.5, PM10, O3, CO, NO2 and SO2 gases, in a 10-year
window (2026). Proposals were categorised under sources and courses of action as in: mobile
sources, stationary sources, education and management of critical events. Two policies are
expected to have the most significant impact on emissions of PM2.5 and NOx: (a) the improvement
of technological standards for Transantiago’s bus fleet and, (b) the creation of a Low Emissions
Zone within the ring formed by the Americo Vespucio Avenue.
We ranked the most important criticisms about the specific project and institutional
environmental framework in the following four categories: (i) changes to the industrial emissions
policy, (ii) arbitrariness of the vehicle restriction policy, (iii) lack of transparency in the cost-
benefit analysis and control, and (iv) institutional coordination problems. We also discuss the
omission of household burning of firewood one of the main sources of pollution and also identified
that public transportation as a tool to reduce environmental pollution is also under utilised.
However, if the quality of public transportation improves, we would expect a large substitution
from private cars to public transportation, which would lead to less pollution.
3 Section 2.6, Chilean Intended Nationally Determined Contribution (INDC), September 2015. The INDC is a document
made by those countries that subscribed to the Climate Agreement of Paris in year 2015. In this document, each country stated its contribution to the mitigation of greenhouse effect, and the main public policies that will develop to achieve the objective that have been proposed

D4.4.2 Socioeconomic Impacts of Air Pollution in the Chilean Metropolitan Area Page 1
Table of Contents
1 Introduction ........................................................................................ 4
2 Methods ............................................................................................. 5
2.1 Health .......................................................................................... 5
2.2 Society ....................................................................................... 12
2.3 Human Capital and Labour Supply ..................................................... 14
2.4 Air quality pollution and the global warming ........................................ 16
3 Results ............................................................................................ 19
3.1 The Case of California .................................................................... 21
3.2 The Case of Santiago, Chile.............................................................. 23
3.3 Comparing Santiago to California ....................................................... 27
4 Conclusion and Future Developments ...................................................... 29
4.1 Santiago Respira: atmospheric decontamination plan ............................. 29
4.2 Discussion and Suggestions .............................................................. 31

D4.4.2 Socioeconomic Impacts of Air Pollution in the Chilean Metropolitan Area Page 2
Figures
Figure 1: Changes in Life Expectancy for the 1980s-1990s in 51 U.S metropolitan areas, plotted
against Reductions in PM2.5 concentrations for 1980-2000 ............................................... 6
Figure 2: Smoothed and Least Squares Fits of Total Mortality against the log of PM10 concentrations
for Santiago .................................................................................................... 11
Figure 3: Nº of Deaths Attributable to PM2.5 in Chile ..................................................... 11
Figure 4: 2008-2010 annual averages of fine particle pollution for the monitoring stations in the
Metropolitan Region, Santiago, Chile ...................................................................... 13
Figure 5: Inverted U relationship between Pollution and Income per Capita ........................ 14
Figure 6: Estimation of the Sources of PM2.5 (Ton/year emissions; Share %) ......................... 17
Figure 7: Comparison of Control, No-Control and Trends Total Suspended Particulates Emission
Estimates in the U.S. ......................................................................................... 19
Figure 8: Particulate Matter Concentrations 2008-2013 period for seven cities ..................... 23
Figure 9: Demographic Indicators in Metropolitan Region, Santiago, Chile. 1989-2015 ............ 24
Figure 10: US$ GDP per capita in Metropolitan Region (ref. year 2008) .............................. 25
Figure 11: US$ GDP per capita in Metropolitan Region (ref. year 2008) .............................. 26
Figure 12: PM2.5 and NOx estimated with and without project 1 ....................................... 30
Figure 13: PM2.5 and NOx estimated with and without project 2 ....................................... 30
Figure 14: Estimations of PM2.5 concentrations by source ............................................... 31
Tables
Table 1: Summary of economic benefits table............................................................. 8
Table 2: Summary of economic benefits table............................................................. 8
Table 3: Short-Term Effects of 10am-6pm Average Ozone, 24-Hour Average Respirable Particles
(PM10) and 24-Hour Average Nitrogen Dioxide on School Absence Incidence Rates [Percentage

D4.4.2 Socioeconomic Impacts of Air Pollution in the Chilean Metropolitan Area Page 3
Change and 95% Confidence Limits], Air Pollution and Absence Study, January through June 1996*
................................................................................................................... 15
Table 4: Main regression results of the effect of ozone on productivity .............................. 16
Table 5: Summary of Estimates of Nationwide Emissions ............................................... 20
Table 6: Benefits and Costs of the Clear Air Act for Selected Years .................................. 20
Table 7: Estimated emissions and emissions reductions in Santa Barbara County. .................. 21
Table 8: Cost-Benefit Analysis .............................................................................. 31

D4.4.2 Socioeconomic Impacts of Air Pollution in the Chilean Metropolitan Area Page 4
1 INTRODUCTION
During the last five years, most nations have become increasingly committed to the improvement
of environmental policies. Both international and local actions have been taken in order to improve
environmental indicators. An example is the 2015 Paris agreement. However, countries are still
facing environmental problems at the local level. One of them is air pollution, which is estimate
to cause 6.5 million premature deaths every year, and is the fourth-largest threat of human health
according to the International Energy Agency (IEA).
Emerging countries such as Chile are characterised by their active participation and proactive
contribution in the international environmental agenda. Nevertheless, these countries face
complex challenges in maintaining both economic growth and environmental standards, which
regularly go in opposite directions.
This section analyses the evidence of Santiago de Chile compared to international evidence, in
particular with the case of California in the U.S.A. We focus our analysis in four areas: Health,
Society, Human Capital plus Labour Supply and its relation with climate change.
Since air pollution is a global phenomenon, it is important to review the evidence of policies and
regulations in the rest of the world. We analysed the case of California, which has similar climate
and geography than Chile. We have found that the key to effective policy regulation of stationary
sources is a combination of institutional strength (monitoring systems with good frequency and
good quality data) with a flexible use of tradable emission permits. In addition, both California
and Chile make special efforts regarding the regulation of mobile sources due to their important
contribution to urban air pollution. In the case of Santiago, the management of critical episodes
has demonstrated to be successful in the short run, but not effective in the long run. On the other
hand, stricter goals for the production and use of less polluting vehicles, as in California, appear
to be a successful in reducing pollution in the longer term.
Section III reviews previous studies that analyse the impact of air pollution in Chile. Section IV
discusses the Chilean and the U.S. experience in the design of policies to decrease air pollution,
while section V presents the results of the Chilean strategy. Finally, Section VI presents some
conclusions and future developments.
D4.4.2 Socioeconomic Impacts of Air Pollution in the Chilean Metropolitan Area Page 5
2 METHODS
In this section, we will review relevant studies on air quality (for an extensive review please see
the appendix) and identify the most significant impacts. We found key issues about air pollution
and its impact on health, society, human capital and labour supply. Finally, in this section we
present a novel discussion regarding the relation between air quality and the effect of global
warming.
2.1 Health
According to the World Health Organization (WHO) we can summarize the main effects of long and
short term exposure to PM10 and PM2.5 in:
• “Respiratory and cardiovascular morbidity, such as aggravation of asthma, respiratory symptoms
and an increase in hospital admissions;
• Mortality from cardiovascular and respiratory diseases and from lung cancer.”4
There is recent evidence which supports that long-term exposure to low-quality air cause mental,
behaviour and neurological effects on people (e.g. Ng et al. (2016); Chen and Schwartz (2008)).
Dockery et al. (1993) estimated the effects of air pollution on mortality rates, controlling for
individual factors. They studied a group of 8,111 adults in six U.S cities and found that, even after
adjusting for risk factors, there were statistically significant and robust associations between air
pollution, particularly with extremely fine particles, and mortality. Air pollution was positively
associated with death from lung cancer and cardiopulmonary disease.
Pope et. al. (2009) included socioeconomic and demographic control variables in addition to the
prevalence of cigarette smoking, life expectancy, and air quality for 211 county units in the 51
U.S metropolitan areas. They matched data on fine-particulate air pollution for the late 1970s and
early 1980s and the late 1990s and early 2000s. Figure 1 shows their data. Consistent with previous
evidence, the authors found that a decrease of 10g per cubic meter in the concentration of fine
particulate matter was associated with an estimated increase in mean life expectancy of 0.61
(±0.20) years. In their sample, reductions in air pollution accounted for as much as 15% of the
overall increase in life expectancy observed over the period.
4 WHO, 2013.

D4.4.2 Socioeconomic Impacts of Air Pollution in the Chilean Metropolitan Area Page 6
Figure 1: Changes in Life Expectancy for the 1980s-1990s in 51 U.S metropolitan areas, plotted against Reductions in PM2.5 concentrations for 1980-2000
Source: Pope et al. (2009)

D4.4.2 Socioeconomic Impacts of Air Pollution in the Chilean Metropolitan Area Page 7
Developing countries5 account for more than 75 percent of the 500 most polluted cities in the
world6. He et al. (2016) found evidence that looked to the 2008 Olympic Games as a natural
experiment of air pollution change in Beijing, due to China’s government agreement with the
International Olympic Committee to improve air quality as the host country for the Olympics.
Enforcement of the 2008 Beijing Olympic Games (BOG08) regulations were strict. To assess the
relationship between mortality and air pollution, the study provides insights on how monthly
variations in air pollution affect mortality. They found that a 10 percent decrease in PM10
concentrations resulted in an 8 percent decrease in all-cause mortality rate. They also found the
most affected group was among the most vulnerable: children under 10 and adults over 75.
Other studies in the literature also identify children and the elderly as the two specific groups
most affected by air pollution. The first group, children, is especially important because of the
consequences that early exposure to polluted air has on the quality of the rest of their lives. Currie
et al. (2014) show two kinds of literatures: the first argues that events in early childhood have
effects that last until adulthood; the second explores the effects of air pollution on health. As it
is well known, early life episodes might affect long-term outcomes by changing either human
capital accumulation or participation in the labour force and, consequently, earnings. The authors
carried out an exhaustive review of the relevant literature on this topic. In Table 1 we show
selected reviews taken from Tables 2 and 3 of their study (plus our selected studies presented on
this section). The authors found plenty of evidence supporting the adverse effects of air pollution
in children: low birthweights, worsening infant mortality, higher incidence of respiratory diseases
and lower grades in math and reading tests, among others.
By contrast, Anderson (2016) studied the effects of the exposure to nearby roadway pollution on
mortality among elderly people. He found that highway pollution has economically significant
impacts on life expectancy, with a value of tens of billion dollars in the Los Angeles area alone.
More than a 100 million people are exposed to high levels of air pollution in Latin America, which
makes it one of the most affected regions. Cifuentes et al. (2005) made an extensive investigation
about poor air quality in the main cities of Latin America. They quantified the health impact,
made a cost-benefit analysis and measured the benefits of many scenarios of improvement on the
air quality in these cities. Using data for PM10 in 39 cities in Latin America, the authors considered
two air quality improvement scenarios: (1) a uniform reduction of 10% in the annual PM10
concentration in each city and (2) a scenario in which each city complies with a reference
concentration equal to the current US annual standard for PM10. They also expanded this study
with two different pools of statistical information on public health, two sets of data, and two
different ways to calculate the economic benefits of improved air quality. For the latter criteria
one methodology considers only the direct savings in the overall social cost of illness (COI), and
another measures the benefit enjoyed by everyone in a cleaner environment in the assessment of
5 Under World Bank’s classification
6 According to WHO’s list of most polluted cities in the world between 2010 and 2013, from a sample of 1600 cities in
91 countries.

D4.4.2 Socioeconomic Impacts of Air Pollution in the Chilean Metropolitan Area Page 8
a society’s “willingness to pay” (WTP) for improved air quality as the direct savings from illness
costs. They found that in the first scenario, deaths avoided in Latin American cities are 12 to 25%
of total deaths, while reductions in mortality for the whole sample are between 0.6 and 0.8% in
the first scenario and 2-2.6% in the second scenario. (See Tables 1 and 2).
Table 1: Summary of economic benefits table.
Total benefits (MUS$/year)
Benefits measure
Scenario Uniform 10% PM reduction Meeting USEPA standard
WTP LAC 1,100 670 1,700 1,900 3,300 5,200
USA 11,000 8,900 20,000 16,000 49,000 66,000
COI LAC 73 52 130 130 260 390
USA 1,100 1,100 1,800 1,800 4,400 6,200
Per capita benefits (US$/person/year)
Benefits measure
Scenario Uniform 10% PM reduction Meeting USEPA standard
WTP LAC 17 18 17 44 103 70
USA 175 245 201 374 1,531 883
COI LAC 1 1 1 3 8 5
USA 17 30 22 42 137 83
Benefits as a Percentage of Income (%)
Benefits measure
Scenario Uniform 10% PM reduction Meeting USEPA standard
WTP LAC 0.3% 0.5% 0.4% 0.8% 2.9% 1.4%
USA 3.3% 6.5% 4.3% 6.4% 43.4% 18.1%
COI LAC 0.0% 0.0% 0.0% 0.1% 0.2% 0.1%
USA 0.3% 0.8% 0.5% 0.7% 3.9% 1.7%
Note: "LAC" refers to health impact and economic valuation estimates constructed using information studies in Latin America and the Caribbean. "USA" refers to health impact and valuations
transferred to Latin America from U.S. based studies.
Source: Cifuentes et al. (2005)
Table 2: Summary of economic benefits table.
C1 - 10% reduction
C2 - Annual Standard
Country City Baseline Effects E1 E2 E1 E2
cities with monthly data
Brazil Campinas 5640 16 42
Canoas 1,640 3 12

D4.4.2 Socioeconomic Impacts of Air Pollution in the Chilean Metropolitan Area Page 9
Cubatao 470 2 3 4 8
Porto Alegre 9,130 23 69
Sao Jose Do Campos 2,260 5 16
Sao Paulo 58,300 180 450
Sorocaba 2,710 6 20
Vitoria 1,650 3 12
Chile Calama 644 2 5 4 10
Santiago 30,700 140 240 460 940
Temuco 1,400 4 11
Colombia Bogota 26,000 120 210 190 330
Cali 16,300 55 130
Jamaica Kingston 3,550 21 37 56 110
Mexico Guadalajara 18,600 120 120 190 190
Juarez 4,290 32 25 100 91
Mexico City 107,000 760 690 1,600 1,500
Monterrey 13,000 79 79 130 140
Puebla 5,970 35 38 26 28
Valle de Toluca 4,520 20 26
Panama Panama City 3,930 18 41 62 160
cities with annual data
Argentina Buenos Aires 67100 560 560 3100 4600
Cordoba 11,100 77 93 360 580
Mendoza 6310 9 52
Brazil Caxias 3,940 19 28 59 100
Curitiba 8,570 18 63
Itaguai 407 1 3
Rio de Janeiro 41,500 220 320 830 1400
Sao Joao de Meriti 2,420 18 18 98 140
Costa Rica Heredia 425 3 3 8 13
San Jose 1,590 6 13 4 7
Ecuador Guayaquil 9,980 64 59 230 260
Quito 6,690 33 39 54 67
El Salvador San Salvador 1,970 9 10 19 22
Honduras Tegucigalpa 3,020 15 32 53 140
Nicaragua Managua 3,420 20 19 36 36
Peru Lima 24,700 270 130 1700 1300
Uruguay Montevideo 14,500 160 120 1,100 1,400
Venezuela Caracas 8,640 28 69
A cities 301,000 1640 2280 2820 3510

D4.4.2 Socioeconomic Impacts of Air Pollution in the Chilean Metropolitan Area Page 10
B cities 220,000 1530 1630 7650 10100
All cities 521,000 3170 3910 10470 13610
% of baseline 0.6% 0.8% 2.0% 2.6%
Notes: Figures rounded to 2 significant digits. Totals may not add up exactly.
For E1 the estimates correspond to short-term, all-cause mortality
For E2 they correspond to long-term, cardiopulmonary plus lung cancer mortality
Source: Cifuentes et al. (2005)
There are also studies on health effects of air pollution in Santiago, Chile. Ostro et al. (1999)
conducted an analysis of two years of daily visits to hospitals in Santiago. By using multiple
regression analysis, they found a statistical significant relationship between PM10 and medical
visits. In the case of children under age 2, a 50 g/m3 change in PM10 is associated with a 4-12%
increase in respiratory symptoms. For children 3-15 years of age, the increase in respiratory
symptoms ranges from 3 to 9% for a 50 g/m3 change in PM10
In the case of mortality rates for Santiago, Ostro (1995) collected daily measures of PM10 and data
on mortality respiratory and cardiovascular diseases, excluding accidental deaths. By means of a
multiple regression analysis to explain mortality, the author found a strong association between
air quality and mortality: a change equal to 10-microgram-per-cubic-meter in daily PM10 was
associated with a 1.1 percent increase in mortality, as can be seen in Figure 2. As expected, death
from respiratory and cardiovascular disease was more responsive to changes in PM10 than total
mortality.

D4.4.2 Socioeconomic Impacts of Air Pollution in the Chilean Metropolitan Area Page 11
Figure 2: Smoothed and Least Squares Fits of Total Mortality against the log of PM10 concentrations for Santiago
Source: Ostro et al. (1995)
According to the 2017 report on the State of Global Air, published by the Health Effects Institute
(HEI), 5,900 deaths in 2015 in Chile were due to bad air quality, contrasting with the 3,723 deaths
calculated by the Chilean Ministry of Environment, and 2,822 by the WHO7. As seen in Figure 3,
the data from HEI presents an upward trend. Since there are long-term effects of pollution on
human health, it is expected that this upward trend will continue.
Figure 3: Nº of Deaths Attributable to PM2.5 in Chile
Source: State of Global Air 2017, HEI; Ministry of Environment, Chile; WHO
We have also found some evidence that relates neurobiological and psychiatric health with air
quality. Chen and Schwartz (2008) made an experiment to test long-term exposures to PM and
Ozone in the central nervous system that affect cognitive skills. They found that PM10 did not have
effects on cognitive skills, but each 10-ppb increase in annual ozone was associated with 3.5 to
5.3 years of ageing-related decline in cognitive performance. Ng et al. (2016) studied the
relationship between days with poor air quality and suicides in Tokyo between 2001 and 2011.
They found that higher levels of air pollution were associated with larger suicide rates in some
population groups. These studies were not conclusive, but they illustrate the extent to which air
7 Estimated for year 2012
2000
2500
3000
3500
4000
4500
5000
5500
6000
6500
1985 1990 1995 2000 2005 2010 2015 2020
Healt Effects Institute Ministry of Environment WHO

D4.4.2 Socioeconomic Impacts of Air Pollution in the Chilean Metropolitan Area Page 12
pollution can alter people’s health. Considering that Chile has the second largest increase in
suicide rates among OECD after Korea8, this point can be relevant for further investigation on air
pollution physical and emotional health effects in Santiago.
In summary, there is plenty of strong evidence from different parts of the world supporting the
negative effects of poor air quality on health, particularly with children and elderly people. Long
and short term exposure to high levels of pollution is harmful for respiratory and cardiovascular
systems, and decreases life expectancy.
2.2 Society
An interesting aspect of air pollution is its strong relation with poverty and inequality, both within
and between countries. Deguen and Zmirou-Navier (2010) reviewed the literature and found that
people of lower socio-economic status experienced greater effects of air pollution on their health.
In the U.S. Brooks and Sethi (1997) developed an index to test exposure levels to air pollution
across communities. They found that black communities (which are also highly correlated with
low socio-economic status) faced a greater exposure to air pollution. In addition, the level of
education was negatively related to exposure.
The relation between socio-economic condition and air quality is particularly evident in Santiago.
Rose-Pérez (2015) found that in poorer socio-economic areas, pollution is more widespread than
in the rest of Chile (for fine particles), and have longer time periods of unhealthy air (on average,
they have 21% more days with high levels of air pollution). As depicted in Figure 4, while almost
all monitoring stations present a downward trend in the period, the lowest levels are associated
to high socioeconomic status areas, while the highest are associated to low socioeconomic status.
8 OECD, 2014.

D4.4.2 Socioeconomic Impacts of Air Pollution in the Chilean Metropolitan Area Page 13
Figure 4: 2008-2010 annual averages of fine particle pollution for the monitoring stations in the Metropolitan Region, Santiago, Chile
Source: Rose-Pérez (2015)
While for the moment we have focused on the impact of air pollution on poverty or inequality,
there is related literature that analyses the inverse relation, i.e. the impact of economic
development on the environment. Selden and Song (1994) found that per capita emissions of
suspended particulate matter, sulphur dioxide, oxides of nitrogen and carbon monoxide exhibit
inverted-U relationship with respect to per capita GDP (i.e. pollution decreases and income per
capital increases) of 30 countries from Europe, Americas and Asia. In a more actualized review on
this topic, Dasgupta et al. (2002) showed that, the inverted-U shaped relationship might be flatter
than previously thought due to globalization and regulatory capability – see Figure 5.

D4.4.2 Socioeconomic Impacts of Air Pollution in the Chilean Metropolitan Area Page 14
Figure 5: Inverted U relationship between Pollution and Income per Capita
Source: Dasgupta et al. (2002)
Another line of research argues that inequality might also impact the environment, as people who
are relatively powerful and wealthy typically gain disproportionate benefits from economic
activities that degrade the environment, while poor people typically bear disproportionate costs.
See the review in Boyce (2008). Clement and Meunie (2010) tested this hypothesis and found that
power inequality (measured by political freedom) appear to be relevant in determining pollution
levels.
2.3 Human capital and labour supply
Human capital is a key determinant of socio-economic status, as salaries usually depend on it. We
review next the impact of the environment on human capital, by focusing on (i) school attendance
and (ii) the accumulation of cognitive skills. School attendance has been extensively researched.
For instance, Currie et al. (2009) studied the 39 largest school districts in Texas and found that
higher levels of carbon monoxide significantly increase absentees, even after controlling for other
factors. This relation is also documented for California (Gilliland et al. 2001), Washoe County
(Chen et al. 2000) and Utah Valley (Ransom and Pope, 1992). Table 3 presents evidence from
Gilliland et al. (2001) revealing correlation between pollutants (particularly in O3 and NO2) and
absenteeism due to respiratory illnesses for 12 southern California communities. In Latin America,
Romieu et al. (1992) show that higher levels of air pollution cause respiratory diseases in children
in Mexico City () while Gouveia and Fletcher (2000) have similar evidence for Sao Paulo

D4.4.2 Socioeconomic Impacts of Air Pollution in the Chilean Metropolitan Area Page 15
Table 3: Short-Term Effects of 10am-6pm Average Ozone, 24-Hour Average Respirable Particles (PM10) and 24-Hour Average Nitrogen Dioxide on School Absence Incidence Rates [Percentage Change and 95% Confidence Limits], Air Pollution and Absence Study, January through June 1996*
Pollutant
O3 PM10 NO2
Type of Absence
% Change
95% CL % Chang
e
95% CL % Change
95% CL
All absences
16.3 (-2.6) - (38.9)
22.8 (11.6) - (35.2)
3.4 (-30.6) - (54.0)
Non-illness
21.2 (-12.9) - (69.0)
97.7 (72.6) - (126.5)
34.6 (-43.0) - (218.2)
Illness
62.9 (18.4) - (124.1)
5.7 (-12.1) - (27.0)
-4.6 (-42.4) - (57.8)
Non respiratory
37.3 (5.7) - (78.3) 10.2 (-14.6) - (42.3)
-36.8 (-69.5) - (30.8)
Respiratory**
82.9 (3.9) - (222.0)
-4.3 (-32.2) - (35.0)
19.6 (-36.2) - (124.4)
URI 45.1 (21.3) - (73.7) 5.5 (-6.8) - (19.4) -7.4 (-30.3) - (23.0)
LRI/wc 173.9 (91.3) - (292.3)
-7.7 (-49.2) - (67.7)
-37.5 (-73.9) - (49.4)
LRI/W/A
68.4 (43.4) - (97.8) -7.1 (-34.1) - (30.8)
5.1 (-60.3) - (178.0)
URI=upper respiratory illness; LRI=lower respiratory illness; wc=wet cough; W/A=wet cough/wheeze or asthma attack
*Results are reported for 20 ppb =3, 10µg/m3 PM10, and 10 ppb NO2. Models are fitted using community-specific polynomial-distributed lag models (degree3 with 30-day lag period except URI,
LRI/wc, ad LRI/W/A had 15-day lag periods.
**Fifteen-day lag periods used
Source: Gilliland et al. (2001)
The literature on the impacts of air pollution on cognitive skills is still quite recent. Vishnevetsky
et al. (2015) studied a group of New York City children to assess the relation between a child’s IQ
and prenatal exposure to polycyclic aromatic hydrocarbons (which are produced by incomplete
combustion of organic matter, e.g. power plants or vehicles). They found that a higher exposure
of the mother affects full scale IQ, perceptual reasoning and working memory scores. Lavy et al.
(2014) studied the effects of air pollution on Israeli high-school Bagrut examination scores.
Focusing on fine particulate matter (PM2.5) and carbon monoxide (CO) the authors found a robust
negative relationship with test scores (even considering that these gases are weakly correlated).
In a pilot study Calderón-Garcidueñas et al. (2008) measured the impact of poor air quality in
structural brain alterations using magnetic resonance imaging and cognitive deficits/delays in
healthy children. They found that clinically healthy children living in a highly polluted urban
environment exhibit deficits in fluid cognition, memory, and executive functions compared to
healthy children living in a less polluted environment.

D4.4.2 Socioeconomic Impacts of Air Pollution in the Chilean Metropolitan Area Page 16
Labour supply is also affected by air pollution, through decreasing worker productivity and rising
job absenteeism. Graff Zivin and Neidell (2012) measured the impact of ozone on daily farm
worker output. Table 4 shows their results: a 10 ppb decrease in ozone concentrations increases
agricultural worker productivity by 4.2 percent. Although the applicability of these results to non-
agricultural activities is unclear, this evidence is still significant.
Table 4: Main regression results of the effect of ozone on productivity
Source: Graff Zivin and Neidell (2012)
Hanna and Oliva (2015) measured the impact of air pollution on labour absenteeism in México.
The authors found that a one percent increase in sulphur dioxide results in a 0.61 percent decrease
in the hours worked. These effects on labour supply have economic consequence in gross
production and wages. Rodrigues-Silva et al. (2012) measured the economic cost of absenteeism
due to air pollution in Sao Paulo, Brazil, using traffic controllers’ data of absenteeism and PM10
concentrations. Extrapolating their findings on the economically active population, they found
that air pollution resulted in 129,832 absences per year and a cost of USD 6,472,686 per year.
In summary, there is a strong relationship between human capital formation and labour supply
with air pollution. This relationship has consequences on the total level of production and
productivity in an economy. As we have showed, on one side it affects the quantity of labour
supply (absenteeism) and on the other side, affects its quality (human capital formation and
productivity)
2.4 Air quality pollution and the global warming
According to Roorda (2012), particulate matter also has an impact on climate change. Particles
can either absorb or reflect light depending on their albedo, which can either enhance or
moderates temperature increases. The overall impact depends on the source and the type of
particles emitted.
By the beginning of 2000s, it was discovered that the magnitude of the contribution of a specific
group of particles called black carbon (commonly known as soot) were very high, to the point of

D4.4.2 Socioeconomic Impacts of Air Pollution in the Chilean Metropolitan Area Page 17
being classified as the second most contributing gas to greenhouse effect, after CO2. In Jacobson
(2002) it has been shown that reducing emissions of black carbon might possibly be the best short-
term policy to face global warming. Eliminating all fossil-fuel black carbon plus associated organic
matter could eliminate 20-45% of net warming within 3-5 years, ceteris paribus. This reduction
does not replace a reduction on CO2 which has a similar effect but after 50-200 years. In a later
study Ramanathan and Carmichael (2009) reached similar conclusions.
Bond et al. (2013) assessed the relevance of black carbon in enhancing global warming and its
consequences on the environment. The authors explained that particulate emissions from wildfires
produce both lighter and darker particles, with an approximately neutral overall climate impact.
However, when they studied the effects of particles emitted by diesel combustion and residential
biofuels they found that there was an overall warming impact, as the proportion of black carbon
was much higher. Their main public policy advice focused on the reduction of combustion caused
by diesel.
It should be noted that there are other sources of climate changes in the environment that escape
the objective of this study due to their technical complexity, such as effects on clouds, winds and
different ecosystems. To further explore these sources, we recommend reviewing the extensive
works of Fuzzi et al. (2015) and Bond et al. (2013).
Figure 6: Estimation of the Sources of PM2.5 (Ton/year emissions; Share %)
Source: Ministry of Environment / Study AGIES Plan PM2.5
In the case of Chile, more than half of the composition of PM2.5 is due to combustion of mobile
sources (diesel and gasoline) or households behaviour (combustion of firewood), which according
to Fuzzi et al. (2015) are highly correlated with black carbon. Figure 6 shows that households and
transport represent more than 50% of total PM2.5 emissions. As the government states in their
952%
1182% 157
3%
87415%
110919%
114320%
219139%
Households (non-firewood)
Agricultural burns
Others
Industry
Transport
Off-routemachinery
Households(firewood)

D4.4.2 Socioeconomic Impacts of Air Pollution in the Chilean Metropolitan Area Page 18
Intended Nationally Determined Contribution9, black carbon forms a significant part of the PM2.5
found in Chilean cities. In that case, policies that focus on the reduction of particulate matter are
also contributing to the reduction of global warming.
It follows that the two main environmental objectives: (1) to reduce air pollution and (2) to
contribute to decrease emissions that increase global warming, are complementary and can be
faced through the reduction of PM concentrations - especially those produced by residential
biofuels and diesel engine emissions.
9 Section 2.6, Chilean Intended Nationally Determined Contribution (INDC), September 2015. The INDC is a document
made by those countries that subscribed to the Climate Agreement of Paris in year 2015. In this document, each country
stated its contribution to the mitigation of greenhouse effect, and the main public policies that will develop to achieve
the objective that have been proposed

D4.4.2 Socioeconomic Impacts of Air Pollution in the Chilean Metropolitan Area Page 19
3 RESULTS
In this section, we compare the U.S. and the Chilean experience when facing air pollution. We
also provide a broad view of effective regulation and policies implemented in both countries. To
do so, we select two areas with similar geographical characteristics: Santiago and California.
Within both areas, there are common patterns in the design and implementation of effective
policies or regulations, which may be relevant when designing public policy in other countries.
In the 1970s, the United States implemented two major environmental laws: the Clean Air Act and
the Federal Water Protection Act. Both laws have been lately improved, taking into account new
challenges and technology developments. In this review, we will focus only on the Clean Air Act.
One of the Clean Air Act goals was the creation of the Environmental Protection Agency (EPA),
responsible for establishing a maximum allowable concentration in the air of six major air
pollutants10, those established by the National Ambient Air Quality Standards (NAAQSs). Freeman
(2002) emphasizes that the law did not consider cost criteria. It also established emission
standards for two different sources: mobile (new motor vehicles) and stationary (newly
constructed plants). At the beginning of the 1990s, those targets included cost and human health
considerations.
In Figure 7, we plot emission projections by the EPA for five major air pollutants in different
scenarios: (a) with the application of the Clean Air Act (control), (b) no application of the Clean
Air Act and (c) time trend from 1950 to 1990. It suggests that the observed decreases in pollution
might be the result of the Clean Air Act. The trends of estimated nationwide emissions are in Table
5.
Figure 7: Comparison of Control, No-Control and Trends Total Suspended Particulates Emission Estimates in the U.S.
Source: U.S. Environmental Protection Agency (1997)
10 Sulphur dioxide, nitrogen oxides, particulate matter, carbon monoxide, ozone and lead

D4.4.2 Socioeconomic Impacts of Air Pollution in the Chilean Metropolitan Area Page 20
Table 5: Summary of Estimates of Nationwide Emissions
% Change % Change % Change % Change
Pollutant 1940-1987 1970-1987 1980-1987 1986-1987
Particulate Matter -70 -62 -18 4
Sulphur oxides 16 -28 -13 -1
Nitrogen oxides 186 7 -5 1
Reactive volatile organic compounds 8 -25 -12 1
Carbon monoxide -25 -39 -20 0
Lead NA -96 -89 -6
Source: Environmental Protection Agency, "National Emissions Estimates, 1940-1987", Doc. Nº EPA-450/4-
88-022 (March 1989) p.2)
Since the 1990 amendment, the EPA began to produce public reports known as “Prospective
Analysis” which measured the costs and benefits of air quality regulation and policies. In Table 6,
we present the benefits and costs estimated by the agency. From EPA’s first Prospective Analysis,
Freeman (2002) highlighted that 75 percent of total benefits came from reducing premature
mortality associated with fine particles, and another 8 percentage points of the total benefits
came from reduced incidence of chronic bronchitis from the same cause. In addition, benefits of
eliminating lead in gasoline are about 8 percent of the total. Finally, the author emphasises that
even if all the remaining categories of benefits depended on controlling mobile source emission
rather than lead, their costs would substantially exceed benefits.
Table 6: Benefits and Costs of the Clear Air Act for Selected Years
1975* 1980* 1990* 2000** 2010** 2020**
Benefits $468.00 $1,225.00 $1,644.00 $770.00 $1,300.00 $2,000.00
Costs $18.00 $27.40 $34.30 $20.00 $53.00 $65.00
Net Benefits $450.00 $1,197.60 $1,609.70 $750.00 $1,247.00 $1,935.00
*in billions of 2000 dollars per year
**in billions of 2006 dollars per year, data from “central” estimates
Source: U.S. Environmental Protection Agency (1997 and 2011)
The 1990 amendment added new aims to the original Clean Air Act such as:
Reducing the use of ozone-depleting substances;
Reducing emissions of substances causing acid deposition;
Limiting emissions on air pollutants from specific sources;
Limiting the sources of exposure to Hazardous Air Pollutants;
Protecting and improving visibility in national parks and wilderness area;
Introducing more rigorous norms for motor vehicle pollutant emissions and using
alternative fuels.
Reduction of Sulphur dioxide emissions from power plants.

D4.4.2 Socioeconomic Impacts of Air Pollution in the Chilean Metropolitan Area Page 21
Kuklinska et al. (2015), who made a review of the U.S. and the EU air pollution legislation,
underline that although the enforcement of the law is under the EPA, each state must write its
own State Implementation Plan (SIP), which has to be approved by the EPA. In addition, Kuklinska
et al. (2015) argue that there are some key features common to the U.S. and EU regulation, which
seem to be important for a good institutional framework. Both have institutions that monitor air
quality. To develop those institutions and good regulations, data is essential. Both the US and the
EU look for international standards to develop their own targets, and they often revise their
emissions goals.
Also, both the US and the EU give support to national governments (in the case of the EU) or states
(in the case of the U.S.) to apply general goals into specific policies in each community. According
to Kuklinska et al. (2015), there are four main reasons for the success of the U.S. and EU in
improving air quality, which are:
The enactment and enforcement of international, national and local air quality regulations;
The introduction of best environmental practices and best available technologies;
The funding for ecological activities in the protection of air;
The promotion of clean energy-efficient transport vehicles.
3.1 The Case of California
In the 80s and the beginnings of the 90s, California was one of the most polluted states in the US
and had the most polluted area, San Joaquin Valley. In that context, California implemented
various policies to reduce air pollution that were quite successful. According to Lurmann et al.
(2015), in the 1993-2012 period, despite a 66% GDP growth, 30% increase in population and a 38%
increase in motor vehicle activity, total estimated emissions of NOx, ROG (reactive organic gases),
SOx, PM2.5 and PM10 decreased by 54%, 65%, 40%, 21% and 15% respectively in Southern California.
See Table 7.
Table 7: Estimated emissions and emissions reductions in Santa Barbara County.
1993-2012 Emission changes in ton/day
Source type NOx ROG SOx PM2.5 PM10
Stationary -1.8 -3.9 2.9 0.0 0.1
Areawide -0.1 -1.0 0.0 0.1 1.4
On-road motor vehicles -17.8 -15.8 -0.5 -0.2 0.6
Other mobile sources 29.7 -0.3 20.8 2.6 2.7
Total 10.0 -21.0 23.2 2.6 4.8
1993-2012 Emission changes in percent
Stationary -20% -28% 177% -3% 6%
Areawide -3% -8% -1% 2% 10%
On-road motor vehicles -57% -73% -88% -13% 11%

D4.4.2 Socioeconomic Impacts of Air Pollution in the Chilean Metropolitan Area Page 22
Other mobile sources 68% -4% 140% 90% 87%
Total 12% -37% 136% 23% 20%
Source: U.S. Lurmann et al. (2015)
Road vehicles showed large reduction in emissions, most probably due to the Low Emission Vehicle
(LEV I and II) program – Lurmann et al (2015). In addition, emissions from stationary sources fell
significantly in the 1980s, after the first package of regulations, but thereafter emission reductions
have stalled. In 1988, the SCAQMD11 adopted an aggressive SIP plan to control essentially all
sources of emissions, regardless of their size. It introduced a policy on zero-emission vehicles and
a large reduction (over 80 percent) in emissions on newly “to-be-developed” technologies.
Concurrently it developed a plan of commercialisation of cleaner technologies and clean-burning
fuels. In the early 1990s, the SCAQMD also implemented a plan to introduce market incentives for
emissions of NOx and SO2: the RECLAIM program allowed businesses that met their reduction
targets to trade/sell their credits on the open market.
In 1998 CARB12 identification of diesel PM as a toxic contaminant led to the development and
adoption of a diesel reduction plan in 2000. The plan included:
New regulatory standards for all new on-road, off-road, and stationary diesel-fuelled
engines and vehicles to reduce diesel PM emissions by 90% overall from their 2000 levels;
New requirements for existing on-road, off-road, and stationary diesel-fuelled engines and
vehicles;
Phase 2 diesel fuel regulations to reduce Sulphur content levels of diesel fuel to no more
than 15 ppm.
The implementation of the San Pedro Bay Ports Clean Air Action Plan (CAAP) in 2006 dramatically
reduced emissions from port-related cargo movements. This plan established ways to reduce
emissions from heavy-duty trucks servicing the ports.
All these policies were beyond the requirements by the NAAQS, and were developed for the
specific area of Southern California. Although it is hard to identify which of these policies had the
greatest impact and at what time, together these policies contributed to a significant decrease in
reducing emissions of polluting gases.
The San Joaquin Valley is an interesting case in California. Besides being the most polluted area
of the country, it has similar features with Santiago: same weather (cool semi-arid climate with
Mediterranean patterns, warm dry summers and cool humid winters), and similar geographical
surroundings (it is surrounded by mountains, hindering ventilation). Lighthall and Capitman (2007)
argue that the situation if the San Joaquin Valley was the result of:
11 The South Coast Air Quality Management District
12 California Air Resources Board

D4.4.2 Socioeconomic Impacts of Air Pollution in the Chilean Metropolitan Area Page 23
Serious regulatory barriers;
Poor coordination between institutions;
Lack of stimulation of technological change in mobile sources; and
Lack of room for interaction with politicians even though there was a high concern among
the population.
3.2 The Case of Santiago, Chile
Santiago was one of the most polluted cities in Latin America at the beginning of the 90s due to
weather conditions such as atmospheric inversion (which hinders the dispersion of polluting gases)
the extension of the city and pollution associated to people concentration. Figure 8 shows a
comparison of different much polluted cities: Santiago has similar concentration levels of PM2.5
than Mexico City.
Figure 8: Particulate Matter Concentrations 2008-2013 period for seven cities
Source: WHO database
In Chile, the environmental legal framework was delayed in its development. While the US started
to develop policies to control air pollution in the 1960s, in Chile the first serious approach to the
development of a regulatory framework was in 1990, after several commissions and studies that
failed to produce any specific environmental law (Camus and Hajek, 1998). In 1990, the National
Environmental Commission (CONAMA) was created by decree. That institution was in charge of
defining and proposing a legal framework to care for the environment.
0
20
40
60
80
100
120
140
160
180
London Los Angeles Mexico City Santiago deChile
Johannesburg Beijing Abu Dhabi
PM 2.5 PM 10 Source: WHO database

D4.4.2 Socioeconomic Impacts of Air Pollution in the Chilean Metropolitan Area Page 24
In 1994, the Law on General Rules of the Environment (nº19.300), designed by CONAMA, was
published. However, it was not until 1997 that the regulation was enforced by law. In 2010,
following the recommendations made by the OECD, the Ministry of Environment was created,
replacing the CONAMA. This gave the environmental issue a ministry status.
Since the creation of CONAMA, Santiago has improved its air quality markedly. Despite population
growth, the vehicle fleet, or the GDP growth in the Metropolitan Region PM2.5 has been reduced
by 68% and the PM10 by 38% (see Figures 9 and 10).
Figure 9: Demographic Indicators in Metropolitan Region, Santiago, Chile. 1989-2015
Source: Instituto Nacional de Estadísticas, Chile.
0
1
2
3
4
5
6
7
8
1989 1994 1999 2004 2009 2014
Mill
ion
s
Population Fleet
D4.4.2 Socioeconomic Impacts of Air Pollution in the Chilean Metropolitan Area Page 25
Figure 10: US$ GDP per capita in Metropolitan Region (ref. year 2008)
Source: Ministry of Environment, Government of Chile.
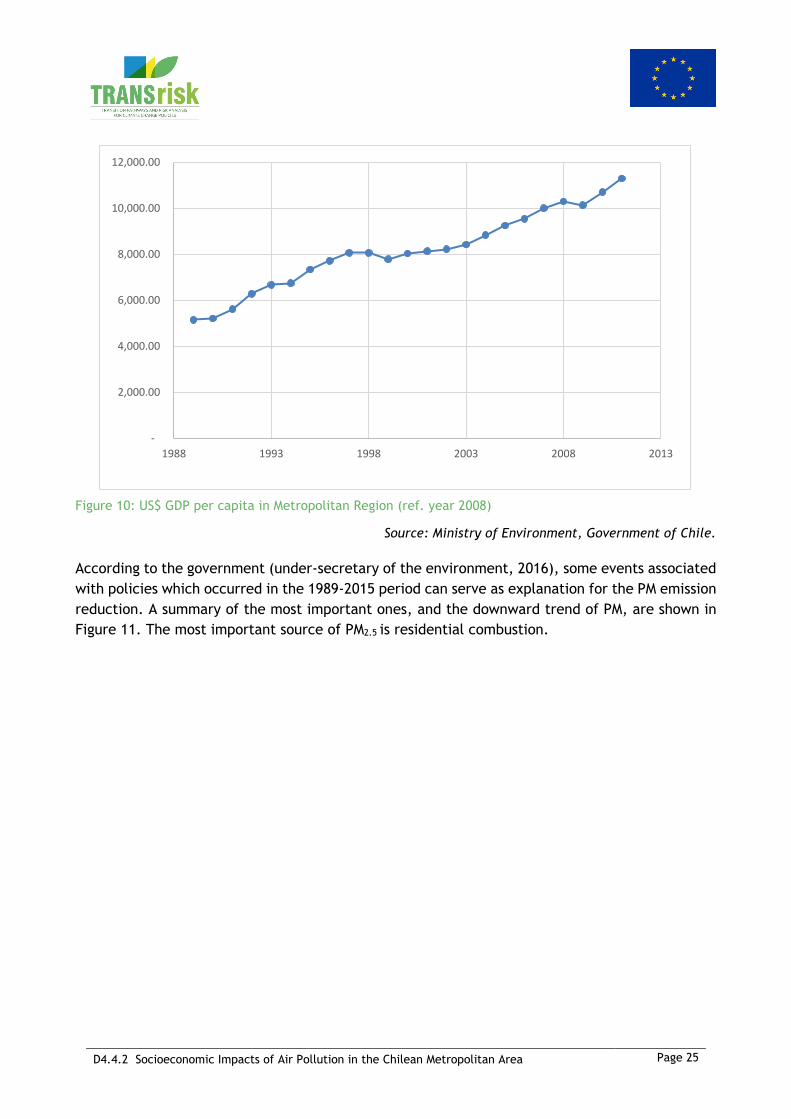
According to the government (under-secretary of the environment, 2016), some events associated
with policies which occurred in the 1989-2015 period can serve as explanation for the PM emission
reduction. A summary of the most important ones, and the downward trend of PM, are shown in
Figure 11. The most important source of PM2.5 is residential combustion.
-
2,000.00
4,000.00
6,000.00
8,000.00
10,000.00
12,000.00
1988 1993 1998 2003 2008 2013

D4.4.2 Socioeconomic Impacts of Air Pollution in the Chilean Metropolitan Area Page 26
Figure 11: US$ GDP per capita in Metropolitan Region (ref. year 2008)
Source: Department of monitoring networks, Ministry of Environment, Government of Chile, 2016.
We focus next on reviewing evidence on the impact of these policies. The most studied policy is
the plan to address critical pollution episodes, issued by a 1998 supreme decree. This plan manages
emission from mobile and stationary sources when the concentration levels of pollutants exceeds
certain levels, describing different states of alert, pre-emergency and emergency situations
according to pollution levels. In each environmental critical state, a specific plan is activated,
such as an automobile driving ban, restrictions on industrial production and the use of firewood in
homes.
Troncoso et al. (2012) measured the impact of the alert and pre-emergency restrictions in the
2000-2008 period, in the concentration levels of CO, SO2, NOx, PM10 and PM2.5. They found that
restrictions led to large reductions in the concentrations of all these pollutants except SO2 (which
is more associated with industrial pollution than mobile sources) during weekdays. For weekends,
they found only marginal effects on CO from the restrictions before 2007. Mullins and Bharadwaj
(2014) also found a significant effect in the short-term. They estimated that the announcement
of environmental episodes reduces concentrations of PM by approximately 20% on the day of

D4.4.2 Socioeconomic Impacts of Air Pollution in the Chilean Metropolitan Area Page 27
implementation. They also found that these episodes reduce mortality among the elderly on the
day of implementation and days after the episode implementation.
Another policy to reduce air pollution was the implementation of Transantiago, a metropolitan
transport plan to renew the public fleet with greener and more efficient buses. In addition, it
replaced a free-market private transportation system with a centralised public transportation
system. To measure the impact of Transantiago on car use by citizens, Gallego et al. (2013) found
a rapid substitution from the public transportation system to a private solution, which led to an
increase in the vehicle fleet, increased road congestion and therefore increased air pollution. In
the short run the authors found no impact on CO emissions, while in the long run they found an
increase in CO due more cars and congestion.
Finally, another relevant policy was the introduction of tradable emission permits in Santiago -
Supreme Decree 4 and Supreme Decree 16. As Coria and Sterner (2008) state, the first decree
established an individual cap for emissions of industrial and residential boilers and a tradable
permit program. The second decree modified the quantity of allowed emissions for existing
boilers. When evaluating the performance of this policy, the authors found that 46.3% of the initial
allocation of permits was void and 38% of those voided permits have been lost because incumbent
sources did not trade before the legal deadline. The aggregate cap of emissions has been
respected, but the new source did not offset their emissions during the first year of the program.
According to Montero et al. (2002), this is due to the lack of institutional capability to regulate
stationary sources.
Coria and Sterner (2008) made a rather critical analysis on the effectiveness of the program. They
proposed modifications, such as: better measurement of emissions; increase certainty on the
tenure of permits; the avoidance of rules that hamper trade; and allowing banking in some form.
Despite being successful in terms of emissions, this policy has many challenges in the sense of
flexibility, incentives to the population and enforcement of the law.
3.3 Comparing Santiago to California
Although Santiago and California are not completely comparable in size, geographical conditions
or productive activities, we can make a general analysis of both experiences when combating air
pollution. In relation to the regulation of stationary sources, both use tradable permits. The key
to succeed and achieve effective policy seems to be a combination of institutional strength
(monitoring systems with good frequency and good quality data) with a flexible use of tradable
emission permits.
Both make special efforts on the regulation of mobile sources due to its important contribution to
air pollution. In the case of Santiago, the management of critical episodes has shown to be
successful in the short run; however it is not effective for achieving longer term air quality
improvements. On the other hand, stricter goals in the production and use of less polluting
vehicles, as California does, appears to be a successful path to improve air quality over the longer

D4.4.2 Socioeconomic Impacts of Air Pollution in the Chilean Metropolitan Area Page 28
term. Also, if the right incentives are put in the promotion of less polluting vehicles with more
environmentally friendly technologies, it is possible to get an even more pronounced reduction in
emissions.

D4.4.2 Socioeconomic Impacts of Air Pollution in the Chilean Metropolitan Area Page 29
4 CONCLUSION AND FUTURE DEVELOPMENTS
To conclude, we will review the current air quality plan for Santiago that was recently launched
by the Ministry of Environment. We will then suggest some improvements to the plan.
4.1 Santiago Respira: atmospheric decontamination
plan
To improve air quality, the under-secretary of the Environment developed a new air quality plan
whose main goal is to achieve national targets of emissions for PM2.5, PM10, O3, CO, NO2 and SO2
gases over a ten-year period (to 2026).
In the Draft “Plan for the Prevention and Atmospheric Decontamination for the Metropolitan
Region of Santiago” approved by the Ministry of Environment in 2015, proposals were categorised
under sources and courses of action such as: mobile sources, stationary sources, education and
management of critical events. The main proposals are the following:
Mobile sources and Management of Critical Events
Euro VI standard for the Transantiago fleet
Emphasis on emissions in automobile technical review plants
Low emission zone for cargo
Incentives to purchase hybrid and electric vehicles
Permanent restriction by seniority to vehicles without green seal in the winter
Stationary sources and Management of Critical Events
New emissions standards for Industry
Continuous monitoring systems for large sources of emissions
New standards for generators
Prohibition of use of heaters and wood stoves in Greater Santiago
Since the publication of the Decree the use of stoves, open hearth fireplaces and
homemade heaters are banned
Education and Others
The creation of a Green Fund for carbon offsetting projects
The construction of 300 kilometers of bicycle paths and parking for 3000 bicycles
An increase of green areas and mass of vegetation surrounding the basin of Santiago (100
new hectares)
Environmental education program and information dissemination campaigns

D4.4.2 Socioeconomic Impacts of Air Pollution in the Chilean Metropolitan Area Page 30
In the under-secretary’s presentation of the plan emission reductions was projected for PM2.5 and
NOx due to(i) higher technological standard for Transantiago’s fleet and (ii) the creation of a Low
Emissions Zone within the ring formed by the Americo Vespucio avenue. The presentation also
showed the expected reductions of PM2.5 in daily concentrations by source. See Figures 12, 13 and
14.
Figure 12: PM2.5 and NOx estimated with and without project 1
Source: Department of monitoring networks, Ministry of Environment, Government of Chile. 2016
Figure 13: PM2.5 and NOx estimated with and without project 2
Source: Ministry of Environment, Government of Chile

D4.4.2 Socioeconomic Impacts of Air Pollution in the Chilean Metropolitan Area Page 31
Figure 14: Estimations of PM2.5 concentrations by source
Source: Ministry of Environment, Government of Chile
Finally, to measure the impact and sustainability of these measures the under-secretary showed
a cost-benefit analysis of the proposed policies. The plan is projected to create great benefits for
the population, without large costs. Table 8 shows the cost-benefit analysis.
Table 8: Cost-Benefit Analysis
Sector B/C
In Millions of USD
Transport Sector 3.4
Benefits $7,706.66
Industry 5.6
Costs $1,687.06
Agro industrial Sector 10.1
Residential Sector 111.6
Overall 4.6
Source: Ministry of Environment, Government of Chile
After the approval of the Ministry of Environment, the draft was subject to public consultation
where there were no major changes. It is expected that implementation of the plan will start in
2017.
4.2 Discussion and suggestions
We classified the main criticisms to the specific project and institutional environmental framework
in four areas: the changes in the industrial emissions policy, the arbitrariness of vehicle restriction
policy, the lack of ‘neatness’ in cost benefit analysis, as well as control and institutional
coordination problems.

D4.4.2 Socioeconomic Impacts of Air Pollution in the Chilean Metropolitan Area Page 32
The first criticism argued that the main change of this new air quality project was the abolition
of the old institution of targets for emissions (see Katz, 2016). The author criticises the
measurement of emissions for industry in the new regulation (concentration in emissions), because
it anticipates that given the entry of new industrial activities (own growth) despite short-term
improvements entailing rules, this would goes in the opposite direction in the medium term. It
argues that the plan should be reformulated conceptually and maintain the restrictions on unit
mass emissions across all sectors. The new project eliminates the quota system and transactions
and replaces rules in concentration, the opposite of what Katz proposed. The author emphasises
how successful this policy has been in recent years: the industrial sector has been the only one
who has met the targets, so abolishing this institution does not make sense. Similar to Katz’s
proposal, the authors in Libertad y Desarrollo (2016) stress that the new industrial policy has an
adverse effect in the long term for the same reasons presented before.
The second, and probably most criticised, measure is the vehicle fleet subject to the alert, pre-
emergency and emergency restrictions. Every car older than 2012, even with green seal, is subject
to strict and permanent restrictions during autumn and fall. Katz (2016) says that this innovation
is completely irrelevant in order to improve air quality; the author even labelled it as a regressive
measure because it will affect people who cannot afford a newer car. Fulgueiras and Dardati
(2016), Katz (2016) and Libertad y Desarrollo (2016) agree on the arbitrariness and lack of
seriousness of the measure.
To develop a plan of this magnitude, a cost-benefit or cost-effectiveness analysis to assess the
sustainability of the policy is essential. Fulgueiras and Dardati (2016) question the depth of what
was presented by the government agency, providing relevant insights of what was missing in the
cost-benefit analysis as an example of how incomplete it is. For instance, the authors say that the
costs are undervalued because the Draft does not consider adjustment and control costs. On the
other hand, they say that benefits are overvalued, because they do not consider (negative) side
effects of its policies (e.g. the incentive many people have to buy a second car to avoid the
restriction for older cars). Libertad y Desarrollo (2016) emphasise the sub valuation of the costs,
they argue that in the case of the cars restriction measure, the government is not considering the
cost associated with the residual value of cars which are removed from circulation.
The last criticism we could find in the national and international discussion is broader than the
Draft, involving the institutional framework. In a study published by the OECD (2016), they make
a broad review of the environmental performance of the country. One of the most important
challenges they highlighted is the need for improvement in the control of existing institutions. In
spite of the fact that institutions and technical resources have substantially improved, targets
would not be reached without better control/monitoring. Since the beginning of the plan, the
organisation is quite emphatic on citizen participation. They also criticise the lack of inter-
institutional coordination and participation of local actors making it difficult for the enforcement
of decontamination plans.
To the discussion already presented, we would like to add two criticisms of the project. The first
relates to the omission of what has become the main source of pollution: burning firewood in
households. We believe that it is essential to identify the households that are doing this, where

D4.4.2 Socioeconomic Impacts of Air Pollution in the Chilean Metropolitan Area Page 33
they are located, why are they using firewood, etc. It seems there is no consensus in the public
debate, on who we are referring to when we address this particular type of pollution. This
information is essential to establish subsidy schemes, improve the insulation of houses, and thus
reduce the main source of pollution in Santiago. It seems incredible that we ignore this much
about the main source of contamination.
The second criticism is that the public transport system has not been considered as a measure to
reduce environmental pollution. If it undergoes substantial improvement, we would expect a large
effect on the substitution of private cars with public transport options, which would lead to less
pollution by reducing the number of cars on the road. Regardless of other possible positive
externalities, we believe it is essential to understand the improvement of Transantiago as a
possible solution to the problem of air pollution.
Furthermore, diesel is the main public transportation consumption fuel. For that reason, in terms
of both policies: air quality and global warming, we recommend to review, the current level of
taxation of diesel, and try to introduce de cost of negative externalities that are not currently
being considered.
D4.4.2 Socioeconomic Impacts of Air Pollution in the Chilean Metropolitan Area Page 34
References
Anderson, Michael L. 2016. “As the Wind Blows: The Effects of Long-Term Exposure to Air Pollution
on Mortality”. NBER Working Paper 21578.
Bond, Tami C et al. 2013. “Bounding the role of black carbon in the climate system: A scientific
assessment”. Journal of Geophysical Research: Atmospheres, 118: 5380-5552.
Boyce, J.K. (2008) “Is inequality Bad for the Environment?”, Research is Social Problems 15: 267-
288.
Calderón-Garcidueñas, Lilian et al. 2008. “Air pollution cognitive deficits and brain abnormalities:
a pilot study with children and dogs” Brain and Cognition. 68: 117-127.
Camus, Pablo and Ernst R. Hajek. 1998. Historia Ambiental de Chile. Santiago, Chile: Ecology
Department, Biological Science Faculty, Pontifical Catholic University of Chile.
Chen, Jiu-Chiuan and Joel Schwartz, 2008. “Neurobehavioral effects of ambient air pollution on
cognitive performance in US adults”. Neurotoxicology. 30(2): 231-239.
Chen, Lei, et al. 2000. “Elementary School Absenteeism and Air Pollution” Inhalation Toxicology.
12: 997-1016.
Cifuentes, Luis, Alan J. Krupnick, Raúl O’Ryan and Michael A. Toman. 2005. Urban Air Quality and
Human Health in Latin America and the Caribbean. [pdf] Available at:
<http://www.cepal.org/ilpes/noticias/paginas/5/22145/Cifuentes%20et%20al.%20reporte%20-
%20IADB.pdf>. [Accessed 21 February 2017]
Clement, Matthieu, Andre Meunie, 2010. “Is Inequality Harmful for the Environment? An Empirical
Analysis applied to Developing and transition Countries” Review of Social Economy. 68(4): 413-
445.
Coneus, K., and Spiess, K. C. 2010. “Pollution exposure and infant health: Evidence from Germany”
German Socio-Economic Panel Working Paper No. 312
Currie, Janet, Eric Hanushek, E. Megan Kahn, Matthew Neidell and Steven Rivkin, 2009. "Does
Pollution Increase School Absences?", The Review of Economics and Statistics, 91(4): 682-694.
Currie, Janet, Joshua Graff Zivin, Jamie Mullins and Matthew Neidell, 2014. "What Do We Know
About Short- and Long-Term Effects of Early-Life Exposure to Pollution?" Annual Review of
Resource Economics. 6(1): 217-247.
Currie, Janet, and Matthew Neidell, 2005. “Air pollution and infant health: What can we learn
from California’s recent experience?” Quarterly Journal of Economics, 125: 1003–1030.
Dasgupta, Susmita, Benoit Laplante, Hua Wang and David Wheeler, 2002. “Confronting the
Environmental Huznets Curve” The Journal of Economic Perspectives. 16(1): 147-168.
Deguen, Séverine, Denis Zmirou-Navier, 2010. “Social inequalities resulting from health risks
related to ambient air quality –A European review”. European Journal of Public Health. 20(1): 27-
35.

D4.4.2 Socioeconomic Impacts of Air Pollution in the Chilean Metropolitan Area Page 35
Dockery, Douglas W, C. Arden Pope III, Xiping Xu, John D. Spengler, James H. Ware, Martha E.
Fay, Benjamin G. Ferris and Frank E. Speizer. 1993. “An Association Between Air Pollution and
Mortality in six U.S. cities”. New England Journal of Medicine 329(24): 1753-59.
Economic Commission for Latin America and the Caribbean (ECLAC)/Organisation for Economic
Co-operation and Development (OECD). Evaluaciones del desempeño ambiental: Chile 2016. [pdf]
Available at: <http://repositorio.cepal.org/bitstream/handle/11362/40308/S1600413_es.pdf>.
[Accessed 21 February 2017]
Freeman, A. Myrick. 1982. Air and Water Pollution Control: A Benefit-Cost Assessment. New York:
John Wiley.
Freeman, A. Myrick. 2002. “Environmental Policy Since Earth Day I: What Have We Gained?”
Journal of Economic Perspectives. 16(1): 125-146.
Fulgueiras, Mariana and Evangelina Dardati. 2016. “¿Podrá Respirar Santiago?: Una Mirada al Nuevo
plan de descontaminación atmosférica” Observatorio Económico. Nº102.
Fuzzi, Sandro et al. 2015. “Particulate matter, air quality and climate: lessons learned and future
needs” Atmospheric Chemistry and Physiscs. 15: 8217-8299.
Gallego, Francisco, Juan-Pablo Montero and Christian Salas. 2013. “The effect of transport policies
on car use: Evidence from Latin American cities”. Journal of Public Economics. 107: 47-62.
Gilliland, Frank, Kiros Berhane, Edward Tappaport, Duncan Thomas, Edward Avol, James
Gauderman, Stephanie London, Helene Margolis, Rob McConnell, Talar Islam and John Peters,
2001. “The Effects of Ambient Air Pollution on School Absenteeism Due to Respiratory Illness”.
Epidemiology. 12: 43-54.
Graff Zivin, Joshua and Matthew Neidell, 2012. “The impact of pollution on worker productivity,”
American Economic Review, 102(7): 3652-3673.
Hanna, Rema and Paulina Oliva, 2015. "The effect of pollution on labour supply Evidence from a
natural experiment in Mexico City," Journal of Public Economics. 122: 68-79.
He, Goujun, Maoyong Fan and Maigeng Zhou. 2016. “The Effects of Air Pollution on Mortality in
China: Evidence from the 2008 Beijing Olympic Games”. Journal of Environmental Economics and
Management. 79: 18-39.
Health Effects Institute. State of Global Air 2017. [pdf] Available at:
<https://www.stateofglobalair.org/sites/default/files/SOGA2017_report.pdf> [Accessed 21
February 2017]
Jacobson, Mark Z. 2002. “Control of fossil-fuel particulate black carbon and organic matter,
possibly the most effective method of slowing global warming”, Journal of Geophysical Research:
Atmospheres, 107(D19): 16-1 – 16-22.
Janke, Katharina, Carol Propper, and John Henderson, 2009. “Do current levels of air pollution
kill? The impact of air pollution on population mortality in England”. Health Economics, 18(9),
1031 - 1055.
D4.4.2 Socioeconomic Impacts of Air Pollution in the Chilean Metropolitan Area Page 36
Katz, Ricardo, 2016. “El anteproyecto del Plan de Prevención y Descontaminación Atmosférica.
Resumen de principales medidas.” Puntos de Referencia, Centro de Estudios Públicos. [e-journal]
Online Edition Nº 424: 1-12. Available through CEP website
<https://www.cepchile.cl/cep/site/artic/20160404/asocfile/20160404162532/pder424_katz.pdf
>[Accessed 21 February 2017]
Knittel, Cristopher R., Douglas L. Miller and Nicholas J. Sanders, 2016. “Caution, drivers! Children
present: Traffic, Pollution, and Infant Health” The Review of Economics and Statistics 98(2): 350-
366.
Kuklinska, Karolina, Lidia Wolska and Jacek Namiesnik. 2015. “Air quality policy in the U.S. and
the EU – a review”. Atmospheric Pollution Research. 6:129-137.
Lavy, Victor, Avraham Ebenstein and Sefi Roth, 2014. “The impact of short term exposure to
ambient air pollution on cognitive performance and human capital formation”. NBER Working
Paper 20648.
Laurent, Olivier, Denis Bard, Laurent Filleul and Claire Segala, 2007. “Effect of socioeconomic
status on the relationship between atmospheric pollution and mortality”. Journal of Epidemiology
and Community Health. 61: 665-675.
Libertad y Desarrollo, 2016. “Medidas para Descontaminar Santiago: ¿son Costo-Efectivas?”. Temas
Públicos, Instituto Libertad y Desarrollo. [e-journal] Nº1249-2. Available through LyD website
<http://lyd.org/wp-content/uploads/2016/04/TP-1249-MEDIDAS-PARA-LA-
DESCONTAMINACIÓN.pdf>[Accessed 21 February 2017]
Lighthall, D., and John Capitman. 2007. The Long Road to Clean Air in the San Joaquin Valley:
Facing the Challenge of Public Engagement. [pdf] Available at:
<https://www.fresnostate.edu/chhs/cvhpi/documents/air-quality-report-2007.pdf>. [Accessed
21 February 2017]
Ministry of Environment, Government of Chile, 2015. Anteproyecto del Plan de Prevención y
Descontaminación Atmosférica para la Región Metropolitana de Santiago. Santiago, Chile.
Available at:
<http://www.santiagorespira.gob.cl/pdf/Anteproyecto_del_Plan_de_Prevencion_y_Descontaminacion_
atmosferica_para_la_Region_Metropolitana_de_Santiago.pdf> [Accessed 21 February 2017]
Montero, Juan-Pablo, José M. Sánchez and Ricardo Katz, 2002. “A Market-Based Environmental
Policy Experiment in Chile”. Journal of Law and Economics. 4: 267-87.
Mullins, Jamie and Prashant Bharadwaj, 2014. “Effects of Short-Term Measures to Curb Air
Pollution: Evidence from Santiago, Chile” American Journal of Agricultural Economics. 97(4):
1107-1134.
Neidell, Matthew, 2004. “Air Pollution, Health, and socio-economic status: the effect of outdoor
air quality on childhood asthma” Journal of Health Economics 23(6): 1209-1236.
Ng, Chris Fook Sheng, Andrew Stickley, Shoko Konishi and Chiho Watanabe. 2016. “Ambient air
pollution and suicide in Tokyo, 2001-2011”. Journal of Affective Disorders. 201, 194-202.

D4.4.2 Socioeconomic Impacts of Air Pollution in the Chilean Metropolitan Area Page 37
Organisation for Economic Cooperation and Development (OECD). 2014. Suicides. OECD Factbook
2014: Economic, Environmental and Social Statistics. [pdf] Available at: <http://www.oecd-
ilibrary.org/docserver/download/3013081e.pdf?expires=1487710810&id=id&accname=guest&che
cksum=8C0ACA0715AAB71983A701314B3925C1>. [Accessed 21 February 2017]
Ostro, Bart, José M. Sánchez, Carlos Aranda and Gunnar S. Eskeland, 1995. “Air Pollution and
Mortality: results from Santiago, Chile”. Policy Research Working Paper 1495. The World Bank.
Ostro, Bart, Gunnar S. Eskeland, José M. Sánchez and Tarhan Feyzioglu, 1999. “Air Pollution and
Health Effects: A Study of Medical Visits among Children in Santiago, Chile”. Environmental Health
Perspectives 107(1): 69-73.
Park, Hyesook, Boeun Lee, Eun-Hee Ha, Jong-Tae Lee, Ho Kim and Yun-Chul Hong, 2002.
“Association of Air Pollution with Absenteeism Due to Illness”, Archives of Paediatric & Adolescent
Medicine. 156: 1235-1239.
Pope, C. Arden III, Majid Ezzati and Douglas W. Dockery. 2009. “Fine-Particulate Air Pollution and
Life Expectancy in the United States”. New England Journal of Medicine 360(4): 376-86.
Portney, Paul and Robert N. Stavins. 1990. Public Policies for Environmental Protection.
Washington, DC: Resources for the Future
Ramanathan, Veerabhadran and Gregory R. Carmichael, 2008. “Global and regional climate
changes due to black carbon”. Nature Geoscience. 1 (April): 221-227.
Ransom, Michael and C. Arden Pope, 1992. “Elementary School Absences and PM10 Pollution in
Utah Valley”. Environmental Research. 58: 204-219.
Rodrigues- Silva, Fernando, Ubiratan de Paula Santos, Paulo Hilario Nascimento Saldiva, Luis
Fernando Amato-Lourenço and Simone Georges El Khouri Miraglia, 2012. “Health Risks and
Economic Costs of Absenteeism Due to Air Pollution in Sao Paulo, Brazil”, Aerosol and Air Quality
Research. 12: 826-833.
Roorda, Niko. 2012. Fundamentals of Sustainable Development, London: Routledge Publishers.
Rose-Pérez, Richelle, 2015. “Environmental justice and air quality in Santiago de Chile”. Revista
de Salud Pública. 17(3): 337-350.
Selden, Thomas, Daqing Song, 1994. “Environmental Quality and Development: Is there a Kuznets
Curve for Air Pollution Emissions?”. Journal of Environmental Economics and Management. 27(2),
147-162.
Troncoso, Rodrigo, Louis de Grange and Luis A. Cifuentes, 2012. “Effects of environmental alerts
and pre-emergencies on pollutant concentrations in Santiago, Chile”. Atmospheric Environment.
61, 550-557.
U.S. Environmental Protection Agency. 1997. The Benefits and Cost of the Clean Air Act: 1970-
1990. Washington, D.C.: Office of Policy Analysis.
U.S. Environmental Protection Agency. 2011. The Benefits and Cost of the Clean Air Act from 1990
to 2020: Summary Report. [pdf]. Available at:

D4.4.2 Socioeconomic Impacts of Air Pollution in the Chilean Metropolitan Area Page 38
<https://www.epa.gov/sites/production/files/2015-07/documents/summaryreport.pdf >.
[Accessed 21 February 2017]
Vishnevetsky, Julia, Deliang Tang, Hsin-Wen Chang, Emily L. Roen, Ya Wang, Virginia Rauh, Shuang
Wang, Rachel L. Miller, Julie Herbstman and Federica P. Perera, 2014. “Combined effects of
prenatal polycyclic aromatic hydrocarbons and material hardship on child IQ” Neurotoxicology and
Teratology. 49, 74-80.
World Bank and Institute for Health Metris and Evaluation. 2016. The Cost of Air Pollution:
Strengthening the Economic Case for Action. Washington, DC: World Bank.
World Health Organization. 2013. Health Effects of Particulate Matter.[pdf] Available at:
<http://www.euro.who.int/__data/assets/pdf_file/0006/189051/Health-effects-of-particulate-
matter-final-Eng.pdf>. [Accessed 21 February 2017]
Zweig, Jacqueline, John Ham and Edward Avol, 2009. Air Pollution and Academic Performance:
Evidence from California Schools. [pdf]. Available at:
<http://www.econweb.umd.edu/~ham/test%20scores%20submit.pdf>. [Accessed 21 February
2017]