Embed Size (px)
Citation preview

Sociodemographic and Health-Related Characteristics of Members Aged 20 and Over in the
San Francisco Medical Center Service Population, 2011
Estimates based on data from adults aged 20 and over sampled from the San Francisco Medical Center Service Population who responded to the 2011 Kaiser Permanente Northern California Region Member Health Survey: • Sociodemographic characteristics, including usual mode of transportation • Health status, health conditions, and functional status • Health behaviors and psychosocial risks • Actions members are taking to try to maintain or improve their health • IT access (computer, Internet, email, mobile phone, text messaging) • Preferred methods for receiving health information and health education The Member Health Survey is a project funded by Kaiser Permanente’s Northern California Region Community Benefit Program (CB). These survey results are being made available to the public as part of Kaiser Permanente's commitment to sharing research findings based on our membership that might inform decisions about methods of outreach to improve the health of our communities. This information should not be used as the basis for any professional publication without permission of Dr. Nancy Gordon, and slides used for presentations should credit the Kaiser Permanente 2011 Member Health Survey as the source. We suggest that statistics from this report be referenced as follows: For table footnotes or text references: Data from the 2011 Kaiser Permanente Member Health Survey conducted by the KPNC Division of Research. In a reference list: Gordon NP. Sociodemographic and Health-Related Characteristics of Members in Kaiser Permanente’s Northern California Region – San Francisco MCSP, 2011. Internal report, Division of Research, Kaiser Permanente Medical Care Program, Oakland, CA, January 2013. For further information, go to the Member Health Survey website at www.memberhealthsurvey.kaiser.org or contact Nancy P. Gordon, ScD, Member Health Survey Project Director, Kaiser Permanente Division of Research 2000 Broadway, Oakland, CA 94612 e-mail: [email protected] phone: (510) 891-3587 (KP tie-line: 8-481-3587)

2
Characteristics of Adult Members in Kaiser Permanente's San Francisco Medical Center Service Population, as estimated from the 2011 Kaiser Permanente Adult Member
Health Survey
Report prepared April 2013 Nancy P. Gordon, ScD
Member Health Survey Director Division of Research
Background
The Member Health Survey is a triennial mailed questionnaire survey conducted during the Spring-Summer of a survey year with a randomly selected sample of adults who are current members of the Kaiser Permanente Medical Care Program in Northern California. The primary purposes of the survey are:
• To learn about the health-related needs and interests of the culturally diverse Kaiser Permanente Northern California adult membership, and by extension, members of the communities we serve;
• To provide information for health services planners to make evidence-based decisions about health information and health care service delivery; and
• To support research to improve the health of our members and the communities we serve. The Member Health Surveys project is funded by Kaiser Permanente’s Northern California Community Benefit (CB) Program. This report presents statistics estimated from the 2011 Survey. Similar member health surveys were conducted in 1990, 1993, 1996, 1999, 2002, 2005, and 2008, and reports are available on our website www.memberhealthsurvey.kaiser.org or by request.
From a strategic perspective, the process of identifying high priority health problems and health practices/lifestyle factors known to increase the risk of chronic or acute illness and targeting effective interventions at those persons in the population who are most at risk should lead to improved health status and more cost-effective use of health care dollars. The identification of age-specific prevalence rates for these health problems and lifestyle risks can also be used for forecasting the resources that will be required to provide health services in the future.
Similar to state and national health surveys, the Member Health Survey captures health risk and health status data on a relatively small proportion of the adult population for which information is desired. However, we hope the survey results will provide administrators, program planners, and researchers with a profile of the membership that can be used to identify areas for new or expanded health promotion/health maintenance interventions, social support services, and more efficient medical care delivery; study patterns and costs of care for particular types of patients by linking survey data to computerized and medical record information; and compare the health-related characteristics of their service population across medical center service populations and service areas, as well as with the general population. 2011 San Francisco Medical Center Service Population Survey Sample
In April 2011, questionnaires were mailed to a stratified random sample of approximately
2,649 adult Health Plan members in the San Francisco Medical Center Service Population (MCSP). Members are assigned to an MCSP based on where they receive or would be expected to receive most of their primary care. Only current members who had been continuously enrolled during the three months prior to the survey and had no indication that they required an interpreter to communicate in English were sampled. Two subsequent survey packet mailings were sent over the next several weeks to nonrespondents, with the final wave of questionnaires mailed in mid-August.

3
Participants were also offered the opportunity to answer a secure online version of the questionnaire reached via a link emailed to them or log in at the Member Health Survey Participant Home Page. Phone administration was available on request but not used. Non-eligibles (deceaseds, non-current members, members living outside the main service area) and members for whom Kaiser Permanente nor the U.S. Postal Service had forwarding addresses were dropped from the initial sample and replaced with other randomly selected members of the same age and sex from the same medical service area population. The overall survey response rate for members sampled from this MCSP was 42.4% (47.4% of women and 37.8% of men).
Final Response Rates for the 2011 DOR Member Health Survey by Age-Gender Group, Members Aged 20 and Over in the San Francisco Medical Center Service Population Sample
20-44 45-64 65 and Over 20 and Over
Women 182/542 197/389 184/257 563/1188
(33.6%) (50.6%) (71.6%) (47.4%)
Men 141/587 173/438 171/257 485/1282
(24.0%) (39.5%) (66.5%) (37.8%)
All respondents were assigned a post-stratification weighting factor based on the age-gender distribution of the medical center service population from which they were selected as of the fourth quarter of 2010 (when the sample was pulled). The table below shows the age distributions of women, men, and all adults aged 20 and over after and before applying the post-stratification weighting factor. The estimates of sociodemographic and health-related characteristics in this report are based on weighted survey data.
Women Men All Age Distribution
Wtd % (Unwtd %) Wtd % (Unwtd %) Wtd % (Unwtd %) 20-44 yr 50.2 32.3 49.2 29.1 49.7 30.8 45-64 yr 33.9 35.0 36.9 35.7 35.4 35.3 65 and over 15.9 32.7 13.9 35.3 14.9 33.9
Because the service population samples are small, the precision of the estimates (i.e., confidence intervals around the percentage) are quite large. Please keep this in mind when making comparisons with other sources of data. The statistics contained in this MCSP report may be best used to compare against the Regional Profile report. Since the questionnaire only went out in English and very limited English-speaking members were excluded from the survey sample, non-English speaking members and members with very poor reading ability are not represented in this survey. An internal study that matched survey response status for the 2011 survey to a member race/ethnicity dataset (91% match rate for women and 84% match rate for men) found that among both women and men, nonHispanic White, Chinese, Japanese, and Korean members were more likely to respond than African-American/Other Black, Latino, and Filipino members. The differential race-ethnic response rate, exclusion of non-English speakers and members with very low literacy, and lower response rates among young and middle-aged adults compared with adults aged 20 and over, yields a final weighted respondent sample that underestimates African-American/Blacks and Latino/Hispanic members and overestimates some of the Asian ethnic groups. Finally, results of other surveys suggest that among older members, the very sickest and frailest are unlikely to have responded.

4
For more information about seniors, please refer to the following reports:
• Gordon NP. Gordon NP. Sociodemographic and Health-Related Characteristics of Seniors in Kaiser Permanente’s Northern California Region – San Francisco MCSP, 2011. Internal report, Division of Research, Kaiser Permanente Medical Care Program, Oakland, CA, January 2013.
• Gordon NP. Seniors’ Access to Information Technology and Preferred Methods for Obtaining Health Information and Health Education – San Francisco MCSP, 2011. Internal report, Division of Research, Kaiser Permanente Medical Care Program, Oakland, CA, February 2013.
Description of the Contents of Tables in this Report In the tables, a double dash ( - - ) or gray shaded area signifies that men, women, or people in this age group were either not asked those questions or that the items were not considered relevant to the age group or gender. Table 1 presents estimates of sociodemographic characteristics of adult Health Plan members. Because of the small samples in the different age-gender groups, we recommend using the race-ethnicity data more as a description of the population for which the health-related characteristics are being described.
Table 2 presents estimates of the percentages of adult members who experienced selected chronic diseases and health problems during the previous 12 months, based on self-report unverified by medical record review or physician report. Also included in this table are estimated percentages of members who consider their overall, physical, and emotional/mental health to be excellent, good, fair, or poor, and the extent to which these components of health affect their activities.
Table 3 presents estimates of the percentages of adult members with selected health and lifestyle risks, including tobacco and alcohol use, exercise, dietary behaviors (fat, salt), obesity, stress, hours of sleep, belief about the extent to which health habits/ lifestyle and stress/emotional troubles impact on health, and selected psychosocial stressors experienced during the previous year.
Table 4 presents estimates of the percentages of adult members who took various actions to try to improve their health.
Table 5 presents estimates of the percentages of adult members who received a flu shot for the 2010-2011 flu season, ever had a pneumonia shot (seniors only), and had a routine dental check-up in the past 12 months. (Note: the survey no longer collects self-reported information on recency of screening tests, just whether the most recent screening procedure was done in or out of the health plan).
Table 6 presents estimates of use of complementary and alternative therapies (CAM) by adult members during the previous 12 months.
Table 7 presents estimates of member access to digital tools for communication and health information (mobile phone, text messages, computer, Internet, and email)
Table 8 presents estimated use of different KP and non-KP health information sources during the previous 12 months.
Table 9 presents estimated percentages of adult members who indicated different preferences for receiving health information and learning about how to take care of their health.

5
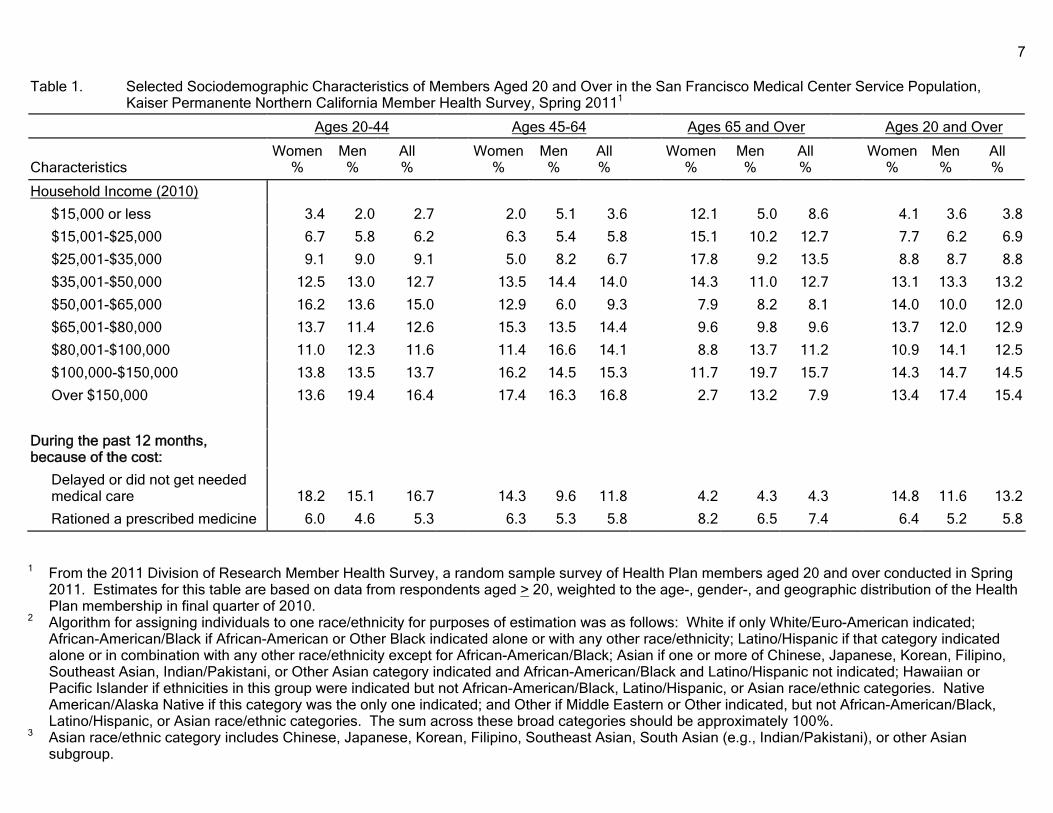
Table 1. Selected Sociodemographic Characteristics of Members Aged 20 and Over in the San Francisco Medical Center Service Population,
Kaiser Permanente Northern California Member Health Survey, Spring 20111
Ages 20-44
Ages 45-64
Ages 65 and Over
Ages 20 and Over
Characteristics
Women
%
Men %
All %
Women
%
Men %
All %
Women
%
Men %
All %
Women
%
Men %
All %
Everyone assigned to only one race/ethnicity by algorithm used in previous MHS reports2
White, non-Hispanic
46.6
55.6
51.0
53.6
56.3
55.0
53.3
63.8
58.2
50.0
57.0
53.5
African-American/Black
6.9
2.6
4.8
7.0
10.3
8.6
13.8
4.8
9.6
8.0
5.7
6.9
Latino/other Hispanic
12.6
13.9
13.2
7.9
11.9
10.0
1.9
7.0
4.2
9.3
12.2
10.7
Asian3
30.5
25.0
27.8
29.2
19.3
24.1
28.2
23.2
25.9
29.7
22.6
26.2
Pacific Islander
0.6
<0.1
0.3
<0.1
<0.1
<0.1
<0.1
<0.1
<0.1
0.3
<0.1
0.1
Native American
<0.1
0.7
0.3
<0.1
0.5
0.2
0.6
<0.1
0.3
0.1
0.5
0.3
Middle Eastern
2.8
1.4
2.2
1.7
1.9
1.8
2.2
1.2
1.8
2.4
1.6
2.0
Other
<0.1
0.8
0.4
0.6
<0.1
0.3
<0.1
<0.1
<0.1
0.2
0.4
0.3
Race/Ethnicity - Calif. Dept. of Finance
Hispanic/Latino
12.6
13.9
13.2
8.5
12.4
10.5
1.9
7.0
4.2
9.6
12.3
10.9
Native Amer./Alaska Native, non-Hispanic
<0.1
0.6
0.3
<0.1
0.4
0.2
0.6
<0.1
0.3
0.1
0.5
0.3
Asian, non-Hispanic
31.1
25.0
28.1
29.2
19.3
24.1
28.2
23.2
25.9
30.0
22.6
26.3
Black, non-Hispanic
6.8
2.6
4.8
7.0
9.8
8.4
13.8
4.8
9.6
8.0
5.6
6.8
White, non-Hispanic
46.7
55.6
51.0
53.6
56.2
55.0
53.3
63.8
58.2
50.1
57.0
53.5
Other, non-Hispanic
2.8
2.3
2.6
1.7
1.9
1.8
2.2
1.2
1.8
2.4
2.0
2.2

6
Table 1. Selected Sociodemographic Characteristics of Members Aged 20 and Over in the San Francisco Medical Center Service Population,
Kaiser Permanente Northern California Member Health Survey, Spring 20111
Ages 20-44
Ages 45-64
Ages 65 and Over
Ages 20 and Over
Characteristics
Women
%
Men %
All %
Women
%
Men %
All %
Women
%
Men %
All %
Women
%
Men %
All %
Education Attainment
< High school graduate
1.6
2.4
2.0
2.0
2.2
2.1
10.7
4.1
7.7
3.2
2.5
2.9
High school graduate/GED
5.4
7.5
6.4
7.7
11.4
9.6
20.7
13.7
17.5
8.7
9.8
9.2
Some college/A.A.
17.6
26.0
21.7
24.3
34.3
29.4
19.1
22.5
20.6
20.1
28.6
24.3
College graduate (BA, BS or higher)
75.4
64.1
69.9
66.0
52.1
58.9
49.5
59.7
54.2
68.0
59.1
63.6
Marital Status
Married/in committed relationship
67.6
66.5
67.1
67.9
66.6
67.2
42.8
74.7
57.5
63.8
67.7
65.7
Widowed
<0.1
<0.1
<0.1
1.8
3.3
2.6
29.9
9.9
20.7
5.3
2.6
4.0
Single, divorced, separated
32.4
33.5
32.9
30.3
30.1
30.2
27.3
15.4
21.8
30.9
29.7
30.3
Employment Status
Working for pay or self-employed
81.8
92.7
87.1
81.3
81.7
81.5
27.3
26.2
26.8
73.1
79.4
76.3
Unemployed, laid off, or on strike
8.4
2.4
5.5
5.0
4.3
4.7
0.6
<0.1
0.3
6.1
2.8
4.4
Not in workforce (student, homemaker, retired, unable to work due to disability)
9.8
4.9
7.4
13.6
14.0
13.8
72.1
73.8
72.9
20.8
17.8
19.3
7
Table 1. Selected Sociodemographic Characteristics of Members Aged 20 and Over in the San Francisco Medical Center Service Population,
Kaiser Permanente Northern California Member Health Survey, Spring 20111
Ages 20-44
Ages 45-64
Ages 65 and Over
Ages 20 and Over
Characteristics
Women
%
Men %
All %
Women
%
Men %
All %
Women
%
Men %
All %
Women
%
Men %
All %
Household Income (2010)
$15,000 or less
3.4
2.0
2.7
2.0
5.1
3.6
12.1
5.0
8.6
4.1
3.6
3.8
$15,001-$25,000
6.7
5.8
6.2
6.3
5.4
5.8
15.1
10.2
12.7
7.7
6.2
6.9
$25,001-$35,000
9.1
9.0
9.1
5.0
8.2
6.7
17.8
9.2
13.5
8.8
8.7
8.8
$35,001-$50,000
12.5
13.0
12.7
13.5
14.4
14.0
14.3
11.0
12.7
13.1
13.3
13.2
$50,001-$65,000
16.2
13.6
15.0
12.9
6.0
9.3
7.9
8.2
8.1
14.0
10.0
12.0
$65,001-$80,000
13.7
11.4
12.6
15.3
13.5
14.4
9.6
9.8
9.6
13.7
12.0
12.9
$80,001-$100,000
11.0
12.3
11.6
11.4
16.6
14.1
8.8
13.7
11.2
10.9
14.1
12.5
$100,000-$150,000
13.8
13.5
13.7
16.2
14.5
15.3
11.7
19.7
15.7
14.3
14.7
14.5
Over $150,000
13.6
19.4
16.4
17.4
16.3
16.8
2.7
13.2
7.9
13.4
17.4
15.4
During the past 12 months, because of the cost:
Delayed or did not get needed medical care
18.2
15.1
16.7
14.3
9.6
11.8
4.2
4.3
4.3
14.8
11.6
13.2
Rationed a prescribed medicine
6.0
4.6
5.3
6.3
5.3
5.8
8.2
6.5
7.4
6.4
5.2
5.8
1 From the 2011 Division of Research Member Health Survey, a random sample survey of Health Plan members aged 20 and over conducted in Spring
2011. Estimates for this table are based on data from respondents aged > 20, weighted to the age-, gender-, and geographic distribution of the Health Plan membership in final quarter of 2010.
2 Algorithm for assigning individuals to one race/ethnicity for purposes of estimation was as follows: White if only White/Euro-American indicated; African-American/Black if African-American or Other Black indicated alone or with any other race/ethnicity; Latino/Hispanic if that category indicated alone or in combination with any other race/ethnicity except for African-American/Black; Asian if one or more of Chinese, Japanese, Korean, Filipino, Southeast Asian, Indian/Pakistani, or Other Asian category indicated and African-American/Black and Latino/Hispanic not indicated; Hawaiian or Pacific Islander if ethnicities in this group were indicated but not African-American/Black, Latino/Hispanic, or Asian race/ethnic categories. Native American/Alaska Native if this category was the only one indicated; and Other if Middle Eastern or Other indicated, but not African-American/Black, Latino/Hispanic, or Asian race/ethnic categories. The sum across these broad categories should be approximately 100%.
3 Asian race/ethnic category includes Chinese, Japanese, Korean, Filipino, Southeast Asian, South Asian (e.g., Indian/Pakistani), or other Asian subgroup.

8
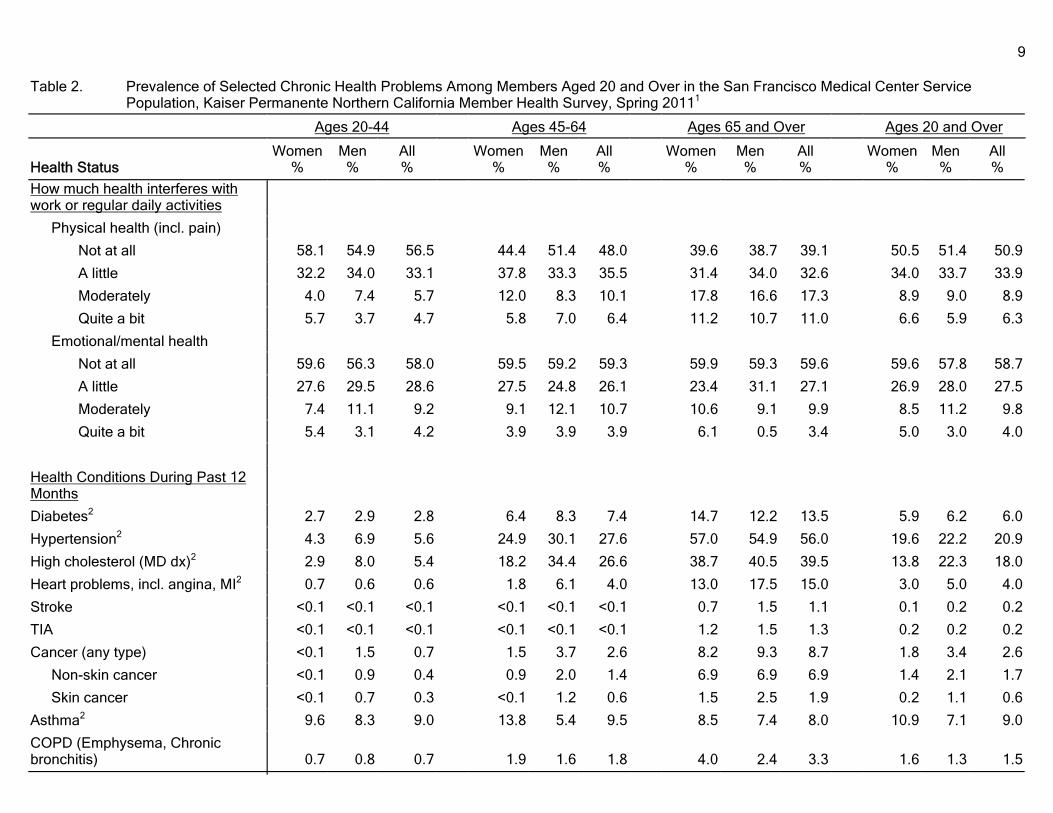
Table 2. Prevalence of Selected Chronic Health Problems Among Members Aged 20 and Over in the San Francisco Medical Center Service
Population, Kaiser Permanente Northern California Member Health Survey, Spring 20111
Ages 20-44
Ages 45-64
Ages 65 and Over
Ages 20 and Over
Health Status
Women
%
Men %
All %
Women
%
Men %
All %
Women
%
Men %
All %
Women
%
Men %
All %
Overall Health Status
Excellent
29.0
25.0
27.1
14.2
16.9
15.6
5.7
8.6
7.0
20.3
19.8
20.1
Very Good
42.9
50.1
46.4
44.1
40.2
42.1
31.0
27.7
29.5
41.3
43.4
42.4
Good
21.3
19.3
20.3
33.4
32.4
32.9
41.6
44.6
42.9
28.6
27.6
28.1
Fair
5.1
4.9
5.0
5.2
9.0
7.1
20.3
15.6
18.2
7.5
7.8
7.7
Poor
1.7
0.7
1.2
3.1
1.5
2.3
1.4
3.5
2.4
2.1
1.4
1.7
Physical Health Status
Excellent
29.0
23.6
26.3
15.0
16.8
15.9
7.2
9.6
8.3
20.8
19.2
20.0
Very Good
42.7
51.4
47.0
42.2
40.0
41.1
30.6
28.1
29.4
40.6
43.9
42.3
Good
21.6
21.0
21.3
32.4
32.9
32.7
40.7
42.1
41.4
28.3
28.3
28.3
Fair
4.4
3.4
3.9
7.7
8.8
8.3
20.6
16.9
18.9
8.1
7.3
7.7
Poor
2.3
0.6
1.5
2.7
1.5
2.0
0.9
3.3
2.0
2.2
1.3
1.7
Emotional Health Status
Excellent
27.6
25.6
26.7
20.6
21.0
20.9
24.1
15.8
20.3
24.7
22.6
23.7
Very Good
38.0
40.0
38.9
42.8
35.2
38.8
35.8
37.1
36.4
39.2
37.8
38.5
Good
23.4
21.0
22.2
26.8
32.4
29.7
27.4
35.6
31.2
25.2
27.2
26.2
Fair
7.5
10.2
8.8
8.9
9.1
9.0
11.0
10.0
10.5
8.5
9.8
9.1
Poor
3.5
3.2
3.4
0.9
2.3
1.6
1.7
1.5
1.6
2.4
2.6
2.5
9
Table 2. Prevalence of Selected Chronic Health Problems Among Members Aged 20 and Over in the San Francisco Medical Center Service
Population, Kaiser Permanente Northern California Member Health Survey, Spring 20111
Ages 20-44
Ages 45-64
Ages 65 and Over
Ages 20 and Over
Health Status
Women
%
Men %
All %
Women
%
Men %
All %
Women
%
Men %
All %
Women
%
Men %
All %
How much health interferes with work or regular daily activities
Physical health (incl. pain)
Not at all
58.1
54.9
56.5
44.4
51.4
48.0
39.6
38.7
39.1
50.5
51.4
50.9
A little
32.2
34.0
33.1
37.8
33.3
35.5
31.4
34.0
32.6
34.0
33.7
33.9
Moderately
4.0
7.4
5.7
12.0
8.3
10.1
17.8
16.6
17.3
8.9
9.0
8.9
Quite a bit
5.7
3.7
4.7
5.8
7.0
6.4
11.2
10.7
11.0
6.6
5.9
6.3
Emotional/mental health
Not at all
59.6
56.3
58.0
59.5
59.2
59.3
59.9
59.3
59.6
59.6
57.8
58.7
A little
27.6
29.5
28.6
27.5
24.8
26.1
23.4
31.1
27.1
26.9
28.0
27.5
Moderately
7.4
11.1
9.2
9.1
12.1
10.7
10.6
9.1
9.9
8.5
11.2
9.8
Quite a bit
5.4
3.1
4.2
3.9
3.9
3.9
6.1
0.5
3.4
5.0
3.0
4.0
Health Conditions During Past 12 Months
Diabetes2
2.7
2.9
2.8
6.4
8.3
7.4
14.7
12.2
13.5
5.9
6.2
6.0
Hypertension2
4.3
6.9
5.6
24.9
30.1
27.6
57.0
54.9
56.0
19.6
22.2
20.9
High cholesterol (MD dx)2
2.9
8.0
5.4
18.2
34.4
26.6
38.7
40.5
39.5
13.8
22.3
18.0
Heart problems, incl. angina, MI2
0.7
0.6
0.6
1.8
6.1
4.0
13.0
17.5
15.0
3.0
5.0
4.0
Stroke
<0.1
<0.1
<0.1
<0.1
<0.1
<0.1
0.7
1.5
1.1
0.1
0.2
0.2
TIA
<0.1
<0.1
<0.1
<0.1
<0.1
<0.1
1.2
1.5
1.3
0.2
0.2
0.2
Cancer (any type)
<0.1
1.5
0.7
1.5
3.7
2.6
8.2
9.3
8.7
1.8
3.4
2.6
Non-skin cancer
<0.1
0.9
0.4
0.9
2.0
1.4
6.9
6.9
6.9
1.4
2.1
1.7
Skin cancer
<0.1
0.7
0.3
<0.1
1.2
0.6
1.5
2.5
1.9
0.2
1.1
0.6
Asthma2
9.6
8.3
9.0
13.8
5.4
9.5
8.5
7.4
8.0
10.9
7.1
9.0
COPD (Emphysema, Chronic bronchitis)
0.7
0.8
0.7
1.9
1.6
1.8
4.0
2.4
3.3
1.6
1.3
1.5

10
Table 2. Prevalence of Selected Chronic Health Problems Among Members Aged 20 and Over in the San Francisco Medical Center Service
Population, Kaiser Permanente Northern California Member Health Survey, Spring 20111
Ages 20-44
Ages 45-64
Ages 65 and Over
Ages 20 and Over
Health Status
Women
%
Men %
All %
Women
%
Men %
All %
Women
%
Men %
All %
Women
%
Men %
All %
Frequent Heartburn (GERD) 4.7 3.2 4.0 9.2 8.9 9.0 15.4 11.6 13.6 7.9 6.5 7.2 Osteoporosis
--
--
--
2.6
--
--
11.9
1.4
--
--
--
--
Arthritis/rheumatoid arthritis
3.2
1.8
2.6
8.3
7.8
8.1
34.8
17.3
26.7
10.0
6.2
8.1
Severe or chronic pain
26.2
17.4
21.9
29.1
21.0
24.9
26.4
25.2
25.8
27.2
19.8
23.6
Musculoskeletal pain
14.6
10.5
12.6
16.9
12.8
14.8
18.7
19.6
19.1
16.1
12.6
14.4
Severe back pain/sciatica
9.3
5.7
7.6
9.9
9.6
9.8
14.6
14.5
14.5
10.4
8.4
9.4
Severe neck/shoulder pain
7.1
6.0
6.5
8.5
6.2
7.3
11.6
8.5
10.2
8.3
6.4
7.4
Migraine headaches
11.4
2.7
7.1
8.9
3.1
5.9
5.9
1.0
3.6
9.7
2.6
6.2
Other severe headaches
3.6
3.2
3.4
2.6
1.8
2.2
1.2
0.7
0.9
2.9
2.3
2.6
Other chronic pain
5.8
3.9
4.9
9.3
10.9
10.1
12.9
6.2
9.8
8.1
6.8
7.5
Urine leakage (> once/week)
3.4
--
--
12.6
2.1
--
23.0
14.0
--
9.6
2.7
--
Frequent problems falling or staying asleep
8.9
4.4
6.7
10.2
10.3
10.2
7.8
6.1
7.0
9.1
6.8
8.0 Vision problem (not correctable by glasses)
6.8
7.6
7.2
18.1
15.8
16.9
28.5
22.6
25.8
14.1
12.7
13.4 Hearing problem/deafness3
0.4
<0.1
0.2
4.0
4.1
4.0
26.7
22.2
24.6
5.8
4.6
5.2
Depression and/or Anxiety lasting > 2 wks2,4
15.8
13.7
14.7
20.2
21.7
21.0
14.7
12.2
13.5
17.1
16.4
16.8
Depression, sadness, very low spirits for > 2 wks4
13.2
10.3
11.8
14.0
18.4
16.3
13.2
9.2
11.4
13.5
13.1
13.3
Anxiety/panic for > 2 wks2
7.1
6.9
7.0
10.8
8.8
9.8
3.3
3.9
3.6
7.8
7.2
7.5 Alcohol or drug problem
1.1
2.3
1.7
1.0
0.6
0.8
0.2
2.2
1.1
0.9
1.7
1.3
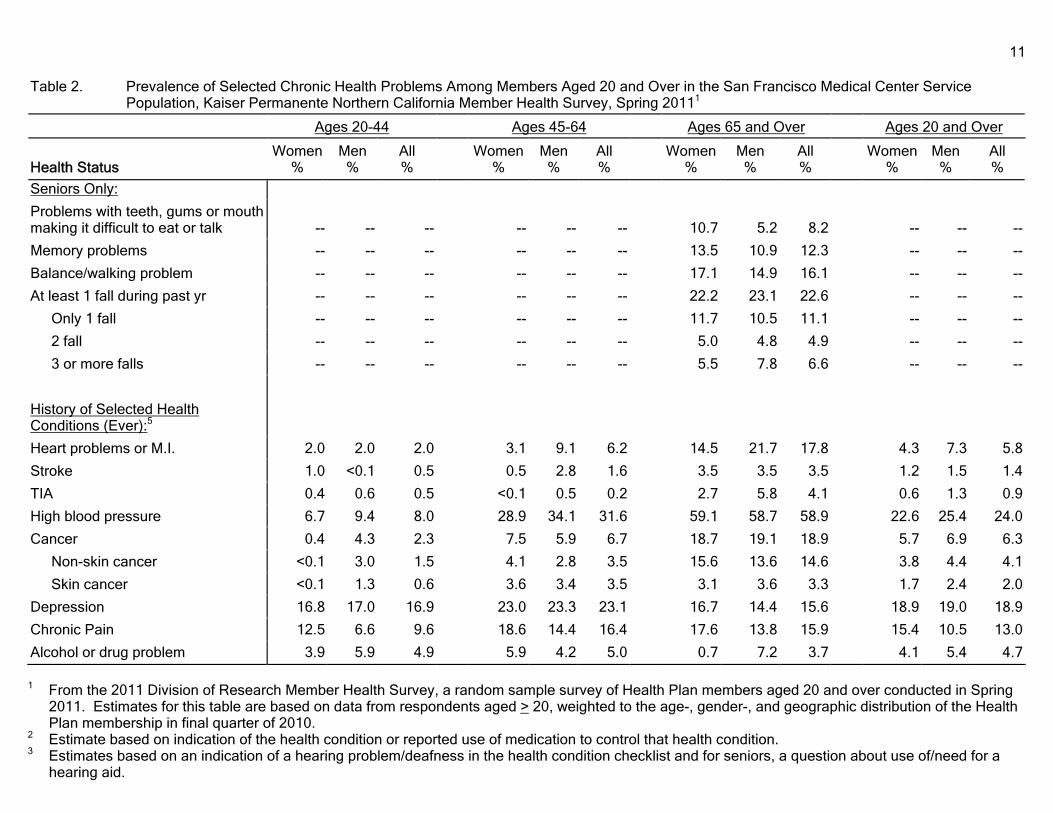
11
Table 2. Prevalence of Selected Chronic Health Problems Among Members Aged 20 and Over in the San Francisco Medical Center Service
Population, Kaiser Permanente Northern California Member Health Survey, Spring 20111
Ages 20-44
Ages 45-64
Ages 65 and Over
Ages 20 and Over
Health Status
Women
%
Men %
All %
Women
%
Men %
All %
Women
%
Men %
All %
Women
%
Men %
All %
Seniors Only: Problems with teeth, gums or mouth making it difficult to eat or talk
--
--
--
--
--
--
10.7
5.2
8.2
--
--
-- Memory problems
--
--
--
--
--
--
13.5
10.9
12.3
--
--
--
Balance/walking problem
--
--
--
--
--
--
17.1
14.9
16.1
--
--
--
At least 1 fall during past yr
--
--
--
--
--
--
22.2
23.1
22.6
--
--
--
Only 1 fall
--
--
--
--
--
--
11.7
10.5
11.1
--
--
--
2 fall
--
--
--
--
--
--
5.0
4.8
4.9
--
--
--
3 or more falls
--
--
--
--
--
--
5.5
7.8
6.6
--
--
--
History of Selected Health Conditions (Ever):5
Heart problems or M.I.
2.0
2.0
2.0
3.1
9.1
6.2
14.5
21.7
17.8
4.3
7.3
5.8
Stroke
1.0
<0.1
0.5
0.5
2.8
1.6
3.5
3.5
3.5
1.2
1.5
1.4
TIA
0.4
0.6
0.5
<0.1
0.5
0.2
2.7
5.8
4.1
0.6
1.3
0.9
High blood pressure
6.7
9.4
8.0
28.9
34.1
31.6
59.1
58.7
58.9
22.6
25.4
24.0
Cancer
0.4
4.3
2.3
7.5
5.9
6.7
18.7
19.1
18.9
5.7
6.9
6.3
Non-skin cancer
<0.1
3.0
1.5
4.1
2.8
3.5
15.6
13.6
14.6
3.8
4.4
4.1
Skin cancer
<0.1
1.3
0.6
3.6
3.4
3.5
3.1
3.6
3.3
1.7
2.4
2.0
Depression
16.8
17.0
16.9
23.0
23.3
23.1
16.7
14.4
15.6
18.9
19.0
18.9
Chronic Pain
12.5
6.6
9.6
18.6
14.4
16.4
17.6
13.8
15.9
15.4
10.5
13.0
Alcohol or drug problem
3.9
5.9
4.9
5.9
4.2
5.0
0.7
7.2
3.7
4.1
5.4
4.7
1 From the 2011 Division of Research Member Health Survey, a random sample survey of Health Plan members aged 20 and over conducted in Spring
2011. Estimates for this table are based on data from respondents aged > 20, weighted to the age-, gender-, and geographic distribution of the Health Plan membership in final quarter of 2010.
2 Estimate based on indication of the health condition or reported use of medication to control that health condition. 3 Estimates based on an indication of a hearing problem/deafness in the health condition checklist and for seniors, a question about use of/need for a
hearing aid.

12
4 Depression was estimated from indication of depression, sadness, or very low spirits lasting at least 2 weeks in a health condition checklist or indication of use of a prescription anti-depressant during the previous 12 months.
5 Indicated ever having this condition, including in the past 12 months.

13
Table 3. Prevalence of Selected Behavioral and Psychosocial Risks Among Members Aged 20 and Over in the San Francisco Medical Center
Service Population, Kaiser Permanente Northern California Member Health Survey, Spring 20111
Ages 20-44
Ages 45-64
Ages 65 and Over
Ages 20 and Over
Behavioral/Psychosocial Risks During the Past 12 Months
Women
%
Men %
All %
Women
%
Men %
All %
Women
%
Men %
All %
Women
%
Men %
All %
History of Tobacco Use
Current cigarette smoker
9.3
14.6
11.9
7.9
15.7
11.9
5.3
2.5
4.0
8.1
13.3
10.7
Former cigarette smoker
13.5
15.4
14.4
21.6
20.1
20.8
33.0
40.1
36.3
19.4
20.6
20.0
Never smoked regularly
77.2
70.0
73.7
70.5
64.2
67.3
61.7
57.4
59.7
72.5
66.1
69.3 Weight
Overweight (BMI > 25)
31.5
45.3
38.4
47.7
67.8
58.0
42.9
51.4
46.9
38.9
54.5
46.7
Obese (BMI > 30)
12.8
10.8
11.8
25.1
16.3
20.6
19.2
10.3
15.1
18.1
12.8
15.4
BMI range:
BMI < 18.5 (underwt)
2.5
1.5
2.0
2.5
0.6
1.5
2.1
1.2
1.7
2.5
1.1
1.8
BMI 18.5 to 25
66.0
53.2
59.6
49.8
31.6
40.4
55.0
47.4
51.5
58.7
44.4
51.5
BMI 25 to 30 (over wt)
18.7
34.5
26.6
22.6
51.5
37.5
23.7
41.1
31.7
20.8
41.7
31.2
BMI 30 to <35 (obese)
6.0
7.7
6.9
14.3
11.7
13.0
11.8
7.2
9.7
9.8
9.1
9.5
BMI > 35 (very obese)
6.8
3.1
4.9
10.8
4.6
7.6
7.4
3.1
5.4
8.2
3.7
6.0 Exercise Frequency
5 or more times/week
27.1
33.1
30.1
32.9
40.9
37.0
34.8
45.6
39.9
30.3
37.7
34.0
3-4 times/week
38.3
29.6
34.0
30.1
27.3
28.7
32.3
30.6
31.5
34.6
28.9
31.7
1-2 times/week
22.1
31.9
26.9
20.2
16.6
18.3
19.8
17.0
18.5
21.1
24.2
22.6
Less than 1 time/week
12.5
5.4
9.0
16.8
15.2
16.0
13.1
6.8
10.1
14.0
9.2
11.7 Usual Type of Exercise (Those who exercise only)
Low impact
22.9
20.6
21.8
39.2
29.9
34.4
59.9
53.0
56.6
33.9
28.4
31.2
Moderate/Vigorous
77.1
79.4
78.2
60.8
70.1
65.6
40.1
47.0
43.4
66.1
71.6
68.8
Dietary Practices
Tries to eat reduced fat foods most of the time.
45.7
28.6
37.3
53.2
45.0
48.9
53.2
57.2
55.0
49.4
38.6
44.1
Tries to avoid foods high in salt/sodium most of the time
54.9
51.9
53.4
73.5
61.0
67.0
71.0
63.7
67.6
63.8
56.9
60.4
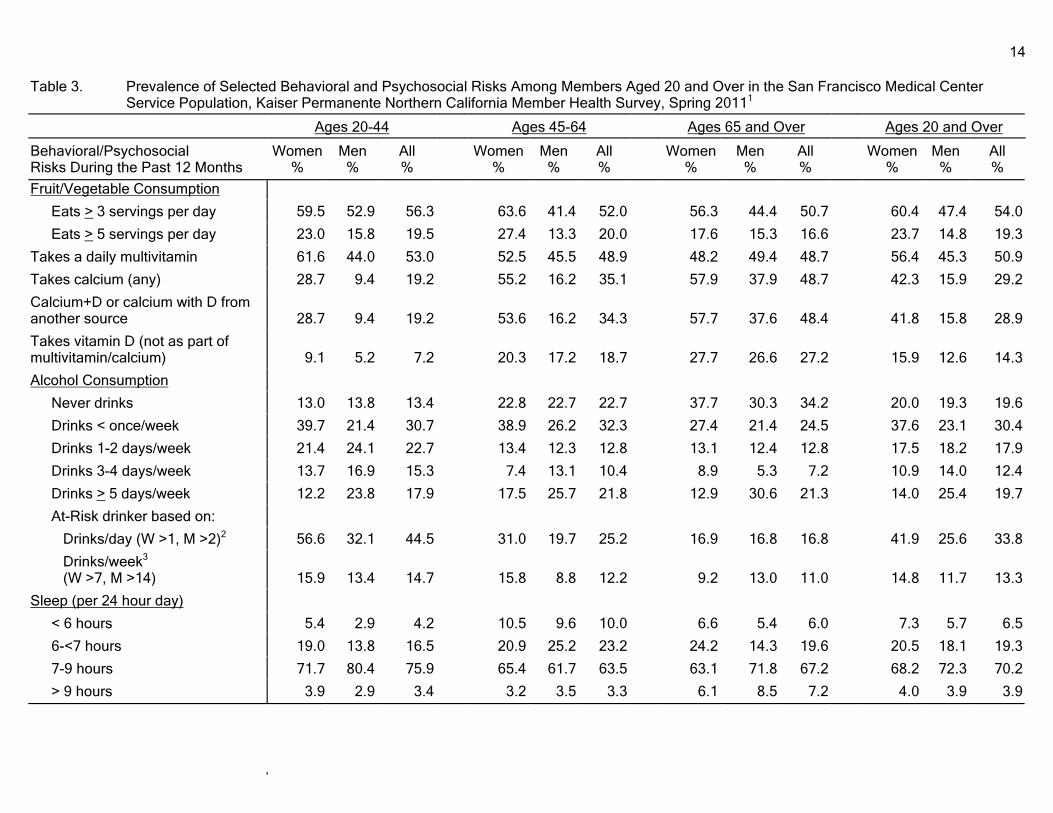
14
Table 3. Prevalence of Selected Behavioral and Psychosocial Risks Among Members Aged 20 and Over in the San Francisco Medical Center
Service Population, Kaiser Permanente Northern California Member Health Survey, Spring 20111
Ages 20-44
Ages 45-64
Ages 65 and Over
Ages 20 and Over
Behavioral/Psychosocial Risks During the Past 12 Months
Women
%
Men %
All %
Women
%
Men %
All %
Women
%
Men %
All %
Women
%
Men %
All %
Fruit/Vegetable Consumption
Eats > 3 servings per day
59.5
52.9
56.3
63.6
41.4
52.0
56.3
44.4
50.7
60.4
47.4
54.0
Eats > 5 servings per day
23.0
15.8
19.5
27.4
13.3
20.0
17.6
15.3
16.6
23.7
14.8
19.3 Takes a daily multivitamin
61.6
44.0
53.0
52.5
45.5
48.9
48.2
49.4
48.7
56.4
45.3
50.9
Takes calcium (any)
28.7
9.4
19.2
55.2
16.2
35.1
57.9
37.9
48.7
42.3
15.9
29.2
Calcium+D or calcium with D from another source
28.7
9.4
19.2
53.6
16.2
34.3
57.7
37.6
48.4
41.8
15.8
28.9 Takes vitamin D (not as part of multivitamin/calcium)
9.1
5.2
7.2
20.3
17.2
18.7
27.7
26.6
27.2
15.9
12.6
14.3 Alcohol Consumption
Never drinks
13.0
13.8
13.4
22.8
22.7
22.7
37.7
30.3
34.2
20.0
19.3
19.6
Drinks < once/week
39.7
21.4
30.7
38.9
26.2
32.3
27.4
21.4
24.5
37.6
23.1
30.4
Drinks 1-2 days/week
21.4
24.1
22.7
13.4
12.3
12.8
13.1
12.4
12.8
17.5
18.2
17.9
Drinks 3-4 days/week
13.7
16.9
15.3
7.4
13.1
10.4
8.9
5.3
7.2
10.9
14.0
12.4
Drinks > 5 days/week
12.2
23.8
17.9
17.5
25.7
21.8
12.9
30.6
21.3
14.0
25.4
19.7
At-Risk drinker based on:
Drinks/day (W >1, M >2)2
56.6
32.1
44.5
31.0
19.7
25.2
16.9
16.8
16.8
41.9
25.6
33.8
Drinks/week3 (W >7, M >14)
15.9
13.4
14.7
15.8
8.8
12.2
9.2
13.0
11.0
14.8
11.7
13.3 Sleep (per 24 hour day)
< 6 hours
5.4
2.9
4.2
10.5
9.6
10.0
6.6
5.4
6.0
7.3
5.7
6.5
6-<7 hours
19.0
13.8
16.5
20.9
25.2
23.2
24.2
14.3
19.6
20.5
18.1
19.3
7-9 hours
71.7
80.4
75.9
65.4
61.7
63.5
63.1
71.8
67.2
68.2
72.3
70.2
> 9 hours
3.9
2.9
3.4
3.2
3.5
3.3
6.1
8.5
7.2
4.0
3.9
3.9
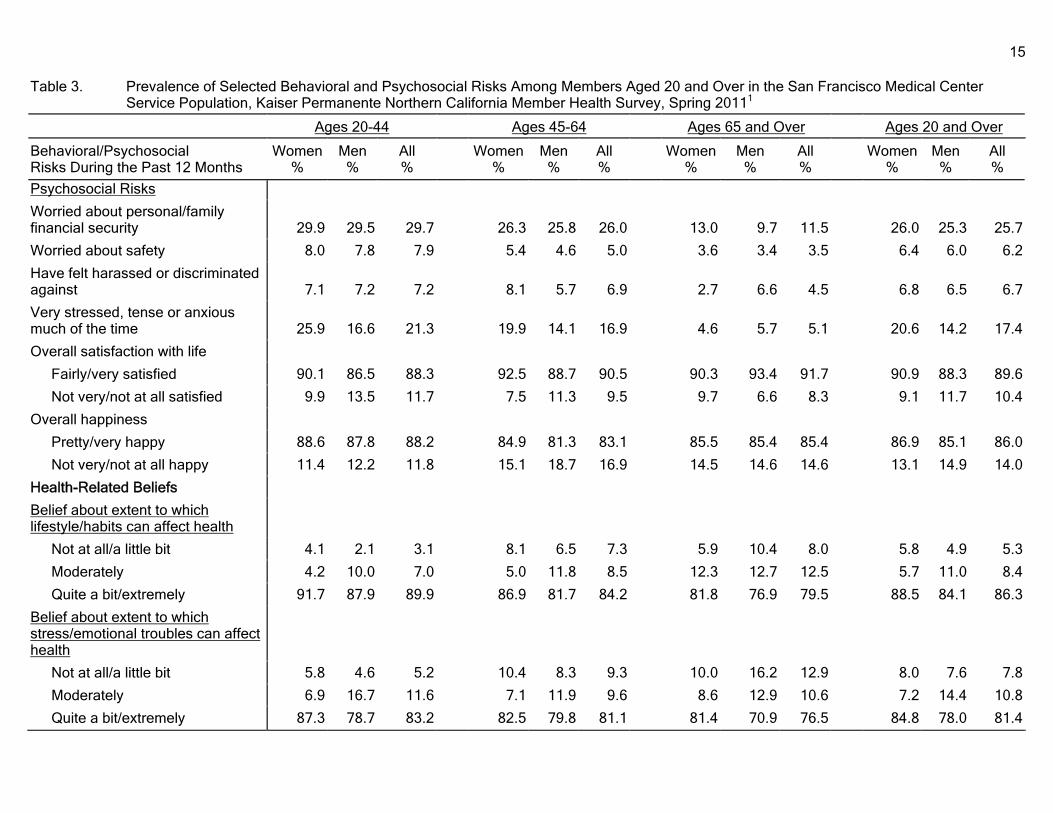
15
Table 3. Prevalence of Selected Behavioral and Psychosocial Risks Among Members Aged 20 and Over in the San Francisco Medical Center
Service Population, Kaiser Permanente Northern California Member Health Survey, Spring 20111
Ages 20-44
Ages 45-64
Ages 65 and Over
Ages 20 and Over
Behavioral/Psychosocial Risks During the Past 12 Months
Women
%
Men %
All %
Women
%
Men %
All %
Women
%
Men %
All %
Women
%
Men %
All %
Psychosocial Risks Worried about personal/family financial security
29.9
29.5
29.7
26.3
25.8
26.0
13.0
9.7
11.5
26.0
25.3
25.7 Worried about safety
8.0
7.8
7.9
5.4
4.6
5.0
3.6
3.4
3.5
6.4
6.0
6.2
Have felt harassed or discriminated against
7.1
7.2
7.2
8.1
5.7
6.9
2.7
6.6
4.5
6.8
6.5
6.7 Very stressed, tense or anxious much of the time
25.9
16.6
21.3
19.9
14.1
16.9
4.6
5.7
5.1
20.6
14.2
17.4 Overall satisfaction with life
Fairly/very satisfied
90.1
86.5
88.3
92.5
88.7
90.5
90.3
93.4
91.7
90.9
88.3
89.6
Not very/not at all satisfied
9.9
13.5
11.7
7.5
11.3
9.5
9.7
6.6
8.3
9.1
11.7
10.4 Overall happiness
Pretty/very happy
88.6
87.8
88.2
84.9
81.3
83.1
85.5
85.4
85.4
86.9
85.1
86.0
Not very/not at all happy
11.4
12.2
11.8
15.1
18.7
16.9
14.5
14.6
14.6
13.1
14.9
14.0 Health-Related Beliefs
Belief about extent to which lifestyle/habits can affect health
Not at all/a little bit
4.1
2.1
3.1
8.1
6.5
7.3
5.9
10.4
8.0
5.8
4.9
5.3
Moderately
4.2
10.0
7.0
5.0
11.8
8.5
12.3
12.7
12.5
5.7
11.0
8.4
Quite a bit/extremely
91.7
87.9
89.9
86.9
81.7
84.2
81.8
76.9
79.5
88.5
84.1
86.3
Belief about extent to which stress/emotional troubles can affect health
Not at all/a little bit
5.8
4.6
5.2
10.4
8.3
9.3
10.0
16.2
12.9
8.0
7.6
7.8
Moderately
6.9
16.7
11.6
7.1
11.9
9.6
8.6
12.9
10.6
7.2
14.4
10.8
Quite a bit/extremely
87.3
78.7
83.2
82.5
79.8
81.1
81.4
70.9
76.5
84.8
78.0
81.4

16
1 From the 2011 Division of Research Member Health Survey, a random sample survey of Health Plan members aged 20 and over conducted in Spring 2011. Estimates for this table are based on data from respondents aged > 20, weighted to the age-, gender-, and geographic distribution of the Health Plan membership in final quarter of 2010.
2 At-risk drinker based on usual number of drinks consumed on days when had a drink: Women > 1 drink in a day, Men > 2 drinks in a day. 3 At-risk drinker based on number of drinks per week estimated by usual drinking frequency x usual number of drinks: Women > 7/week, Men > 14/week.

17
Table 4. Actions People Are Taking to Improve or Maintain Health, Members Aged 20 and Over in the San Francisco Medical Center Service
Population, Kaiser Permanente Northern California Member Health Survey, Spring 20111
Ages 20-44
Ages 45-64
Ages 65 and Over
Ages 20 and Over
Actions Taken Trying To:
Women
%
Men %
All %
Women
%
Men %
All %
Women
%
Men %
All %
Women
%
Men %
All %
Tries to get exercise (any type) most days
70.0
66.3
68.2
65.6
68.6
67.2
54.7
70.6
62.0
66.1
67.8
66.9 Gets moderate/vigorous exercise most days
59.3
57.2
58.3
48.1
52.9
50.6
41.4
54.9
47.7
52.7
55.3
54.0 Daily walks/10,000 steps
30.4
25.3
27.9
36.7
35.8
36.3
27.7
36.0
31.5
32.1
30.7
31.4
Reads labels/recipes to learn what is in their food
57.9
55.3
56.6
58.4
57.6
58.0
63.0
51.4
57.6
58.9
55.6
57.3 Tries to eat mostly healthy foods
77.3
72.2
74.8
83.7
77.8
80.7
82.4
77.5
80.1
80.3
75.0
77.7
Tries to manage stress
61.9
48.2
55.2
53.3
51.3
52.3
37.6
33.0
35.5
55.1
47.2
51.2
Tries to get enough sleep to feel well rested
76.1
72.2
74.2
80.6
75.1
77.7
67.4
67.4
67.4
76.2
72.6
74.4 Taking steps to lose weight or maintain weight loss
47.4
34.7
41.2
47.8
44.9
46.3
34.3
31.3
32.9
45.4
38.0
41.8
If overweight or obese
59.8
48.9
54.8
68.7
66.2
67.7
55.1
34.4
48.5
63.3
55.4
60.0 Does enjoyable activities at least once a week
81.8
79.4
80.6
72.8
69.2
70.9
63.4
60.0
61.8
75.8
72.9
74.4 Takes low dose aspirin to prevent heart attack/stroke
1.8
2.1
2.0
23.5
26.2
24.9
41.2
52.9
46.6
15.5
18.1
16.8 Seniors Only:
Taking steps to prevent falls
--
--
--
--
--
--
38.4
33.2
36.0
--
--
--
Does activities to keep brain stimulated
--
--
--
--
--
--
71.3
67.1
69.4
--
--
-- Visits with people at least once a week
--
--
--
--
--
--
59.5
50.0
55.1
--
--
--
1 From the 2011 Division of Research Member Health Survey, a random sample survey of Health Plan members aged 20 and over conducted in Spring
2011. Estimates for this table are based on data from respondents aged > 20, weighted to the age-, gender-, and geographic distribution of the Health Plan membership in final quarter of 2010.

18
Table 5. Use of Selected Preventive Medicine Services (self-reported) by Members Aged 20 and Over in the San Francisco Medical Center Service
Population, Kaiser Permanente Northern California Member Health Survey, Spring 20111
Ages 20-44
Ages 45-64
Ages 65 and Over
Ages 20 and Over
Preventive Medicine Services2
Women
%
Men %
All %
Women
%
Men %
All %
Women
%
Men %
All %
Women
%
Men %
All %
Flu immunization in 2010-11 flu season
Ages > 20
45.9
52.6
49.1
56.2
59.9
58.1
81.8
78.7
80.4
55.0
59.0
57.0
Ages > 50
--
--
--
57.1
60.5
58.8
81.8
78.7
80.4
66.5
66.9
66.7
Ages > 65 or high risk3
44.7
59.5
51.8
71.5
69.2
70.4
81.8
78.7
80.4
70.7
71.7
71.2
Pneumococcal vaccination (ever)
Ages > 65
--
--
--
--
--
--
70.5
58.1
64.7
--
--
--
Dental exam by dentist/hygienist
Within past 12 months
77.6
78.1
77.8
83.2
81.7
82.5
74.3
86.8
80.2
79.0
80.7
79.8
More than one year ago
22.4
20.4
21.4
16.8
17.6
17.2
19.8
12.1
16.2
20.1
18.2
19.1
1 From the 2011 Division of Research Member Health Survey, a random sample survey of Health Plan members aged 20 and over conducted in Spring
2011. Estimates for this table are based on data from respondents aged > 20, weighted to the age-, gender-, and geographic distribution of the Health Plan membership in final quarter of 2010.
2 Based on self-report data. Previous research suggests that self-report tends to underestimate the length of time since procedures were done, so these rates may overestimate the actual rates of members who had these procedures during the specified interval.
3 High risk: having >1 of the following: history of heart disease, MI in past year, Parkinson's disease, diabetes, asthma, COPD, chronic bronchitis.

19
Table 6. Use of Selected Complementary or Alternative Medicine, Modalities in Past 12 Months to Treat or Prevent Own Health Problems, Among
Members Aged 20 and Over in the San Francisco Medical Center Service Population, Kaiser Permanente Northern California Member Health Survey, Spring 20111
Ages 20-44
Ages 45-64
Ages 65 and Over
Ages 20 and Over
Complementary or Alternative Medicine
Women
%
Men %
All %
Women
%
Men %
All %
Women
%
Men %
All %
Women
%
Men %
All %
Chiropractic
10.7
8.7
9.7
16.1
12.0
14.0
5.0
6.4
5.6
11.6
9.6
10.6
Acupuncture
11.9
6.9
9.5
9.0
7.9
8.4
9.8
4.8
7.5
10.6
7.0
8.8
Acupressure
7.1
0.6
3.9
1.5
3.9
2.7
1.7
0.3
1.0
4.3
1.8
3.1
Massage Therapy
34.7
19.7
27.4
27.5
15.8
21.5
7.2
8.1
7.6
27.9
16.7
22.4
Deep breathing, mindfulness, or other relaxation/meditation technique
36.6
17.1
27.0
30.3
22.1
26.0
16.4
12.9
14.8
31.2
18.4
24.9 Guided imagery/visualization techniques
6.4
0.8
3.7
4.4
2.4
3.4
2.7
2.0
2.4
5.2
1.6
3.4 Yoga
34.8
18.9
27.0
20.3
10.5
15.3
7.0
3.3
5.3
25.5
13.7
19.6
Tai Chi, Chi Gong, other movement therapy
1.3
3.4
2.4
6.2
4.1
5.1
8.3
4.8
6.7
4.1
3.9
4.0 Body work (e.g., Feldenkreis)
6.2
2.2
4.3
4.7
3.2
4.0
1.7
1.9
1.8
5.0
2.6
3.8
Herbal medicine/herbal supplement
11.9
6.1
9.1
14.7
12.8
13.7
8.7
8.7
8.7
12.3
9.0
10.7
Chinese, Indian, or Native American medicines
4.0
2.0
3.0
7.8
8.1
8.0
5.2
3.2
4.3
5.5
4.5
5.0 Megavitamin/high dose vitamin therapy
<0.1
0.6
0.3
0.9
1.8
1.3
0.7
1.5
1.1
0.4
1.2
0.8 Homeopathic medicine
4.4
1.7
3.1
7.7
3.6
5.6
1.5
3.9
2.6
5.1
2.7
3.9
Very low fat diet (Ornish, Pritikin, etc.)
0.7
<0.1
0.3
0.5
1.9
1.2
0.2
2.4
1.2
0.5
1.0
0.8 Very low carb diet
4.1
2.0
3.1
5.7
1.8
3.7
1.2
1.3
1.3
4.2
1.8
3.0
Prayer or spiritual practice
10.3
10.1
10.2
20.7
13.8
17.1
23.3
7.9
16.2
15.9
11.2
13.6
Religious/spiritual healing by others
1.6
4.2
2.9
0.5
3.1
1.8
1.5
0.9
1.3
1.2
3.3
2.3
Psychological counseling
11.7
8.8
10.3
9.7
6.7
8.2
2.8
5.2
3.9
9.6
7.5
8.6
12-Step/Self-help Program
1.8
2.4
2.1
2.6
2.5
2.5
1.1
0.5
0.8
1.9
2.2
2.1

20
1 From the 2011 Division of Research Member Health Survey, a random sample survey of Health Plan members aged 20 and over conducted in Spring 2011. Estimates for this table are based on data from respondents aged > 20, weighted to the age-, gender-, and geographic distribution of the Health Plan membership in final quarter of 2010.

21
Table 7. Access to the Internet and Digital Tools Among Members Aged 20 and Over in the San Francisco Medical Center Service Population,
Kaiser Permanente Northern California Member Health Survey, Spring 20111
Ages 20-44
Ages 45-64
Ages 65 and Over
Ages 20 and Over
Access to IT/Digital Tools
Women
%
Men %
All %
Women
%
Men %
All %
Women
%
Men %
All %
Women
%
Men %
All %
Mobile phone (cell or smart phone)
94.9
97.4
96.1
85.8
82.9
84.3
68.1
73.3
70.5
87.7
88.7
88.2
Text messages
89.6
92.1
90.8
71.3
65.4
68.2
32.7
42.1
37.2
74.9
75.6
75.2
Computer (desktop, laptop, net book)
From any location
99.0
99.2
99.1
96.0
94.5
95.2
63.3
82.5
72.2
92.4
95.1
93.8
At home
95.2
95.0
95.1
91.6
86.9
89.1
55.9
77.5
66.0
87.9
89.6
88.7
Able to use the Internet
From any location
99.6
100.0
99.8
94.7
96.2
95.4
67.4
83.4
74.8
92.9
96.3
94.6
At home
96.4
96.5
96.5
88.2
88.0
88.1
53.0
68.4
60.2
87.0
89.5
88.2
Requires help to use
1.7
2.6
2.1
2.4
2.1
2.3
10.5
12.5
11.4
3.3
3.8
3.5 Able to send/receive email
98.7
100.0
99.3
93.0
93.9
93.5
61.0
81.0
70.3
90.9
95.1
93.0
Requires help to use
0.6
0.8
0.7
1.4
0.9
1.1
7.1
13.3
10.0
1.9
2.6
2.2
1 From the 2011 Division of Research Member Health Survey, a random sample survey of Health Plan members aged 20 and over conducted in Spring
2011. Estimates for this table are based on data from respondents aged > 20, weighted to the age-, gender-, and geographic distribution of the Health Plan membership in final quarter of 2010.

22
Table 8. Use of Internet/Digital Health Information Sources in the Prior 12 Months Among Members Aged 20 and Over in the San Francisco Medical
Center Service Population, Kaiser Permanente Northern California Member Health Survey, Spring 20111
Ages 20-44
Ages 45-64
Ages 65 and Over
Ages 20 and Over
Accessed Internet-based Health Information in Past 12 mos.
Women
%
Men %
All %
Women
%
Men %
All %
Women
%
Men %
All %
Women
%
Men %
All %
Got health information from kp.org or other websites (based single item)
41.9
33.7
37.9
39.0
36.3
37.6
21.6
20.9
21.3
37.8
32.9
35.4 Got health information from any website or the following kp.org sources: MD home page, Health or Drug Encyclopedia, online patient education program
55.7
44.0
50.0
50.7
47.9
49.3
27.2
29.7
28.3
49.5
43.5
46.5 Used kp.org Health or Drug Encyclopedia
14.3
10.4
12.4
22.7
16.8
19.7
6.3
14.0
9.9
15.9
13.3
14.6 Used any online kp.org health/patient education program
9.2
5.5
7.4
10.4
3.5
6.9
6.1
5.7
5.9
9.1
4.8
7.0 Got health information from MD home page on kp.org
27.0
22.4
24.8
20.7
20.0
20.3
14.8
18.1
16.3
23.0
20.9
21.9 Used kp.org website secure features (lab results, Rx refill, clinician messaging)
71.1
58.9
65.2
68.6
59.8
64.1
38.9
50.8
44.4
65.2
58.1
61.7 Used at least one kp.org health information source or kp.org secure feature
75.3
63.2
69.4
69.5
63.0
66.1
41.0
51.7
45.9
67.9
61.5
64.7 Accessed Other KP Health Ed Resources in Past 12 mos.
Any individual or group health education program
8.6
6.4
7.5
7.1
6.2
6.7
10.9
9.0
10.0
8.5
6.7
7.6 Health Education Center or Resource Desk
5.3
4.3
4.8
5.2
4.1
4.7
5.5
5.7
5.6
5.3
4.4
4.9 Individual health behavior counseling
4.4
6.2
5.3
5.5
6.4
5.9
4.0
7.2
5.5
4.7
6.4
5.5 Read a member newsletter
26.9
20.1
23.6
46.6
40.4
43.4
61.0
53.9
57.7
38.9
32.3
35.7
Used print health education materials or DVDs
13.6
4.7
9.3
21.1
11.2
16.1
29.9
21.2
25.8
18.7
9.4
14.1

23
1 From the 2011 Division of Research Member Health Survey, a random sample survey of Health Plan members aged 20 and over conducted in Spring
2011. Estimates for this table are based on data from respondents aged > 20, weighted to the age-, gender-, and geographic distribution of the Health Plan membership in final quarter of 2010.

24
Table 9. Preferred Methods for Learning About How to Take Care of Health Problems and Improve Health Among Members Aged 20 and Over in
the San Francisco Medical Center Service Population, Kaiser Permanente Northern California Member Health Survey, Spring 20111
Ages 20-44
Ages 45-64
Ages 65 and Over
Ages 20 and Over
Preferred Methods for Learning About Health
Women
%
Men %
All %
Women
%
Men %
All %
Women
%
Men %
All %
Women
%
Men %
All %
Internet-based Modalities
Information from Internet websites
39.1
39.8
39.4
33.2
31.0
32.1
21.6
28.6
24.9
34.3
35.0
34.7
Information from MD home page
28.3
27.1
27.7
17.4
23.5
20.6
21.0
16.8
19.1
23.5
24.3
23.9
Web/Email-based programs:
Single session
14.9
15.8
15.3
7.8
10.9
9.4
4.4
7.5
5.8
10.8
12.8
11.8
Multi-session
7.5
10.4
8.9
3.9
6.3
5.1
2.0
4.2
3.0
5.4
8.0
6.7 Watch live webinars/talks on kp.org
14.2
16.1
15.1
8.6
14.6
11.7
3.5
2.5
3.0
10.6
13.7
12.1
Watch health videos on kp.org or other websites
17.4
20.8
19.1
11.4
17.7
14.6
8.0
8.4
8.2
13.9
17.9
15.9 Podcasts and online audio programs
17.5
16.2
16.8
6.5
9.2
7.9
1.5
2.2
1.8
11.3
11.6
11.5 Emailed health newsletters and tip sheets
31.4
29.4
30.5
35.8
22.0
28.7
21.8
25.5
23.5
31.4
26.1
28.8 Secure email communication
43.2
39.6
41.5
36.9
28.3
32.5
15.1
16.2
15.6
36.7
32.2
34.5
Text messages
12.4
11.4
11.9
5.3
6.7
6.1
0.2
1.5
0.8
8.1
8.3
8.2
Interactive computer program
20.5
23.1
21.8
11.6
19.5
15.7
3.8
10.3
6.8
14.9
20.0
17.4
Other Modalities
Individual counseling
35.8
39.2
37.5
32.0
35.8
33.9
22.3
28.5
25.2
32.4
36.4
34.4
Brief individual telephone counseling sessions
24.4
21.4
22.9
24.5
24.6
24.6
24.0
23.3
23.7
24.4
22.9
23.6 Small group appointments
9.7
8.9
9.3
10.3
12.0
11.2
15.8
8.0
12.2
10.9
9.9
10.4
One session workshop
17.4
11.5
14.5
12.4
13.0
12.7
15.3
7.9
11.9
15.4
11.5
13.5
Multi-session in person class/group
10.5
10.4
10.4
9.9
11.9
10.9
8.1
8.5
8.3
9.9
10.7
10.3
Multi-session phone-in group program
3.5
0.7
2.1
0.5
<0.1
0.2
0.2
0.8
0.5
1.9
0.4
1.2 Watch DVDs at home
5.2
7.2
6.2
5.7
12.5
9.2
8.5
11.5
9.9
5.9
9.8
7.8
Health newsletters and tip sheets mailed to home
11.7
5.8
8.8
20.5
16.7
18.5
36.7
30.7
33.9
18.6
13.3
16.0
25
1 From the 2011 Division of Research Member Health Survey, a random sample survey of Health Plan members aged 20 and over conducted in Spring
2011. Estimates for this table are based on data from respondents aged > 20, weighted to the age-, gender-, and geographic distribution of the Health Plan membership in final quarter of 2010.