Embed Size (px)
Citation preview
Socio-Economic Review of Appalachia
Appalachia Then and Now:An Update of “The Realities of Deprivation”
Reported to the President in 1964
Andrew M. Isserman
Revised November, 1996
Abstract: In its influential 1964 report, Appalachia, the President’s Appalachian RegionalCommission characterized Appalachia as a “region apart — geographically and statistically.” Itstressed the region’s low income, lack of urbanization, high unemployment, lack of jobs, deficitsin education and living standards, and declines in population. That characterization became thebasis of a regional development policy aimed at “the introduction of Appalachia and its peopleinto fully active membership in the American society.” This paper repeats the statistical analysisunderlying the 1960 report. It asks whether the findings of the original report are still valid. Theanswer is unequivocal. The traditional characterization of Appalachia is incorrect. Conditions inAppalachia have improved greatly, and the region is catching up with the rest of the nation.Appalachia still lags the nation, however, and parts of the region still suffer the “realities ofdeprivation” identified by the 1964 report. Those Appalachian counties are among the worst offplaces in the nation.
Acknowledgments: This research was conducted under contract to the Appalachian RegionalCommission. The interpretations and opinions expressed are those of the author and do notnecessarily reflect official positions of the Appalachian Regional Commission.
2
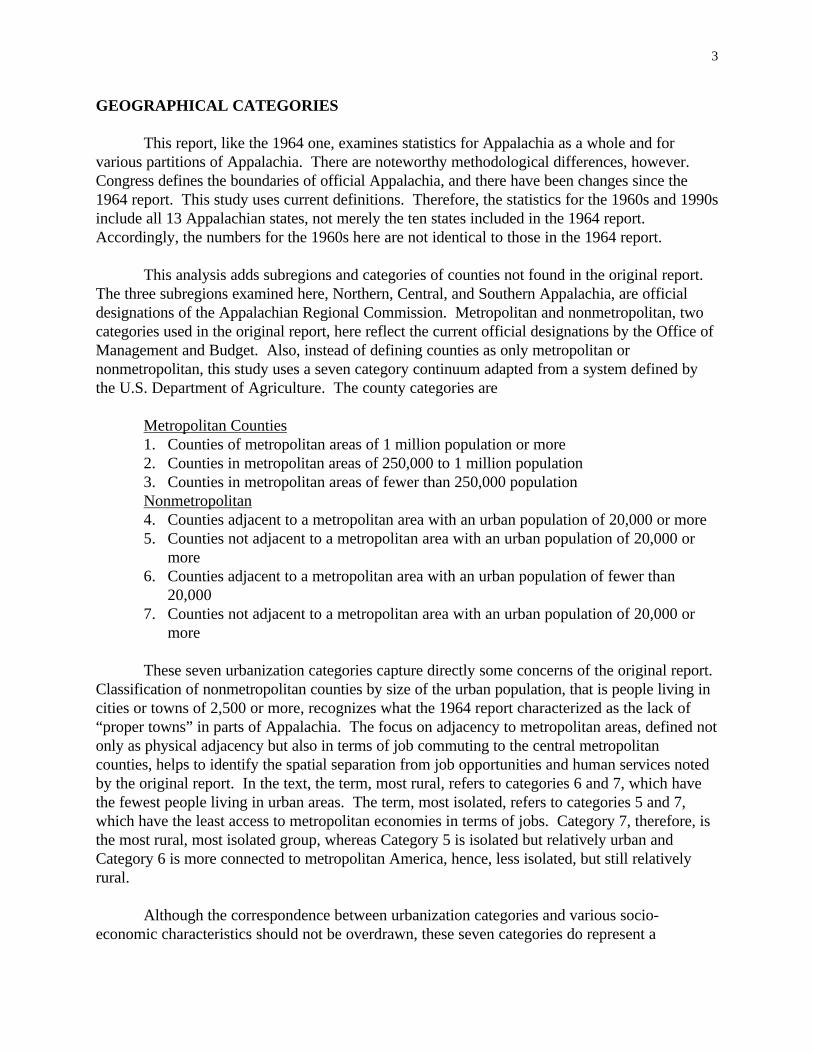
OVERVIEW
John F. Kennedy convened his President’s Appalachian Regional Commission (PARC) onApril 9, 1963. He asked it to study the region and prepare a comprehensive action plan for itseconomic development. Central to the resultant plan was a new regional organization, theAppalachian Regional Commission (ARC). Underlying the ARC mission was PARC’s clearconcept of the Appalachian problem. The opening and closing words of the PARC report to thePresident come straight to the point:
Appalachia is a region apart — geographically and statistically.
The Appalachian program will be many programs, unified only by theirsingleness of focus: the introduction of Appalachia and its people into fully activemembership in the American society.
Appalachia, the report argued, differed from the rest of the country in the mid-1960sbecause of its terrain and limited accessibility and because of the condition of its people, bothsocially and economically. The supporting statistical analysis showed how Appalachia was aregion apart in socio-economic terms because of its low income, lack of urbanization, deficits ineducation, and deficits in living standards. While recognizing the heterogeneity of Appalachia, thereport stressed that
Appalachia is more striking in its homogeneity than in its diversity. Unlikethough they may be, its subregions share an unhappy distinction: ruralAppalachia lags behind rural America; urban Appalachia lags behind urbanAmerica; and metropolitan Appalachia lags behind metropolitan America.
This paper revisits that characterization of Appalachia as a lagging region, each of whoseparts lags its counterparts in the rest of the nation. Using a subset of the original variables orclosely related ones, this study updates and extends Chapter 1, “The Realities of Deprivation,” ofthe 1964 PARC report. Important questions motivate this research:
• Have conditions in Appalachia improved?• Has Appalachia been catching up with the rest of the nation?• Does Appalachia still lag the nation?• Do the “realities of deprivation” remain particularly severe in parts of Appalachia?
This paper has two main parts. The first part probes the findings and conclusions of theoriginal report. It answers the first three questions above and a related one: Is the popular imageof Appalachia, as reflected in the 1964 report, still valid today? The second part has a broaderscope. It examines data for all counties in the continental United States to identify those areas inAppalachia where conditions remain the most severe and areas elsewhere in the nation wherepeople suffer from similarly adverse conditions.
3
GEOGRAPHICAL CATEGORIES
This report, like the 1964 one, examines statistics for Appalachia as a whole and forvarious partitions of Appalachia. There are noteworthy methodological differences, however.Congress defines the boundaries of official Appalachia, and there have been changes since the1964 report. This study uses current definitions. Therefore, the statistics for the 1960s and 1990sinclude all 13 Appalachian states, not merely the ten states included in the 1964 report.Accordingly, the numbers for the 1960s here are not identical to those in the 1964 report.
This analysis adds subregions and categories of counties not found in the original report.The three subregions examined here, Northern, Central, and Southern Appalachia, are officialdesignations of the Appalachian Regional Commission. Metropolitan and nonmetropolitan, twocategories used in the original report, here reflect the current official designations by the Office ofManagement and Budget. Also, instead of defining counties as only metropolitan ornonmetropolitan, this study uses a seven category continuum adapted from a system defined bythe U.S. Department of Agriculture. The county categories are
Metropolitan Counties1. Counties of metropolitan areas of 1 million population or more2. Counties in metropolitan areas of 250,000 to 1 million population3. Counties in metropolitan areas of fewer than 250,000 populationNonmetropolitan4. Counties adjacent to a metropolitan area with an urban population of 20,000 or more5. Counties not adjacent to a metropolitan area with an urban population of 20,000 or
more6. Counties adjacent to a metropolitan area with an urban population of fewer than
20,0007. Counties not adjacent to a metropolitan area with an urban population of 20,000 or
more
These seven urbanization categories capture directly some concerns of the original report.Classification of nonmetropolitan counties by size of the urban population, that is people living incities or towns of 2,500 or more, recognizes what the 1964 report characterized as the lack of“proper towns” in parts of Appalachia. The focus on adjacency to metropolitan areas, defined notonly as physical adjacency but also in terms of job commuting to the central metropolitancounties, helps to identify the spatial separation from job opportunities and human services notedby the original report. In the text, the term, most rural, refers to categories 6 and 7, which havethe fewest people living in urban areas. The term, most isolated, refers to categories 5 and 7,which have the least access to metropolitan economies in terms of jobs. Category 7, therefore, isthe most rural, most isolated group, whereas Category 5 is isolated but relatively urban andCategory 6 is more connected to metropolitan America, hence, less isolated, but still relativelyrural.
Although the correspondence between urbanization categories and various socio-economic characteristics should not be overdrawn, these seven categories do represent a
4
continuum not only of urbanization but also of several socio-economic conditions. Much of theAppalachian condition relative to the rest of the nation can be understood in terms of itsurbanization relative to the nation.
To gain further perspective on the Appalachian condition, the region is compared inseveral instances to other regions of the country. The comparison standard is the eight regionsdefined by the Bureau of Economic Analysis (BEA):1. New England2. Mideast3. Great Lakes4. Plains
5. Southeast6. Southwest7. Rocky Mountain8. Far West.
Their boundaries overlap with Appalachia’s boundaries, with Appalachia containing parts of theMideast, Great Plains, and Southeast. Comparisons between Appalachia and the BEA regionsrefer exclusively to their non-Appalachian portions.
THE HALLMARKS OF APPALACHIA?
The 1964 report characterized Appalachia in terms of several gaps between it and thenation and presented supporting statistics. This report takes as its questions the answers of the1964 report. It asks whether those answers are still valid. The gaps, both then and now, areexamined to determine whether they are indeed still hallmarks of Appalachia. As in 1964, thecomparison is between the region and the nation. The nation, however, is defined here to be therest of the nation, that is, the non-Appalachian United States. How does Appalachia compare tothe rest of the nation? To make the text more graceful, the terms rest-of-the-nation or non-Appalachian are used sparingly. Unless indicated otherwise, the comparisons are always ofAppalachia and its parts to the rest of the nation and its corresponding parts.
Lack of urbanization?
Appalachia’s image is rural. The 1964 report stressed a “lack of urbanization.” Yet, evenin 1969 the majority of Appalachians (59 percent) lived within the boundaries of today’smetropolitan areas. The popular rural image best fits Central Appalachia, where both in 1969 andtoday only 15 percent of the population resides in metropolitan areas. In contrast, NorthernAppalachia and Southern Appalachia were and remain 60 to 65 percent metropolitan.
Only in a relative sense is Appalachia’s rural image accurate. Although three of every fiveAppalachians live in metropolitan areas, four of five of the rest of the nation’s population do so.The metropolitan share even reaches 96 percent for the Mideast and 91 percent for the Far West.Likewise, fewer than 10 percent of Appalachians live in the most rural counties (Categories 6 and7), but only five percent of the rest of the nation does. Within metropolitan areas, moreover,Appalachia’s population is disproportionately in the smaller ones (Category 3), which house onethird of the Appalachian population but only one-sixth of the rest of the nation’s population.Finally, whereas 64 percent of the non-Appalachian population is in metropolitan areas of 250,000
5
or more (Categories 1 and 2), only 26 percent of the Appalachian population lives in these largecities. At the extreme is Central Appalachia with no metropolitan areas of 250,000 or more.
Many comparisons between Appalachia and the rest of the nation reflect the fact thatAppalachia includes few large cities and is relatively rural. Yet, Appalachia is not unique amongAmerican regions in this regard. The Plains region matches Appalachia at only 59 percentmetropolitan, and the Rocky Mountain region is but 64 percent metropolitan.
In summary, Appalachia remains relatively rural, but not uniquely rural or predominatelyrural. Its population is one-fourth in large metropolitan areas (Categories 1 and 2), three fifths insmaller metropolitan areas (Category 3) or adjacent to metropolitan areas (Categories 4 and 6),one-eighth in more isolated, freestanding urban counties (Category 5), and one twentieth in themost isolated, most rural counties (Category 7). Appalachia has proportionally fewer people inlarge metropolitan areas and proportionally more people in smaller metropolitan areas as well asevery nonmetropolitan category.
Note that these findings reflect the official boundaries. Had Atlanta, Cincinnati,Columbus, and other major cities on the very edge of official Appalachia been included in theregional definition, Appalachia’s urbanization gap would not be as pronounced. In short,Appalachia was defined to be a relatively rural area with few large cities. Likewise, the ruralnature of Central Appalachia stands out precisely because it has been defined as one of threesubregions — even though it includes less than 10 percent of the Appalachian population. Thus,there is a degree of circularity in regional definitions. A region, like Appalachia, popularly viewedand partially defined as the rural backyard of several states, consequently will be more rural thanother regions.
The important definitional questions are (1) whether the region is properly defined for theobjective of effecting regional economic development, (2) whether its definition as a more ruralregion has implications regarding other socio-economic conditions, and (3) whether thoseconditions are primarily rural attributes or somehow more fundamentally Appalachian attributes.The first of these questions is beyond the scope of this report, but the other two are considered inthis section.
Low Income?
In 1969 Appalachia’s per capita income was 78 percent of the rest of the nation’s. By1992 it had reached 83 percent. Again Central Appalachia stands out. It climbed from 56 to 67percent of the non-Appalachian level but remains by far the subregion with the lowest income.Northern Appalachia, the leader in 1969 at 85 percent of the non-Appalachian level, remains at 85percent today. Southern Appalachia has almost caught up with Northern Appalachia, going from73 to 83 percent of the non-Appalachian level.
Most of the Appalachian per capita income gap can readily be understood in terms ofurbanization. Metropolitan areas have higher per capita incomes (and often higher costs ofliving). Excluding Appalachia, the nation’s nonmetropolitan areas have only 78 percent of the
6
national per capita income in 1992, up from 76 percent in 1969. Thus, the nation has a persistentmetro-nonmetro income gap. The statistics for Appalachia and its subregions are pulleddownward precisely because Appalachia has relatively few metropolitan areas, particularly largeones, which have the highest per capita incomes.
The Appalachian income lag is far less severe if examined more carefully with respect tourbanization. As the 1964 report pointed out, metropolitan Appalachia lags metropolitanAmerica and nonmetropolitan Appalachia lags nonmetropolitan America. The gaps, however, arefar smaller than heretofore believed — if one adjusts for the size of metropolitan area. Overall,metropolitan Appalachia improved from 80 percent to 86 percent of the national metropolitan percapita income between 1969 and 1992. Dividing metropolitan areas into the three populationcategories reveals that Appalachia has reached 92 to 96 percent for every category (compared to85 to 91 percent in 1969). Meanwhile, nonmetropolitan Appalachia has climbed from 89 to 93percent of the nonmetropolitan income level. From a population welfare standpoint, theseremaining gaps may well be unimportant because of differences in cost of living.
The Appalachian income lag can be formally divided into the part that is due tourbanization differences and the part that is due to income differences within each urban-ruralcategory. As noted, Appalachia has 83 percent of the national per capita income. Seen in anotherway, the gap is 17 percentage points. Less urbanization causes 10 percentage points of the gap,and lower per capita incomes 7 percentage points. These estimates result from multiplying thenational population distribution among urban categories times the Appalachian per capita incomefor each category. Thus, the resultant Appalachian per capita income standardized forurbanization is 93 percent of the national one.
Only one category of county still exhibits the income lag commonly associated withAppalachia. People in the most rural, most isolated Appalachian counties (Category 7) still haveonly 82 percent of the per capita income of their counterparts elsewhere in the country. Yet, thisgroup is only 5 percent of Appalachia’s population. In Central Appalachia, however, these placesaccount for 20 percent of the population; they have only 77 percent of the per capita income ofsuch places elsewhere.
In summary, again relatively few places seem to fit the prevailing image of Appalachia.The others have small income lags relative to their counterparts. Appalachia as a whole hasrelatively low per capita incomes because it has few big cities and more isolated, rural areas. TheAppalachian population distribution along the urban-rural scale causes most of the income lag. Ateach level of the scale except the smallest, Appalachian income is more than 90 percent of thecorresponding national level. Standardizing for urbanization, Appalachia has reached 93 percentof the national level. Furthermore, even unstandardized, Appalachia does not stand out alone.Nonmetropolitan Appalachia has 1 to 2 percent higher per capita income than either the Southeastor Southwest regions, and metropolitan Appalachia has 94 to 98 percent of the per capita incomeof the metropolitan Southeast, Southwest, and Rocky Mountain regions.
Poverty?
7
By reputation Appalachia is a poor region, but that reputation is only partially supportedby statistics. The 1970 census revealed that 18 percent of Appalachians had incomes below theofficial poverty level. That percentage fell to 15.2 percent by the 1990 census. Again, urbanizationmatters. In 1970 the Appalachian poverty rates were 14 percent in metropolitan areas and 23percent elsewhere, while the rest of the United States had rates of 11 and 20 percent, respectively.Hence, 25 years ago Appalachia lagged by three percentage points in each case. By 1990 the twoAppalachian rates were 11 and 16 percent — 1 percentage point higher than the rest of thenation’s metropolitan rate and 2 percentage points higher than the rest’s nonmetropolitan rate.The largest remaining gaps, 3 and 5 percentage points, occur in the relatively isolated counties(Categories 5 and 7).
Appalachia has poverty, considerable poverty, but the region does not stand out relative tothe rest of the nation. Two regions have higher 1990 poverty rates than Appalachia. TheSoutheast and the Southwest have nonmetropolitan rates of 18 and 20 percent and metropolitanrates of 11 and 13 percent. Again, however, when Central Appalachia is considered separately, itfits the Appalachian image. It has a 24 percent nonmetropolitan poverty rate and a 15 percentmetropolitan one. These rates are sharp improvements over its 1970 rates of 36 and 20 percent.
The special case of Central Appalachia becomes clearer when using the urban-ruralcontinuum to examine the three subregions. Except for the most rural, isolated counties, where ithas a 3 percentage point gap, Northern Appalachia is within 1 percentage point of the nation, plusor minus, in each category. Southern Appalachia is never worse than 1 percentage point behindthe nation. Yet, Central Appalachia, despite its marked improvement, lags its counterparts inevery category by 5 to 10 percentage points.
Deficits in Education?
Like the other indicators thus far, educational attainment ties closely to urbanization.Within Appalachia the percentage of the adult population that completed high school ranges from53 percent in the most rural, isolated counties to 79 percent in the largest metropolitan areas.Both statistics are impressive changes from the 1970 Appalachian rates of 27 and 52 percent. Intwo decades, or one high school generation, the isolated rural areas of Appalachia have caught upto the earlier metropolitan rates. During the same period, Appalachia’s large metropolitan areashave caught up with their corresponding national rates of 1970.
Despite this remarkable transformation, Appalachia still lags the nation in educationalattainment. High school graduates nationally now account for 77 percent of adults inmetropolitan areas and 70 percent elsewhere. Appalachia is 7 percentage points behind thenation, with the metropolitan areas 5 percentage points behind and other areas 8 percentagepoints behind. The largest gaps, as in 1970, belong to the two groups of counties that are notadjacent to metropolitan areas. They still lag their counterparts elsewhere in the nation by 10 and15 percentage points.
The Central Appalachian story again can be viewed clearly through the urbanizationcontinuum. Two-thirds of its people reside in the more isolated counties, compared to only 11
8
percent in the North and 15 percent in the South. (Central Appalachia is not synonymous withsuch counties; roughly two-thirds of the Appalachians living in isolated counties are not in CentralAppalachia.) In all, 51 percent of the adults in nonmetropolitan Central Appalachia havecompleted high school, compared to 70 percent in Northern Appalachia and 59 percent inSouthern Appalachia. Thus, only the North has matched the national education level. The rangeis smaller for metropolitan areas, 65 percent in Central Appalachia, 70 percent in Southern, and75 percent in Northern.
Appalachia remains a place apart in terms of the educational attainment of its adultpopulation, but again it does not stand alone. With 62 percent of its nonmetropolitan adultpopulation having completed high school, Appalachia matches the Southeast and comes close tothe Southwest’s 65 percent. The Appalachian lag results largely from Central Appalachia being11 to 21 percentage points behind its counterparts in each urbanization category and fromSouthern Appalachia being 10 to 13 points behind in smaller metropolitan areas and everynonmetropolitan category. In contrast, Northern Appalachia is within 3 percentage points inevery category except the smallest, more isolated counties.
Although the Appalachian lag persists, educational attainment has improved dramaticallyin the region. Note that the measure used here and in the 1964 report incorporates the entireadult population. Increased attainment reflects primarily the education of young people, so thepersistent gap largely reflects the more limited education of older generations. Studies that havefocused exclusively on teenagers and young adults do not show similar education gaps.
Deficits in Living Standards?
The 1964 report examined housing conditions as a measure of living standards. Onehackneyed image of Appalachia is the outhouse, complete with crescent moon carved into thedoor. Indeed, only 61 percent of Appalachian housing units had complete indoor plumbing in1960 compared to 75 percent nationally. Central Appalachia again came closest to matching thepopular image — just 37 percent of its housing had complete plumbing — but the othersubregions both lagged the nation, too, with the North at 70 percent and the South at 55 percent.
Again, there is a clear relationship to urbanization. Within Appalachia complete plumbingin 1960 ranged from 32 percent of housing units in the small, isolated counties to 77 percent inthe most populous metropolitan counties. Outside Appalachia the same range was 51 to 84percent. The Appalachian gap was 6 or 7 percentage points for each of the three metropolitancategories but 21 percentage points for the most rural, isolated counties.
The Appalachian plumbing gap has virtually disappeared. By 1990 all but 2 percent ofAppalachian housing had complete indoor plumbing. Even in Central Appalachia all but 5 percentof housing has full plumbing. The lowest numbers are still found in rural isolated counties, 91percent with complete plumbing in Central Appalachia and 90 percent in Northern Appalachia.This category has the largest gap compared to the rest of the nation, 93 percent versus 96percent.
9
Deficits in Jobs?
Unemployment. The 1964 report described Appalachia as “deeply unemployed.” In 1960the region had 6.8 percent unemployment, and the nation had 5.0 percent. MetropolitanAppalachia’s unemployment exceeded the nation’s other metropolitan areas, 6.5 to 5.0 percent.Similarly, nonmetropolitan Appalachia exceeded its counterparts, 7.2 to 5.2 percent. For everyurban-rural category, Appalachia had unemployment rates 1.3 to 2.3 percentage points higher,despite the considerable outmigration of the previous decade. Only one region had a higherunemployment rate than Appalachia, the Mideast with a nonmetropolitan rate of 7.6 percent.
Thirty years later Appalachia’s unemployment rate was again 6.8 percent, but the rest ofthe nation had climbed to 6.3 percent. The Appalachian lag had been cut by three-quarters, butironically by the rest of the nation moving toward the Appalachian level. MetropolitanAppalachia even had a lower unemployment rate than the remaining metropolitan areas, 6.1percent to 6.2 percent. Nonmetropolitan Appalachia had 7.9 percent unemployment — stillhigher than the nation’s nonmetropolitan rate by 1.1 percentage points but smaller than its former2.0 percentage point gap. The seven-part metropolitan continuum is again relevant. Appalachiais better off than the rest of the nation for the first two categories but worse off for the next five.The biggest Appalachian gap remains in the most rural, most isolated counties. Their 8.7 percentunemployment rate is 2.0 percentage points higher than its national counterpart.
Appalachia now has lower unemployment rates than several regions. Its 1990metropolitan rate is lower than those of New England, Great Lakes, Southwest, and Far West.Its nonmetropolitan rate is lower than the Southwest’s and Far West’s.
Central Appalachia again comes closest to fitting the region’s image. Its 1990unemployment rate was 10.2 percent, while Northern Appalachia’s was 7.3 percent and SouthernAppalachia’s 5.7 percent. Central Appalachia’s nonmetropolitan rate of 10.7 percent, up from 8.9percent in 1960, is almost 4 percentage points higher than the corresponding national rate andexceeds the nonmetropolitan rate of every region by 2.5 percentage points or more. CentralAppalachia’s metropolitan rate of 7.7 percent, down from 6.9, is greater than the unemploymentrate of every region. In sharp contrast, Southern Appalachia had a lower nonmetropolitanunemployment rate than every region except the Mideast and the Plains and a lower metropolitanrate than all but the Plains and Rocky Mountains.
Jobs. Appalachia’s job gap is “far greater” than the unemployment statistics suggest,argued the original report, because of “the many men and women who, in despair of ever findingjobs, have given up the search and withdrawn from the labor force.” Unemployment statistics doindeed underestimate the number of people who would work if jobs were available (although notnecessarily any more so for Appalachia than for other regions with histories of highunemployment). An alternative measure is the jobs to people ratio. Use of the unemploymentrate implies that only the officially unemployed want a job, whereas use of the jobs/people ratioimplies that everyone wants a job, including children, elderly, students, disabled, and prisoners.Since the truth is somewhere in between, this study examines both measures.
10
The jobs/people ratio confirms the Appalachian job gap of the 1960s. Appalachia had 40jobs per 100 people in 1969, while the rest of the nation had 46. All the Appalachian subregionslagged the nation, ranging from Central Appalachia with 31 jobs per 100 people to SouthernAppalachia with 43 jobs per 100. Metropolitan Appalachia at 42 jobs, lagged behind every U.S.region by 4 to 7 jobs, while nonmetropolitan Appalachia at 37 jobs was 2 to 7 jobs behind everyregion. Controlling for urbanization does not make these gaps disappear. The three Appalachiansubregions lagged behind all their counterparts by urbanization category with but threeexceptions. The mid-sized metropolitan areas and the more urban nonmetropolitan counties ofSouthern Appalachia (Categories 2, 4, and 5) have more jobs per capita than their nationalcounterparts.
By 1992 metropolitan Appalachia had reached 51 jobs per 100 people, a gain of 9, andnonmetropolitan Appalachia 45 jobs, a gain of 8. The rest of the nation had similar gains,however, leaving Appalachia still 5 jobs per 100 behind in metropolitan areas and 4 jobselsewhere. The subregions still lag in every category except for the same three in SouthernAppalachia. As before, no U.S region has a lower jobs/people ratio than Appalachia in itsmetropolitan areas, but nonmetropolitan Appalachia has caught up with one region, theSouthwest.
The jobs/people ratio shows considerable progress but confirms the continued deficit ofjobs in Appalachia. The present deficit may be less severe than these numbers suggest because ofdemographic change. Appalachians have adjusted to the deficit by moving out of the region sincethe 1950s. The result is a relatively elderly population. Quite likely, if the jobs/people ratios wereadjusted for age of population, the Appalachian job deficit would be smaller.
Altogether, these numbers support a popular image. Given the number of people whochoose to remain in Appalachia, there were and are not enough jobs. Consequently, labor forceparticipation and incomes are depressed. Some observers claim that an active informal,unreported economy closes the job gap, but the size of the informal economy has not beenmeasured reliably and there is no evidence that it provides more jobs in Appalachia thanelsewhere.
Job Growth. One image is incorrect, however. The Appalachian economy is neitherdeclining nor stagnating. Although the job deficit persists, Appalachia is creating new jobs andgrowing faster than many other parts of the country. The number of jobs in nonmetropolitanAppalachia increased by 41 percent from 1969 to 1992 — matching, not lagging, the job growthof nonmetropolitan America. Metropolitan Appalachia gained 41 percent in jobs, too, but othermetropolitan areas gained 58 percent. Northern Appalachia, in this case, pulls down theAppalachian average with its metropolitan growth of 18 percent and nonmetropolitan growth of27 percent. On this measure, Central Appalachia bests the nation, growing 65 and 53 percent, asdoes Southern Appalachia, growing 73 and 52 percent. Even with the dampening effect ofNorthern Appalachia, nonmetropolitan Appalachia grew faster than the Great Lakes, Plains, andSoutheast, and metropolitan Appalachia grew faster than New England, the Mideast, and theGreat Lakes.
11
Population Decline?
Population decline and outmigration have been hallmarks of the Appalachian image sincemid-century. The 1964 report noted that Appalachia lost 2 million people due to migrationbetween 1950 and 1960. Its population only grew 1 percent that decade, while the nation grew20 percent. The report argued, “Population trends in Appalachia offer the most convincingstatistics to prove the deficit of opportunities which pervades the entire region.”
Today’s data are markedly different. Appalachia is growing, although not as fast as thenation. Appalachia’s population increased 16 percent between 1969 and 1992, while the nation’spopulation increased 28 percent. The growth lag is primarily metropolitan, 14 percent growthversus 30 percent. The nonmetropolitan lag is relatively small, 17 percent growth versus 20percent. A dearth of dynamic cities is the root of Appalachia’s slower than average growth.
A closer look reveals that parts of Appalachia are growing faster than their nationalcounterparts. Southern Appalachia has no growth lag. Its metropolitan portion exceeds thenation, 41 percent growth to 30 percent, and its nonmetropolitan portion leads the nation 27percent to 20 percent. It leads the nation in all but the second of the seven urbanizationcategories. Central Appalachia, although lagging the nation overall, is only 2 percentage pointsbehind in the nonmetropolitan rate and leads the nation by 10 to 12 percentage points in the twomost rural categories. For all Appalachia, these most rural counties have grown faster than theirnational counterparts, 16 percent versus 5 percent in the case of the most rural, most isolatedcounties.
Appalachia not only is no longer stagnant or declining it is growing faster than severalother regions. Nonmetropolitan Appalachia grew faster than the Great Lakes or the Plains, andmetropolitan Appalachia grew faster than New England, the Mideast and the Great Lakes.
This time Northern Appalachia provides the lone exception to fit the popular image.Heavily hit by the transformation of manufacturing and coal mining, it only grew 2 percent inpopulation from 1969 through 1992. Its metropolitan areas declined by 2 percent, while itsnonmetropolitan areas grew only 10 percent. In each category, its metropolitan areas lagged thenation by more than 30 percentage points, although population loss occurred only in the mostpopulous category (primarily the Pittsburgh area). All its nonmetropolitan county categorieslagged the nation, too, except the most rural, isolated one, which grew 9 percent but onlyaccounts for 2 percent of the subregion’s population. Perhaps the most positive statement thatcan be made is that, despite the industrial transformation that affected the region, all categories ofNorthern Appalachia grew 1 to 9 percent except the largest metropolitan one.
12
Summary: The Three Questions
In addition to updating the 1964 report and reexamining its image of Appalachia, thisanalysis sought to answer three important questions. Yes is the answer to all three questions.This section notes a few main points of evidence.
1. Fact: Conditions in Appalachia have improved greatly.
• The percentage of Appalachians in poverty declined from 18 percent to 13 percent between1970 and 1990.
• The percentage of adults who graduated high school jumped from 44 percent to 68 percent.• The percentage of housing units with complete plumbing has leaped from 61 percent to 98
percent between 1960 and 1990.• The number of jobs per 100 people jumped from 40 in 1969 to 49 in 1992.• The number of jobs increased 41 percent between 1969 and 1992.• Appalachia’s population increased 16 percent between 1969 and 1992.
2. Fact: Appalachia has been catching up with the rest of the nation.
• Appalachian per capita income has reached 93 percent of the national level, standardizing forlevel of urbanization.
• Appalachian per capita income for nonmetropolitan areas is higher than that of the Southeastand Southwest regions of the United States.
• Appalachian poverty rates are below Southeastern and Southwestern ones.• Metropolitan Appalachia has 1 person per 100 more in poverty than do the rest of the nation’s
metropolitan areas; nonmetropolitan Appalachia has 2 people per 100 more than itscounterpart.
• Appalachia’s metropolitan unemployment rate in 1990 was 0.1 percentage point lower thanthe nation’s.
• Employment growth is greater in Appalachia than in several U.S. regions.• Appalachia’s population is growing faster than some other regions’.
3. Fact: Appalachia still lags the nation.
• The most rural, most isolated Appalachian counties have only 82 percent of the per capitaincome of such counties elsewhere.
• The most isolated Appalachian counties have 3 to 5 more people per 100 in poverty than suchcounties elsewhere.
• Central Appalachia has considerably higher poverty rates than the nation, with 24 people per100 living in poverty.
• The nonmetropolitan unemployment rate in Appalachia was still 2 percentage points higherthan the nation’s in 1990 and was almost 11 percent in Central Appalachia..
• Appalachia has lower educational attainment than the rest of the nation, with 7 fewer highschool graduates per 100 adults.
• Only half the adults in nonmetropolitan Central Appalachia have graduated high school.• • Appalachia has six fewer jobs per 100 people than the rest of the nation.
13
WHERE DO THE REALITIES OF DEPRIVATION REMAIN PARTICULARLYSEVERE?
Heterogeneity characterizes Appalachia. For example, Central Appalachia has the mostpoverty, and Northern Appalachia the least growth. Likewise, metropolitan areas have higher percapita incomes, higher education levels, and lower unemployment rates than other places. Thissection takes a closer look within the region and compares it to other parts of the country. Itdoes so using maps that depict all counties in the continental United States. The fundamentalquestions are where in Appalachia do conditions remain particularly adverse and where in the restof the nation do people suffer from similar conditions. Again, the variables are based on theoriginal 1964 report and its characterization of Appalachia.
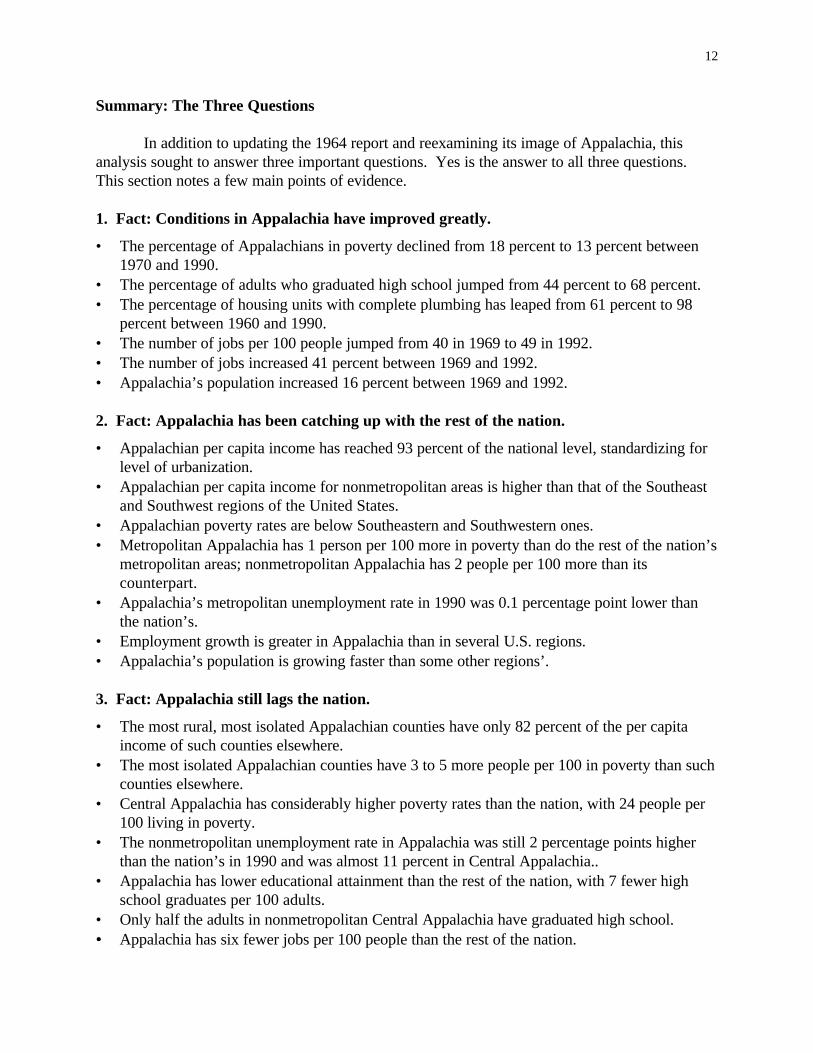
Poverty 1990
In the 837 shaded counties below, more than 20 percent of the people lived in poverty in1990. A cluster of Appalachian counties centered on Kentucky is readily apparent. Perhaps morestriking is the paucity of shaded Appalachian counties to the north and south — testimony to thediversity of Appalachia. Also, evident are several clusters of high poverty outside Appalachia.
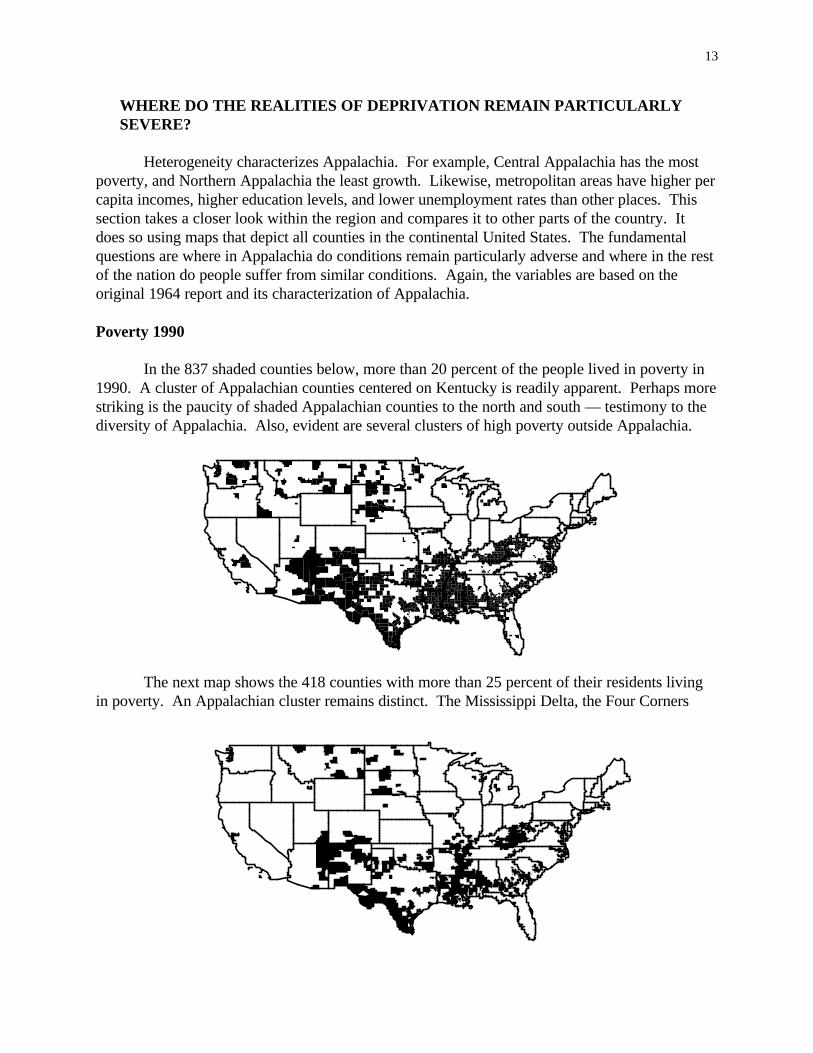
The next map shows the 418 counties with more than 25 percent of their residents livingin poverty. An Appalachian cluster remains distinct. The Mississippi Delta, the Four Corners
14
area, and the Texas border come more sharply into focus as other regions of extreme poverty.
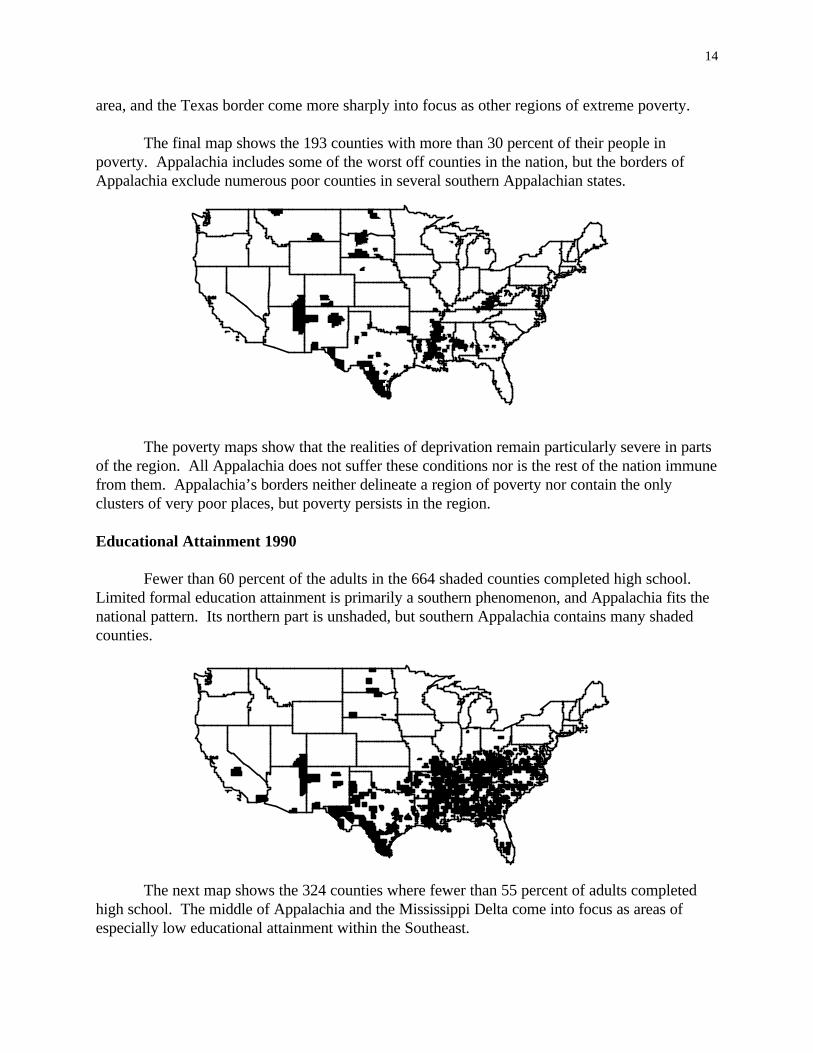
The final map shows the 193 counties with more than 30 percent of their people inpoverty. Appalachia includes some of the worst off counties in the nation, but the borders ofAppalachia exclude numerous poor counties in several southern Appalachian states.
The poverty maps show that the realities of deprivation remain particularly severe in partsof the region. All Appalachia does not suffer these conditions nor is the rest of the nation immunefrom them. Appalachia’s borders neither delineate a region of poverty nor contain the onlyclusters of very poor places, but poverty persists in the region.
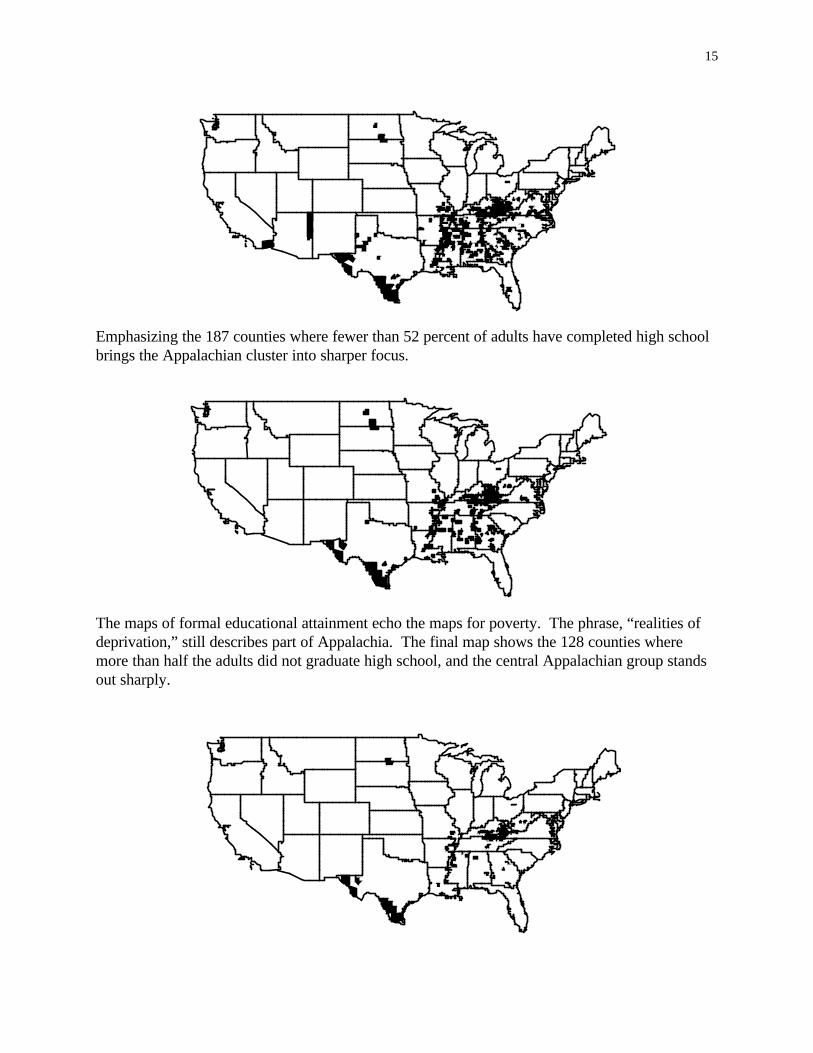
Educational Attainment 1990
Fewer than 60 percent of the adults in the 664 shaded counties completed high school.Limited formal education attainment is primarily a southern phenomenon, and Appalachia fits thenational pattern. Its northern part is unshaded, but southern Appalachia contains many shadedcounties.
The next map shows the 324 counties where fewer than 55 percent of adults completedhigh school. The middle of Appalachia and the Mississippi Delta come into focus as areas ofespecially low educational attainment within the Southeast.
15
Emphasizing the 187 counties where fewer than 52 percent of adults have completed high schoolbrings the Appalachian cluster into sharper focus.
The maps of formal educational attainment echo the maps for poverty. The phrase, “realities ofdeprivation,” still describes part of Appalachia. The final map shows the 128 counties wheremore than half the adults did not graduate high school, and the central Appalachian group standsout sharply.
16
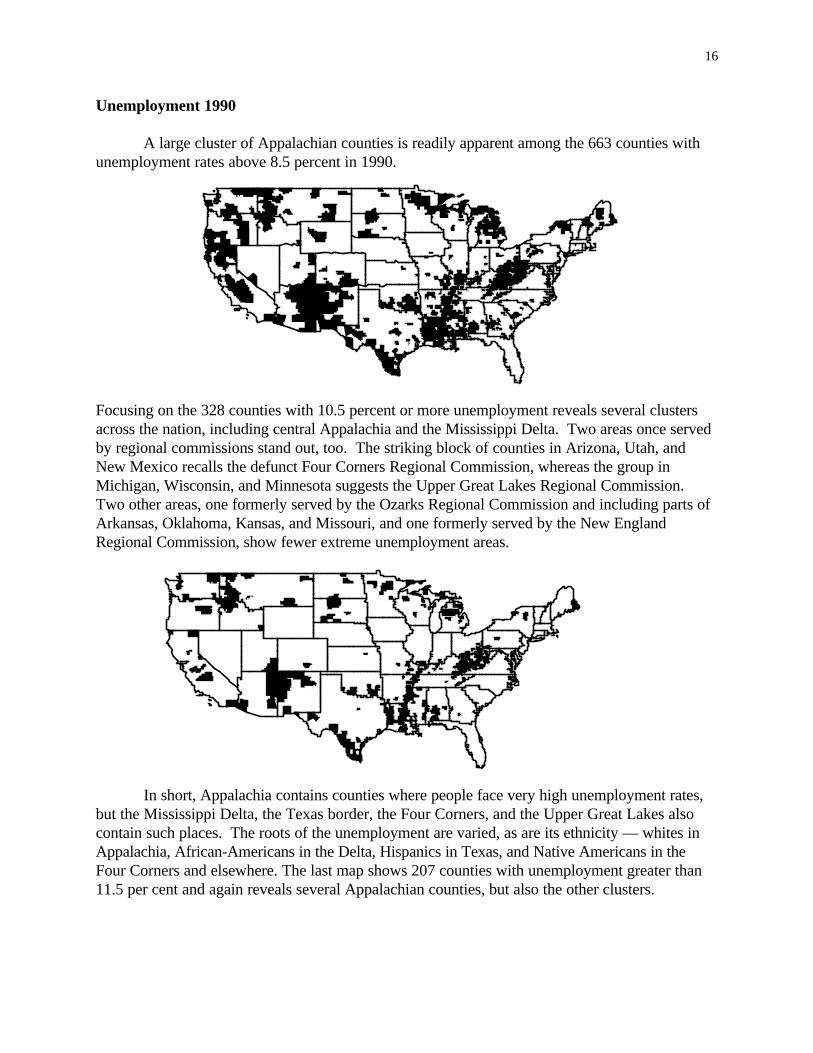
Unemployment 1990
A large cluster of Appalachian counties is readily apparent among the 663 counties withunemployment rates above 8.5 percent in 1990.
Focusing on the 328 counties with 10.5 percent or more unemployment reveals several clustersacross the nation, including central Appalachia and the Mississippi Delta. Two areas once servedby regional commissions stand out, too. The striking block of counties in Arizona, Utah, andNew Mexico recalls the defunct Four Corners Regional Commission, whereas the group inMichigan, Wisconsin, and Minnesota suggests the Upper Great Lakes Regional Commission.Two other areas, one formerly served by the Ozarks Regional Commission and including parts ofArkansas, Oklahoma, Kansas, and Missouri, and one formerly served by the New EnglandRegional Commission, show fewer extreme unemployment areas.
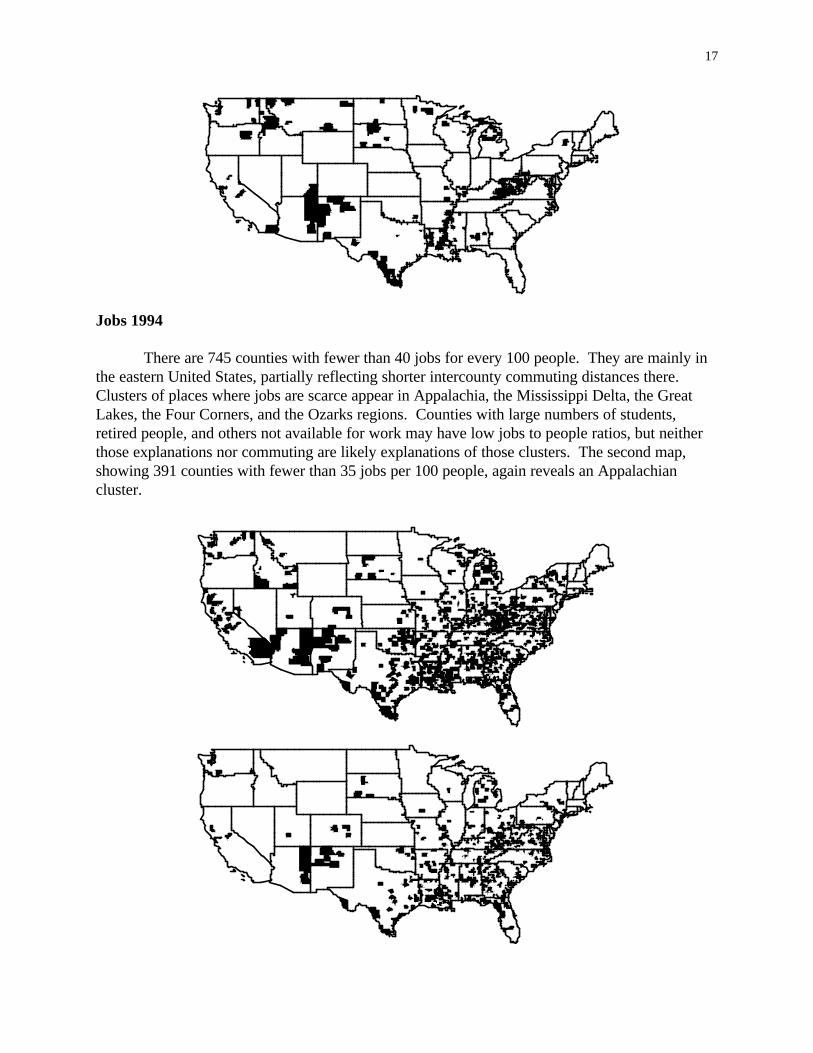
In short, Appalachia contains counties where people face very high unemployment rates,but the Mississippi Delta, the Texas border, the Four Corners, and the Upper Great Lakes alsocontain such places. The roots of the unemployment are varied, as are its ethnicity — whites inAppalachia, African-Americans in the Delta, Hispanics in Texas, and Native Americans in theFour Corners and elsewhere. The last map shows 207 counties with unemployment greater than11.5 per cent and again reveals several Appalachian counties, but also the other clusters.
17
Jobs 1994
There are 745 counties with fewer than 40 jobs for every 100 people. They are mainly inthe eastern United States, partially reflecting shorter intercounty commuting distances there.Clusters of places where jobs are scarce appear in Appalachia, the Mississippi Delta, the GreatLakes, the Four Corners, and the Ozarks regions. Counties with large numbers of students,retired people, and others not available for work may have low jobs to people ratios, but neitherthose explanations nor commuting are likely explanations of those clusters. The second map,showing 391 counties with fewer than 35 jobs per 100 people, again reveals an Appalachiancluster.
18
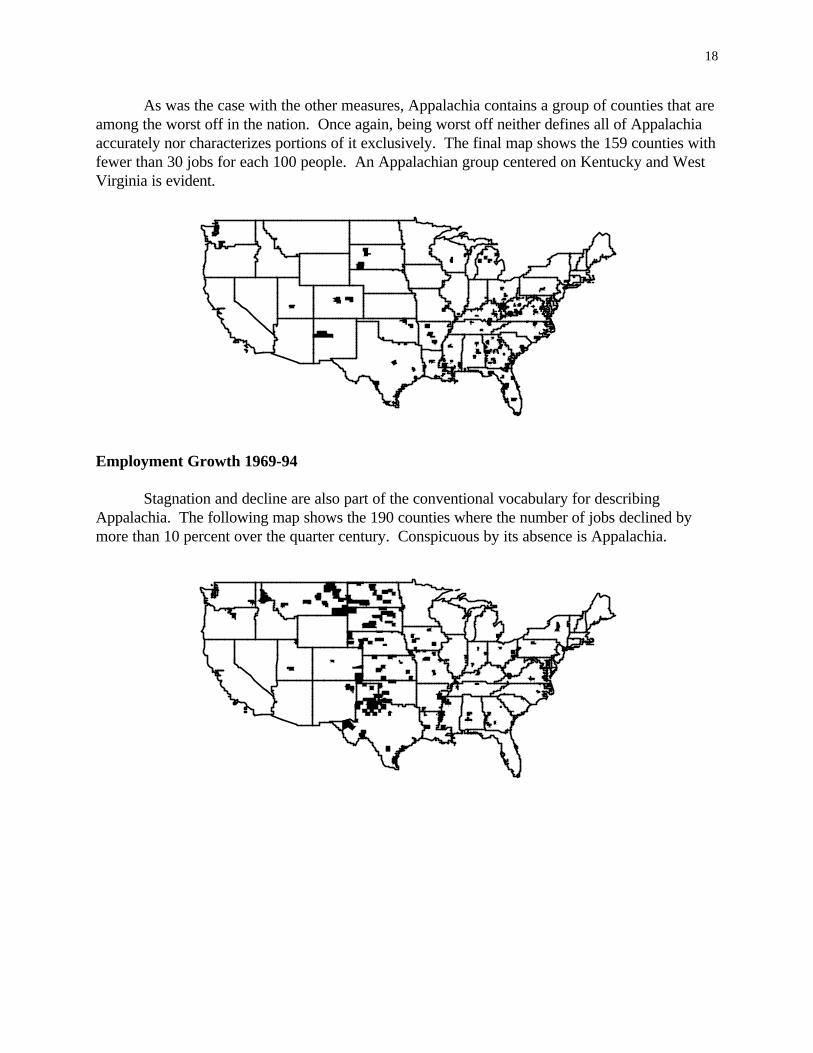
As was the case with the other measures, Appalachia contains a group of counties that areamong the worst off in the nation. Once again, being worst off neither defines all of Appalachiaaccurately nor characterizes portions of it exclusively. The final map shows the 159 counties withfewer than 30 jobs for each 100 people. An Appalachian group centered on Kentucky and WestVirginia is evident.
Employment Growth 1969-94
Stagnation and decline are also part of the conventional vocabulary for describingAppalachia. The following map shows the 190 counties where the number of jobs declined bymore than 10 percent over the quarter century. Conspicuous by its absence is Appalachia.
19
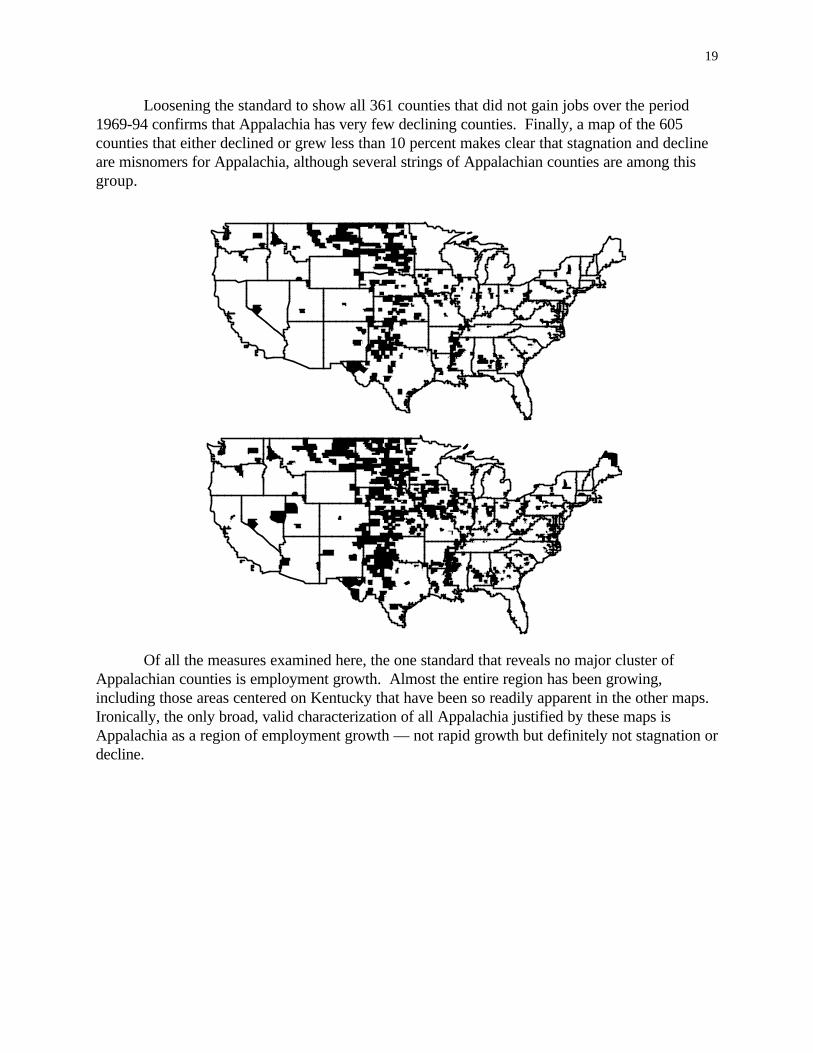
Loosening the standard to show all 361 counties that did not gain jobs over the period1969-94 confirms that Appalachia has very few declining counties. Finally, a map of the 605counties that either declined or grew less than 10 percent makes clear that stagnation and declineare misnomers for Appalachia, although several strings of Appalachian counties are among thisgroup.
Of all the measures examined here, the one standard that reveals no major cluster ofAppalachian counties is employment growth. Almost the entire region has been growing,including those areas centered on Kentucky that have been so readily apparent in the other maps.Ironically, the only broad, valid characterization of all Appalachia justified by these maps isAppalachia as a region of employment growth — not rapid growth but definitely not stagnation ordecline.
20
THEN AND NOW
The characterization of Appalachia promulgated by the Report of the President’sAppalachian Regional Commission in 1964 is of limited validity today. At the time it reinforcedthe popular image of Appalachia — low income, high poverty, limited education, poor livingstandards, job deficits, high unemployment, outmigration, stagnation, and decline. Today thoseconditions do not characterize the region as a whole. Current data support neither the 1964characterization of Appalachia as a region apart statistically nor the 1964 assertion thatAppalachians lack fully active membership in the American society. Instead, the statistics show aregion that has improved greatly, still lags the nation on some broad indicators, and still containssome of the worst off counties in the nation.
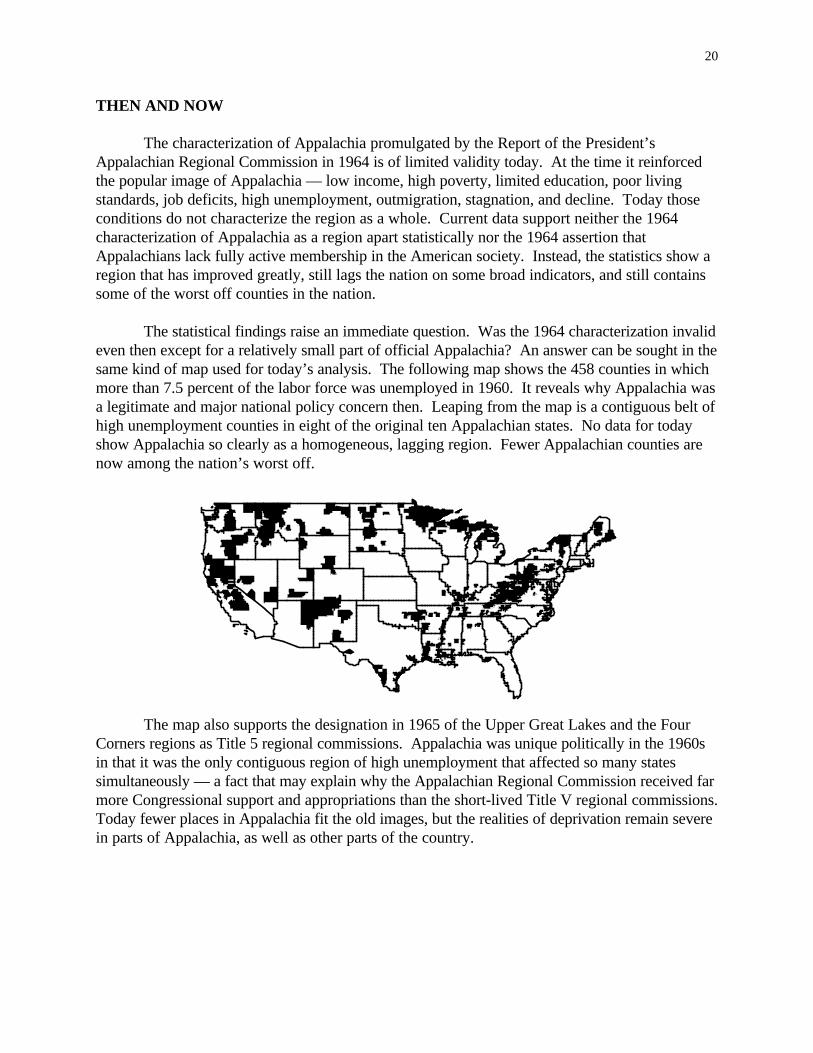
The statistical findings raise an immediate question. Was the 1964 characterization invalideven then except for a relatively small part of official Appalachia? An answer can be sought in thesame kind of map used for today’s analysis. The following map shows the 458 counties in whichmore than 7.5 percent of the labor force was unemployed in 1960. It reveals why Appalachia wasa legitimate and major national policy concern then. Leaping from the map is a contiguous belt ofhigh unemployment counties in eight of the original ten Appalachian states. No data for todayshow Appalachia so clearly as a homogeneous, lagging region. Fewer Appalachian counties arenow among the nation’s worst off.
The map also supports the designation in 1965 of the Upper Great Lakes and the FourCorners regions as Title 5 regional commissions. Appalachia was unique politically in the 1960sin that it was the only contiguous region of high unemployment that affected so many statessimultaneously — a fact that may explain why the Appalachian Regional Commission received farmore Congressional support and appropriations than the short-lived Title V regional commissions.Today fewer places in Appalachia fit the old images, but the realities of deprivation remain severein parts of Appalachia, as well as other parts of the country.