Embed Size (px)
Citation preview
SOCIO-ECONOMIC MONITORING IN TARGET
VILLAGES
Report to
August 2002
By: Edward H B Pollard Eryholme, England DL2 2PF. [email protected]

Edward H B Pollard Socio-economic monitoring protocol
i
Executive Summary This report is based on work carried out from May to July 2002. It outlines the general background to monitoring and why it is essential for the successful running of conservation / development programs, and for the implementation of The Nature Conservancy’s Conservation by Design strategy. Specifically this report deals with a socio-economic monitoring program for target villages chosen by TNC. The method is outlined and advice given on the design of questionnaires and their implementation. Suggestions are given on the implementation of this protocol. It is recommended that this protocol is implemented as soon as possible, preferably before other activities such as participatory rural appraisal or participatory conservation planning. As well as providing basic background information on the villages it can act as a tool to introduce TNC to the target villages. This protocol was field tested in 4 villages in the Segah river watershed. The results of this survey are included in the appendices and an analysis of the results presented in the report. They show that although there is some variation in the wealth of the villages they are all still highly dependent on the forest for their livelihoods.
Acknowledgements I would like to thank Scott Stanley, TNC Kaltim program manager for getting me back to Kalimantan and giving me the opportunity to put my money where my mouth is. In the Berau field office I would like to thank Daryatun, Agus Heryanto and Hery Romadan for them putting up with my questions and for their help in the design and testing of the protocol. Finally I would like to thank Dr Cam Webb for writing the forest monitoring protocol for Lore Lindu, this is the clearest, simplest most robust monitoring protocol I know. This is the one that I have tried, and probably failed, to emulate. This work was funded from the USAID Orang-utan habitat conservation grant number :

Edward H B Pollard Socio-economic monitoring protocol
ii
Contents Executive Summary............................................................................................................................................................................i Acknowledgements ............................................................................................................................................................................i Contents ............................................................................................................................................................................................ ii Introduction....................................................................................................................................................................................... 1
Village monitoring goals. ............................................................................................................................................................. 1 What is monitoring? .................................................................................................................................................................... 1 Why monitor? .............................................................................................................................................................................. 1 What to monitor?......................................................................................................................................................................... 2 Baselines..................................................................................................................................................................................... 2
Methods............................................................................................................................................................................................ 3 Monitoring location and timing. ................................................................................................................................................... 3
Target Villages ....................................................................................................................................................................... 3 Workplan................................................................................................................................................................................ 4
Questionnaire design .................................................................................................................................................................. 5 Baseline Data......................................................................................................................................................................... 5 Monitoring Data...................................................................................................................................................................... 6
Sample size................................................................................................................................................................................. 6 Baseline Data......................................................................................................................................................................... 6 Monitoring Data...................................................................................................................................................................... 6
Interview technique ..................................................................................................................................................................... 6 Data management....................................................................................................................................................................... 7
Wealth scores ........................................................................................................................................................................ 8 Data analysis and result reporting............................................................................................................................................... 9
Integration with GIS ............................................................................................................................................................. 10 Field Test........................................................................................................................................................................................ 11
Justification ............................................................................................................................................................................... 11 Results ...................................................................................................................................................................................... 12
Long Ayan............................................................................................................................................................................ 12 Long Ayap............................................................................................................................................................................ 12 Long Laai. ............................................................................................................................................................................ 13 Long P’ai (Punan Mahkam) ................................................................................................................................................. 13 Long Oking (Punan Segah). ................................................................................................................................................ 13 General Patterns.................................................................................................................................................................. 13
Concluding remarks........................................................................................................................................................................ 15 References and recommended reading ......................................................................................................................................... 16 Appendices..................................................................................................................................................................................... 17
Appendix I: Baseline Tokoh Masyarakat interview sheet .......................................................................................................... 17 Appendix II: Baseline General interview sheet.......................................................................................................................... 18 Appendix III: Monitoring Interview sheet ................................................................................................................................... 20 Appendix IV: Monitoring Tokoh Masyarakat interview sheet..................................................................................................... 22 Appendix V: Coding .................................................................................................................................................................. 23 Appendix VI: Examples of Access data input forms.................................................................................................................. 24
VIa : Baseline Tokoh masyarakat form ................................................................................................................................ 24 VIb : Baseline general form.................................................................................................................................................. 25
Appendix VII: Results from field test in Segah Watershed........................................................................................................ 26 VIIa : General socio-economic information. ......................................................................................................................... 26 VIIb : Tokoh Masyarakat responses. ................................................................................................................................... 28
Figure 1 : Map of Kelai watershed showing villages and timber concessions.................................................................................. 3 Figure 2 : Main database switchboard.............................................................................................................................................. 8 Figure 3 : Map of Segah watershed showing villages and SJL IV area. ........................................................................................ 11
Edward H B Pollard Socio-economic monitoring protocol
1
Introduction
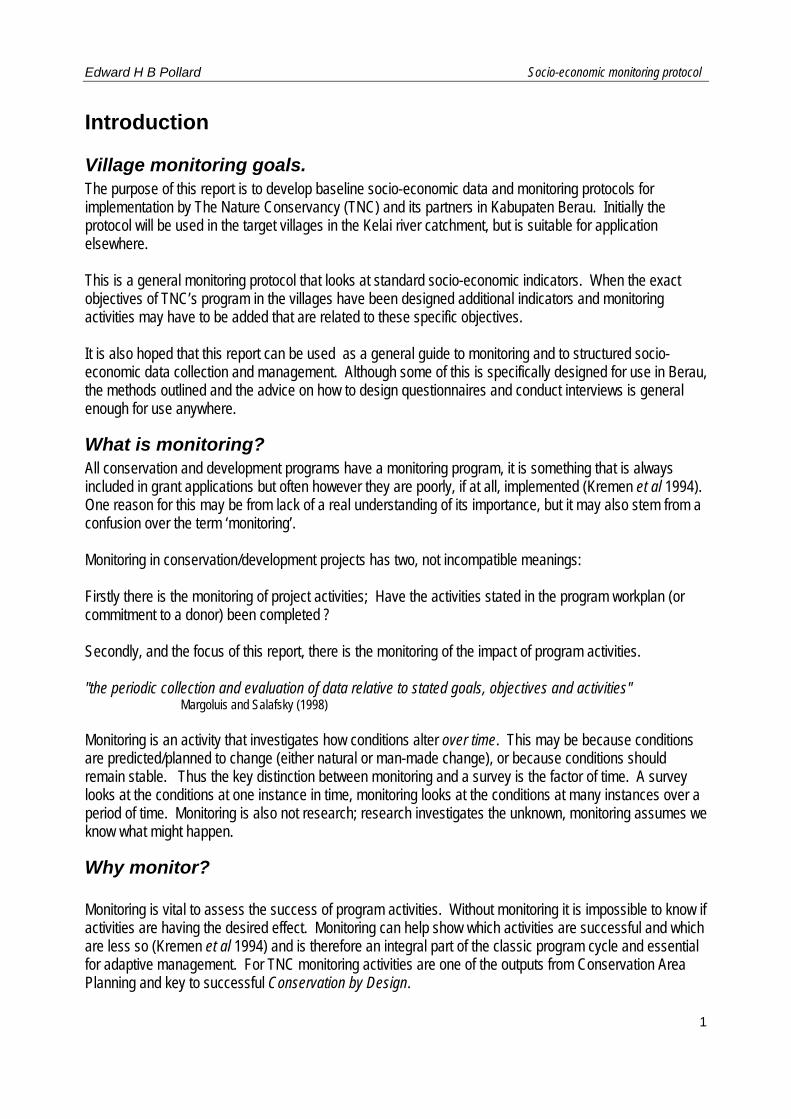
Village monitoring goals. The purpose of this report is to develop baseline socio-economic data and monitoring protocols for implementation by The Nature Conservancy (TNC) and its partners in Kabupaten Berau. Initially the protocol will be used in the target villages in the Kelai river catchment, but is suitable for application elsewhere. This is a general monitoring protocol that looks at standard socio-economic indicators. When the exact objectives of TNC’s program in the villages have been designed additional indicators and monitoring activities may have to be added that are related to these specific objectives. It is also hoped that this report can be used as a general guide to monitoring and to structured socio-economic data collection and management. Although some of this is specifically designed for use in Berau, the methods outlined and the advice on how to design questionnaires and conduct interviews is general enough for use anywhere.
What is monitoring? All conservation and development programs have a monitoring program, it is something that is always included in grant applications but often however they are poorly, if at all, implemented (Kremen et al 1994). One reason for this may be from lack of a real understanding of its importance, but it may also stem from a confusion over the term ‘monitoring’. Monitoring in conservation/development projects has two, not incompatible meanings: Firstly there is the monitoring of project activities; Have the activities stated in the program workplan (or commitment to a donor) been completed ? Secondly, and the focus of this report, there is the monitoring of the impact of program activities. "the periodic collection and evaluation of data relative to stated goals, objectives and activities" Margoluis and Salafsky (1998) Monitoring is an activity that investigates how conditions alter over time. This may be because conditions are predicted/planned to change (either natural or man-made change), or because conditions should remain stable. Thus the key distinction between monitoring and a survey is the factor of time. A survey looks at the conditions at one instance in time, monitoring looks at the conditions at many instances over a period of time. Monitoring is also not research; research investigates the unknown, monitoring assumes we know what might happen.
Why monitor? Monitoring is vital to assess the success of program activities. Without monitoring it is impossible to know if activities are having the desired effect. Monitoring can help show which activities are successful and which are less so (Kremen et al 1994) and is therefore an integral part of the classic program cycle and essential for adaptive management. For TNC monitoring activities are one of the outputs from Conservation Area Planning and key to successful Conservation by Design.
Edward H B Pollard Socio-economic monitoring protocol
2
Monitoring of wealth, health and other socio-economic factors is needed to determine the success of farming extension, compatible economic development or other social programs. Ecological monitoring is used to track the condition of ecosystems, both terrestrial and marine. Monitoring can also guide research priorities. For example if from the monitoring a pattern is noted, such as the decline in the population of an animal, research can be initiated to find out why.
What to monitor? Several factors are important to the successful implementation of a monitoring program. Monitoring programs should be:
• Given clear objectives • Planned in advance and the plan adhered to. • Standardised, each monitoring event follows the same, standard method. • Repeated on a regular basis. • Analysed (monitoring is useless unless the results are investigated)
To help increase the successful implementation of monitoring programs they should be:
• Simple but robust. • Given clear rules for when to stop. • Cost efficient.
In order to achieve this most monitoring programs rely on indicators that illustrate the conditions that are being monitored. Ideally indicators should be:
• Easy to identify. They can be recognised and recorded in the same way by all observers • Easy to sample, therefore analyse in a quantitative or qualitative manner • Widely distributed throughout the area being monitored • Low in variability, they are the same throughout the area being monitored. Additionally if man-
made change is being investigated they should have little natural temporal change. • Interesting. Monitoring is hard work and making the indicators more appealing will make it easier
to complete.
Baselines Typically monitoring should be carried out in comparison to a baseline set of data. A baseline is a “snapshot of the site before or during the initial stages of the initiative” (Russell and Hasselbarger 1998). Many methods are used to collect baseline data. It is not essential to use the same data collection methods in the baseline and monitoring, and usually much more data is collected during the baseline than is used later in monitoring. The key for monitoring is to ensure that the monitoring protocol is compatible with the baseline. Information gathered during the monitoring exercise must be comparable with the baseline. Examples of tools used in baselines for socio-economic modelling are rapid rural appraisal (RRA), participatory rural appraisal (PRA) and formal questionnaires. In ecological monitoring baselines can be determined from, amongst other things, population surveys, remote sensing and permanent plots.

Edward H B Pollard Socio-economic monitoring protocol
Methods
Monitoring location and timing. Target Villages The first application of this protocol is in the target villages defined as part of TNC’s orang-utan (Pongo pygmaeus) habitat conservation program. In 2002 an area of forest with high densities of orang-utans was defined as a result of field surveys (Marshall 2002). The villages closest to this area were identified as the target villages most likely to have an impact on the forest and orang-utan populations. Activities planned for these villages will be designed to reduce direct pressure on the orang-utan population, principally by reducing hunting, and to conserve the forest habitat by engaging all the relevant stakeholders. This includes not only the villagers, but also local government and industry, principally logging companies who hold concessions, Hak Pengusaan Hutan (HPH), in the area. At the time of writing the target villages are: Merapun Lesan Dayak Sido Bangen Long Gi / Long Beliu Long Duhung Long Boy Long Lamjan Long Sului Long Pelay These are all in Kecamatan Kelai, Kabupaten Berau, East Kalimantan province.
Figure 1 : Map of Kelai watershed showing villages and timber concessions 3

Edward H B Pollard Socio-economic monitoring protocol
4
Workplan Overall the implementation has 4 stages:
1. Collection of secondary data, training and testing techniques. 2. Visiting each village to introduce TNC, explain the work plan and collect structured baseline socio-
economic data. 3. More in depth surveys using PRA and PCP 4. Yearly monitoring trips to all villages
Preliminary tasks should involve collection of secondary sources of information including demographic data from the Kabupaten statistics department (BPS) and the village development agency (Pembinaan desa). These data tend to be very inaccurate however and can only be used as an approximate guide to the size and ethnic composition of the villages. Concurrent wit this the techniques need to be field tested. Field testing not only provides a chance to check the ability of the data collection team but it will identify any problems with the questionnaires. Changes can be made to the questionnaires prior to carrying out the complete exercise. The field test should include testing the general questionnaire with at least 5 families and the tokoh masyarakat questionnaire with the Kades. It should be made clear to the respondents that we are testing new tool and will return to interview more people at a later date. The baseline primary data should be collected in two phases in the second half of 2002. Hopefully this system will reduce ‘survey fatigue’ where villagers get bored and frustrated by continual surveys and impatient for some concrete action. Prior to implementation the data collection teams need to be trained and proficient in data collection techniques. The ideal team size is 3 people, including a representative from TNC’s main partner – local government, this way the workload can be split in each village. After testing and any corrections made the plan can be implemented in all 10 villages. Each village should be visited to explain TNC’s overall objectives and work plan in the area. This should include meeting with the head of the village (Kepala Desa, KaDes) and other important people in the village (tokoh masyarakat) such as the head of customary law (kepala adat), clergyman (pendeta) or head of any village co-operative. Here the workplan should be outlined in detail, explaining the purpose and the timescale of activities. It is vital at this stage not to raise expectations of the villagers, and to explain that it will be a long and participatory process. TNC is not going to give them the solutions to all their problems, TNC will work with them to find some solutions. Ideally a larger meeting with as many residents of the village as possible (both male and female) should also take place to explain the work and to answer questions. This first visit should also be used as an opportunity to collect quantifiable baseline socio-economic data using the protocol covered in more detail below. This is relatively rapid and will give key data that later monitoring data will be compared too. A minimum of 2 days will be needed in each village. The second stage of baseline data collection should only take place after all of the first stage data has been collected, entered into the database and analysed. Stage two is a much more in depth survey of each of the villages. This should use PRA tools in addition to the TNC tool Participatory Conservation Planning to develop a much deeper understanding of the conditions in each village, the hopes of the villagers and to help with the design of conservation and development strategies. The protocols used here

Edward H B Pollard Socio-economic monitoring protocol
5
are not within the scope of this report but are addressed in TNC - LLFO (2002) and Russell and Hasselberger (1998). The final stage in implementation are the monitoring visits. These should take place as close to one year after the baseline data were collected. Monitoring should be repeated at the same time every year for the whole of the lifetime of program activities.
Questionnaire design There are several basic rules that should always be adhered to when designing structured questionnaires. Put simply they are:
• Do not ask leading questions. Don’t say “logging companies are really bad aren’t they?”
• Try to avoid questions with yes/no answers. “when was the last time you went hunting?” rather than “are you a hunter?”
• In structured interviews avoid questions that have open ended answers. “has the logging company benefited the community or harmed it?” rather than “what do you think of the logging company?” (NB open ended questions are very useful in ‘semi-structured’ questionnaires, which are often used to collect baseline data. For the purpose of monitoring they are however of limited use)
• Make the questions relevant to the respondent’s knowledge. “How many karleng of rice did you plant last year?” not “how many Kg of rice did you plant last year?”
• Keep the interview short. Nobody likes to be answering the questions from a stranger for 3 hours. Try to keep to down to 30 to 40 minutes.
• Each interview must be given a unique code. The code should be clearly written on all interview forms and is an identifier for that respondent in that survey. The system should be clearly understood by all the team so that there is no confusion. (see appendix V for coding system used in this protocol)
For the purpose of this work 2 sets of data are collected in each village. A general structured questionnaire for a sample of all members of the community and an additional semi-structured questionnaire for the KaDes and tokoh masyarakat Baseline Data The baseline data questionnaires are shown in Appendices I and II and are supplied in the excel file formulir monitoring that accompanies this report. The general questionnaire (appendix I) is designed to gather information on a various aspect of village life, particularly in relation to farming, income sources and use of forest resources. It also uses several indicators to get calculate a ‘wealth score’ for each household. Wealth scores are used as an indicator because they are easily assessed and are quantifiable. An estimate of annual income can also be made but this is often less reliable than wealth score. This is due to several reasons. Firstly in many rural villages the actual cash income of households may be very low. Communities are subsistence farmers and forest resource gatherers who do not receive cash income. Wealth is not simply an indicator of cash income, wealth is an indicator general of well-being. Secondly people are often reluctant to talk about their income to a stranger. Thirdly people often misreport their cash income. It may be underestimated because they do not keep track of the exact amounts they receive, they only know that it’s not enough. Or it may be

Edward H B Pollard Socio-economic monitoring protocol
6
over-estimated, maybe because they are not taking into account any debts that they have. One cross check of this is to collect data on expenditure. People often have very clear understanding of how much they spend and most families, rich or poor, spend approximately the same on basic goods such as sugar, kerosene and soap. A family that spends more on ‘luxury’ items probably has a bigger income. The semi-structured questionnaire is designed to determine attitudinal information. Perceptions of the village leaders about the state of the village, any village institutions and the village’s relationship with other organisations. Monitoring Data The monitoring questionnaires differ slightly from the baseline data and allow relatively rapid and efficient collection of the relevant data. (appendices III and IV and in the excel file formulir monitoring that accompanies this report). For this reason the questionnaires look very similar. To help avoid confusion the word BASELINE or MONITORING has been added to the top of the forms, be sure to check that the correct form has been printed before departing for the field.
Sample size Baseline Data Due to lack of accurate information on the size and demography of the villages it is hard to give exact details on sample size or structure. To keep the data simple no stratifying will be used and 1/3, or a minimum of 20, households will need to be interviewed. During discussions with the Kades the numbers of households (Kepala keluarga – KK) needs to be determined. From this a random sample of families will be selected. To randomise this process the team together with the Kades should write the names of all the KK in the village on separate pieces of paper. The kades should be given the opportunity to draw out from a bag the required number of names of families that will make up the sample. Each family should then be visited and interviewed at their own home. The tokoh masyarakat information should be taken at least from the KaDes (or in his absence the SekDes), and if possible also from the Kepala adat, SekDes and anybody else considered knowledgeable and important. In order to save time no more than 4 of these interviews should be conducted per village. One member of the interview team should be responsible for conducting all of these discussions. These tokoh masyarakat respondents may also be interviewed for the general survey as well, but only if their name has been drawn. Monitoring Data The monitoring sample size should follow the same protocol as outlined about for the baseline.
Interview technique Several techniques will help the interviews run more smoothly and improve the quality of the data:
• Time the visits to be least disruptive to the respondents. eg in the evenings when people have returned from their fields, or on rest days.
• It is not essential that the male head of household is interviewed. If he is away and his wife is willing to talk then interview her. Clearly mark on the form that the respondent is a woman.
• Make the respondent feel comfortable. Before starting the interview engage in small talk about their families, the weather, whatever….
• Be clear with the respondent why you are asking them all these questions. Respondents should not be suspicious of your motives.

Edward H B Pollard Socio-economic monitoring protocol
7
• Try not to make it obvious that you are taking notes. Ideally if you have a good memory memorise all the questions and remember the answers. Fill in the form directly after the interview. If this is not possible try to be subtle when taking notes. (NB some people use tape recorders to record the interview. This can be very useful in semi-structured interviews. Some people do not like being recorded however and additional time is needed to listen to the tapes and transcribe the information).
• Do not rush the interview, respondent comfort is more important than completing many interviews in a day.
• At the end of the interview ask the respondent if they have any questions for you. You have been asking this person questions for the last 30 minutes, it is only polite to let them ask you some too.
One sheet should be used for one respondent, it is important that the responses are written clearly directly onto the form. It will therefore be necessary to take to the field at least 20 general and 4 tokoh masyarakat forms for every village. Field testing revealed that people were reluctant to give an income. This information is important and the interviewer should try to get a figure. People were most wary to give a figure for the previous month (especially if it came from gold), if this answer proves too hard to get from a particular respondent it is not entirely necessary. The monthly estimate of income and expenditures however are essential. It may be necessary to calculate a monthly average independently. For example a respondent may say that the family earns 2 million Rp every time they look for gold, but that they look for gold 6 times a year. The monthly average is therefore 1 million rupiah.
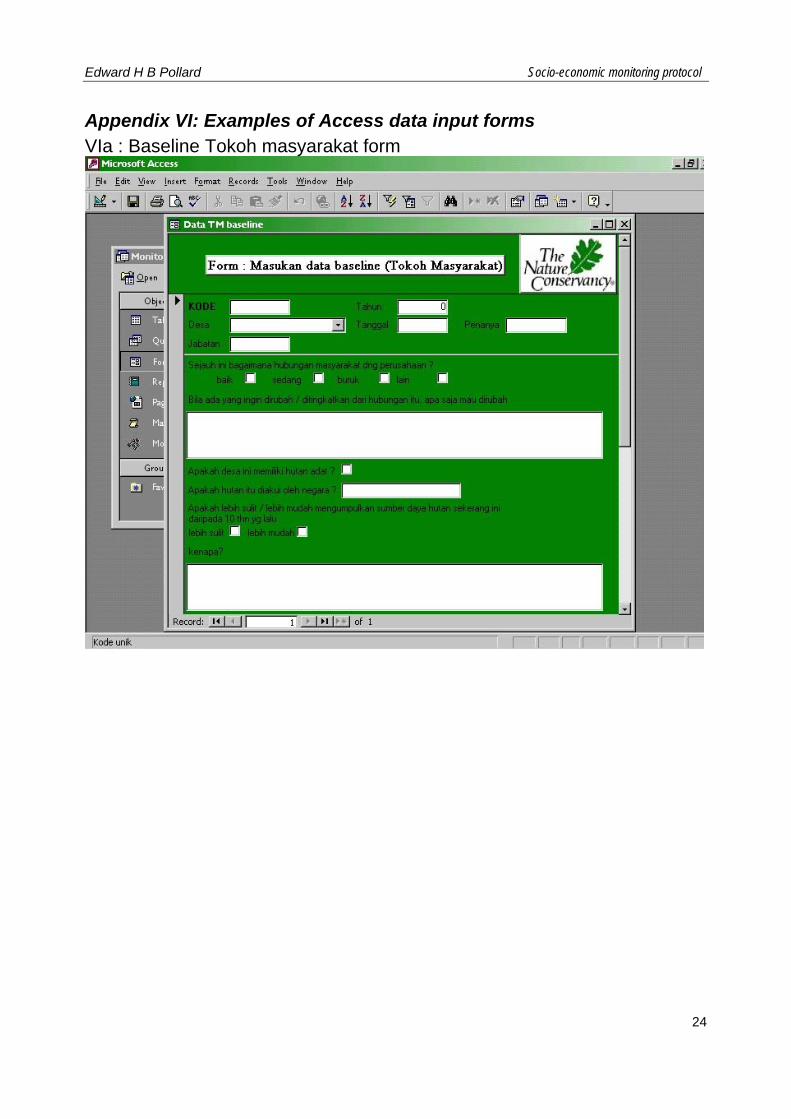
Data management Collecting the data is only half the story. All too often data are collected that are never analysed or used. If this happens then the whole monitoring program is a waste of time. If time is not set aside for data entry and analysis then why bother with the monitoring. The main reason for monitoring is to look at how successful program activities are. If the data are never analysed then you’ll never know how good you are. On returning from the village visits, either the baseline or the monitoring, all data sheets must be photocopied imediately. The originals should be stored in a safe place and the photocopies used from this point on. The originals should only be consulted if something is not clear on the photocopy. The most convenient store for data is a database. Databases are secure places to store and sort data and can easily be linked to Geographic information systems (GIS). Databases can not be used for complex analysis however. For this data needs to be exported from the database to another program such as Excel or JMP. A database called Monitoring sosec has been created for the entry and management of these data. It can also produce simple results and summaries from the data. Although databases can be quite complicated and confusing to those who are not accustomed to them, attempts have been made to simplify this database. Shortcuts have been created so that somebody who is not familiar with the workings of the database can, after a few minutes training, enter data and extract results. Appendix VI shows an example of the layout of the ‘forms’ that have been created for the data entry. These forms allow for the entry of the data in the style in which they were collected. The layout of the forms resembles that of the interview forms and no detailed knowledge of the database is needed to use them. The database has been created in Microsoft Access 2000 and is supplied on CD or floppy disk along with this report and the data collection forms. To open the data entry forms:
1. Open Access.

Edward H B Pollard Socio-economic monitoring protocol
2. Open the file Monitoring sosek 3. From the ‘switchboard’ click the button for data entry (fig 2). 4. In the sub-menu choose the entry form that you require. 5. enter the data in the form.
Figure 2 : Main database switchboard Wealth scores The total wealth score for a family is a sum of the luxury items, livestock and house information. As different items are more valuable each item has a different score. Before entering the data the wealth score for each respondent needs to be calculated and noted on the original datasheet. Livestock Score Luxury items Score House Score Chicken 1 TV 10 Big 10 Goat 8 Parabola 30 Medium 5 Pig 10 VCD 10 Small 1 Cow 50 Chainsaw 20 Wood windows 1 Ketinting 2 Glass windows 20 Motorbike 20 Tin roof 5 Car 100 Wood roof 8 Thatch 1 These scores do not represent exact wealth values, for example in financial terms selling a pig will earn a villager 10 times as much as selling a chicken but a cow is worth more than 150 times that of chicken. It was felt however that giving a cow a score of 150 would greatly distort the figure for any person who keeps cows. Scores are given on their frequency of occurrence as much as their actual value. It must be stressed that the scores given above are estimates at the time of writing. If at a later date these are considered to be inaccurate indicators of wealth or given inappropriate scores then they may be changed. It is important to remember however to change the scores from earlier years accordingly. If this is not done no comparison is possible.
8

Edward H B Pollard Socio-economic monitoring protocol
9
Data analysis and result reporting The database has been set up so that it will produce the basic outputs from the data. After all the data have been inputted the basic analysis is carried out using ‘queries’. These organise and summarise the data. The switchboard in the database has buttons that creates the outputs from the queries. To open the results tables:
1. Open Access. 2. Open the file Monitoring sosek 3. From the ‘switchboard’ click the button for either baseline or monitoring results. 4. In the sub-menu choose the result that you require.
Clicking the respective button will give the following outputs:
• Hasil… Kesejahteraan desa : a table showing the average income last month, usual monthly income, farming production and wealth score for each village, for each year.
• Hasil…pemanfaatan ikan / NTFP : a table showing the frequency of fishing, the average quantity caught in a month and the collection of NTFPs per village per year.
• Hasil… buruan : a table showing the frequency of hunting, the most commonly hunted species, the amount caught and whether the meat is for home use or sale, for each village, per year.
• Hasil…kesadaran : a table showing responses to questions about the interaction with logging firms, TNC and orang-utans, per village per year.
• Hasil …Tokoh Masyarakat : A verbatim report of the semi-structured interview results These tables are displayed in the ‘reports’ section of the Access database. They can be exported from here for inclusion in other programs.
1. from the File menu select export. 2. Choose the format you require. Rich text format for word, or Excel for excel 3. Choose where you wish to save it and click save. 4. Close Access and open the file in the new program.
When including reports in word it is better to insert the file directly through the insert file function rather than copy and paste. This way the formatting will be maintained. Further it may be necessary to review the inserted Tokoh masyarakat results as sometimes not all the information is exported. The data can be manipulated directly by accessing it directly through the database. Tables and query designs can be altered and new queries added, but I do not recommend this is done by people who do not have a good knowledge of Access. The analysis of the semi-structured data is harder. It is still essential that this is entered into the database in the exact same form as written on the interview sheets. Some of the data are directly comparable, most of the data however is in the form of open ended answers which are descriptive. This information can be used to help answer why the changes are occurring. These data should be reported in a qualitative manner giving a general picture of the attitudes and perceptions of the respondents. In later years direct comparisons of the answers should be made. These results should be compiled into a single report that has the standard structure of

Edward H B Pollard Socio-economic monitoring protocol
10
• Aim of the monitoring. • Methods used in field including any difficulties encountered. • Results – the summary for each village. And in later years a comparison with the previous data,
preferably a statistical analysis where applicable. • Conclusion / discussion of the results. If any change has been detected is this positive or negative
change. Ideas as to why the change may be occurring. NB beware of issues such as inflation that may be affecting changes in income and expenditure. Are the strategies working to achieve the goals? If not what could be done to improve them.
The conclusions are the key to adaptive management. With this information the program management should be able to assess the efficacy of the program and where necessary adapt it. It is very important therefore that the reports are written up in a timely fashion on return from the field. Integration with GIS As the data is in a database integration with the geographical information system (GIS) is relatively easy. The summary output of data for each village can be added to other information already contained in the GIS. A ‘make table query’ has been created in the Monitoring Sosek database. Once all the baseline data has been entered this query can be run from the standard database interface. To save confusion there is no button for this on the switchboard and this query should only be run by someone familiar with the database. When this query ‘buat tabel summary’ is run it will create a new table called ‘summary baseline’ in the database. This table can then be exported to the GIS.

Edward H B Pollard Socio-economic monitoring protocol
Field Test
Justification This protocol was field tested by Edward Pollard and Agus Heryanto in the Segah river watershed from 19th to 21st July 2002. The decision to field test here was based on several reasons. Firstly the original plan to test in Sido Bangun or Long Gi had to be scrapped because an appropriate time could not be found. Secondly the area was being visited as part of preliminary information gathering in the development of a possible new worksite for TNC, finally it provided the opportunity to collect more information in more villages than would have been possible if only tested in Sido Bangun. Further if TNC does decide to expand activities into this are the data will provide a basic introduction to the socio-economic situation here as well as allowing some comparison to the data that will be gathered in the Kelai watershed. The following villages were visited. Village Date Number of respondents Long Ayan 19 July 2002 4 Long Laai 19 July 2002 4 Long P’ai 20 July 2002 4 Long Oking 21 July 2002 5 All these villages are located within or bordering the PT Sumalindo Lestari Jaya unit 4 concession area, Kecamatan Segah, Kabupaten Berau, Kalimantan Timor.
Figure 3 : Map of Segah watershed showing villages and SLJ IV area.
11

Edward H B Pollard Socio-economic monitoring protocol
12
Results The survey proved to be fairly successful and the need for field test very clear. After the test several of the questions were modified. Each Tokoh masyarakat interview took approximately 20 minutes to complete and the general ones 30 minutes. Questions that proved most difficult were, not surprisingly, those concerning income. Respondents were very wary about revealing their income, especially if it came from gold. The interviewer should try several ways of asking the question as it is important information. There was particular difficulty in getting a value for the previous months income. Respondents on the other hand were very vocal when talking about hunting, fishing and the relationship with the HPH. Not as many interviews were conducted in the field test as was hoped. This was mainly a problem of time. Our time was limited in the field and most respondents were working in their fields. When implemented it is clear that the team needs to spend several days in each village. Another potential bias in the results from the Segah site are that the respondents were not randomly selected. They were selected from people who were present at a meeting on other issues. They therefore mainly represent the Tokoh masyarakat or important people from the village. These people tend also to be the more wealthy and older members of the community, and the results therefore may be skewed in this direction. The results do however show some comparative data between the 4 villages, and if are later compared with the Kelai data it must be in the knowledge that these data are not representative of the communities as a whole. Long Ayan (50N 0495459, UTM 0251201) A large village of mixed ethnicity. Approximately 80 families of which Dayak G’ai are the majority. This is clearly the most wealthy of the villages. The data are skewed by two especially wealthy respondents (one a gaharu collector and the other with 16 cows) but all this does is inflate what would always high wealth score. In general the village had many large houses, with glass windows and several people had their own satellite television parabolas. This was also the only village where people had cacao plantations, some of which were already producing crops that added greatly to the income of the respondents, none of the other villages had cacao and in only one (Long Laai) did respondents express any interest in it. All respondents said that they were happy with the local forestry operation, which in this case was an IPK (izin pengelolaan kayu – a small scale logging operation carried out by a contractor who pays a fee to the community per cubic meters extracted) on Long Ayan’s land. They all felt that they had been treated fairly by this operation and that they were not damaging the forest too much. This is in complete contrast to all the other villages who had recently only had experience with Pt Sumalindo Jaya IV (SLJ IV) and were not happy with them. Outside of the survey people expressed and interest in mapping of their resources and village area, probably because this would make negotiations for IPKs clearer. They also wanted more farming and particularly cacao extension work. Long Ayap. (50 N 0482320, UTM 0254615) Although this village was not surveyed formally a few observations were made. This is a small dyak Punan village (fewer than 30 families). Appearances indicate that like the other Punan villages it is relatively poor. Houses were small and all of standard translocation design, there appeared to be no electricity and no other facilities such as a school or church. Discussions with the Kapala Desa revealed that that are currently in disagreement with Long Ayan over the border between the villages. This dispute stems from an IPK that was supposed to be on Long Ayap land (within the SLJ IV area) but is actually in land claimed

Edward H B Pollard Socio-economic monitoring protocol
13
by Long Ayan. Additionally the Kades said that he was also not happy with the previous operations by SLJ. They had received no assistance (Bina desa) and a request for 10,000 ha of land to be recognised was not acknowledged. Long Laai. (50N 0473364, UTM 0246529) Another large primarily Dyak G’ai village (about 100 families). As indicated in the results (appendix VIIa) it is more wealthy than the other villages in the SLJ IV area. The village was large and neat, there were many large houses, domestic pigs and new ketintings. Respondents however stated that incomes had dropped since SLJ’s pull out. They no longer had a market for selling food, and had consequently stopped growing cash crops such as vegetables. They would like the concession to re-open but only if SLJ will follow the rules, give Bina desa and other assistance. Long P’ai (Punan Mahkam) (50N 0466593, UTM 0243278) A small dyak Punan village far up steam. As indicated in the wealth scores this is the poorest of the villages. They have had the least contact with the concessions companies and the least benefit. The village was small and run down. On the other hand incomes are relatively high (comparable with Long Laai), this maybe a function of the small sample size but is also related to the large amount of gold collection that is carried out. Respondents said that after the harvest in February most people will leave the village to travel at least one day upstream to look for gold for many months. Honey collection was also stated as being an important source of cash income. They were not pleased with the operations of SLJ, claimed that they had blocked streams and cut down fruit and honey trees. They would only welcome the return of SLJ if they followed the rules and gave a greater benefit to the village. Additionally they were suspicious of TNC’s role and wanted clarification as to what they were doing and why. Long Oking (Punan Segah). (50N 0465927, UTM 0254535) A small (about 20 families) all Punan village. As with the other punan villages this was poor. Since the departure of SLJ cash incomes have fallen. Previously they could sell produce to the nearby camp, now they have little access to outside markets. Saying this they were open and friendly and do not seem impoverished. The wealth score for this village is probably inflated by the community now being based in the abandoned SLJ IV camp. They have occupied the camp’s offices and housing and so have large, well built houses. They too would welcome the return of SLJ with certain rules and regulations. General Patterns. All the villages showed great dependency on the forest. Almost their entire source of protein comes from hunting pigs in the forest or from fishing in the rivers. They also collect timber, rattan, fruits and damar for home use and honey for home use and sale. There is at least one gold area that appears to be a communal resource and quite productive. All villages had hutan adat none of which was recognised legally or respected by SLJ. They all practiced shifting dry rice agriculture along the banks of the river. They cleared 1 – 2 ha of land family per year on a rotation of 5 or 6 years. There is an extensive barter and assistance system. If a person is particularly successful at hunting he will distribute excess meet amongst neighbours and family. The favour will be reciprocated. Products are often bartered in the village, people may exchange rice for chickens or meat for example. Cash appears only to be used for buying essentials such as petrol, kerosene, soap, salt and maybe cooking oil (cooking fat is also rendered from pigs). Little interest was expressed in the idea of community forestry, the few times it was mentioned it was within the form of IPK or HPH kecil, there was no expectation that a new system could be developed. All people

Edward H B Pollard Socio-economic monitoring protocol
14
knew was large scale concessions and this is all that they could conceive in the future. The only land recognition that they expected was for their hutan adat.

Edward H B Pollard Socio-economic monitoring protocol
15
Concluding remarks. In addition to socio-economic monitoring there clearly needs to be ecological monitoring to measure the success of program activities in the forest. This is mainly beyond the scope of this report but many of the general points mentioned above are relevant to ecological monitoring. Kremen et al (1994) identify two types of ecological monitoring; ‘biodiversity monitoring’ which monitors the overall changes in the biodiversity and ‘impact monitoring’ which is monitoring the human impact on target species. They recommend that both are used in the monitoring of ICDPs. One additional factor important in designing ecological monitoring protocols that is usually not relevant in socio-economic monitoring is that of scale. When monitoring forest ecosystems, for example, monitoring can be at a large scale, using remote sensing techniques to look at changes if the forest over a large area. They can be at a medium scale, for example monitoring the population of an indicator or key species (eg orang-utan) in a specific forest area. Finally they can be on the smallest scale, for example long term permanent sample plots. It is not always necessary to look at all scales. The decisions made as to which scales, and methods to use should be based on their appropriateness relative to the stated objectives as well as programmatic issues like human and financial resources. Sources for ecological monitoring methods are given in the reference list below, notably Kremen (1992), Kremen et al (1994 and 1998) and Webb and Yani (1999). Monitoring is a key but oft neglected component of any conservation / development program. To ensure successful monitoring the protocols need to be simple but robust, but there also needs to be a commitment from the implementing agency that they will be carried out in the long term. There is no point in carrying out monitoring unless it takes place through the life time of the program. Monitoring is not just something that is included to please donors, it is essential for the successful running of a conservation initiative. Inclusive of this is the analysis and distribution of the results. If the monitoring shows that a particular strategy did not work it is important to try and work out why, and then publicise the fact. Global resources for conservation are limited, money and time are wasted if conservation agencies keep repeating the mistakes made by others. Monitoring should show what works and what doesn’t work, this information can be used to make conservation more efficient and more successful.

Edward H B Pollard Socio-economic monitoring protocol
16
References and recommended reading Goldsmith F. B. (1991). Monitoring for conservation and ecology. Chapman and Hall. London Kremen C. (1992). Assessing the indicator properties of species assemblages for natural areas monitoring.
Ecological Applications 2 (2) pp 203 –217. Kremen, C., A. Merenlender and D. Murphy (1994). Ecological Monitoring : a vital need for integrated
conservation and development programs in the tropics. Conservation Biology 8, pp 388 – 397. Kremen, C. I. Raymond and K. Lance (1998). An interdisciplinary tool for Monitoring conservation impacts
in Madagascar. Conservation Biology. 12 pp 549 - 563 Margoluis, R and N. Salafsky (1998). Measures of Success: Designing, Managing and Monitoring
Conservation and Development Projects. Island Press Marshall, A. (2002). Orangutan population survey of Gunung Gajah in Berau district, East Kalimantan.
Report to TNC. Noss, R. F. (1999). Assessing and monitoring forest biodiversity : A suggested framework and indicators.
Forest Ecology and Management. 115 pp 135 – 146 Peters, C (1994). Sustainable Harvest of non-timber plant resources in tropical moist forest : an ecological
primer. Biodiversity Support Program. Washington DC. Rabinowitz, A. (1993). Wildlife Field Research and Conservation training manual. Wildlife Conservation
Society. New York. Redford, K. and A. Taber. (2000). Writing the Wrongs : Developing a Safe-fail culture in Conservation.
Conservation Biology. 14 pp 1567 – 1568. Russell, D. and C. Hasselberger (1998). Studying the social dimensions of Community-based conservation.
Unpublished report from the Biodiversity Conservation Network. Salafsky, N., R. Margoluis and K. Redford (2001). Adaptive Management : A tool for conservation
practitioners. Biodiversity Support Program. Washington DC Saterson, K., R. Margoluis and N. Salafsky (1999). Measuring conservation impact : An interdisciplinary
approach to project monitoring and evaluation. BSP, Washington DC. TNC - LLFO. (2002). Participatory Conservation Planning : A methodology for Community consultation.
The Nature Conservancy. Palu, Indonesia. Webb, C and M. Yani (1999). Methods for monitoring forest quality and floristics to be implemented by local
personnel at Lore Lindu National Park, Central Sulawesi, Indonesia. Report to TNC and Balai Taman Nasional Lore Lindu.
Edward H B Pollard Socio-economic monitoring protocol
17
Appendices
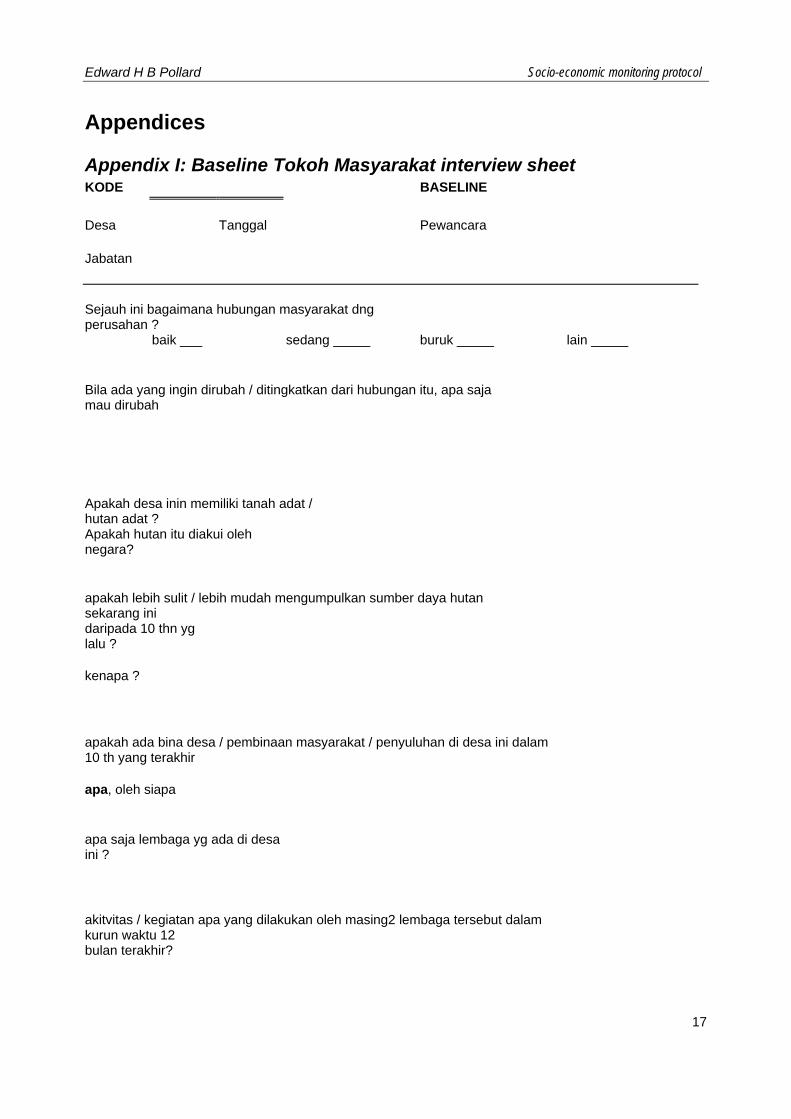
Appendix I: Baseline Tokoh Masyarakat interview sheet KODE BASELINE
Desa Tanggal Pewancara
Jabatan
Sejauh ini bagaimana hubungan masyarakat dng perusahan ?
baik ___ sedang _____ buruk _____ lain _____
Bila ada yang ingin dirubah / ditingkatkan dari hubungan itu, apa saja mau dirubah
Apakah desa inin memiliki tanah adat / hutan adat ?
Apakah hutan itu diakui oleh negara?
apakah lebih sulit / lebih mudah mengumpulkan sumber daya hutan sekarang ini
daripada 10 thn yg lalu ?
kenapa ?
apakah ada bina desa / pembinaan masyarakat / penyuluhan di desa ini dalam 10 th yang terakhir
apa, oleh siapa
apa saja lembaga yg ada di desa ini ?
akitvitas / kegiatan apa yang dilakukan oleh masing2 lembaga tersebut dalam kurun waktu 12
bulan terakhir?

Edward H B Pollard Socio-economic monitoring protocol
18
Appendix II: Baseline General interview sheet KODE BASELINE Desa Tanggal Pewancara Nomor Rumah Ekonomi Pekerjaan petani HPH/IPK Peg negri / desa _ (pilih saut) nelayan NTFP pemburuh Emas Lain sebutkan Pendapatan keluarga dalam bulan yang terakhir Rp apakah itu biasa ? pekiraan pendapatan bulanan rata-rata Rp Berapa Ha ladang yang dikerjajaan tahun ini ? Berapa karleng beras yg dihasilkan pada panen tahun lalu ? % beras dijual harga per Kg ada tanaman apa-saja di kebun
Berapa Ha kebun yg dimiliki berapa Rp / bulan yng didapatkan dari menjual hasil kebun ? berapa banyak Ayam Babi ternak Kambing lain apakah dimiliki TV Parabola VCD chainsaw ketinting motorbike mobil pengeluaran per bulan (rata-rata) Rp Catatan sendiri, tidak perlu ditanya (pilih satu) rumah besar sedang kecil jendela kaca kayu atap seng kayu daun

Edward H B Pollard Socio-economic monitoring protocol
19
KODE Buruan / perikanan Berapa kali per minggu mencari ikan ? dalam satu bulan, rata-rata berapa ekor Ikan % dimakan sendiri % dijual Berapa Rp / bulan yag didapatkan dari menjual ikan ? dalam satu bulan berapa kali berburu binatang paling sering yang diburu babi kijang Kincil payou monyet lain binatang yang berikutnya (pilih satu) babi kijang Kincil payou monyet lain berapa ekor tangkapan per bulan % dimakan sendiri % dijual Berapa Rp / bulan yag didapatkan dari menjual binatang buruan ? Berapa Kg rata-rata dikumpulkan dalam satu bulan ? Rotan (ikat) Madu (lt) lain subutkan Pernahkah anda mendapat / memburu orangutan ? Kapan ? Kesadaran Bagaimana taggapan anda ttg keberadaan perusahaan ? Baik Sedang jelek lain Bagaimana kegiatan perusahaan tahun ini dibandingkan tahun yg lalu ? (pilih satu) lebih baik kurang baik sama saja Apakah desa inin memiliki tanah adat / hutan adat ? Apakah hutan itu diakui oleh negara? Apakah anda tahu bahwa orang hutan dilindungi atau tidak ?

Edward H B Pollard Socio-economic monitoring protocol
20
Appendix III: Monitoring Interview sheet KODE MONITORING Desa Tanggal Pewancara Nomor Rumah Ekonomi Pekerjaan petani HPH/IPK Peg negri (pilih saut) nelayan NTFP pemburuh Emas Lain sebutkan Pendapatan keluarga dalam bulan yang terakhir Rp apakah itu biasa ? pekiraan pendapatan bulanan rata-rata Rp Berapa Ha ladang yang dikerjakan tahun ini ? Berapa karleng beras yg dihasilkan pada panen tahun lalu ? % beras dijual harga per Kg ada tanaman apa-saja di kebun
Berapa Ha kebun yg dimiliki berapa Rp / bulan yng didapatkan dari menjual hasil kebun ? berapa banyak Ayam Babi ternak Kambing lain apakah dimiliki TV Parabola VCD chainsaw ketinting motorbike car pengeluaran per bulan (rata-rata) Rp Catatan sendiri, tidak perlu ditanya (pilih satu) rumah besar sedang kecil jendela kaca kayu atap seng kayu daun

Edward H B Pollard Socio-economic monitoring protocol
21
KODE Buruan / perikanan Berapa kali per minggu mencari ikan ? dalam satu bulan, rata-rata berapa ekor Ikan % dimakan sendiri % dijual Berapa Rp / bulan yag didapatkan dari menjual ikan ? dalam satu bulan berapa kali berburu binatang paling sering yang diburu babi kijang Kincil payou monyet lain binatang yang berikutnya (pilih satu) babi kijang Kincil payou monyet lain berapa ekor tangkapan per bulan % dimakan sendiri % dijual Berapa Rp / bulan yag didapatkan dari menjual binatang buruan ? Berapa Kg rata-rata dikumpulkan dalam satu bulan ? Rotan Madu lain subutkan Pernahkah anda mendapat / memburu orangutan ? Kapan ? Kesadaran Bagaimana taggapan anda ttg keberadaan perusahaan ? Baik Sedang buruk lain Bagaimana kegiatan perusahaan tahun ini dibandingkan tahun yg lalu ? (pilih satu) lebih baik kurang baik sama saja Apakah desa inin memiliki tanah adat / hutan adat ? Apakah hutan itu diakui oleh negara, dan diatur dengen UU? Apakah anda tahu bahwa orang hutan dilindungi atau tidak ? Apakah anda sudah tahu lembaga TNC ? Bagaimana kegiatan TNC ? Baik buruk tidak tahu

Edward H B Pollard Socio-economic monitoring protocol
22
Appendix IV: Monitoring Tokoh Masyarakat interview sheet KODE MONITORING Desa Tanggal Pewancara Jabatan Sejauh ini bagaimana hubungan masyarakat dng perusahan ? baik ___ sedang _____ buruk _____ lain _____ Apakah hubungan Masy dengen Perusahaan perbaiki dalam 12 bulan yg terakhir? kenapa? Bila ada yang ingin dirubah / ditingkatkan dari hubungan itu, apa saja mau dirubah Apakah desa inin memiliki tanah adat / hutan adat ? Apakah hutan itu diakui oleh negara? Apakah ada berubaan status atas Hutan adat dalam 12 bulan yg terakhir? Apa ? apakah lebih sulit / lebih mudah mengumpulkan sumber daya hutan sekarang ini daripada 12 bulan yg lalu ? kenapa ? apakah ada bina desa / pembinaan masyarakat / penyuluhan di desa ini dalam 12 bulan yang terakhir apa, oleh siapa apa saja lembaga yg ada di desa ini ? akitvitas / kegiatan apa yang dilakukan oleh masing2 lembaga tersebut dalam kurun waktu 12 bulan terakhir?

Edward H B Pollard Socio-economic monitoring protocol
Appendix V: Coding Every data sheet must have a unique code for that respondent. This means that names need not be used and if data sheets get mixed up they can always be resorted. It also helps in the organisation of the database. The code identifies the village, the year and the type of questionnaire and a number suffix for each interview. Village Code prefix Merapun MEP Lesan Dayak LED Sido Bangen SIB Long Gi / Long Beliu LGI Long Duhung LDH Long Boy LBY Long Lamjan LLM Long Lamcin LLA Long Sului LSL Type of questionnaire Code To tokoh Masysarakat tm General um Each respondent is given a number and finally the code ends with the year.
SIB 02 tm 02 Desa year interview type respondent number Therefore some examples would be SIB01tm02 This is the first interview with a tokoh masyarakat in Sido Bangen in 2002. LLM04um06 Long Lamjan, in 2004. the 6th general interview in that village that year. LLM04um07 Long Lamjan, in 2004. the 7th general interview in that village that year.
23
Edward H B Pollard Socio-economic monitoring protocol
Appendix VI: Examples of Access data input forms VIa : Baseline Tokoh masyarakat form
24

Edward H B Pollard Socio-economic monitoring protocol
VIb : Baseline general form
25

Edward H B Pollard Socio-economic monitoring protocol
Appendix VII: Results from field test in Segah Watershed VIIa : General socio-economic information.
BASELINE Kesejahteraan desa Desa Tahun Mean SD Mean SD Mean Mean SD mean of mean mean Mean SD mean SD Pendapatan pendapatan ha karleng beras ha hasil pengeluaran Wealth bln terakhir rata-rata ladang panen dijual (%) kebun kebun (Rp) score (Rp) dijual (Rp) Long Ayan 2002 2,325,000 2,102,974 2,075,000 1,699,755 0.63 38.75 46.6 2.50 350,000 600,000 616,441 325.0 489 Long Laai 2002 437,500 314,576 437,500 242,813 1.38 120.00 90.9 0.50 200,000 437,500 125,000 56.0 56 Long Oking 2002 150,000 132,288 470,000 334,664 1.20 94.00 66.6 0.65 410,000 174,642 37.6 24 Long P'ay 2002 300,000 355,903 325,000 330,404 1.75 175.00 17.3 1.13 112,500 25,000 27.8 11
BASELINE Buruan Desa Tahun n Mean Paling Sering Yang berikut Mean Mean kali ekor per binatang berburu Babi Kijang kincil payou monyet lain babi Kijang kincil payou monyet dimakan dijual (Rp) (%)
Long Ayan 2002 2 5.5 -1 0 -1 0 0 0 -1 0 0 -1 0 0 6 100 Long Laai 2002 3 20.66 -3 0 0 0 0 0 0 0 0 -3 0 0 7.6666 100 Long Oking 2002 3 3 -3 0 0 0 0 0 0 0 0 -1 0 0 4.3333 100 Long P'ay 2002 4 7.75 -4 0 0 0 0 0 0 0 0 0 -1 0 6 100
26

Edward H B Pollard Socio-economic monitoring protocol
BASELINE Pemanfaatan Ikan / NTFP Desa Tahun n. Mean kali Mean Mean ikan Mean ikan mean dari Mean Rotan n. Mean madu per mencari ikan per ekor ikan dimakan (%) dijual (%) jual ikan (Rp) per thn pengumpul thn (Lt) ikan minggu / bulan (ikat) madu
Long Ayan 2002 3 2.0 21.3 100 0 Long Laai 2002 4 5.8 50.0 100 0 Long Oking 2002 5 4.0 102.0 100 3 0 Long P'ay 2002 4 3.5 97.3 100 3 370
BASELINE kesadaran Desa Tahun Taggapan ttg perusahaan Perusahaan dibandingkan thn yg lalu Desa Hutan OH memiliki adat dilundungi baik sedang jelek lain lebih baik kurang baik sama saja Hutan adat diakui Long Ayan 2002 -3 -1 0 0 -1 0 -3 -4 0 0 Long Laai 2002 0 0 -4 0 0 0 0 -3 -1 0 Long Oking 2002 0 0 -5 0 0 0 0 -5 0 0 Long P'ay 2002 0 0 -4 0 0 0 -1 -4 -1 0
27

Edward H B Pollard Socio-economic monitoring protocol
28
VIIb : Tokoh Masyarakat responses.
Data Tokoh Masyarakat baseline Desa Long Oking Tahun 2002 Jabatan Kades Sejauh ini bagaimana hubungan masyarakat dng perusahan baik sedang beruk X lain apa saja mau diruba Ikut peraturan, kasih fee dan perkerjaan kepada orang Masy Long oking.
Desi ini memiliki tanah adat X Hutan itu diakui oleh pemerintah Belum Mungumpulkan SD hutan sekarang ini daripada 10 thn yg lalu lebih sulit X lebih mudah kenapa Gaharu hampir tidak ada kerena orang dari luar. Rotan dan madu, masih cekup
apakah ada bina desa/pembinaan masy/penyuluhab di des ini dalam 10thn yang terakhir X apa, oleh siapa Bantuan desa dari Pemerintah; sekola, kinerji matahari
apa saja lembaga yag ada di Lembaga adat desa ini
akitvitas apa yang dilakukan oleh masing2 lembaga terseut dalam kurun 12 bulan terakhir
Wednesday, July 24, 2002 Page 1 of 4

Edward H B Pollard Socio-economic monitoring protocol
29
Desa Long Ayan Tahun 2002 Jabatan Kades Sejauh ini bagaimana hubungan masyarakat dng perusahan baik sedang X beruk lain apa saja mau diruba Pembinaan, pembangunan dari Perusahaan
Desi ini memiliki tanah adat X Hutan itu diakui oleh pemerintah Belum Mungumpulkan SD hutan sekarang ini daripada 10 thn yg lalu lebih sulit X lebih mudah kenapa orang dari luar amil gaharu
apakah ada bina desa/pembinaan masy/penyuluhab di des ini dalam 10thn yang terakhir X apa, oleh siapa dari Pemda….
apa saja lembaga yag ada di Lembaga adat, LPM, BPK, desa ini
akitvitas apa yang gotong royong, pembantuan sawah dilakukan oleh masing2 lembaga terseut dalam kurun 12 bulan terakhir
Wednesday, July 24, 2002 Page 2 of 4

Edward H B Pollard Socio-economic monitoring protocol
30
Desa Long P'ay Tahun 2002 Jabatan Kades Sejauh ini bagaimana hubungan masyarakat dng perusahan baik sedang beruk X lain apa saja mau diruba Kasih perkerjaan dan fee. Ikut peraturan
Desi ini memiliki tanah adat X Hutan itu diakui oleh pemerintah Belum Mungumpulkan SD hutan sekarang ini daripada 10 thn yg lalu lebih sulit X lebih mudah kenapa orang luar, digangu oleh HPH
apakah ada bina desa/pembinaan masy/penyuluhab di des ini dalam 10thn yang terakhir apa, oleh siapa
apa saja lembaga yag ada di Lembaga adat desa ini BPK
akitvitas apa yang penetapan hukum adat dilakukan oleh sungai adat. masing2 lembaga terseut dalam kurun 12 bulan terakhir
Wednesday, July 24, 2002 Page 3 of 4

Edward H B Pollard Socio-economic monitoring protocol
31
Desa Long Laai Tahun 2002 Jabatan Kapala adat Sejauh ini bagaimana hubungan masyarakat dng perusahan baik sedang X beruk lain apa saja mau diruba lebih dekat dengen masyarakat
Desi ini memiliki tanah adat X Hutan itu diakui oleh pemerintah belum Mungumpulkan SD hutan sekarang ini daripada 10 thn yg lalu lebih sulit X lebih mudah kenapa Kurang geharu kerena pedatang
apakah ada bina desa/pembinaan masy/penyuluhab di des ini dalam 10thn yang terakhir X apa, oleh siapa pemerintahan. Jalan semen, kinerji solar.
apa saja lembaga yag ada di Koperasi, lembaga adat, BPK desa ini
akitvitas apa yang dilakukan oleh masing2 lembaga terseut dalam kurun 12 bulan terakhir
Wednesday, July 24, 2002 Page 4 of 4