Embed Size (px)
Citation preview
1
Title: Socio-economic impacts of Bt cotton Stephen Morse Reader in Development Studies Department of Geography, University of Reading, Reading RG6 6AB United Kingdom Tel. +44 (0)118 9318736 Fax +44 (0)118 9755865 Email: [email protected] Abstract This paper explores the impact which Bt cotton can make to the livelihoods of small-scale farmers. It draws upon fieldwork over a period of nearly 6 years (November 2000 to January 2006) undertaken by the author and others in the Makhathini Flats, South Africa. South Africa has seen the first commercial release of Bt cotton on the African continent and thus provides an illuminating case study of the impacts which the technology can have on small-scale farmers. Evidence collected over this period, via a number of approaches (questionnaire based survey and analysis of electronic data), suggests that the farmers benefited from Bt cotton through increased yield, revenue and gross margin. While the farmers made savings on insecticide costs they had to spend more on seed and harvesting. Farming households used the additional income mostly for investment in people (education) and physical resources (cotton and other crop production). Threats to the potential sustainability of Bt cotton in Makhathini are discussed, and the technology is placed within the context of the wider issues of under-development in the area. Thus while it can make a positive contribution it should not be seen as a magic bullet to address all of these issues at a stroke. Keywords: Genetic modification (GM), Bt cotton, sustainable livelihoods, South Africa
2
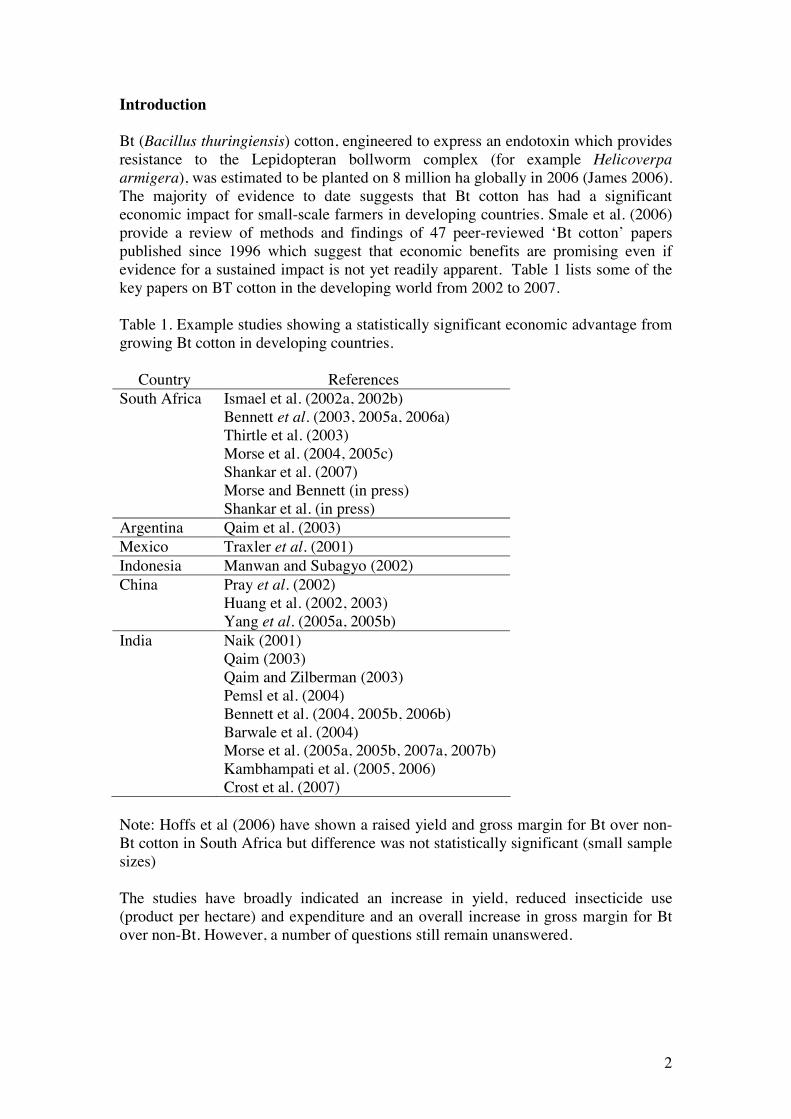
Introduction Bt (Bacillus thuringiensis) cotton, engineered to express an endotoxin which provides resistance to the Lepidopteran bollworm complex (for example Helicoverpa armigera), was estimated to be planted on 8 million ha globally in 2006 (James 2006). The majority of evidence to date suggests that Bt cotton has had a significant economic impact for small-scale farmers in developing countries. Smale et al. (2006) provide a review of methods and findings of 47 peer-reviewed ‘Bt cotton’ papers published since 1996 which suggest that economic benefits are promising even if evidence for a sustained impact is not yet readily apparent. Table 1 lists some of the key papers on BT cotton in the developing world from 2002 to 2007. Table 1. Example studies showing a statistically significant economic advantage from growing Bt cotton in developing countries.
Country References South Africa Ismael et al. (2002a, 2002b)
Bennett et al. (2003, 2005a, 2006a) Thirtle et al. (2003) Morse et al. (2004, 2005c) Shankar et al. (2007) Morse and Bennett (in press) Shankar et al. (in press)
Argentina Qaim et al. (2003) Mexico Traxler et al. (2001) Indonesia Manwan and Subagyo (2002) China Pray et al. (2002)
Huang et al. (2002, 2003) Yang et al. (2005a, 2005b)
India Naik (2001) Qaim (2003) Qaim and Zilberman (2003) Pemsl et al. (2004) Bennett et al. (2004, 2005b, 2006b) Barwale et al. (2004) Morse et al. (2005a, 2005b, 2007a, 2007b) Kambhampati et al. (2005, 2006) Crost et al. (2007)
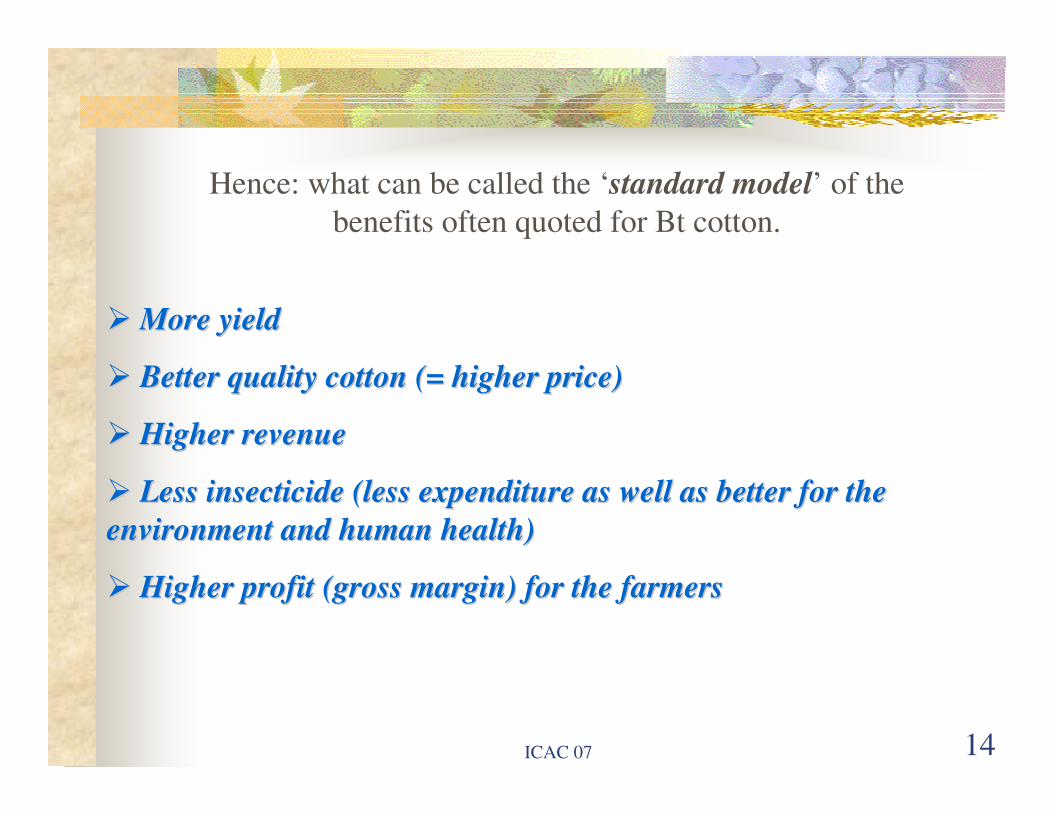
Note: Hoffs et al (2006) have shown a raised yield and gross margin for Bt over non-Bt cotton in South Africa but difference was not statistically significant (small sample sizes) The studies have broadly indicated an increase in yield, reduced insecticide use (product per hectare) and expenditure and an overall increase in gross margin for Bt over non-Bt. However, a number of questions still remain unanswered.
3
1. How has the extra income impacted upon farmers? What have they done with the additional resource? This is not simply a matter of what the extra income has been used for but also the use put to saved labour as Bt cotton requires less spraying.
2. How sustainable is this increase? Its all very well showing a positive impact of
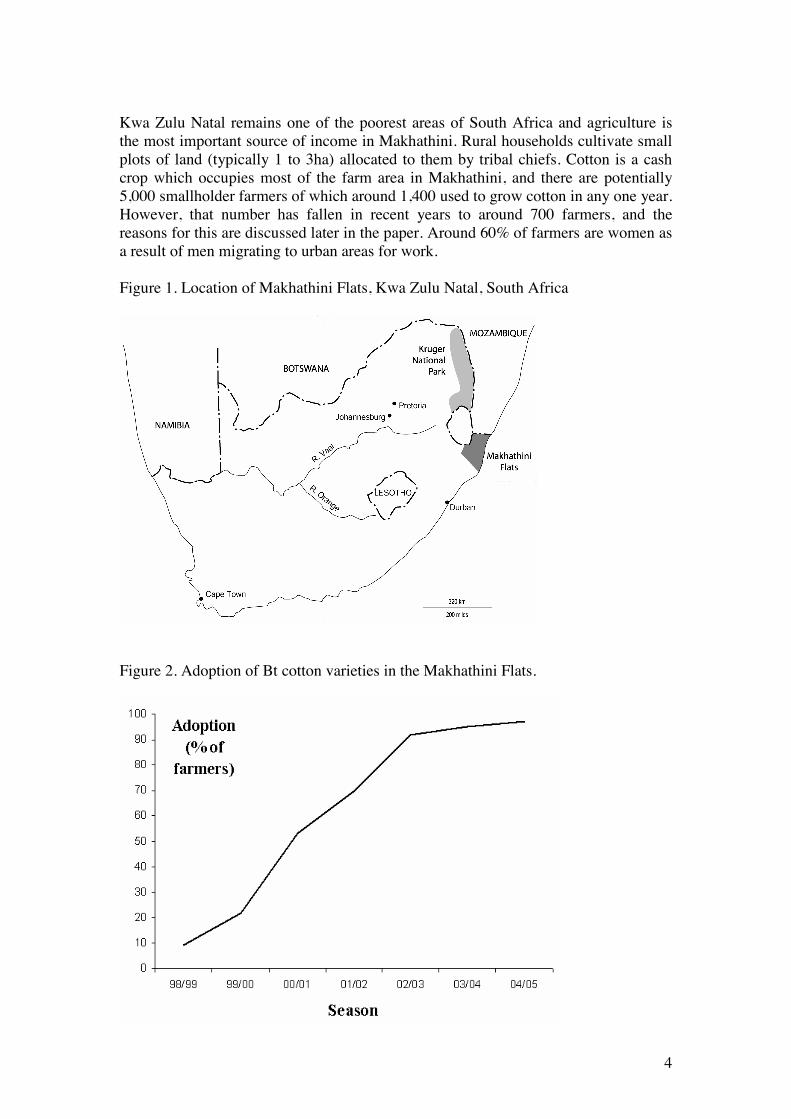
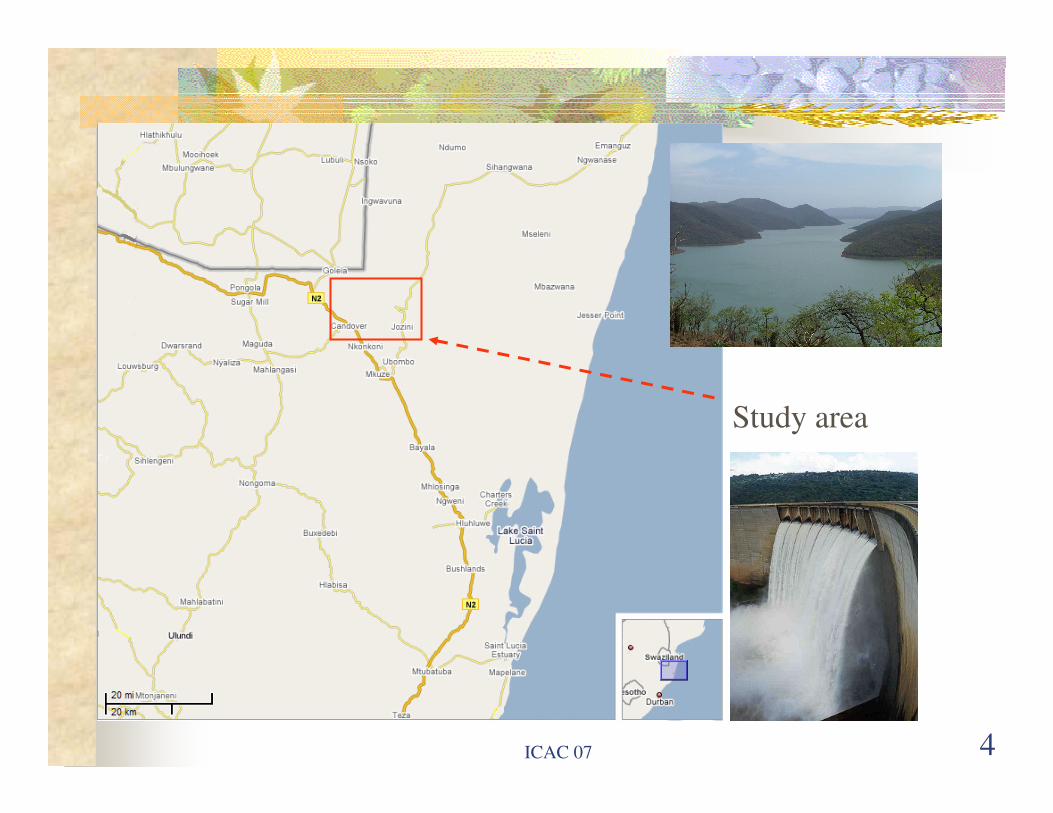
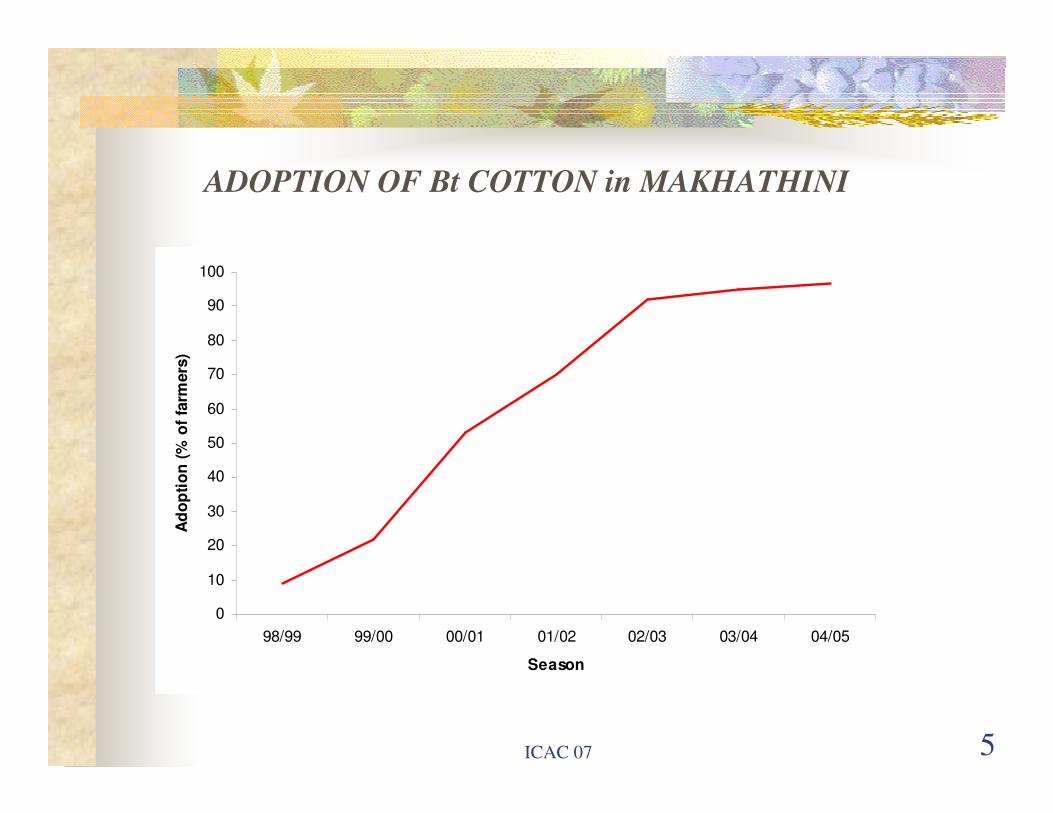
Bt cotton over a few years but is this likely to continue and if not then why? These two points can be combined into a consideration of sustainable livelihood, defined as: “A livelihood comprises the capabilities, assets and activities required for a means of living. A livelihood is sustainable when it can cope with and recover from stresses and shocks and maintain or enhance its capabilities and assets both now and in the future, while not undermining the natural resource base.” Carney (1998) While this definition has just two sentences it hides much complexity. ‘Shocks’ and ‘stresses’ can be very diverse, extending beyond bio-physical features such as pest attack and drought, to market fluctuations (Carney, 1998, 2002). In order to minimise these development workers have sought to encourage a diversification of livelihood options (Castro, 2002). The Bt cotton story provides an interesting set of dimensions to sustainable livelihood analysis (SLA). Of central, importance, of course, is the durability of the recorded economic and other benefits to date. Will they stand the test of time without damaging the environment? This paper will seek to explore some of these issues with relation to research undertaken in the Makhathihi Flats, Kwa-Zulu Natal, South Africa. It will begin by briefly reviewing some of the findings with regard to economic impacts of Bt, and will progress to a discussion of results obtained from an SLA pilot study in the area. The paper will end by discussing these socio-economic impacts and what lessons may be gleaned with regard to the sustainability of household livelihoods in Makhathihi. Methodology (a) Research area The research reported here took place in the Makhathini Flats, KwaZulu Natal (Figure 1) over a period from 1999 to 2005. South Africa remains the only African country to grow GM crops commercially, with Bt cotton first planted in 1997 (Wilkins et al., 2000). Large commercial farmers began adopting Bt cotton in the 1997/1998 season followed by resource poor farmers in 1998/1999 in Makhathini Flats. The Bt cotton variety in Makhathini is NuCOTN 37-B with BollgardTM developed by Delta Pineland. Farmers in Makhathini first grew Bt cotton in the 1998/1999 cotton season and adoption of Bt cotton in the region has been rapid. By 2002, an estimated 92% of the smallholder cotton growers in Makhathini had adopted the Bt variety and this had increased to nearly 100% by 2004/05 (Figure 2).
4
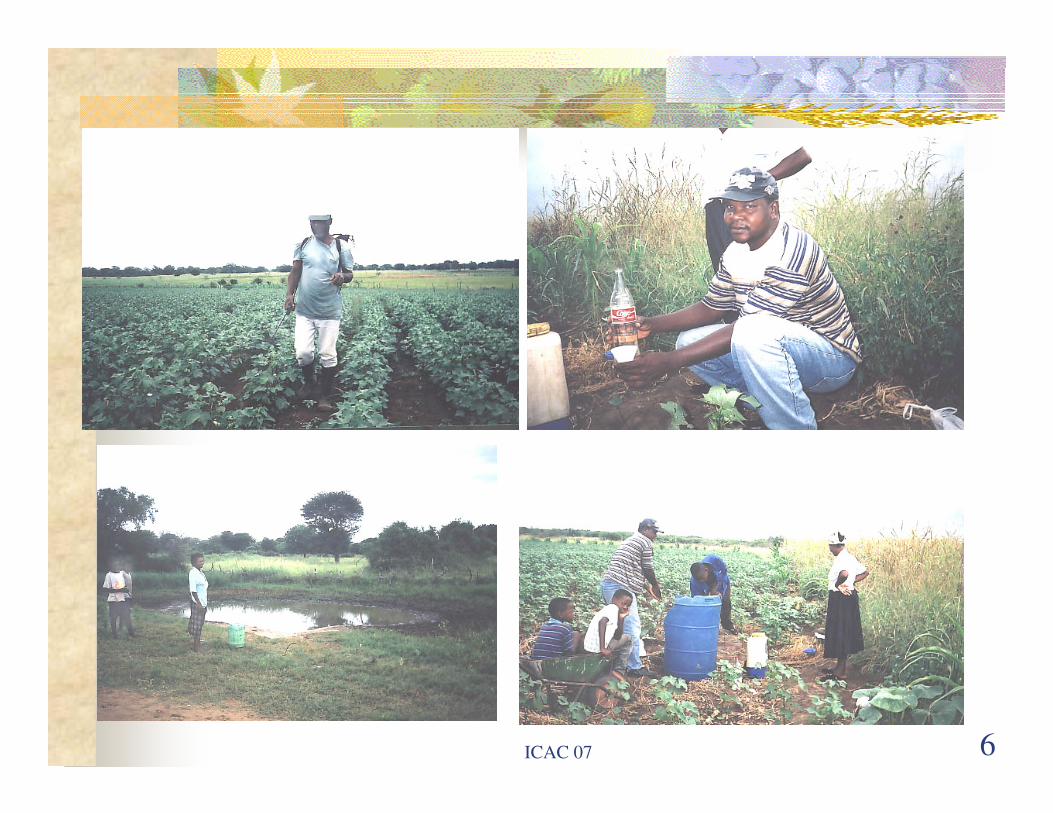
Kwa Zulu Natal remains one of the poorest areas of South Africa and agriculture is the most important source of income in Makhathini. Rural households cultivate small plots of land (typically 1 to 3ha) allocated to them by tribal chiefs. Cotton is a cash crop which occupies most of the farm area in Makhathini, and there are potentially 5,000 smallholder farmers of which around 1,400 used to grow cotton in any one year. However, that number has fallen in recent years to around 700 farmers, and the reasons for this are discussed later in the paper. Around 60% of farmers are women as a result of men migrating to urban areas for work. Figure 1. Location of Makhathini Flats, Kwa Zulu Natal, South Africa
Figure 2. Adoption of Bt cotton varieties in the Makhathini Flats.
5
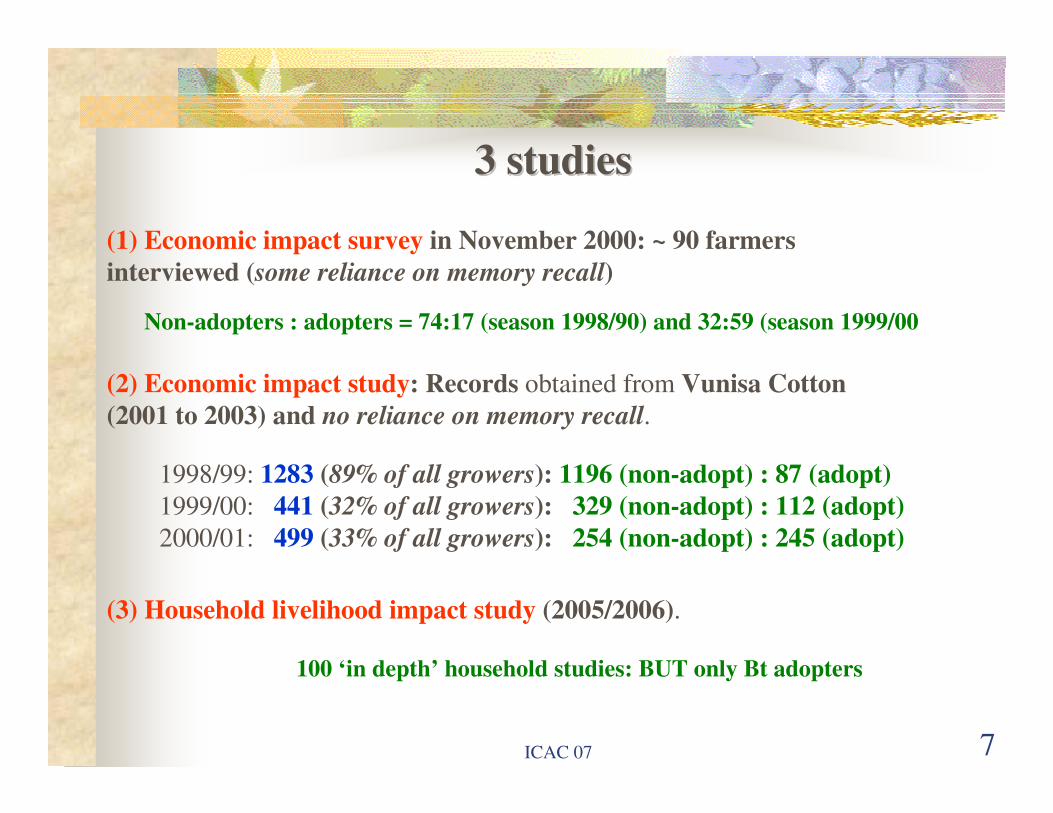
One important facet of the cotton production system in Makhathini is the limited diversity of options available to farmers in terms of input supply and marketing. Up to 2002 all cotton producers in Makhathini had no choice but to use Vunisa Cotton (a private, commercial company) for purchasing inputs such as seed and pesticides and also for credit (from Land Bank; www.landbank.co.za/) to pay for these inputs. Vunisa also purchased the cotton from producers, deducting the credit owed before paying farmers. There were no other cotton supply or cotton marketing companies in the area up to 2002. The arrival of a new cotton ginnery, NSK (Noordelike Sentrale Katoen), with a capacity of ginning 10 times more cotton than what is actually produced by farmers, in the area in 2002 forced Vunisa out of the region. There was simply not enough production to sustain the two companies, but unlike Vunisa, NSK does not provide credit and thus only the wealthier and more efficient farmers could continue to grow cotton. The shortage of credit is the main reason for the decline in the number of cotton growers in Makhathini and would have occurred irrespective of the widespread adoption of Bt cotton. However, it should be acknowledged here that Bt cotton seed is more expensive than non-Bt seed. The price of Bt cotton seed stood at SAR 1,300 per 25 kg bag in 2005 as opposed to SAR 464 per 25 kg in 2002. Cotton cultivation in Makhathihi is marked by relatively low yields of 600 kg/ha or less prior to the introduction of Bt varieties. The lack of irrigation is a major constraining factor especially as the area is vulnerable to drought. Pest attack is also a problem, and includes bollworm, leaf eating insects such as grasshoppers, aphids and jassids. Farmers address pest attack by the use of insecticide, usually applied with a knapsack sprayer, but this is both costly and arduous. As well as the actual task of spraying, the necessary water often has to be transported from a distance of up to 10 kilometres (Ismael, et. al., 2002b). (b) Impact on gross margin The results in this paper are based on 3 separate, but related, studies of cotton production in Makhathini which took place between November 2000 and January 2006. The first of these was conducted in November 2000, and was based on a questionnaire survey of 100 smallholder farmers (Ismael et al., 2002a; Thirtle et al., 2003). The questionnaire was completed during face-to-face interviews in the field and at Vunisa Cotton premises, and while limited in scope did obtain data on the yield, revenue, seed and insecticide costs of Bt and non-Bt plots. The survey covered two growing seasons: 1998/1999 (first year) and 1999/2000 (second year), and thus did rely on memory recall for 1998/99. The second study was designed to compliment the first by addressing a number of important limitations (Bennett et al., 2003, 2006a; Morse et al., 2004, 2005c; Shankar et al., 2007, in press). In this case computerised records were obtained from Vunisa which detail the area of cotton sown, the variety, inputs purchased and yield for every individual farmer growing cotton in Makhathini over the three seasons, 1998/99 (first release of Bt cotton), 1999/00 and 2000/2001. However, the number of records available did vary between seasons. Thus while some 1283 clean records representing 89% all cotton growers in the Makhathini area were obtained for the 1998/99 season only 441 (32% of all growers) were available for the 1999/2000 season and 499 (33% of all growers) for the 2000/2001 season. Therefore, the term ‘sample’ in this context
6
refers to the number of records that were included in the analysis once the Vunisa data had been checked and verified. The second study had a number of advantages over the first:
• sample sizes were much larger, thereby negating the obvious criticism that the first study was only based on a relatively small number of farmers
• memory recall was not required and god quality data were available for 3 seasons
• some limited data on labour costs were available, although it has to be admitted that the Vunisa records would only relate labour costs which had been paid for from credit. Family labour, or help from friends, for example would not be included
The third study took place as part of the ‘impact on livelihoods’ research project described below (Morse and Bennett, in press). It was similar to the first in being based upon a relatively small sample (100 farmers) and an element of memory recall, but did take into account the full labour inputs (hired, family, friends etc.) required for production. The difficulty with the third study was the lack of a comparative element as by the time of the research almost all cotton growers were planting Bt varieties. Therefore, it should be noted that gross margin in each of these three studies is not strictly comparable. Study 1: gross margin = revenue – (seed cost + insecticide cost) Study 2: gross margin = revenue – (seed cost + insecticide cost + limited labour costs) Study 3: gross margin = revenue – (seed cost + insecticide cost + all labour costs) In study 1 the gross margin did not take into account any labour costs, while in study 2 only the labour costs recorded by Vunisa were included (i.e. the labour for which farmers had taken out credit). The third study provides the more complete picture as all labour (family, help or otherwise) was costed at the equivalent daily rate for that task. (c) Impact on livelihoods The survey was carried out from October 2005 to January 2006 and a total of 100 farmers were interviewed in their household compounds (Morse and Bennett, in press). Selection was structured on the basis of ensuring a representative sample of male and female household heads, and random within those categories. The process was based upon the list of members supplied by the Hlokoloko Chairman, and farmers were interviewed using semi-structured questionnaires. The essence of the questionnaire was to gain an understanding of what had changed in the region since the introduction of Bt cotton, farmer’s perceptions (positive and negative) of Bt cotton, how any income or time benefits were used and other economic data to quantify costs and benefits of Bt adoption. The questionnaire focused on two cotton seasons, 2003/2004 and 2004/2005, and thus did rely to some extent on memory plus the analysis of any records the farmers may have had. The Hlokoloko Chairman does encourage the keeping of records and indeed that was one of the main reasons for selecting this association. However, by the time of the research almost all of the
7
farmers had adopted Bt cotton and thus it was not possible to include a comparative element by interviewing non-Bt growers.
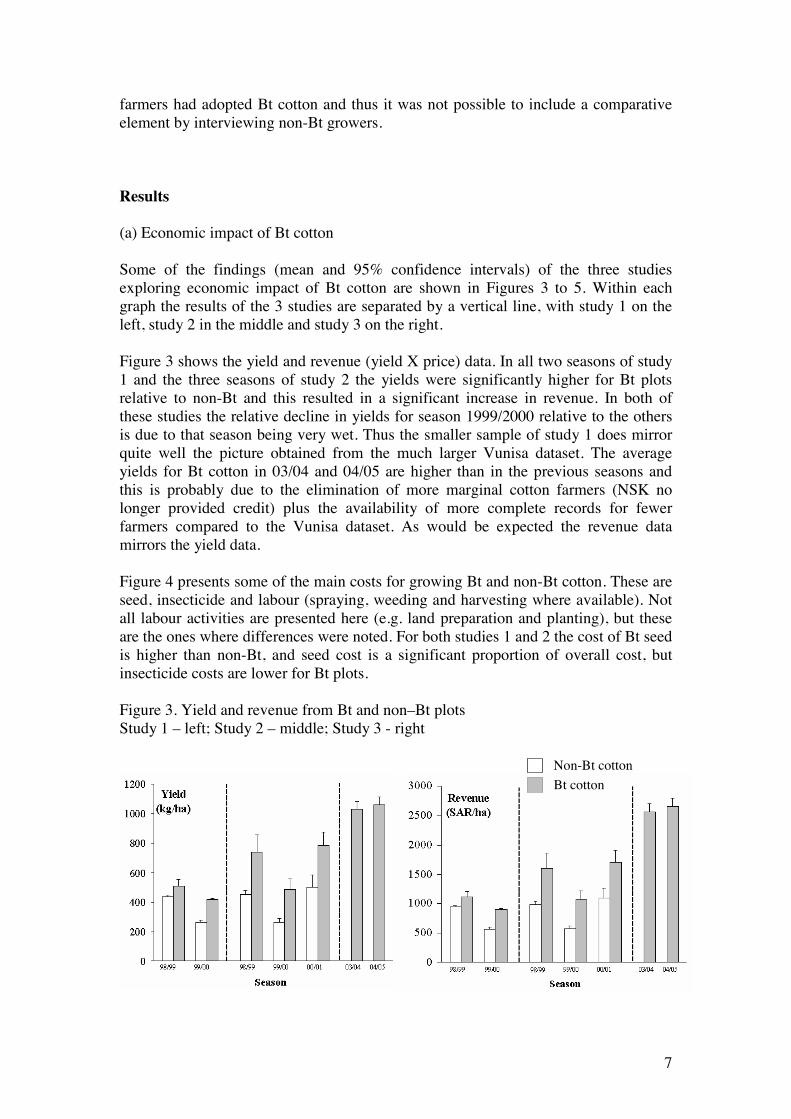
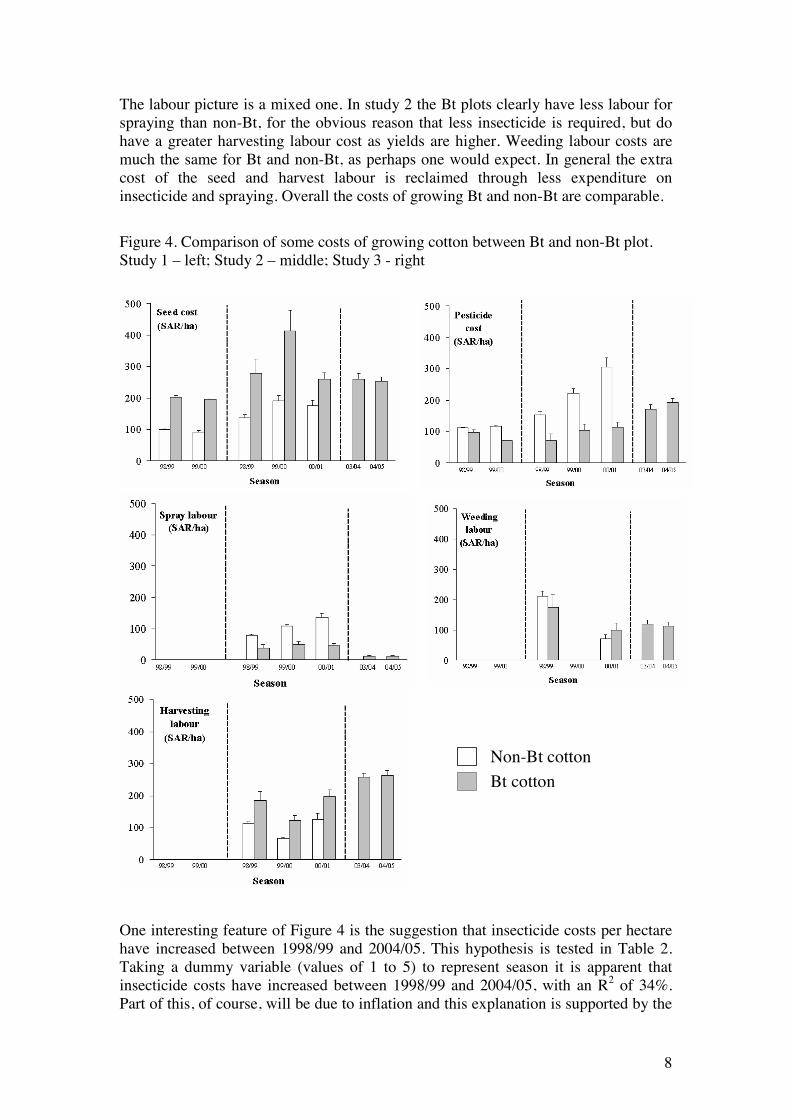
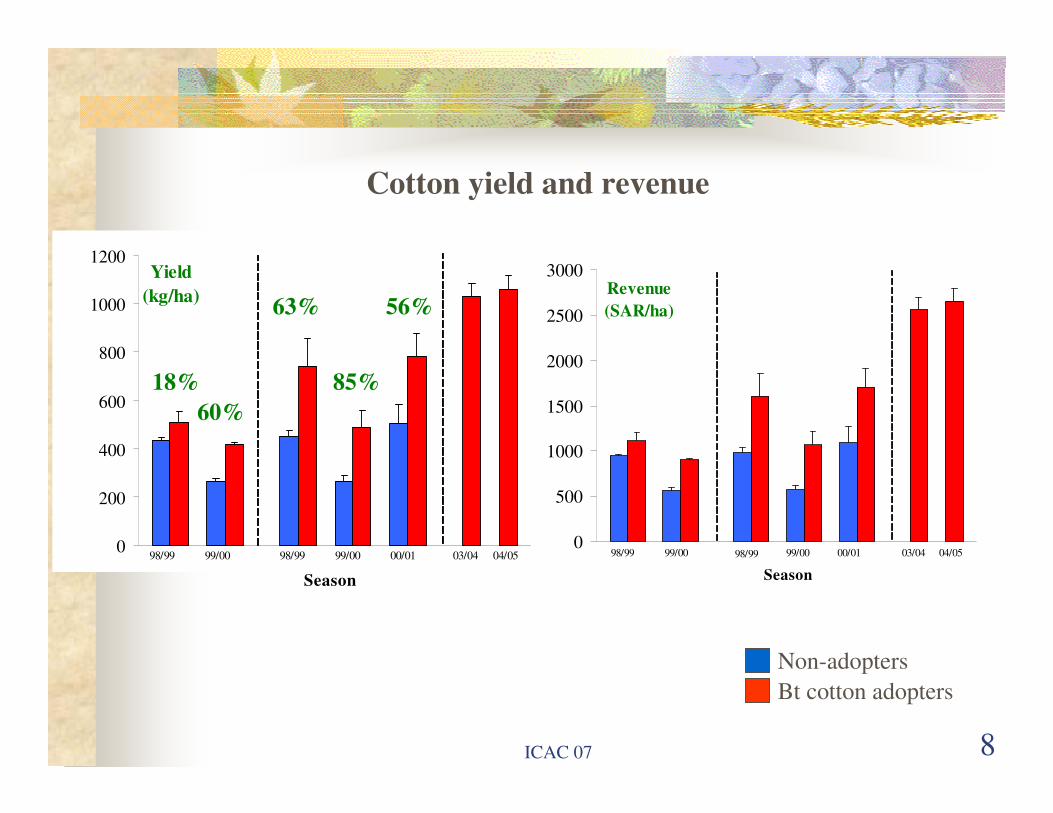
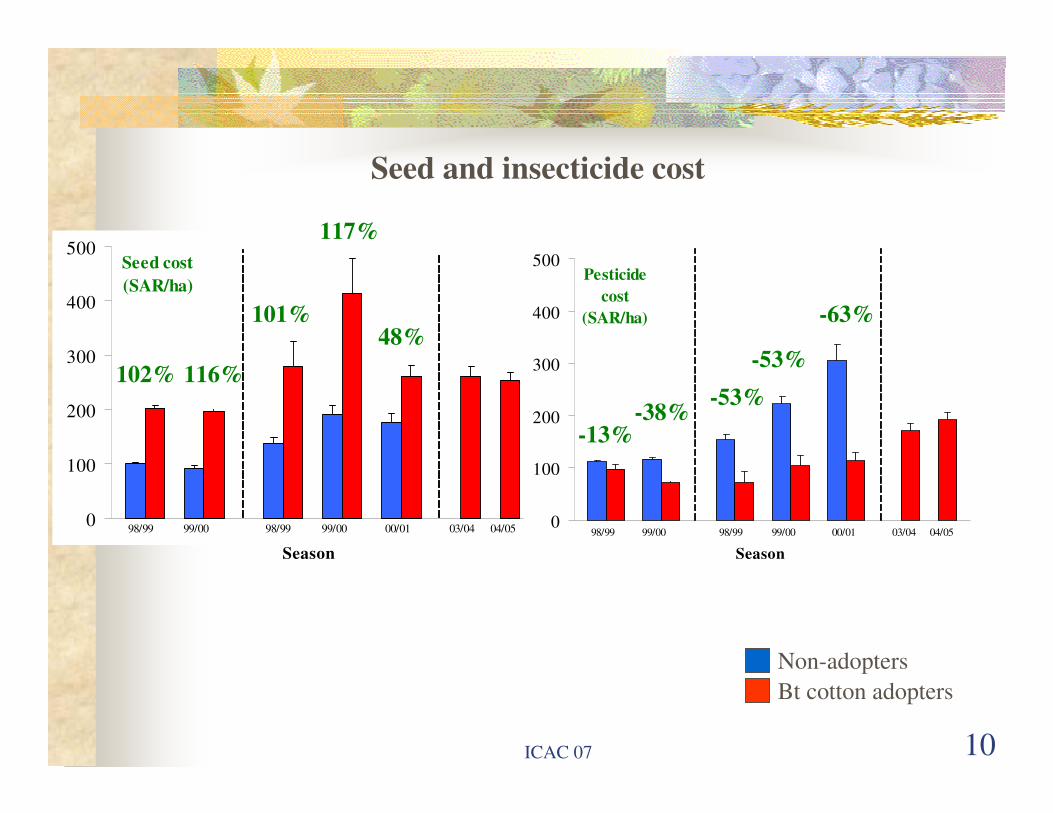
Results (a) Economic impact of Bt cotton Some of the findings (mean and 95% confidence intervals) of the three studies exploring economic impact of Bt cotton are shown in Figures 3 to 5. Within each graph the results of the 3 studies are separated by a vertical line, with study 1 on the left, study 2 in the middle and study 3 on the right. Figure 3 shows the yield and revenue (yield X price) data. In all two seasons of study 1 and the three seasons of study 2 the yields were significantly higher for Bt plots relative to non-Bt and this resulted in a significant increase in revenue. In both of these studies the relative decline in yields for season 1999/2000 relative to the others is due to that season being very wet. Thus the smaller sample of study 1 does mirror quite well the picture obtained from the much larger Vunisa dataset. The average yields for Bt cotton in 03/04 and 04/05 are higher than in the previous seasons and this is probably due to the elimination of more marginal cotton farmers (NSK no longer provided credit) plus the availability of more complete records for fewer farmers compared to the Vunisa dataset. As would be expected the revenue data mirrors the yield data. Figure 4 presents some of the main costs for growing Bt and non-Bt cotton. These are seed, insecticide and labour (spraying, weeding and harvesting where available). Not all labour activities are presented here (e.g. land preparation and planting), but these are the ones where differences were noted. For both studies 1 and 2 the cost of Bt seed is higher than non-Bt, and seed cost is a significant proportion of overall cost, but insecticide costs are lower for Bt plots. Figure 3. Yield and revenue from Bt and non–Bt plots Study 1 – left; Study 2 – middle; Study 3 - right
Non-Bt cottonBt cotton
8
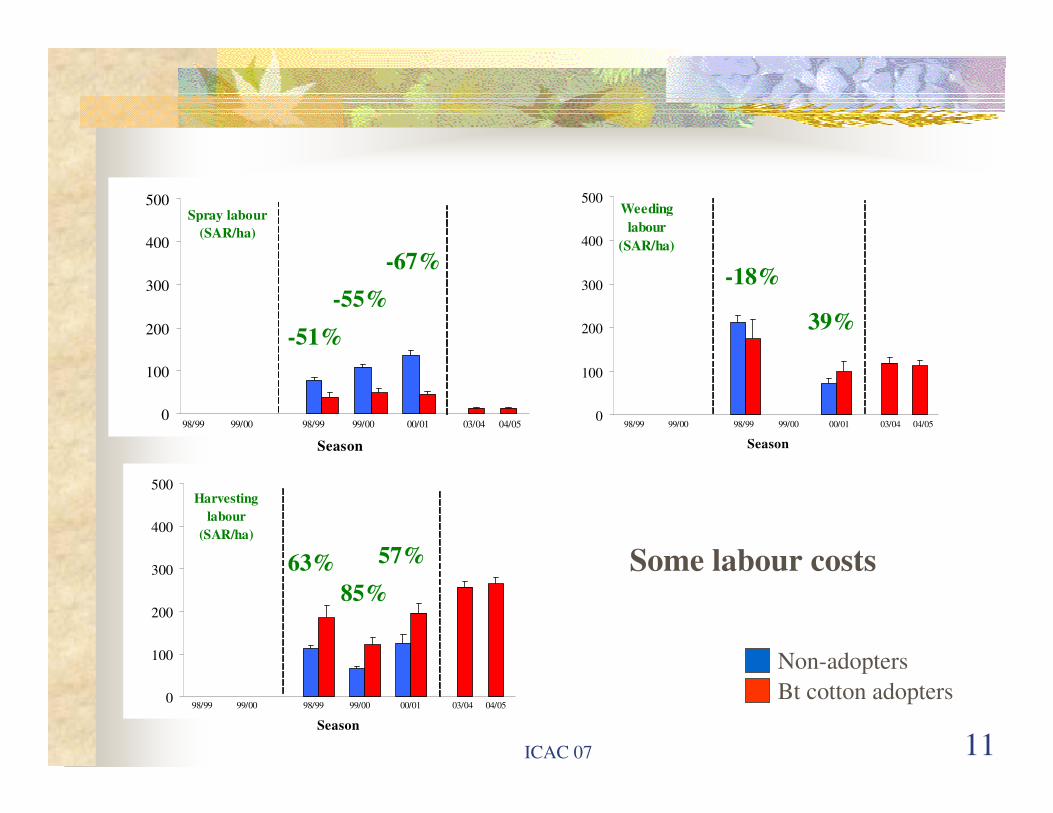
The labour picture is a mixed one. In study 2 the Bt plots clearly have less labour for spraying than non-Bt, for the obvious reason that less insecticide is required, but do have a greater harvesting labour cost as yields are higher. Weeding labour costs are much the same for Bt and non-Bt, as perhaps one would expect. In general the extra cost of the seed and harvest labour is reclaimed through less expenditure on insecticide and spraying. Overall the costs of growing Bt and non-Bt are comparable.
Figure 4. Comparison of some costs of growing cotton between Bt and non-Bt plot. Study 1 – left; Study 2 – middle; Study 3 - right
One interesting feature of Figure 4 is the suggestion that insecticide costs per hectare have increased between 1998/99 and 2004/05. This hypothesis is tested in Table 2. Taking a dummy variable (values of 1 to 5) to represent season it is apparent that insecticide costs have increased between 1998/99 and 2004/05, with an R2 of 34%. Part of this, of course, will be due to inflation and this explanation is supported by the
Non-Bt cottonBt cotton
9
data for spraying labour which suggest, if anything, that this expenditure has declined over the same period. An increase in price could also be linked to a change of product away from bollworm products towards those which target pests attacking vegetative plant parts. Table 2. Results of regressing insecticide cost (SAR/ha) against season
Coefficient (SE) t-value P-value Intercept 35.11 (10.98) 3.2 <0.01 Season 30.27 (3.4) 8.91 <0.001
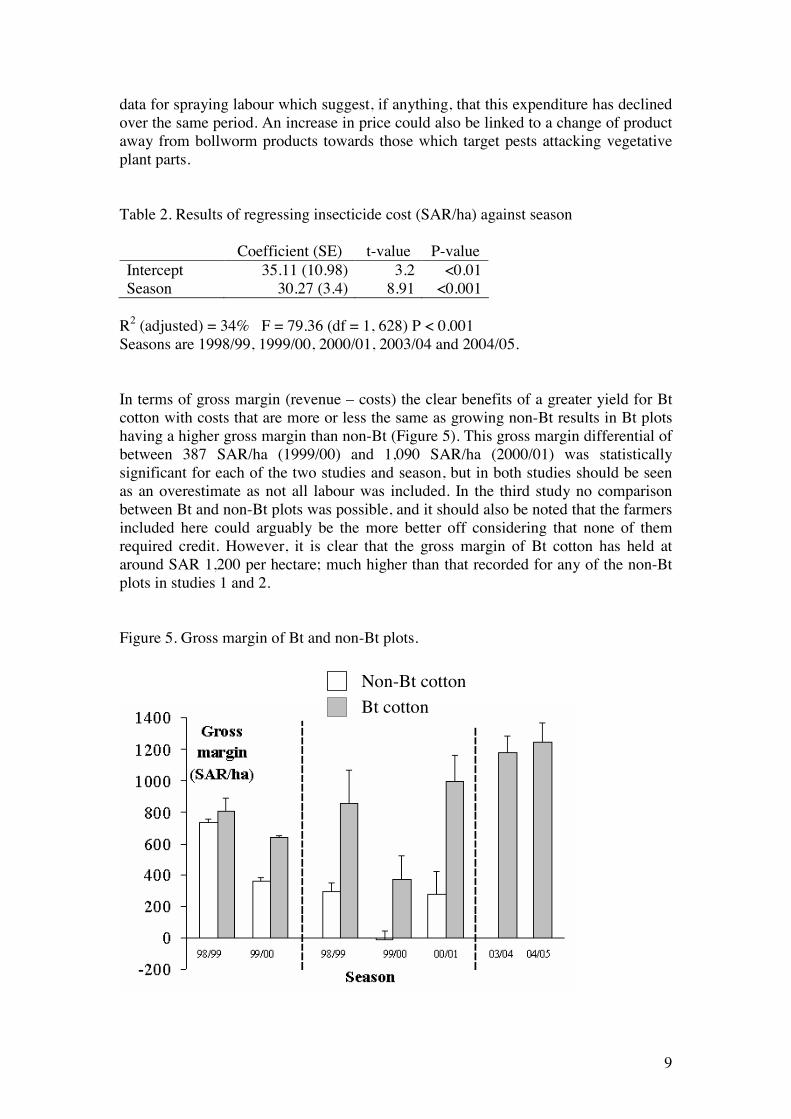
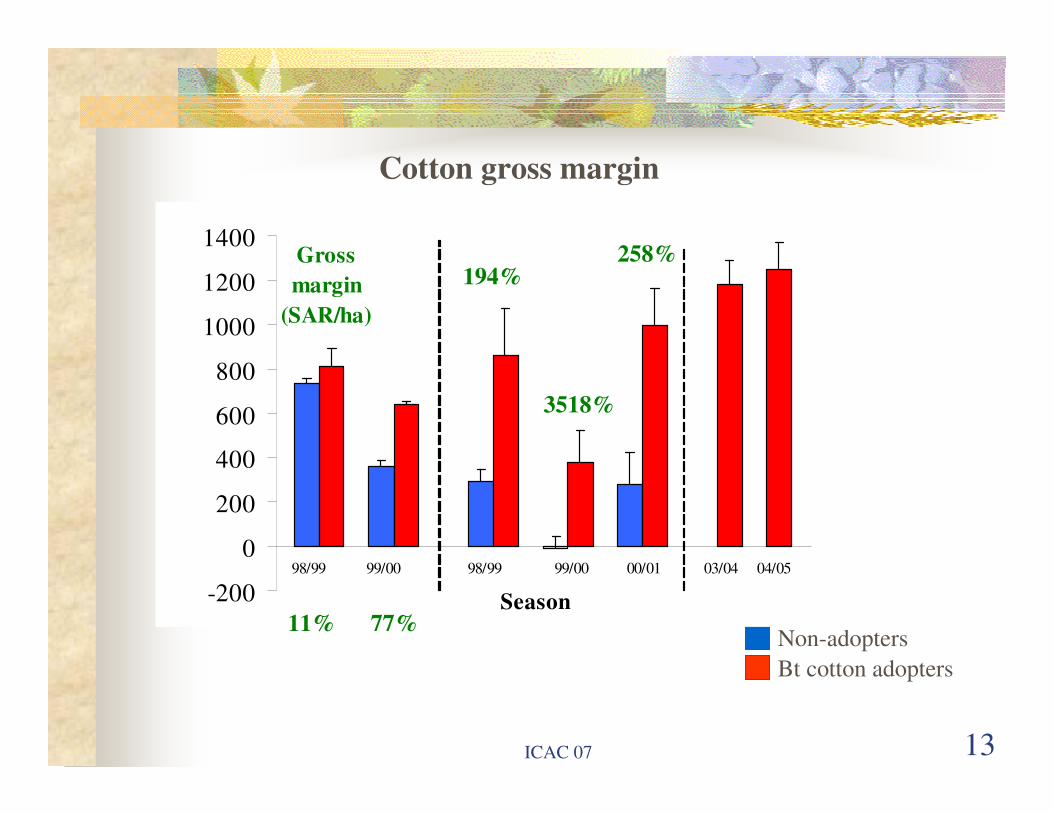
R2 (adjusted) = 34% F = 79.36 (df = 1, 628) P < 0.001 Seasons are 1998/99, 1999/00, 2000/01, 2003/04 and 2004/05. In terms of gross margin (revenue – costs) the clear benefits of a greater yield for Bt cotton with costs that are more or less the same as growing non-Bt results in Bt plots having a higher gross margin than non-Bt (Figure 5). This gross margin differential of between 387 SAR/ha (1999/00) and 1,090 SAR/ha (2000/01) was statistically significant for each of the two studies and season, but in both studies should be seen as an overestimate as not all labour was included. In the third study no comparison between Bt and non-Bt plots was possible, and it should also be noted that the farmers included here could arguably be the more better off considering that none of them required credit. However, it is clear that the gross margin of Bt cotton has held at around SAR 1,200 per hectare; much higher than that recorded for any of the non-Bt plots in studies 1 and 2. Figure 5. Gross margin of Bt and non-Bt plots.
Non-Bt cottonBt cotton
10
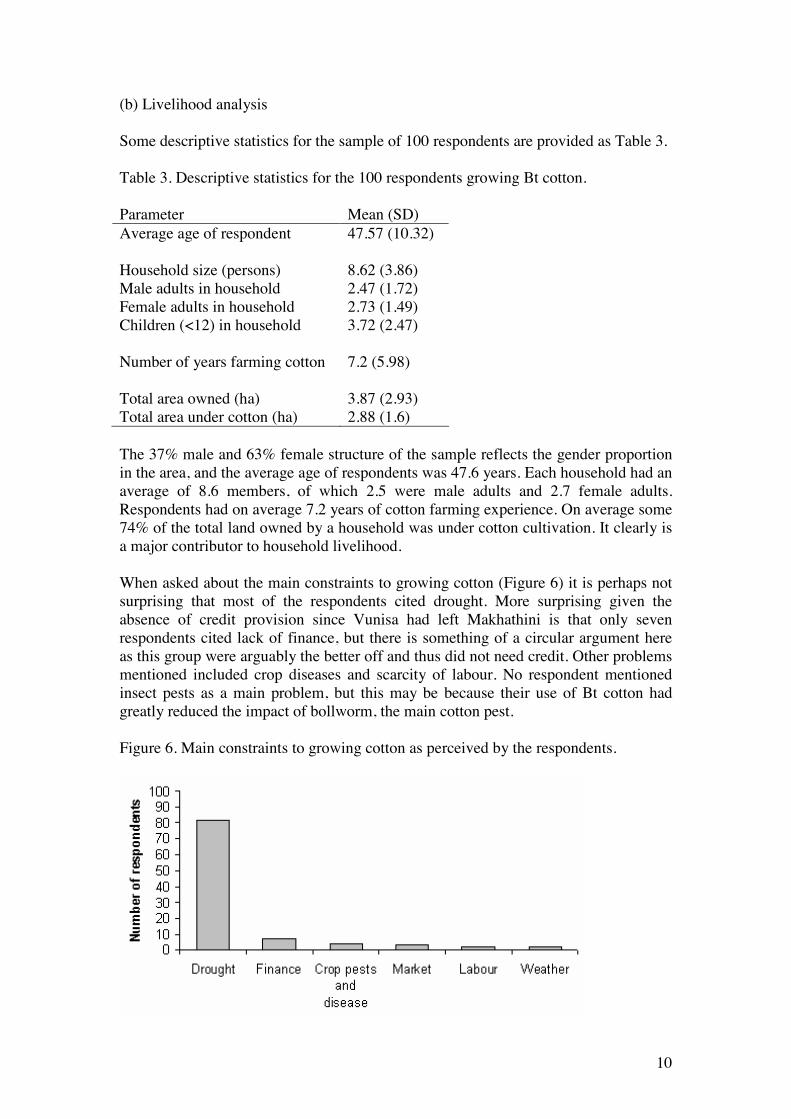
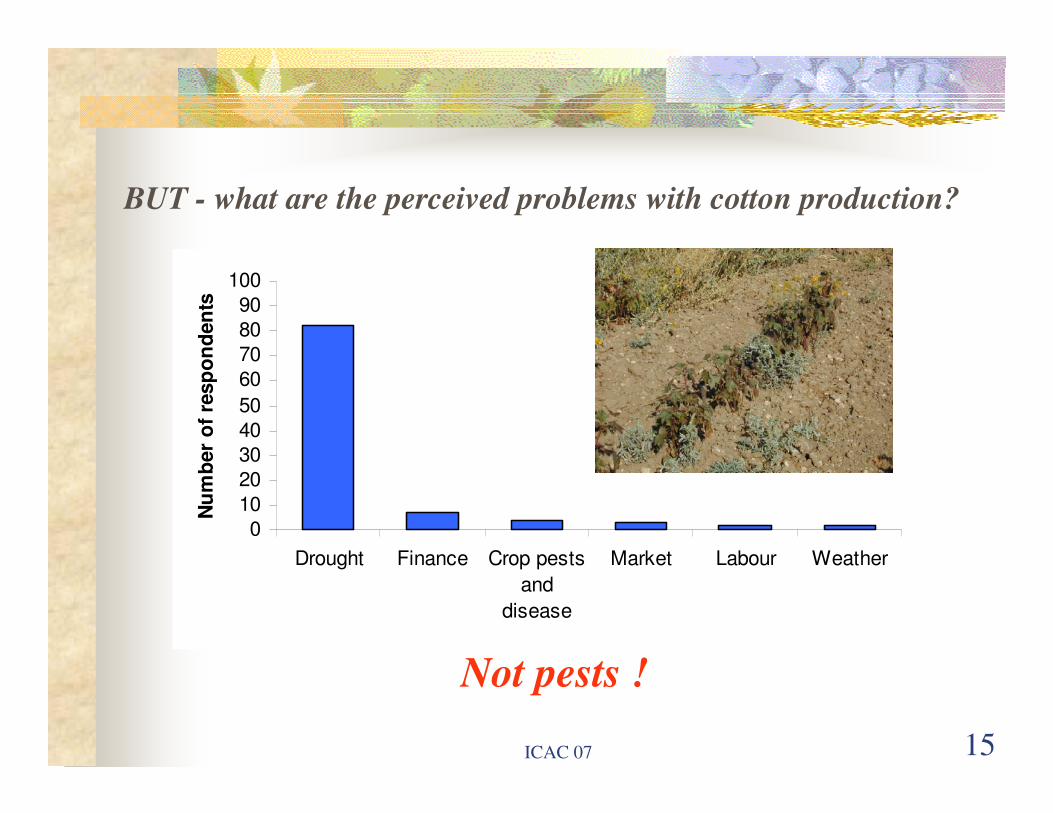
(b) Livelihood analysis Some descriptive statistics for the sample of 100 respondents are provided as Table 3. Table 3. Descriptive statistics for the 100 respondents growing Bt cotton. Parameter Mean (SD) Average age of respondent 47.57 (10.32) Household size (persons) 8.62 (3.86) Male adults in household 2.47 (1.72) Female adults in household 2.73 (1.49) Children (<12) in household 3.72 (2.47) Number of years farming cotton 7.2 (5.98) Total area owned (ha) 3.87 (2.93) Total area under cotton (ha) 2.88 (1.6) The 37% male and 63% female structure of the sample reflects the gender proportion in the area, and the average age of respondents was 47.6 years. Each household had an average of 8.6 members, of which 2.5 were male adults and 2.7 female adults. Respondents had on average 7.2 years of cotton farming experience. On average some 74% of the total land owned by a household was under cotton cultivation. It clearly is a major contributor to household livelihood. When asked about the main constraints to growing cotton (Figure 6) it is perhaps not surprising that most of the respondents cited drought. More surprising given the absence of credit provision since Vunisa had left Makhathini is that only seven respondents cited lack of finance, but there is something of a circular argument here as this group were arguably the better off and thus did not need credit. Other problems mentioned included crop diseases and scarcity of labour. No respondent mentioned insect pests as a main problem, but this may be because their use of Bt cotton had greatly reduced the impact of bollworm, the main cotton pest. Figure 6. Main constraints to growing cotton as perceived by the respondents.
11
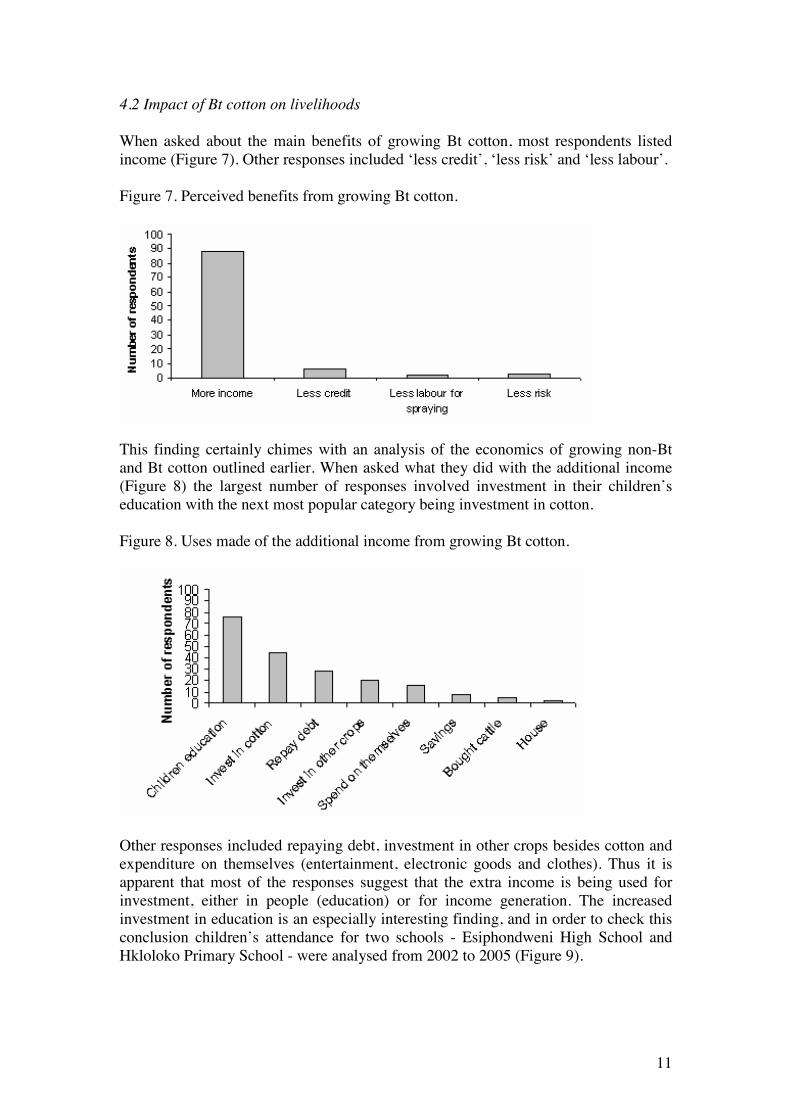
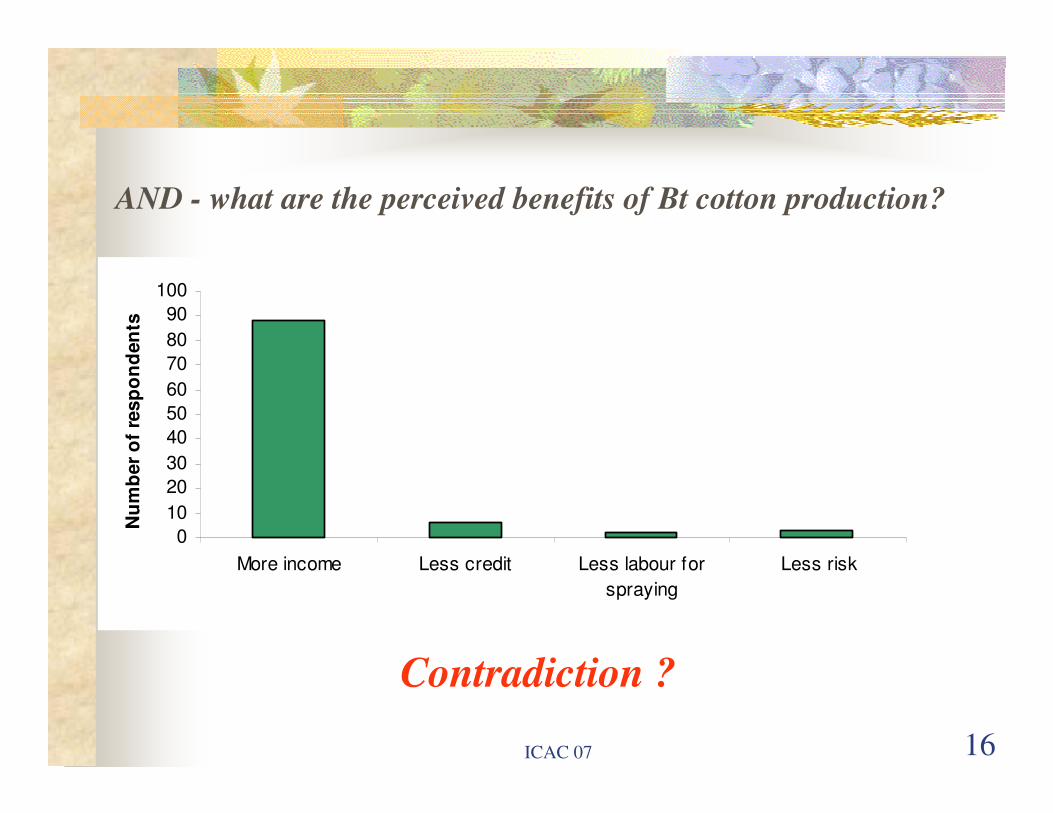
4.2 Impact of Bt cotton on livelihoods When asked about the main benefits of growing Bt cotton, most respondents listed income (Figure 7). Other responses included ‘less credit’, ‘less risk’ and ‘less labour’. Figure 7. Perceived benefits from growing Bt cotton.
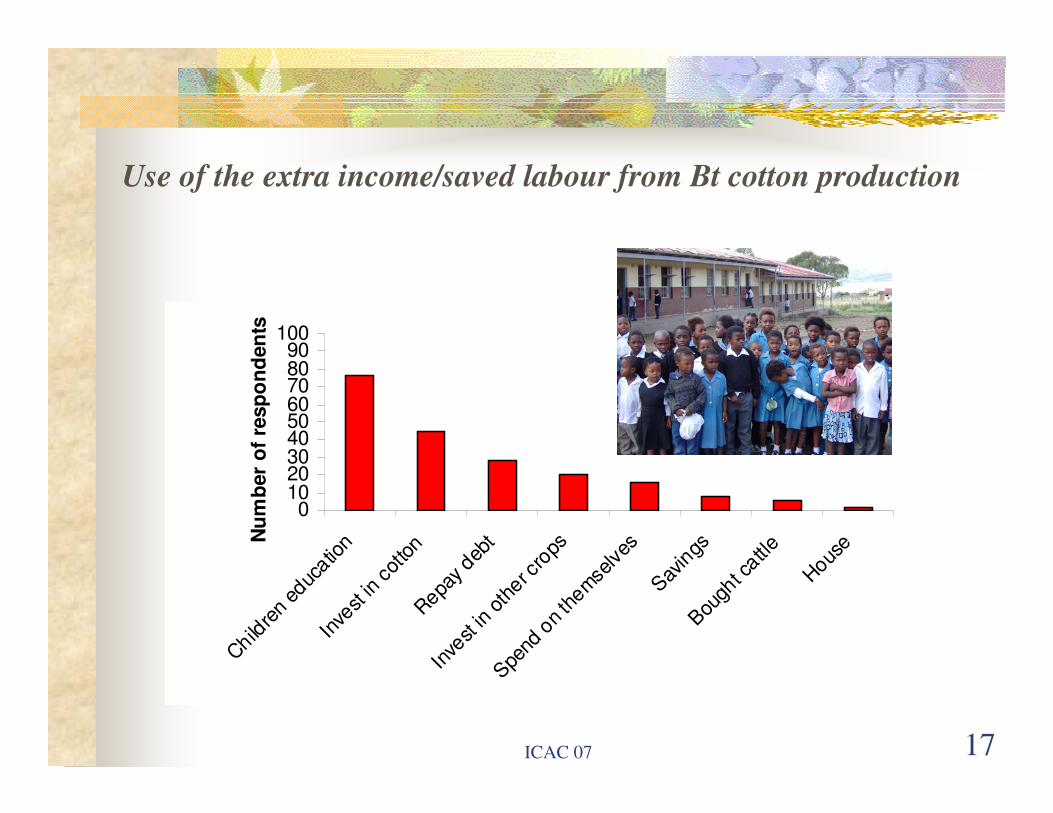
This finding certainly chimes with an analysis of the economics of growing non-Bt and Bt cotton outlined earlier. When asked what they did with the additional income (Figure 8) the largest number of responses involved investment in their children’s education with the next most popular category being investment in cotton. Figure 8. Uses made of the additional income from growing Bt cotton.
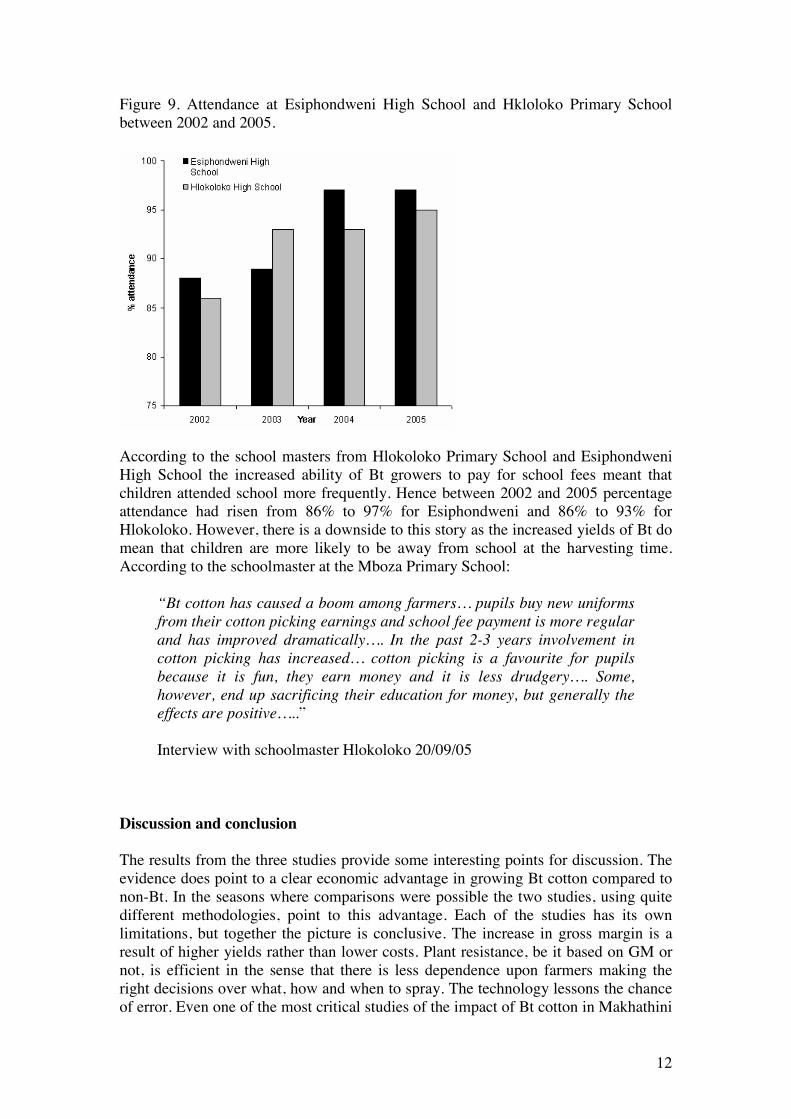
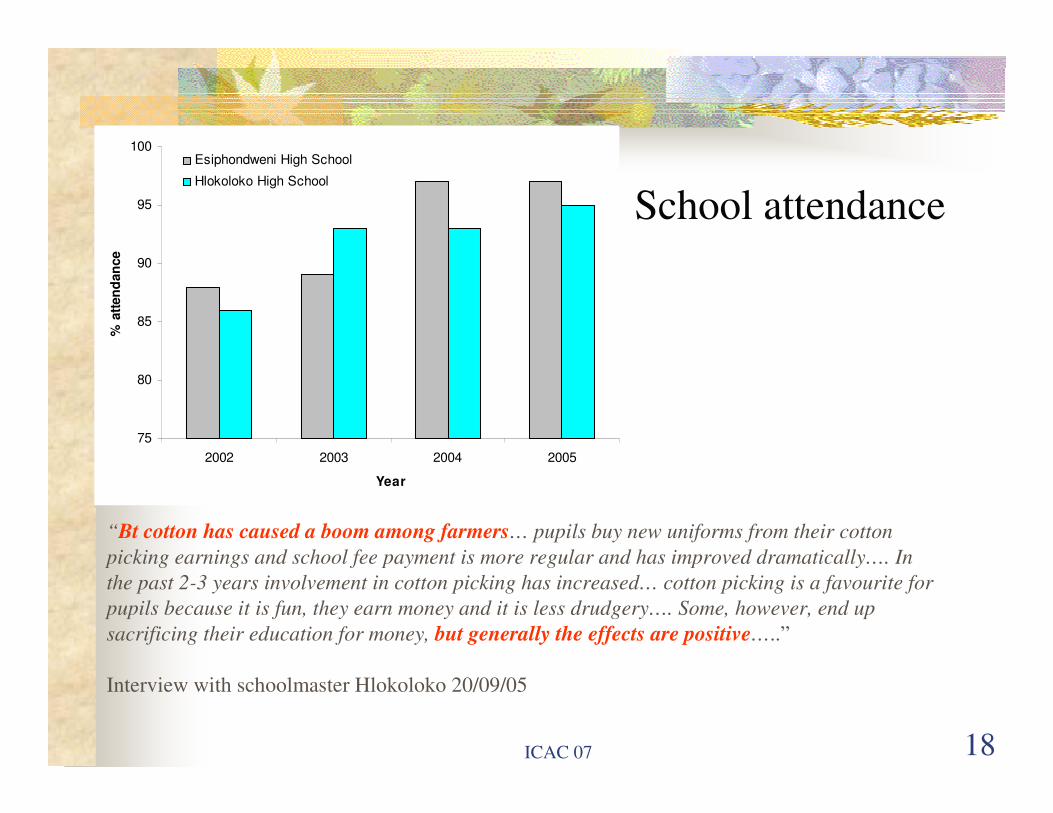
Other responses included repaying debt, investment in other crops besides cotton and expenditure on themselves (entertainment, electronic goods and clothes). Thus it is apparent that most of the responses suggest that the extra income is being used for investment, either in people (education) or for income generation. The increased investment in education is an especially interesting finding, and in order to check this conclusion children’s attendance for two schools - Esiphondweni High School and Hkloloko Primary School - were analysed from 2002 to 2005 (Figure 9).
12
Figure 9. Attendance at Esiphondweni High School and Hkloloko Primary School between 2002 and 2005.
According to the school masters from Hlokoloko Primary School and Esiphondweni High School the increased ability of Bt growers to pay for school fees meant that children attended school more frequently. Hence between 2002 and 2005 percentage attendance had risen from 86% to 97% for Esiphondweni and 86% to 93% for Hlokoloko. However, there is a downside to this story as the increased yields of Bt do mean that children are more likely to be away from school at the harvesting time. According to the schoolmaster at the Mboza Primary School:
“Bt cotton has caused a boom among farmers… pupils buy new uniforms from their cotton picking earnings and school fee payment is more regular and has improved dramatically…. In the past 2-3 years involvement in cotton picking has increased… cotton picking is a favourite for pupils because it is fun, they earn money and it is less drudgery…. Some, however, end up sacrificing their education for money, but generally the effects are positive…..”
Interview with schoolmaster Hlokoloko 20/09/05
Discussion and conclusion The results from the three studies provide some interesting points for discussion. The evidence does point to a clear economic advantage in growing Bt cotton compared to non-Bt. In the seasons where comparisons were possible the two studies, using quite different methodologies, point to this advantage. Each of the studies has its own limitations, but together the picture is conclusive. The increase in gross margin is a result of higher yields rather than lower costs. Plant resistance, be it based on GM or not, is efficient in the sense that there is less dependence upon farmers making the right decisions over what, how and when to spray. The technology lessons the chance of error. Even one of the most critical studies of the impact of Bt cotton in Makhathini
13
which was based on a very limited sample size (just 10 farmers growing Bt and 10 growing non-Bt), much smaller than any of the studies reported here, still pointed to a marginal economic benefit from growing Bt cotton (Hofs et al., 2006). Their mean yield for Bt cotton was 760 + 301 kg/ha and 671 + 209 kg/ha for non-Bt. The other ‘good news’ dimension to the Bt story in Makhathini is the use to which farmers claim to make of the additional income. Top of the list is clearly investment in their children’s education. This is followed by increased investment in cotton, other crops and the repayment of debt. Investment in non-cotton crops would help to diversify livelihoods. There is less emphasis on investment in physical assets but there is evidence that farmers are investing in more land and structures such as houses. There is no evidence to suggest that farmers are disposing of the additional income in less productive pursuits. An increased investment in education can only be seen as a positive development in Makhathini, and is born out by data from schools which show a trend of increased attendance. However, on the more negative side there is some circumstantial evidence that higher yields from Bt cotton do mean that children are kept out of school more often during July to September (the harvest period). Is the livelihood impact of Bt cotton any different from the impact of any other technology that would enhance agricultural income? There was no evidence to suggest a qualitative difference and the same benefits would have presumably accrued if a new ‘conventionally bred’ variety of cotton had been introduced with resistance to bollworm. The Bt gene reduces the need for insecticide but any resistance to bollworm would have done the same although the efficiency of the resistance is obviously important. Frankly whether the resistance has come from a bacterial source or conventional breeding utilising cotton germplasm would not be an immediate issue for Makhathini farmers. What is readily apparent to them is the gains from growing Bt cotton and the support structure in terms of credit availability and the price they obtain for their produce. The rapid adoption of Bt cotton is testament to its popularity. Is there any evidence to suggest that growing Bt cotton is unsustainable? Much depends here upon ones meaning of sustainability. There is no evidence to suggest that the Bt-based resistance is any more durable and hence sustainable than resistance bred through conventional means. Plant resistance to insect pests can break down if the selection pressure is strong enough, but to date despite more than 500,000 squares miles of Bt-engineered crops worldwide there has yet to be a breakdown of Bt-based resistance (Gujar et al., 2007) with the one exception of the diamondback moth (Plutella xylostella). Li et al. (2007) suggest that based upon measured incidence of bollworm resistance genes this could happen in China in 11 to 15 years if no preventative measures are taken. Why the Bt resistance is so durable remains something of a mystery (Biello, 2006). Perhaps the biggest threat to livelihood sustainability in Makhathini is the reliance on income from just one crop - cotton. In effect the companies have a monopoly and farmers relying on cotton have little choice. It should be stressed that this was the case before the introduction of Bt cotton and has not been caused by that technology. But Bt seed does cost significantly more than non-Bt and critics have pointed to an increase in debt as crop or market failure makes Bt growers more vulnerable (Biowatch, 2004; Grain, 2005). A complication with this simple picture is that Vunisa did not begin offering credit when Bt cotton was introduced. Nevertheless while the Biowatch/Grain point is valid it is important to note that this vulnerability would equally apply to an increase in cost of any input.
14
For example, in the 2005/06 study the detailed costs for all inputs, including labour were determined and the ratio of seed cost to all other costs (land preparation, insecticide and labour) was 1:4.3 in 2003/04 and 1:4.6 in 2004/05. An increase in land preparation or labour costs would equally make farmers more vulnerable. The deeper issue alluded to in the Biowatch/Grain critique is the narrowness of the livelihood base – a reliance on just one crop. If the livelihood base was wider then households would be able to cope with failure of one component. Is Bt cotton a magic bullet to address problems of under-development in Makhathihi? Frankly the answer has to be no. It can make a contribution, but the reasons for under-development in Makhathihi are far deeper than can be addressed by but one agricultural technology.
Acknowledgements
The author would like to thank Dr Yousouf Ismael for data collection in South Africa. The author would also like to thank Mr Charles Matalou of Monsanto for local help and support and Chief TJ Buthelezi (Chairman of Ubongwa, Makhathini Flats South Africa) for help with access to farmers.
References
Barwale, R.B., Gadwal, V.R., Zehr, U., and Zehr, B. (2004). Prospects for Bt cotton technology in India. AgBioForum 7(1&2), 23-26.
Bennett, R., Buthelezi, T. J., Ismael, Y. and Morse, S. (2003). Bt cotton, pesticides, labour and health. A case study of smallholder farmers in the Makhathini Flats, Republic of South Africa. Outlook on Agriculture 32 (2), 123-128.
Bennett, R. M., Ismael, Y., Kambhampati, U. and Morse. S. (2004). Economic impact of genetically-modified cotton in India. AgBioforum 7(3), 1-5.
Bennett, R. N., Ismael, Y., Morse, S. and Shankar, B. (2005a). Reductions in insecticide use from adoption of Bt cotton in South Africa: Impacts on economic performance and toxic load to the environment. Journal of Agricultural Science 142, 1-10.
Bennett, R.M., Ismael, Y. and Morse, S. (2005b. Explaining contradictory evidence regarding impacts of genetically modified crops in developing countries. Varietal performance of transgenic cotton in India. Journal of Agricultural Science 143, 35-41.
Bennett, R., Morse, S. and Ismael, Y. (2006a). The economic impact of genetically modified cotton on South African smallholders: yield, profit and health effects. Journal of Development Studies 42(4), 662-677.
15
Bennett, R.M., Kambhampati, U., Morse, S. and Ismael, Y. (2006b). Farm-level economic performance of genetically-modified cotton in India. Review of Agricultural Economics 28(1), 59-71.
Biello, D. 2006. Organic mystery. Scientific American 295(6), 30-33.
Biowatch (2004). Genetically engineered cotton. High risks, low returns. Biowatch Briefing no 3.
Carney, D. (ed.) (1998). Sustainable rural livelihood: What contribution can we make? DFID: London.
Carney, D. (2002). Sustainable Livelihoods Approaches: Progress and possibilities for change. DFID: London.
Castro, P. A. (2002). Sustainable Livelihoods Analysis: An introduction. Syracuse University: New York.
Crost, B., Shankar, B., Bennett, R. and Morse, S. (2007). Bias from farmer self-selection in GM crop productivity estimates: Evidence from Indian Data. Journal of Agricultural Economics 58(1) 24-36.
Grain (2005). Bt cotton in Makhathini, South Africa: the success story that never was. Grain News Release 26th May 2005. Available at www.grain.org
Gujar, G. T., Kalia, V., Kumari, A., Singh, B. P., Mittal, A., Nair, R., Mohan, M. (2007). Helicoverpa armigera baseline susceptibility to Bacillus thuringiensis Cry toxins and resistance management for Bt cotton in India. Journal of Invertebrate Pathology 95(3), 214-219
Hofs, J.L., Fok, M. and Vaissayre, M. (2006). Impact of Bt cotton adoption on pesticide use by smallholders: A 2-year survey in Makhatini Flats (South Africa). Crop Protection 25(9), 984-988
Huang, J. K., Hu, R. F., Rozelle, S., Qiao, F. B. and Pray, C. E. (2002). Transgenic varieties and productivity for smallholder cotton farmers in China. Australian Journal of Agriculture and Resource Economics 46(3), 367-387.
Huang, J. K., Hu, R. F., Pray, C., Qiao, F. B. and Rozelle, S. (2003). Biotechnology as an alternative to chemical pesticides: A case study of Bt cotton in China. Agricultural Economics 29(1), 55-67.
Ismael, Y., Bennett, R. and Morse, S. (2002a). Farm-level economic impact of biotechnology: smallholder Bt cotton farmers in South Africa. Outlook on Agriculture 31(2), 107-111.
Ismael, Y., Bennett, R. and Morse, S. (2002b). Benefits from Bt cotton use by smallholder farmers in South Africa. AgBioForum 5(1), 1-5.
16
James, C. (2006). Global Status of Commercialized Biotech/GM Crops: 2006. ISAAA Brief No. 35. ISAAA: Ithaca, NY.
Kambhampati, U., Morse, S., Bennett, R. and Ismael, Y. (2005). Perceptions of the impacts of genetically modified cotton varieties: A case study of the cotton industry in Gujarat, India. AgBioForum, 8(2&3), 161-171.
Kambhampati, U., Morse, S. and Bennett, R. (2006) Farm-level performance of genetically-modified cotton: A Frontier Analysis of cotton production in Maharashtra. Outlook on Agriculture 35(4), 291-297.
Li GP, Wu KM, Gould F, Wang JK, Miaoi J, Gao XW and Guo YY (2007). Increasing tolerance to Cry1Ac cotton from cotton bollworm, Helicoverpa armigera, was confirmed in Bt cotton farming area of China. Ecological Entomology 32(4), 366-375
Manwan, I. and Subagyo, T. (2002). Transgenic cotton in Indonesia: Challenges and opportunities. Paper presented at the regional workshop for the South East Asian Biotechnology Information Centers, Philippines.
Morse, S., Bennett, R. and Ismael, Y. (2004). Bt cotton boosts the gross margin of small-scale cotton producers in South Africa. Nature Biotechnology 22(4), 379-380.
Morse, S., Bennett, R. M. and Ismael, Y. (2005a). Comparing the performance of official and unofficial genetically modified cotton in India. AgBioforum 8(1), 1-6.
Morse, S., Bennett, R. M. and Ismael, Y. (2005b). Genetically modified insect resistance in cotton: Some economic impacts in India. Crop Protection 24(5), 433-440.
Morse, S., Bennett, R. and Ismael, Y. (2005c). Bt-cotton boosts the gross margin of small-scale cotton producers in South Africa. International Journal of Biotechnology 17(1/2/3), 72-83.
Morse, S., Bennett, R. M. and Ismael, Y. (2007a). Isolating the ‘farmer’ effect as a component of the advantage of growing genetically modified varieties in developing countries: A Bt cotton case study from Jalgaon, India. Journal of Agricultural Science 145(5), 491-500.
Morse, S., Bennett, R. M. and Ismael, Y. (2007b). GM crops: Real benefits for resource-poor farmers in developing countries or greater inequality? AgBioforum 10(1), 44-50.
Morse, S. and Bennett, R. M. (in press). Impact of Bt cotton on farmer livelihoods in South Africa. International Journal of Biotechnology.
Naik, G. (2001). An Analysis of Socio-Economic Impact of Bt Technology on Indian Cotton Farmers. Ahmedabad, India, Centre for Management in Agriculture, Indian Institute of Management.
17
Pemsl, D., Waibel, H. and Orphal, J. (2004). A methodology to assess the profitability of Bt cotton: Case study results from the state of Karnataka, India. Crop Protection 23(12), 1249-1257.
Pray, C. E., Huang, J. K., Hu, R. F. and Rozelle, S. (2002). Five years of Bt cotton in China – the benefits continue. Plant Journal 31(4), 423-430.
Qaim, M. (2003). Bt cotton in India: Field trial results and economic projections. World Development 31(12), 2115-2127.
Qaim M., Cap, E.J., and de Janvry, A. (2003). Agronomics and sustainability of transgenic cotton in Argentina. AgBioForum, 6(1&2), 41-47.
Qaim, M. and Zilberman, D. (2003). Yield effects of genetically modified crops in developing countries. Science 299, 900-902.
Shankar, B., Bennett, R. M and Morse, S. (2007). Output risk aspects of genetically modified crop technology in South Africa. Economics of Innovation and New Technology 16(4), 277-291.
Shankar, B., Bennett, R. M and Morse, S. (in press). Production Risk, Pesticide Use and GM Crop Technology in South Africa. Applied Economics.
Smale, M., Zambrano, P., & Cartel, M. (2006). Bales and balance: A review of the methods used to assess the economic impact of Bt cotton on farmers in developing economies. AgBioForum 9(3), 195-212.
Thirtle, C., Beyers, L., Ismael, Y. and Piesse, J. (2003). Can GM technologies help the poor? The impact of Bt cotton in Makhathini Flats, KwaZulu-Natal. World Development 31(4), 717-732.
Traxler, G., Godoy-Avila, S., Falck-Zepeda, J., & Espinoza-Arellan, J. (2001). Transgenic cotton in Mexico: Economic and environmental impacts, Auburn, AL: Auburn University.
Wilkins, T. A., Rajasekaran, K. and Anderson, D. M. (2000). Cotton biotechnology. Critical Reviews in Plant Science 19(6), 511-550.
Yang, P. Y., Iles, M., Yan. S. and Jolliffe, F. (2005a). Farmers’ knowledge, perceptions and practice in transgenic Bt cotton in small producer systems in Northern China. Crop Protection 24(3), 229-239.
Yang, P. Y., Li, K. W., Shi, S. B., Xia, J. Y., Guo, R, Li, S. S. and Wang, L. B. (2005b). Impacts of transgenic Bt cotton and integrated pest management education on smallholder cotton farmers. International Journal of Pest Management 51 (4), 231-244.
ICAC 07 1
Department of Geography, University of Reading, UK
Telephone +44 118 3788736Email [email protected]
Stephen Morse
SocioSocio--economic impacts of Bt cotton economic impacts of Bt cotton
ICAC 07 2
Much evidence of a positive economic contribution from Bt
cotton for cotton growers in the developing world
BUT
What about impacts on
livelihood?
AND
What about sustainability?Naik (2001)
Qaim (2003)
Qaim and Zilberman (2003)
Pemsl et al. (2004)
Bennett et al. (2004, 2005b, 2006b)
Barwale et al. (2004)
Morse et al. (2005a, 2005b, 2007a, 2007b)
Kambhampati et al. (2005, 2006)
Crost et al. (2007)
India
Pray et al. (2002)
Huang et al. (2002, 2003)
Yang et al. (2005a, 2005b)
China
Manwan and Subagyo (2002)Indonesia
Traxler et al. (2001)Mexico
Qaim et al. (2003)Argentina
Ismael et al. (2002a, 2002b)
Bennett et al. (2003, 2005a, 2006a)
Thirtle et al. (2003)
Morse et al. (2004, 2005c)
Shankar et al. (2007)
Morse and Bennett (in press)
Shankar et al. (in press)
South Africa
ReferencesCountry
ICAC 07 3
MakhathiniMakhathini Flats, Republic of South Africa.Flats, Republic of South Africa.
1st African country to
approve commercial
release of GM crops
(in 1997)
ICAC 07 4
Study area
ICAC 07 5
ADOPTION OF Bt COTTON in MAKHATHINI
0
10
20
30
40
50
60
70
80
90
100
98/99 99/00 00/01 01/02 02/03 03/04 04/05
Season
Ad
op
tio
n (
% o
f fa
rmers
)
ICAC 07 6
ICAC 07 7
1998/99: 1283 (89% of all growers): 1196 (non-adopt) : 87 (adopt)
1999/00: 441 (32% of all growers): 329 (non-adopt) : 112 (adopt)
2000/01: 499 (33% of all growers): 254 (non-adopt) : 245 (adopt)
(2) Economic impact study: Records obtained from Vunisa Cotton
(2001 to 2003) and no reliance on memory recall.
3 studies3 studies
(3) Household livelihood impact study (2005/2006).
100 ‘in depth’ household studies: BUT only Bt adopters
(1) Economic impact survey in November 2000: ~ 90 farmers
interviewed (some reliance on memory recall)
Non-adopters : adopters = 74:17 (season 1998/90) and 32:59 (season 1999/00
ICAC 07 8
Non-adopters
Bt cotton adopters
Cotton yield and revenue
0
200
400
600
800
1000
1200Yield
(kg/ha)
98/99 99/00 00/01
Season
03/04 04/0598/99 99/000
500
1000
1500
2000
2500
3000Revenue
(SAR/ha)
98/99 99/00 00/01
Season
03/04 04/0598/99 99/00
18%
60%
63%
85%
56%
ICAC 07 9
ICAC 07 10
Non-adopters
Bt cotton adopters
Seed and insecticide cost
0
100
200
300
400
500Seed cost
(SAR/ha)
98/99 99/00 00/01
Season
03/04 04/0598/99 99/00 0
100
200
300
400
500Pesticide
cost
(SAR/ha)
98/99 99/00 00/01
Season
03/04 04/0598/99 99/00
102% 116%
101%
117%
48%
-13%-38%
-53%
-53%
-63%
ICAC 07 11
Some labour costs
0
100
200
300
400
500Spray labour
(SAR/ha)
98/99 99/00 00/01
Season
03/04 04/0598/99 99/000
100
200
300
400
500Weeding
labour
(SAR/ha)
98/99 99/00 00/01
Season
03/04 04/0598/99 99/00
0
100
200
300
400
500Harvesting
labour
(SAR/ha)
98/99 99/00 00/01
Season
03/04 04/0598/99 99/00
Non-adopters
Bt cotton adopters
-51%
-55%
-67%-18%
39%
63%
85%
57%
ICAC 07 12
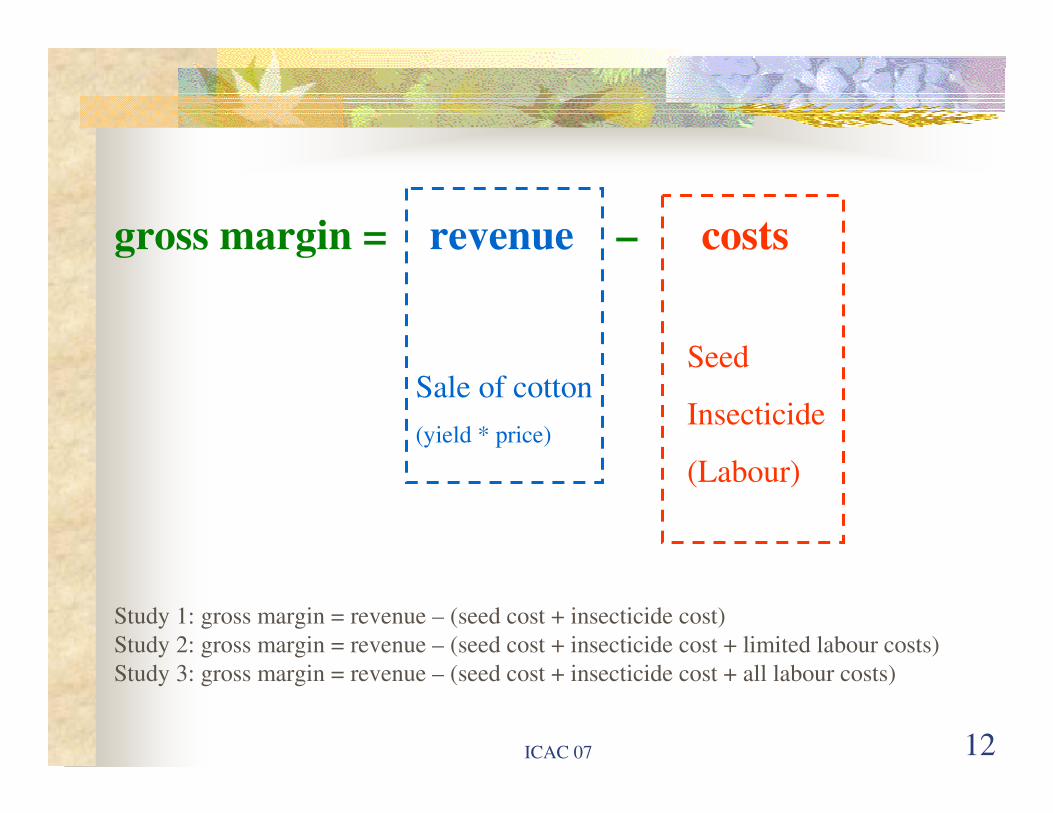
gross margin = revenue – costs
Sale of cotton
(yield * price)
Seed
Insecticide
(Labour)
Study 1: gross margin = revenue – (seed cost + insecticide cost)
Study 2: gross margin = revenue – (seed cost + insecticide cost + limited labour costs)
Study 3: gross margin = revenue – (seed cost + insecticide cost + all labour costs)
ICAC 07 13
Non-adopters
Bt cotton adopters
Cotton gross margin
-200
0
200
400
600
800
1000
1200
1400Gross
margin
(SAR/ha)
98/99 99/00 00/01
Season
03/04 04/0598/99 99/00
11% 77%
194%
3518%
258%
ICAC 07 14
Hence: what can be called the ‘standard model’ of the
benefits often quoted for Bt cotton.
�� More yieldMore yield
�� Better quality cotton (= higher price)Better quality cotton (= higher price)
�� Higher revenueHigher revenue
�� Less insecticide (less expenditure as well as better for the Less insecticide (less expenditure as well as better for the
environment and human health)environment and human health)
�� Higher profit (gross margin) for the farmersHigher profit (gross margin) for the farmers
ICAC 07 15
BUT - what are the perceived problems with cotton production?
Not pests !
0
10
20
30
40
50
60
70
80
90
100
Drought Finance Crop pests
and
disease
Market Labour Weather
Nu
mb
er
of
resp
on
den
ts
ICAC 07 16
AND - what are the perceived benefits of Bt cotton production?
Contradiction ?
0
10
20
30
40
50
60
70
80
90
100
More income Less credit Less labour for
spraying
Less risk
Nu
mb
er
of
resp
on
den
ts
ICAC 07 17
Use of the extra income/saved labour from Bt cotton production
0102030405060708090
100
Child
ren
educ
ation
Inve
st in
cot
ton
Repa
y deb
t
Inve
st in
oth
er cro
ps
Spe
nd o
n th
emse
lves
Sav
ings
Bou
ght c
attle
Hous
eNu
mb
er
of
resp
on
den
ts
ICAC 07 18
75
80
85
90
95
100
2002 2003 2004 2005
Year
% a
tten
dan
ce
Esiphondweni High School
Hlokoloko High School
School attendance
“Bt cotton has caused a boom among farmers… pupils buy new uniforms from their cotton
picking earnings and school fee payment is more regular and has improved dramatically…. In
the past 2-3 years involvement in cotton picking has increased… cotton picking is a favourite for
pupils because it is fun, they earn money and it is less drudgery…. Some, however, end up
sacrificing their education for money, but generally the effects are positive…..”
Interview with schoolmaster Hlokoloko 20/09/05
ICAC 07 19
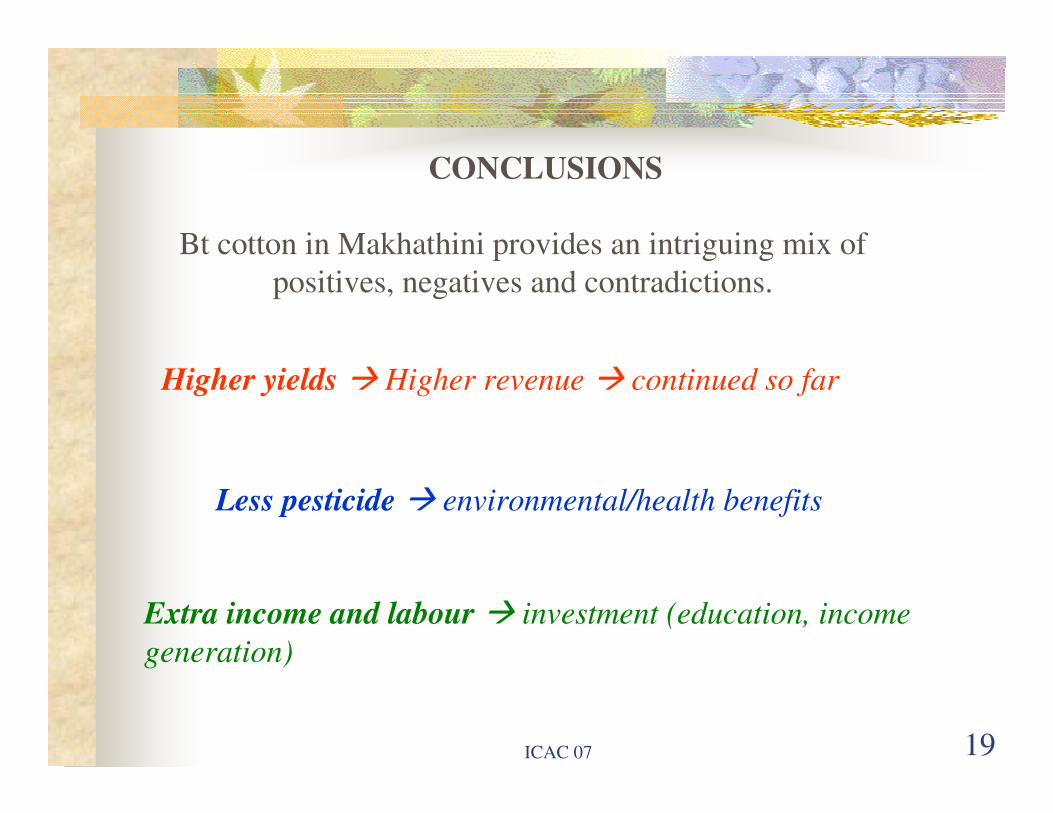
CONCLUSIONS
Bt cotton in Makhathini provides an intriguing mix of
positives, negatives and contradictions.
Higher yields � Higher revenue � continued so far
Less pesticide � environmental/health benefits
Extra income and labour � investment (education, income
generation)
ICAC 07 20
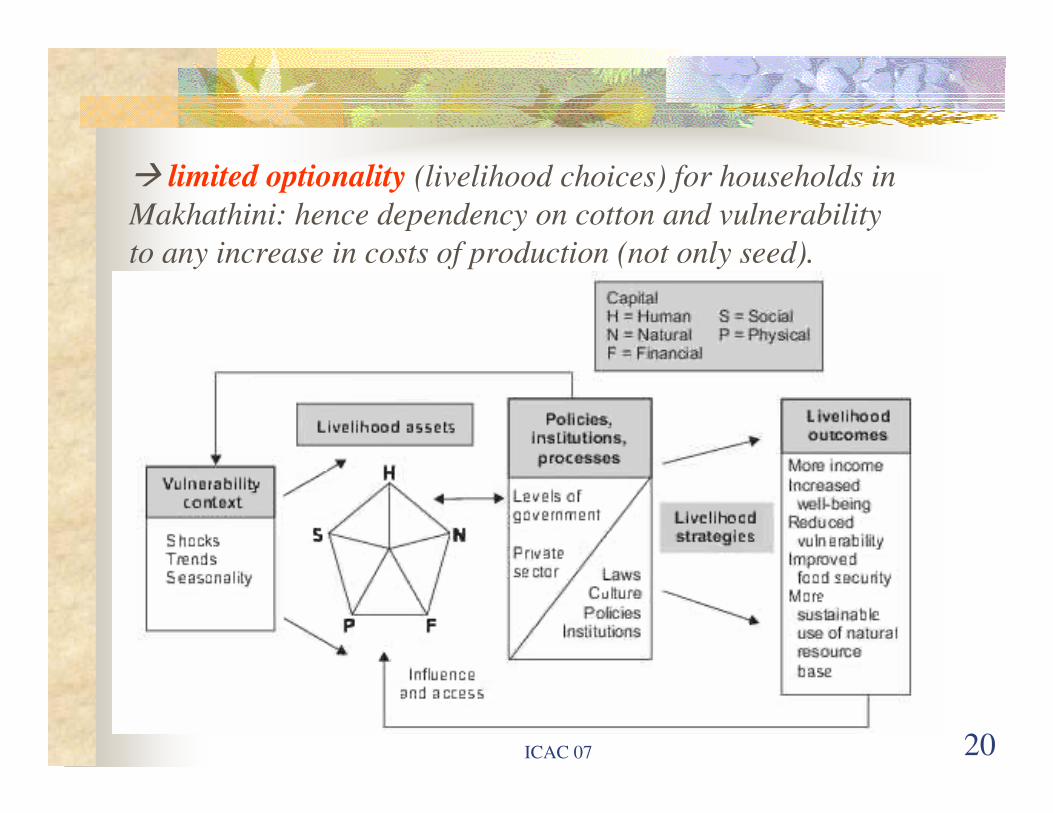
� limited optionality (livelihood choices) for households in
Makhathini: hence dependency on cotton and vulnerability
to any increase in costs of production (not only seed).
ICAC 07 21
� Limited (if any) choice over source of inputs (including
credit) and sale of produce (Vunisa has moved on and
NSK does not offer credit)
� Bt cotton is NOT a magic bullet in development
BUT BUT
Bt cotton has on balance made a positive contribution for Bt cotton has on balance made a positive contribution for
farming HH in farming HH in MakhathiniMakhathini


![IS 14564 (1998): Textiles - Cotton tapes for personnel ... · IS 14564 (1998): Textiles - Cotton tapes for personnel parachutes [TXD 13: Textile Materials for Aerospace Purposes]](https://img.pdfslide.us/doc/110x75/5f07635e7e708231d41cbc64/is-14564-1998-textiles-cotton-tapes-for-personnel-is-14564-1998-textiles.jpg)