Embed Size (px)
Citation preview
International Journal of Scientific and Research Publications, Volume 4, Issue 7, July 2014 1 ISSN 2250-3153
www.ijsrp.org
Socio Economic Impact of Pilgrimage Tourism: A
Geographical Enquiry of Matavashino Devi
Dr Mohammad Ashfaq & Mrs Shazia Parveen
Department of Geography University of Jammu
Abstract- Pilgrimage as a form of journey provide an opportunity
for the people to visit sacred places and is a feature common to
more or less all societies. The land of Jammu is blessed with the
holy stay of many great saints and spiritual souls. Mata Vaishno
Devi being one of them is the most popular shrine located in the
lap of Tirkuta Hills of Jammu region. Every year lacs of devotees
from every nook and corner of the country as well as from
different parts of the world pay the obeisance at shrine. The
present work is an attempt to study the socio-economic impacts
of pilgrimage tourism at Katra and its surrounding areas and also
study the share of this pilgrimage centre in the state economy.
Index Terms- Vaishno Devi, Tirkuta Hills, Katra, Pilgrim.
I. INTRODUCTION
ata Vaishno Devi is one of most well-known shrines since
time immemorial. The Hindu mythology claims that
during the period when Goddess was busy in destroying the
various Asuras, one day her three main manifestations viz. Mata
Maha Kali, Mata Maha Lakshmi and Mata Maha Saraswati got
together and pooled their collective spiritual strength. A stunning
bright light emanated from the place where the supernatural
forces of the three manifestations coalesced and a beautiful
young girl emerged out of this Tejas (Supernatural forces).
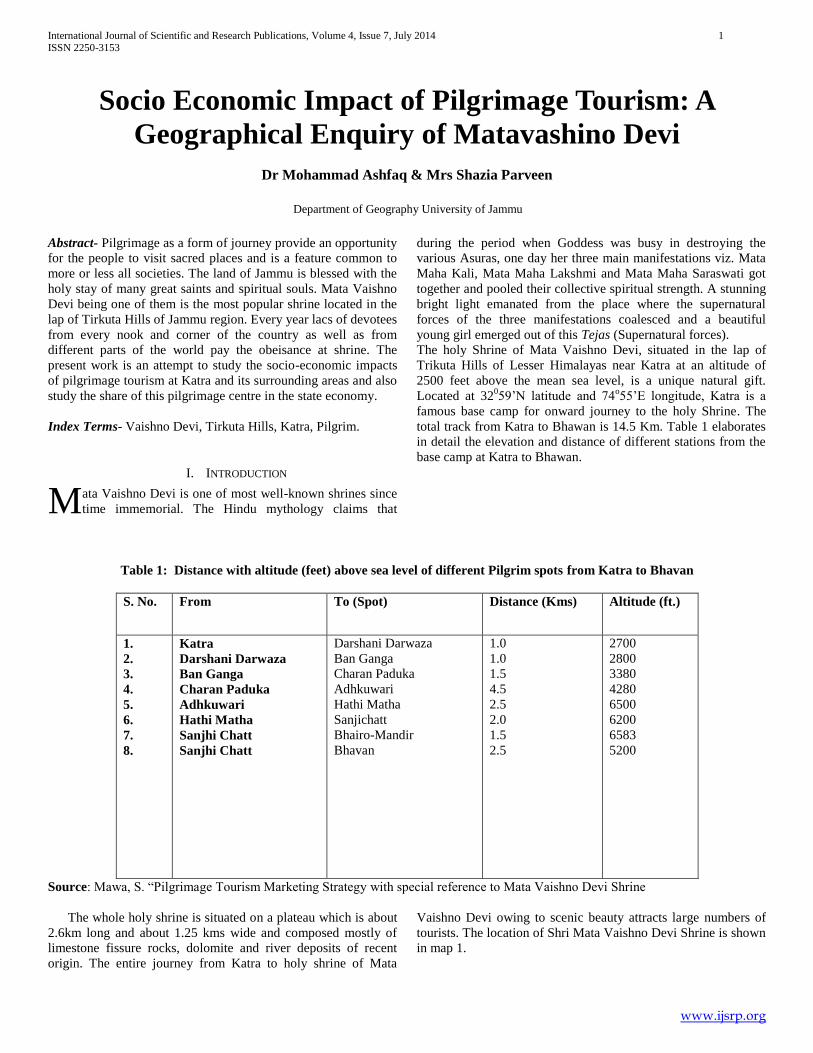
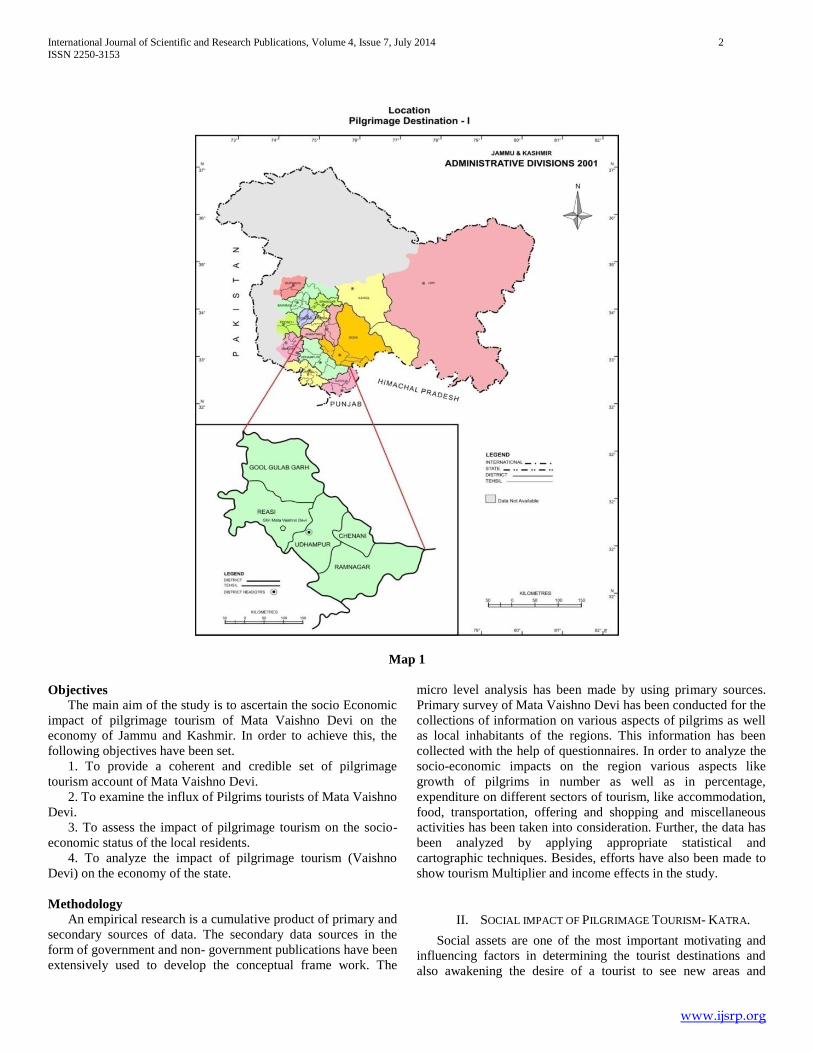
The holy Shrine of Mata Vaishno Devi, situated in the lap of
Trikuta Hills of Lesser Himalayas near Katra at an altitude of
2500 feet above the mean sea level, is a unique natural gift.
Located at 32059’N latitude and 74
o55’E longitude, Katra is a
famous base camp for onward journey to the holy Shrine. The
total track from Katra to Bhawan is 14.5 Km. Table 1 elaborates
in detail the elevation and distance of different stations from the
base camp at Katra to Bhawan.
Table 1: Distance with altitude (feet) above sea level of different Pilgrim spots from Katra to Bhavan
S. No. From To (Spot) Distance (Kms) Altitude (ft.)
1.
2.
3.
4.
5.
6.
7.
8.
Katra
Darshani Darwaza
Ban Ganga
Charan Paduka
Adhkuwari
Hathi Matha
Sanjhi Chatt
Sanjhi Chatt
Darshani Darwaza
Ban Ganga
Charan Paduka
Adhkuwari
Hathi Matha
Sanjichatt
Bhairo-Mandir
Bhavan
1.0
1.0
1.5
4.5
2.5
2.0
1.5
2.5
2700
2800
3380
4280
6500
6200
6583
5200
Source: Mawa, S. “Pilgrimage Tourism Marketing Strategy with special reference to Mata Vaishno Devi Shrine
The whole holy shrine is situated on a plateau which is about
2.6km long and about 1.25 kms wide and composed mostly of
limestone fissure rocks, dolomite and river deposits of recent
origin. The entire journey from Katra to holy shrine of Mata
Vaishno Devi owing to scenic beauty attracts large numbers of
tourists. The location of Shri Mata Vaishno Devi Shrine is shown
in map 1.
M
International Journal of Scientific and Research Publications, Volume 4, Issue 7, July 2014 2
ISSN 2250-3153
www.ijsrp.org
Map 1
Objectives
The main aim of the study is to ascertain the socio Economic
impact of pilgrimage tourism of Mata Vaishno Devi on the
economy of Jammu and Kashmir. In order to achieve this, the
following objectives have been set.
1. To provide a coherent and credible set of pilgrimage
tourism account of Mata Vaishno Devi.
2. To examine the influx of Pilgrims tourists of Mata Vaishno
Devi.
3. To assess the impact of pilgrimage tourism on the socio-
economic status of the local residents.
4. To analyze the impact of pilgrimage tourism (Vaishno
Devi) on the economy of the state.
Methodology An empirical research is a cumulative product of primary and
secondary sources of data. The secondary data sources in the
form of government and non- government publications have been
extensively used to develop the conceptual frame work. The
micro level analysis has been made by using primary sources.
Primary survey of Mata Vaishno Devi has been conducted for the
collections of information on various aspects of pilgrims as well
as local inhabitants of the regions. This information has been
collected with the help of questionnaires. In order to analyze the
socio-economic impacts on the region various aspects like
growth of pilgrims in number as well as in percentage,
expenditure on different sectors of tourism, like accommodation,
food, transportation, offering and shopping and miscellaneous
activities has been taken into consideration. Further, the data has
been analyzed by applying appropriate statistical and
cartographic techniques. Besides, efforts have also been made to
show tourism Multiplier and income effects in the study.
II. SOCIAL IMPACT OF PILGRIMAGE TOURISM- KATRA.
Social assets are one of the most important motivating and
influencing factors in determining the tourist destinations and
also awakening the desire of a tourist to see new areas and
International Journal of Scientific and Research Publications, Volume 4, Issue 7, July 2014 3
ISSN 2250-3153
www.ijsrp.org
visualizing them to be different from their own. For a moment
they want to mingle themselves in to a new world. This whole
process causes a social change to come in the society.
Appreciation of social impact of tourism has been neglected;
however, Sir George Young logically highlighted the importance
of considering social impact of tourism along with its economic
impact. The social consequences of the economic activity are to
be taken into consideration at some stage during growth of that
activity in a universal manner. Tourism involves the trafficking
of people, because it personifies contacts with the rich and the
poor nations of the world. A major part of its very existence is
social intercourse, because it is an industry that is very sensitive
to non-economic influence, tourism requires the establishments
of careful balance between economic and social benefits, in
tourism there is personal confrontation, affluence and poverty.
Tourism indeed is not all economics it is a host-guest
relationship. Tourism expands the social and cultural frontiers
through the interaction of various cultures and also due to
enhanced educational ability which equips the humanity with
new ideas, new skills and new cultures thereby acting as a
powerful instrument of socio-economic transformation. Social
impacts of tourism refer to the change in the quality of life of
residents of tourist destinations as a result of development of
tourism in that region. Katra, is a hub of pilgrimage tourism in
Jammu region. Due to the development of tourism a great change
has been noticed among the young generation than the older
people. There is no doubt that this destination has experienced a
vital social change in the past three decades. The change in
society is very natural but advent of tourism along with modern
mass media has accelerated the process of change. Sometimes
the change is viewed as undesirable and unhealthy.
No doubt with the spread of information and communication
revolution, the world is shrinking towards a global village. In the
study area, this process has been further accelerated due to
tourism. The cultural setup, lifestyle, food habits, dress,
language, dance, drama, music, literature, value system, rituals
and customs everything has witnessed tremendous change as a
result of tourism in the study area. Sometime the change is
desirable but in most of the cases it is a dilution of socio-cultural
framework of the host region. The social changes/impacts can be
study under the following heading:
1.1 Demographic change – Katra
Katra is known the world over, for its great religious sanctity
and supreme reverence. The growth rate of population in Katra
shows a remarkable change since 1911 to 2011 (Table 2). The
earlier settlement of Katra was known as Thath, which was
renamed later on as Katra by Maharaja Gulab Singh in 1981. As
evident from the population figures of year 1911, there were only
828 persons living in the settlement of Katra during the period of
Dogra rule. The whole hillock of Mata Vaishno Devi Ji belonged
to the Dharmath Trust, which was looking after the management
of Holy cave and the route along the Dharamshallas.
Table 2: Growth of Population since 1911-2011 – Katra
Census Year Population Decadal Growth (%age)
1911
1921
1931
1941
1951
1961
1971
1981
1991
2001
2011
828
868
950
1005
1267
1529
3315
4573
NA
8303
9008
4.83
9.44
5.78
26.06
20.62
116.80
38.00
NA
81.56
8.49
Source: Census of India 2011.
The table further reveals that the population of Katra Town
has increased to 3315 in 1971 and 9008 in 2011 A.D.
respectively. But with an increase in pilgrim flow the resident
population also grew to 116.8 percent during 1961-71 decade. It
is only, because of this growth in population that the Government
of Jammu and Kashmir state has to notify the settlement of Katra
under the provisions of Jammu and Kashmir State Municipal
Act, making Katra as an urban town with constitution of a
Notified Area Committee. Besides, the increase in resident
population, the floating population has also increased by i.e.
81.56 percent from 1981 to 2001, especially after the constitution
of Shri Mata Vaishno Devi Shrine Board in 1986. In the recent
decade the growth of population at katra town is 8.49 percent
which is very low as compare to the previous decadal growth
rate.
1.2 Occupational structure – Katra
As per the Census records of previous four decade, i.e. 1961,
1971, 1981 and 2001 an analysis has been made that reflects a
drastic change in the occupational pattern in the decade of 1961-
71. It is observed that cultivators’ percentage has decreased from
10.2 percent (1961) to 2.6 percent (1971) and 1.4 percent in
1981. A further decline of 0.2 percent in the year 2001 has been
recorded. Being a pilgrimage centre substantial increase has been
made noticed in the territory sector, where labourer category and
other services has increased from 10.9 percent (1961) to 17.7
percent (1971) to 19.20 percent (1981) and 34.0 percent (2001).
Similarly, the decrease in non-worker dependent on pilgrims has
been found declined from 70.3 percent (1961) to 65.7 percent
(1981) and 63.1 percent (2001). The table reveals that the
economic base of the town has considerably strengthened in
International Journal of Scientific and Research Publications, Volume 4, Issue 7, July 2014 4
ISSN 2250-3153
www.ijsrp.org
secondary and tertiary sector, but has dwindled in primary sector because of increased urbanization.
Table 3: Occupational Structure (percentage) – Katra
S. No. Occupation 1961 1971 1981 2001
1 Cultivators 10.2 2.6 1.4 0.2
2 Household Industries 1.8 0.5 3.2 0.1
3 Trader and Commerce 7.5 7.6 10.5 2.6
4 Labour and other services 10.9 17.7 19.2 34.0
5 Non-workers Dependent on Yatries 70.3 71.6 65.7 63.1
Total Workers 100.0 100.0 100.0 100.0
Source: Master Plan Katra 2021 A.D.
1.3 Changing land use – Katra The Tourism with its excessive concern for aesthetic
economic development, lays greater stress on the part of land
resources. It is the tourism only when compared to other
urbanizing agents, has involved in higher rate of conversion of
agricultural land to non-agricultural one mainly for tourist
landscaping and meeting the recreation needs of the tourists. The
extent of conversion however varies from one resort to another
depending upon the type of tourism being promoted, the nature
of tourist arrivals and the most important of all is the type of
tourism promotional agency.
The land use scenario of Katra town has witnessed a
tremendous change during the last few decades. Since Katra
town receives countless pilgrims per year thus for the
management of the town, the State Government has initiated
Town Planning Scheme for developing the town in an organized
manner. For this the State Govt. brought Katra town under the
provisions of the State Town Planning Act, 1963 and constituted
a Development Board for the preparation of a town planning
scheme for 410.58 acres of lands out of which only 82.58 acres
of land has been developed for various uses, as given in table 4.
During the year 1975 the residential area was restricted to 26
acres out of which 5 acres was devoted to commercial activities,
7.5 acres for public/semi public utilities, 0.6 acres for socio-
cultural activities, 7.0 acres for recreational activities, 2.0 acres
for religious and archaeological usage, 16 acres for circulation, 3
acres for industrial purpose. Land measuring 328 acres was under
open area. But this has been transformed in to various land uses
like residential, Pilgrims accommodation, commercial, Govt.
Offices, Hotel, Guest Houses, Circulation and industries. As a
result of this open area has decreased. The town Planners has
proposed different proportion of land under different land use
plan, given in table 4, which shows increase in land use over the
year under different plans. Thus Katra has gradually sprawled
towards the surrounding villages. It demands control over the
future development in and around this expanding town, so as to
achieve a sustainable urban development and provide better
infra-structure to the pilgrims and local population in near future.
Table 4: Proportion of Land under different categories – Katra
S.
No.
Land use As on. 18.8.1975 As on 13.9.1986 As on Feb. 2002
Area Area Area
1. Residential 26.00 107.26 238.00
2. Pilgrim accommodation in
dormitory use
9.00 27.80 27.80
3. Commercial
a. General Business
b. Hotels
c. Guest House
d. Cinema
3.00
2.00
-
-
4.22
8.22
-
0.50
12.65
16.73
16.87
0.50
4. Public/Semi Public
a. Educational Institutes
b. Medical Institutes
c. Govt. offices
d. Labour Sarai
2.30
0.60
3.10
0.30
4.02
1.06
8.69
0.50
6.26
1.06
10.00
0.50
5. Public utilities 1.20 1.84 2.00
6. Social cultural 0.60 3.61 8.34
7. Recreational:
a. Parks, open spaces etc.
7.00
8.00
10.00
8. Religious and Archaeological 2.00 5.28 10.25
9. Circulation:
a. Road/lanes
16.00
32.03
71.82
International Journal of Scientific and Research Publications, Volume 4, Issue 7, July 2014 5
ISSN 2250-3153
www.ijsrp.org
b. Terminal Parking
c. Air strip
d. Industrial
-
6.48
3.00
6.50
6.48
1.87
6.50
8.45
1.00
11 Open Area 328.00 1094.79 2252.84
Total 410.58 1322.67 2701.57
Source: Master Plan – Katra 2021 A.D. prepared by town planning organization Jammu, p.15
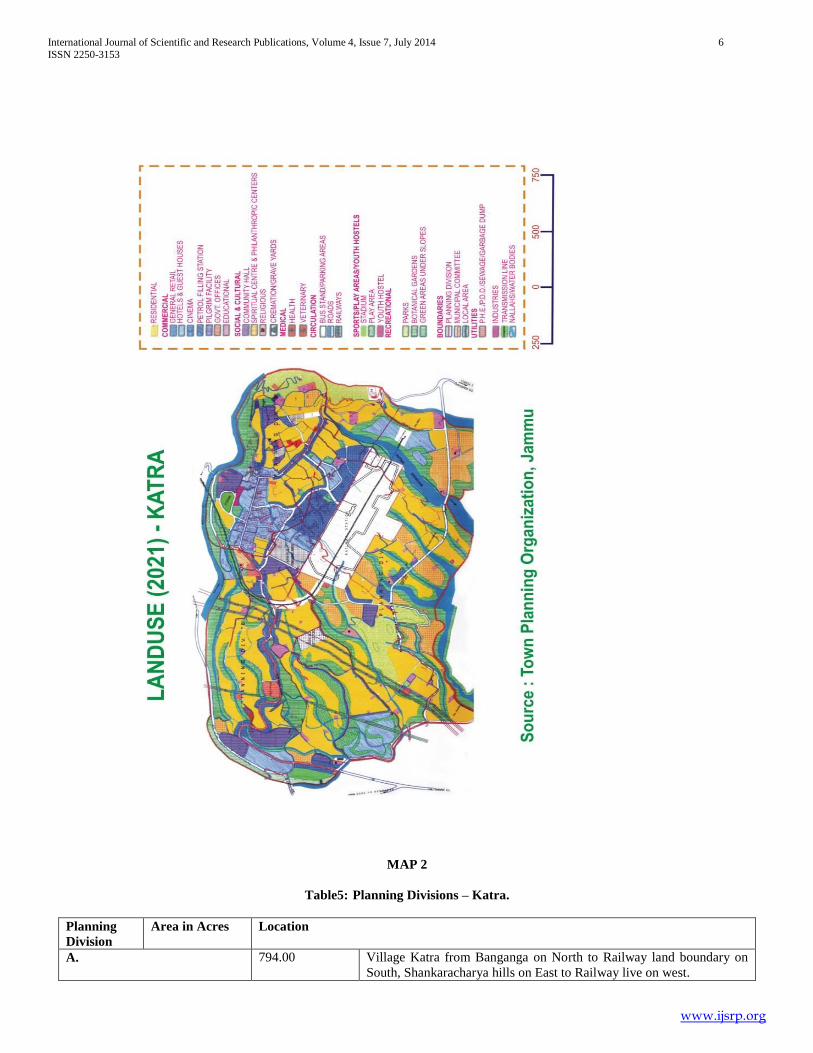
1.4 Proposed Land Use
The growth of Katra town got a fillip since 1975. It is
mainly due to the growth of pilgrimage tourism at Mata Vaishno
Devi. Katra is serving as the most important nucleus for
pilgrimage to the Darbar of Mata Vaishno Devi and hence lots of
efforts have been made by both the state authorities and Shrine
Board Authorities in providing facilities to the pilgrims in Katra
and along the route to the holy cave. Moreover, in view of the
ongoing disturbance in the state security is the prime priority.
The movement of vehicles, their parking, the movement of
pilgrims, their stay and their shopping etc. demand proper
attention among other day to day problems in Katra. Therefore,
the state Government proposed land use plan 2021 A.D. for
Katra so as to achieve sustainable urban development and
provide adequate infrastructure to the local population and
pilgrims in near future. A detail of land use plan is shown in map
2. This proposed land use plan, covering about 2699.60 acres of
land, has been divided into three planning divisions (Table 5), in
order to effectively implement the proposals envisaged in Master
Plan.
International Journal of Scientific and Research Publications, Volume 4, Issue 7, July 2014 6
ISSN 2250-3153
www.ijsrp.org
MAP 2
Table5: Planning Divisions – Katra.
Planning
Division
Area in Acres Location
A. 794.00 Village Katra from Banganga on North to Railway land boundary on
South, Shankaracharya hills on East to Railway live on west.
International Journal of Scientific and Research Publications, Volume 4, Issue 7, July 2014 7
ISSN 2250-3153
www.ijsrp.org
B. 673.60 Village on west of railway line on north upto Banganga Nallah, on
South upto Nomain check post and on east upto Latori road.
C. 1232.00 Village Arlihansali on west upto Kotla Bajala on east upto Purana
Droor and on south upto Nilapamota and Sarli
Total 2699.60Acres
Source: Master plan – Katra 2021 A.D. Town Planning Organization, Jammu. P. 51-53.
The allocation of the area under various land uses has been made as per national level planning norms (Table 6).
Table 6: Proposed Land use 2021 (Area in Acres) – Katra
S. No. Land Use Area Percentage
1 Recreational 1100.75 40.77
2 Pilgrim facilities 64.90 2.40
3 Commercial 285.55 10.58
4 Government offices 16.10 0.60
5 a) Educational
b) Medical Hospital
37.79 1.40
6 Social and Cultural 209.97 7.78
7 Circulation
a) Bus stand parking
b) Roads
c) Parking
495.52
18.36
8 Sports area/ Youth Hostel 9.85 0.36
9 Utilities 21.7 0.80
10 Recreational 133.93 4.96
11 Green area under transmission lines 31.50 1.17
12 Green area under Slope 118.14 4.38
13 Green Belt 81.02 3.00
14 Nallahs / Water Bodies 92.88 3.44
Total 2699.60 100.00
Source: Master plan – Katra 2021 A.D. Town Planning Organization, Jammu. P. 55.
1.5 Growth of Urban System of Katra Katra was just a village about 50 years ago where the
residential structures were around a linear pedestrian bazaar. It
witnessed a very slow growth, as evident from the census records
of 1911 upto 1961 A.D. Katra town with its urban limits of 1.62
sq. kms (410.58 acres) expand tremendously and thus got
notified in 1971. Presently it is one of the fastest growing towns
of Jammu and Kashmir. A Town Planning Scheme for 410.58
acres land was prepared by Town Planning Organization Jammu
which was approved by the state Govt. vide SRO 334 dated
2.7.1980. Thereafter, it was again notified vide SRO 579 dated
13.09.1986 under the provisions of Jammu and Kashmir State
Development Act, 1971 comprising a local area spread over
1322.67 acres of land. But during this period Government of
India approved a project for bringing Katra Town on the railway
map connecting Katra with rest of country by rail. As such the
Railway Department acquired 2000 Kanals of land in Katra in
village Kundrorian, Arli, Hansali and Sarli. It was then felt that
the town is likely to grow towards its South side and as such
1272.33 acres of land area was added to the previous local area
and a new local area with a total area of 2595 acres was
constituted vide SRO 64 dated 7.2.2002.
Presently, the town of Katra (within its NAC of 1971)
consists of Chinta Mani Mohalla, Upper Bazar Mohalla, Bhimmi
Mohalla, Keshar Nagar, Tootwala Mohalla, Tea Garden Housing
Colony and Kalka Nagar.Villages of Kundorian, Kotli Bajala,
Purana Daroor, Nilay Pamote & Sarli Hansoli now form a part of
the local area notified vide SRO 64 dated 07.02.2002.
1.6 Temporal variation in registered labourers in katra. In terms of the registered labourers, Muslims dominate the
working class at Katra by providing more than 75 percent of
labour force throughout the study period (Table 7). In the year
2001-02 highest percentage 80.02 percent of registered labourers
were Muslims which decreased in the subsequent years and stand
at 79 percent in 2008-09. From 2001-02 onward upto 2008-09,
highest percentage of 82.61 percent of labourer recorded in the
year of 2006-07. Similarly the percentage of Hindu labourers
ranged between 17.6 percent 2006-07 to 24.01percent in 2003-
04. The variation in registration of labourers belonging to Hindu
and Muslim communities has been associated with economic
backwardness and social unemployment of each community.
International Journal of Scientific and Research Publications, Volume 4, Issue 7, July 2014 8
ISSN 2250-3153
www.ijsrp.org
Table 7: Temporal variations in registered labourers (percentage) – Katra
S. No Year Hindu Muslim
1. 2001-02 19.98 80.02
2 2002-03 21.98 78.01
3 2003-04 24.01 75.99
4 2004-05 23.00 77.00
5 2005-06 21.03 78.97
6 2006-07 17.39 82.61
7 2007-08 22.98 77.02
8 2008-09 21.00 79.00
Source: Municipal Office, Katra
1.7 Type of establishment and workers- Katra
Among all the tourist establishment hotel industry along with
shops and allied enterprise constitutes 35.99 of the total
establishment in 1990-91. Guest house and Dharamshalas along
with transport captures 12 percent of total establishment in the
same year. However Government employees and palanquin
carrier registered only 2.4 percent and 1.6 percent respectively in
1990-91 (Table 10). In the year 2005 the number of each
segment have been fluctuating but hotel, industry and shop again
occupied the highest position though with minor decrease.
However the pony attendant and pithu attendant captures 9.4
percent and 8.4 percent establishment in 2005. Palanquin carrier
Government employees are the only sector which have recorded
an increase and stand at 1.6 percent and 2.6 percent in 2005 and
2006 respectively.
Table 8: Type of establishment and workers at Mata Vaishno Devi shrine (Katra)
S. No. Nature of establishment 1990-91 2005-06
1. a. Hotel industry 35.99 28.14
b. Guest House and Dharmshallas 12.00 10.05
c. Shops and allied establishment 35.99 30.15
d. Transport 12.00 9.38
2. Pony Attendant N.A. 9.49
3. Pithu attendant (Porter) N.A. 8.44
4. Government Employees 2.40 2.68
5. Palanquin Carrier 1.62 1.67
Total 100 100
Source: Municipal Office, Katra.
1.8 Distribution of labourers by destinations and community
wise The labourer force serving at Shri Mata Vaishno Devi
belongs to both Muslim and Hindu community which as per the
number of labourer share a ratio of 80:20 (Table 9). Perusal of
the table further reveals that among the pony walas hundred
percent Muslims are from Poonch district followed by 90.5
percent from Udhampur district and 80 percent from Rajouri
district. Similarly the Hindu pony wala recorded the highest
percentage from Ramban which is to the tune of 41.18 percent
very closely followed by 28.57 percent from Doda district.
However the pithuwala registered the interesting pattern where in
100 percent services are provided by Hindus from Samba district
and 60 percent from Kathua district, 37.17 percent from Ramban
district, 35.48 percent from Doda district and 33.33 percent from
Jammu district. However the Muslims from Rajouri district
constitute 91.55 percent, Poonch district 88.79 percent,
Udhampur district 81.83 percent and Jammu district manage to
provide the service of 66.67 percent pithu wala. The variation in
the percentage of services provided by both the communities
clearly indicates the socio-economic and politio-cultural
harmony between the communities.
Table 9: Percentage distribution of labourers by destinations (percentage) – Katra
S .No Destinations Pony Wala Pithu Walas
Hindu Muslim Hindu Muslim
1. Doda 28.57 71.43 35.48 64.52
2. Ramban 41.18 58.82 37.17 62.83
3. Rajouri 20.00 80.00 8.45 91.55
4. Reasi 26.72 73.28 30.59 69.41
5. Udhampur 9.46 90.54 18.17 81.83
6. Poonch - 100 11.21 88.79
International Journal of Scientific and Research Publications, Volume 4, Issue 7, July 2014 9
ISSN 2250-3153
www.ijsrp.org
7. Jammu - - 33.33 66.67
8. Kathua - - 60.00 40.00
9. Samba - - 100.00 -
Total 20.00 80.00 19.99 80.01
Source: Municipal Office, Katra
1.9 Distribution of Respondent by Occupation Different sectors of tourist industry work in union to enhance
the revenue generated by pilgrimage tourism. Table 10 provides
a detail of the varied establishments which boast of tourism and
generate employment henceforth. Perusal of the table clearly
indicates that of all the establishments; Tour and travel agencies
(Rs 48236.6/person/month) earn much more than any business
center followed by Palanquin wala (Rs 14831.7/person/month),
Professional photo-graphers (Rs 14547.1/person/month), Hotels
and Restaurants (Rs 11691.0/person/ month), Poney wala (Rs
10645.8/person/month), Pithu wala (Rs 6995.8/person/ month)
and Tea stalls and other allied business activities (Rs
2485.0/person/ month).
Table 10: Percentage distribution of Respondent by Occupation – Katra
S.
N
o.
Nature of
Establishment
No. of
Establishment
No. of
Worker
Income/
unit/day
(Rs)
Total income
of all units
/year (lacs)
Income/
person/
month
(RS)
1 Tea stall and other
allied business
activities
37.0 70.0 1545.7 208.74 2485.0
2 Tours and Travel 14.0 29.0 3285.0 167.86 48236.6
3 Poney Owner 25.0 25.0 350.0 31.93 10645.8
4 Pithu (porter Service) 20.0 20.0 230.0 16.79 6995.8
5 Palanquin Service 16.0 84.0 2560.0 149.50 14831.7
6 Professional
Photographer
4.0 23.0 2750.0 40.15 14547.1
7 Hotels and
Restaurants
28.0 440.0 6040.0 617.28 11691.0
Total 144.0 691.0 16760.7 1232.25 109433.0
Source: Primary survey – 2005
1.10 Classification of tourist establishment by infrastructure
and income Classification of tourist establishments has been done on the
basis of infrastructure and rate of accommodation. Perusal of
table 11 reveals that the hotels and restaurants providing
accommodation at the rate of Rs 2000-Rs 3000 earned
maximum revenue to the tune of Rs 4.75 lacs per month followed
by the hotels (Rs 3.25 lacs/month) providing rooms at the rate of
Rs >3000 , Rs 1000-2000 and 500-1000 per day. The total
revenue generated by all the hotels and restaurants stands to the
tune of Rs 11.61 lacs per month. From the table 11 it is clear that
most of the pilgrims have sound financial background.
Table 11: Classification of tourist establishment by infrastructure and income – Katra
S. No. Room
Rent
No. of Hotel and
Restaurant
Nature of
Accommodation
No. of
Rooms
Total Income/
Month (Lacs)
1 <500 14.0 Hotel 200.0 0.86
2 500-
1000
12.0 Hotel 125.0 1.25
3 1000-
2000
15.0 Hotel and restaurant 182.0 1.50
4 2000-
3000
13.0 Hotel and restaurant 185.0 4.75
5 >3000 15.0 Hotel and restaurant 75.0 3.25
Total 69 767 11.61
Source: Association of Hotels, Restaurants & Travel Agents Katra (Mata Vaishno Devi)
International Journal of Scientific and Research Publications, Volume 4, Issue 7, July 2014 10
ISSN 2250-3153
www.ijsrp.org
III. ECONOMIC IMPACT OF PILGRIMAGE TOURISM – KATRA
The expenses incurred by the tourists are an important aspect
to study the economic impacts on a tourist resort. The structure
of tourist expenditure is crucial and of economic importance,
since there is an expenditure and national income, tourist
expenditure and employment, tourist expenditure and tax
revenue. Katra, the base camp for the pilgrimage tourism of Mata
Vaishno Devi, is experiencing the impact of heavy inflow of
pilgrims which besides generating employment and revenue also
add to the market value of the goods and services offered by the
residents or stakeholders of the pilgrimage tourism. For better
analysis and understanding of the economy of the area, some
aspects viz growth in the number of pilgrims, other activities
related with tourism services, estimated expenditure per pilgrim
in Katra, income effect, multiplier effect, employment effects
and residents perception are assessed.
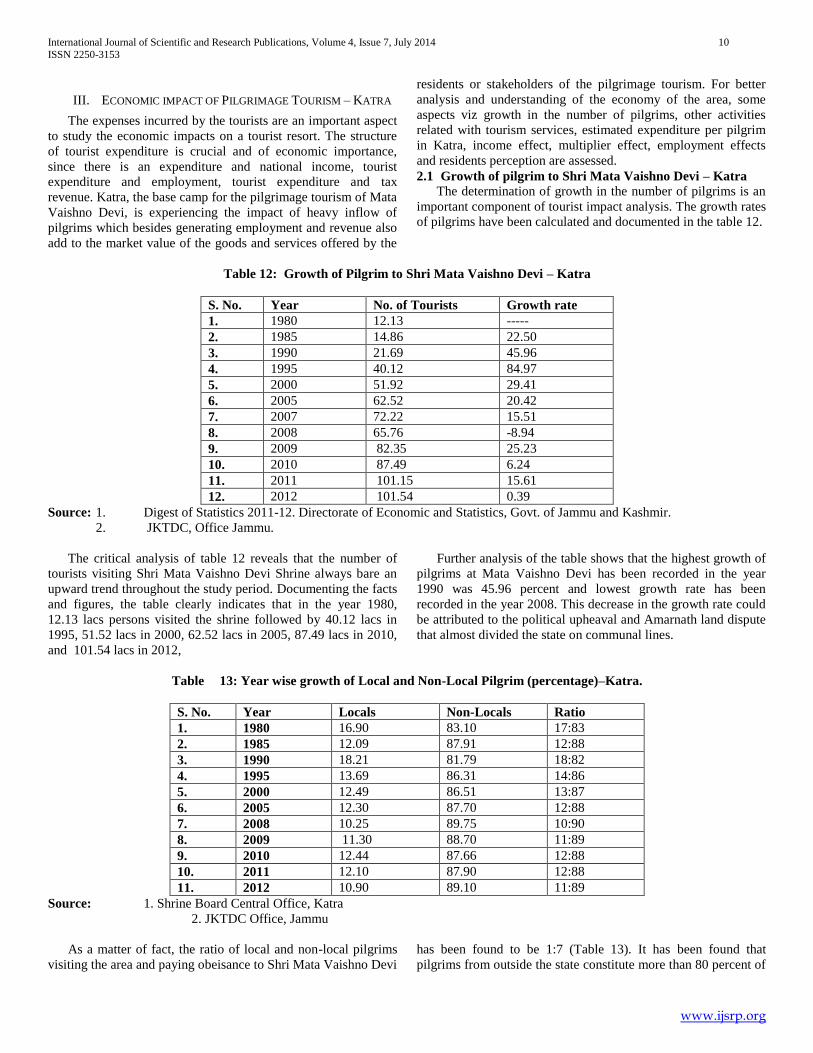
2.1 Growth of pilgrim to Shri Mata Vaishno Devi – Katra
The determination of growth in the number of pilgrims is an
important component of tourist impact analysis. The growth rates
of pilgrims have been calculated and documented in the table 12.
Table 12: Growth of Pilgrim to Shri Mata Vaishno Devi – Katra
S. No. Year No. of Tourists Growth rate
1. 1980 12.13 -----
2. 1985 14.86 22.50
3. 1990 21.69 45.96
4. 1995 40.12 84.97
5. 2000 51.92 29.41
6. 2005 62.52 20.42
7. 2007 72.22 15.51
8. 2008 65.76 -8.94
9. 2009 82.35 25.23
10. 2010 87.49 6.24
11. 2011 101.15 15.61
12. 2012 101.54 0.39
Source: 1. Digest of Statistics 2011-12. Directorate of Economic and Statistics, Govt. of Jammu and Kashmir.
2. JKTDC, Office Jammu.
The critical analysis of table 12 reveals that the number of
tourists visiting Shri Mata Vaishno Devi Shrine always bare an
upward trend throughout the study period. Documenting the facts
and figures, the table clearly indicates that in the year 1980,
12.13 lacs persons visited the shrine followed by 40.12 lacs in
1995, 51.52 lacs in 2000, 62.52 lacs in 2005, 87.49 lacs in 2010,
and 101.54 lacs in 2012,
Further analysis of the table shows that the highest growth of
pilgrims at Mata Vaishno Devi has been recorded in the year
1990 was 45.96 percent and lowest growth rate has been
recorded in the year 2008. This decrease in the growth rate could
be attributed to the political upheaval and Amarnath land dispute
that almost divided the state on communal lines.
Table 13: Year wise growth of Local and Non-Local Pilgrim (percentage)–Katra.
S. No. Year Locals Non-Locals Ratio
1. 1980 16.90 83.10 17:83
2. 1985 12.09 87.91 12:88
3. 1990 18.21 81.79 18:82
4. 1995 13.69 86.31 14:86
5. 2000 12.49 86.51 13:87
6. 2005 12.30 87.70 12:88
7. 2008 10.25 89.75 10:90
8. 2009 11.30 88.70 11:89
9. 2010 12.44 87.66 12:88
10. 2011 12.10 87.90 12:88
11. 2012 10.90 89.10 11:89
Source: 1. Shrine Board Central Office, Katra
2. JKTDC Office, Jammu
As a matter of fact, the ratio of local and non-local pilgrims
visiting the area and paying obeisance to Shri Mata Vaishno Devi
has been found to be 1:7 (Table 13). It has been found that
pilgrims from outside the state constitute more than 80 percent of
International Journal of Scientific and Research Publications, Volume 4, Issue 7, July 2014 11
ISSN 2250-3153
www.ijsrp.org
total pilgrims which range between 81.7 percent in 1990 to 89.10
percent in 2012. Similarly the local pilgrims range between 10.90
percent in 2012 to 18.2 percent in 1990. The higher percentage of
non-local is a healthy indicative of economic development of the
region.
Table 14: Proportion of Pilgrims from different states of India – Katra
S. No Destinations M F Total
1. Uttar Pradesh 8.40 16.99 14.27
2. Delhi 6.30 14.64 12.00
3. Maharashtra 12.61 7.81 9.33
4. Jammu &Kashmir 7.15 3.91 4.93
5. Karanataka 7.15 4.49 5.33
6. Punjab 8.40 6.05 6.80
7. Madhya Pradesh 5.88 8.98 8.00
8. West Bengal 4.20 4.69 4.53
9. Bihar 14.28 9.77 11.20
10. Rajasthan 3.36 3.91 3.73
11. Andhra Pradesh 2.10 1.76 1.87
12. Haryana 1.68 1.76 1.73
13. Gujarat 2.10 2.34 2.27
14. Assam 0.84 0.98 0.93
15. Manipur 0.84 0.59 0.67
16. Sikkim 0.42 0.39 0.40
17. Orissa 0.84 0.39 0.54
18. Tamil Nadu 0.84 0.78 0.80
19. Goa 1.26 0.39 0.67
20. Chattisgarh 7.15 6.45 6.67
21. Uttranchal 4.20 2.93 3.33
Total 100 100 100
Source : Primary survey – 2005-08
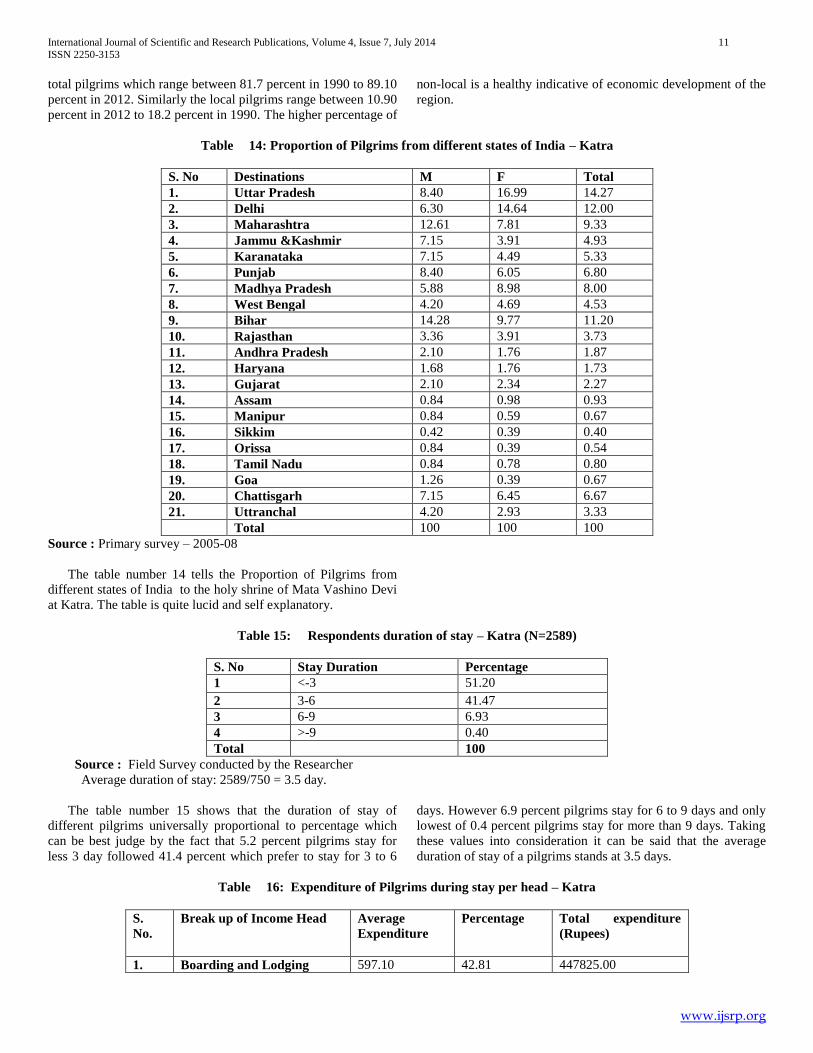
The table number 14 tells the Proportion of Pilgrims from
different states of India to the holy shrine of Mata Vashino Devi
at Katra. The table is quite lucid and self explanatory.
Table 15: Respondents duration of stay – Katra (N=2589)
S. No Stay Duration Percentage
1 <-3 51.20
2 3-6 41.47
3 6-9 6.93
4 >-9 0.40
Total 100
Source : Field Survey conducted by the Researcher
Average duration of stay: 2589/750 = 3.5 day.
The table number 15 shows that the duration of stay of
different pilgrims universally proportional to percentage which
can be best judge by the fact that 5.2 percent pilgrims stay for
less 3 day followed 41.4 percent which prefer to stay for 3 to 6
days. However 6.9 percent pilgrims stay for 6 to 9 days and only
lowest of 0.4 percent pilgrims stay for more than 9 days. Taking
these values into consideration it can be said that the average
duration of stay of a pilgrims stands at 3.5 days.
Table 16: Expenditure of Pilgrims during stay per head – Katra
S.
No.
Break up of Income Head Average
Expenditure
Percentage Total expenditure
(Rupees)
1. Boarding and Lodging 597.10 42.81 447825.00
International Journal of Scientific and Research Publications, Volume 4, Issue 7, July 2014 12
ISSN 2250-3153
www.ijsrp.org
2 Internal Transport 116.50 8.35 87375.00
3 Offering 205.25 14.71 153937.50
4 Shopping 385.50 27.63 289125.00
5 Miscellaneous 90.75 6.50 68062.50
Total 1395.10 100 1046325.00
Source: Primary survey – 2005-08
Average duration of Stay = 3.5 days
Therefore the per day expenditure of a Pilgrim as 1395.10/3.5 = Rs.398.60
The relevant data on the expenditure pattern of tourist, based
on the field survey is presented in Table 16. It is observed from
this table that per head per day expenditure of a pilgrim at Katra
is Rs. 398.60. Taking a grand figure 679223 of tourist who
visited the holy Shrine Mata Vaishno Devi in 2008, tourist
expenditure is around Rs. 947.58 crore.
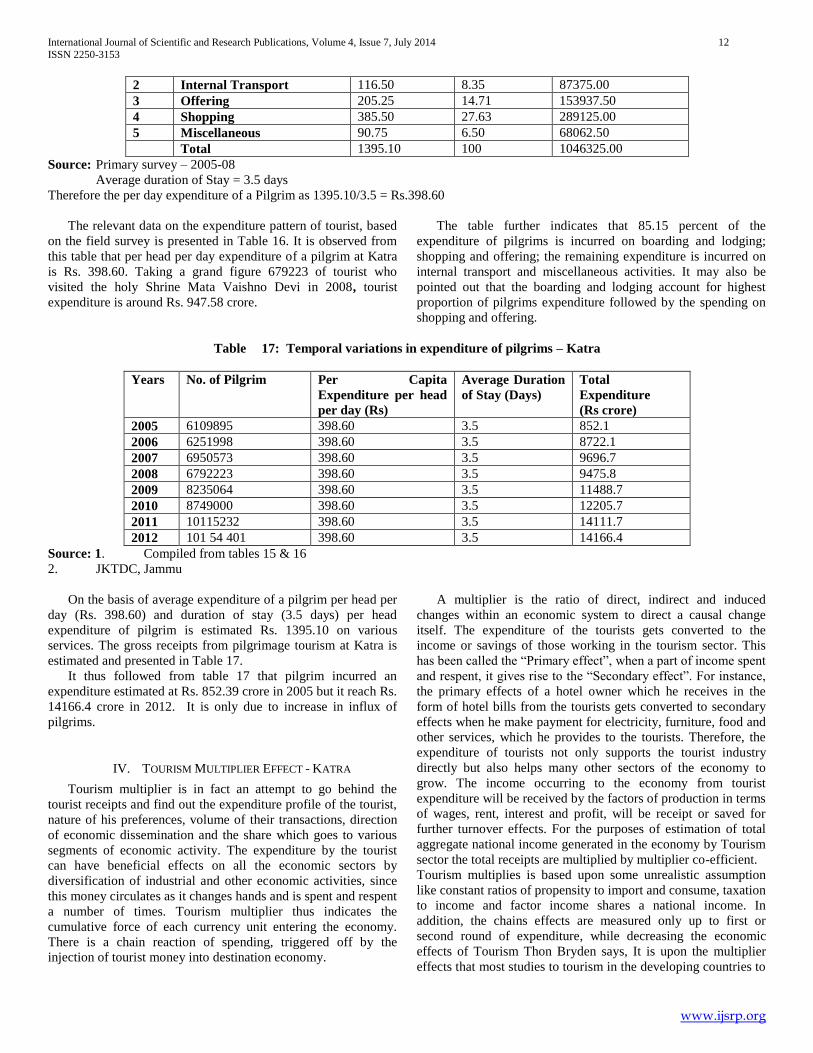
The table further indicates that 85.15 percent of the
expenditure of pilgrims is incurred on boarding and lodging;
shopping and offering; the remaining expenditure is incurred on
internal transport and miscellaneous activities. It may also be
pointed out that the boarding and lodging account for highest
proportion of pilgrims expenditure followed by the spending on
shopping and offering.
Table 17: Temporal variations in expenditure of pilgrims – Katra
Years No. of Pilgrim Per Capita
Expenditure per head
per day (Rs)
Average Duration
of Stay (Days)
Total
Expenditure
(Rs crore)
2005 6109895 398.60 3.5 852.1
2006 6251998 398.60 3.5 8722.1
2007 6950573 398.60 3.5 9696.7
2008 6792223 398.60 3.5 9475.8
2009 8235064 398.60 3.5 11488.7
2010 8749000 398.60 3.5 12205.7
2011 10115232 398.60 3.5 14111.7
2012 101 54 401 398.60 3.5 14166.4
Source: 1. Compiled from tables 15 & 16
2. JKTDC, Jammu
On the basis of average expenditure of a pilgrim per head per
day (Rs. 398.60) and duration of stay (3.5 days) per head
expenditure of pilgrim is estimated Rs. 1395.10 on various
services. The gross receipts from pilgrimage tourism at Katra is
estimated and presented in Table 17.
It thus followed from table 17 that pilgrim incurred an
expenditure estimated at Rs. 852.39 crore in 2005 but it reach Rs.
14166.4 crore in 2012. It is only due to increase in influx of
pilgrims.
IV. TOURISM MULTIPLIER EFFECT - KATRA
Tourism multiplier is in fact an attempt to go behind the
tourist receipts and find out the expenditure profile of the tourist,
nature of his preferences, volume of their transactions, direction
of economic dissemination and the share which goes to various
segments of economic activity. The expenditure by the tourist
can have beneficial effects on all the economic sectors by
diversification of industrial and other economic activities, since
this money circulates as it changes hands and is spent and respent
a number of times. Tourism multiplier thus indicates the
cumulative force of each currency unit entering the economy.
There is a chain reaction of spending, triggered off by the
injection of tourist money into destination economy.
A multiplier is the ratio of direct, indirect and induced
changes within an economic system to direct a causal change
itself. The expenditure of the tourists gets converted to the
income or savings of those working in the tourism sector. This
has been called the “Primary effect”, when a part of income spent
and respent, it gives rise to the “Secondary effect”. For instance,
the primary effects of a hotel owner which he receives in the
form of hotel bills from the tourists gets converted to secondary
effects when he make payment for electricity, furniture, food and
other services, which he provides to the tourists. Therefore, the
expenditure of tourists not only supports the tourist industry
directly but also helps many other sectors of the economy to
grow. The income occurring to the economy from tourist
expenditure will be received by the factors of production in terms
of wages, rent, interest and profit, will be receipt or saved for
further turnover effects. For the purposes of estimation of total
aggregate national income generated in the economy by Tourism
sector the total receipts are multiplied by multiplier co-efficient.
Tourism multiplies is based upon some unrealistic assumption
like constant ratios of propensity to import and consume, taxation
to income and factor income shares a national income. In
addition, the chains effects are measured only up to first or
second round of expenditure, while decreasing the economic
effects of Tourism Thon Bryden says, It is upon the multiplier
effects that most studies to tourism in the developing countries to
International Journal of Scientific and Research Publications, Volume 4, Issue 7, July 2014 13
ISSN 2250-3153
www.ijsrp.org
date have concentrated”. Peter (1969), Checchi (1961), Zinder
Report (1969) and Tripartrite Survey (1969) being the examples.
An exception is Mitchell’s work in East Africa, 1969 wherein he
calculates only the first round expenditure effects.
In India an attempt has been made for the first time by
NCAER (National Council of Applied Economic Research) in
1969 to calculate the economic benefit of tourism through
multiplier analysis. In their Techno-Economic Survey of Jammu
and Kashmir State, a tourism multiplier coefficient of 3.2 has
been assumed for the state. In fact Techno Economic Survey did
not yielded significantly unexpected results as some of the goods
and services on which the tourists spend have to be imported
from outside the state and consequently leakages in economic
output reduce the total revenue generation.
The tourism department of Jammu and Kashmir in
formulating its 5th
plan proposals for development of tourism has
assumed a multiplier coefficient of 3.5. The NCAER proceeds
with two alternative assumptions about the multiplier coefficient
of 3.2 and 3.6. The NCAER observed that the contribution of
tourism to overall Indian economy could be calculated with the
same multiplier coefficient which was suggested for Jammu and
Kashmir and reported that for the purpose of estimating the total
aggregate national income generated in the economy due to
foreign tourism in India, it will be in the range with a low of 3.2
and high 3.6 multiplier coefficient times the initially injected
direct income derived from foreign tourist expenditure.”.
In the light of these observations an attempt has been made to
estimate the multiplier effect of tourism activity in the
destination (Katra).
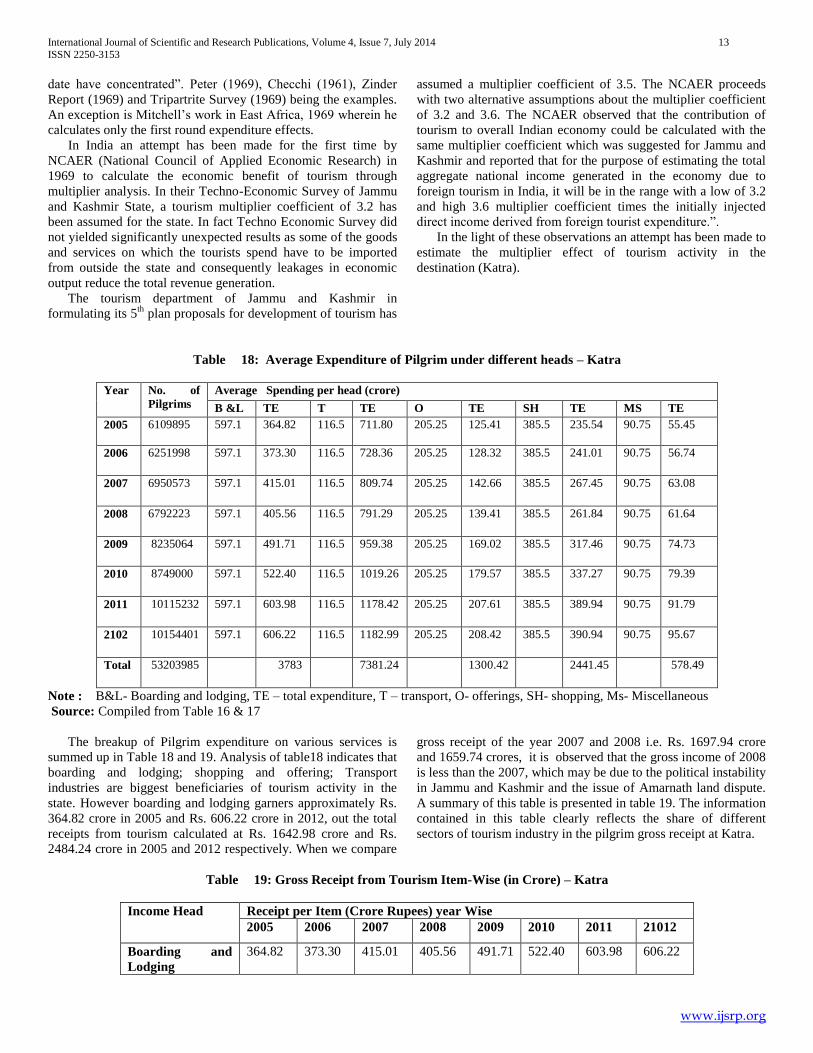
Table 18: Average Expenditure of Pilgrim under different heads – Katra
Year No. of
Pilgrims
Average Spending per head (crore)
B &L TE T TE O TE SH TE MS TE
2005 6109895 597.1 364.82 116.5 711.80 205.25 125.41 385.5 235.54 90.75 55.45
2006 6251998 597.1 373.30 116.5 728.36 205.25 128.32 385.5 241.01 90.75 56.74
2007 6950573 597.1 415.01 116.5 809.74 205.25 142.66 385.5 267.45 90.75 63.08
2008 6792223 597.1 405.56 116.5 791.29 205.25 139.41 385.5 261.84 90.75 61.64
2009 8235064 597.1 491.71 116.5 959.38 205.25 169.02 385.5 317.46 90.75 74.73
2010 8749000 597.1 522.40 116.5 1019.26 205.25 179.57 385.5 337.27 90.75 79.39
2011 10115232 597.1 603.98 116.5 1178.42 205.25 207.61 385.5 389.94 90.75 91.79
2102 10154401 597.1 606.22 116.5 1182.99 205.25 208.42 385.5 390.94 90.75 95.67
Total 53203985 3783 7381.24 1300.42 2441.45 578.49
Note : B&L- Boarding and lodging, TE – total expenditure, T – transport, O- offerings, SH- shopping, Ms- Miscellaneous
Source: Compiled from Table 16 & 17
The breakup of Pilgrim expenditure on various services is
summed up in Table 18 and 19. Analysis of table18 indicates that
boarding and lodging; shopping and offering; Transport
industries are biggest beneficiaries of tourism activity in the
state. However boarding and lodging garners approximately Rs.
364.82 crore in 2005 and Rs. 606.22 crore in 2012, out the total
receipts from tourism calculated at Rs. 1642.98 crore and Rs.
2484.24 crore in 2005 and 2012 respectively. When we compare
gross receipt of the year 2007 and 2008 i.e. Rs. 1697.94 crore
and 1659.74 crores, it is observed that the gross income of 2008
is less than the 2007, which may be due to the political instability
in Jammu and Kashmir and the issue of Amarnath land dispute.
A summary of this table is presented in table 19. The information
contained in this table clearly reflects the share of different
sectors of tourism industry in the pilgrim gross receipt at Katra.
Table 19: Gross Receipt from Tourism Item-Wise (in Crore) – Katra
Income Head Receipt per Item (Crore Rupees) year Wise
2005 2006 2007 2008 2009 2010 2011 21012
Boarding and
Lodging
364.82 373.30 415.01 405.56 491.71 522.40 603.98 606.22
International Journal of Scientific and Research Publications, Volume 4, Issue 7, July 2014 14
ISSN 2250-3153
www.ijsrp.org
Transportation 711.80 728.36 809.74 791.29 959.38 1019.26 1178.42 1182.99
Offering 125.41 128.32 142.66 139.41 169.02 179.57 207.61 208.42
Shopping 385.50 241.01 267.45 261.84 317.46 337.27 389.94 390.94
Miscellaneous 55.45 56.74 63.08 61.64 74.73 79.39 91.79 95.67
Total 1642.98 1527.73 1697.94 1659.74 2012.3 2137.89 2471.74 2484.24
Source: Compiled from tables 18
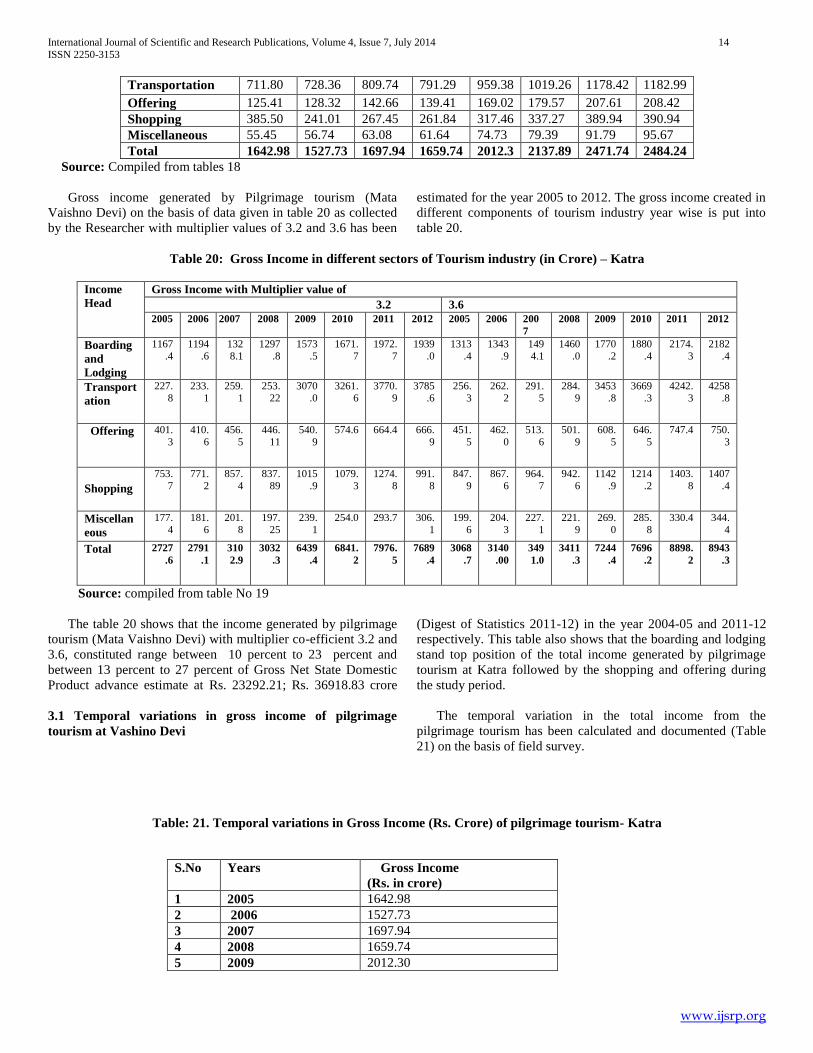
Gross income generated by Pilgrimage tourism (Mata
Vaishno Devi) on the basis of data given in table 20 as collected
by the Researcher with multiplier values of 3.2 and 3.6 has been
estimated for the year 2005 to 2012. The gross income created in
different components of tourism industry year wise is put into
table 20.
Table 20: Gross Income in different sectors of Tourism industry (in Crore) – Katra
Income
Head
Gross Income with Multiplier value of
3.2 3.6
2005 2006 2007 2008 2009 2010 2011 2012 2005 2006 200
7
2008 2009 2010 2011 2012
Boarding
and
Lodging
1167.4
1194.6
1328.1
1297.8
1573.5
1671.7
1972.7
1939.0
1313.4
1343.9
1494.1
1460.0
1770.2
1880.4
2174.3
2182.4
Transport
ation
227.8
233.1
259.1
253.22
3070.0
3261.6
3770.9
3785.6
256.3
262.2
291.5
284.9
3453.8
3669.3
4242.3
4258.8
Offering 401.3
410.6
456.5
446.11
540.9
574.6 664.4 666.9
451.5
462.0
513.6
501.9
608.5
646.5
747.4 750.3
Shopping
753.7
771.2
857.4
837.89
1015.9
1079.3
1274.8
991.8
847.9
867.6
964.7
942.6
1142.9
1214.2
1403.8
1407.4
Miscellan
eous
177.4
181.6
201.8
197.25
239.1
254.0 293.7 306.1
199.6
204.3
227.1
221.9
269.0
285.8
330.4 344.4
Total 2727
.6
2791
.1
310
2.9
3032
.3
6439
.4
6841.
2
7976.
5
7689
.4
3068
.7
3140
.00
349
1.0
3411
.3
7244
.4
7696
.2
8898.
2
8943
.3
Source: compiled from table No 19
The table 20 shows that the income generated by pilgrimage
tourism (Mata Vaishno Devi) with multiplier co-efficient 3.2 and
3.6, constituted range between 10 percent to 23 percent and
between 13 percent to 27 percent of Gross Net State Domestic
Product advance estimate at Rs. 23292.21; Rs. 36918.83 crore
(Digest of Statistics 2011-12) in the year 2004-05 and 2011-12
respectively. This table also shows that the boarding and lodging
stand top position of the total income generated by pilgrimage
tourism at Katra followed by the shopping and offering during
the study period.
3.1 Temporal variations in gross income of pilgrimage
tourism at Vashino Devi
The temporal variation in the total income from the
pilgrimage tourism has been calculated and documented (Table
21) on the basis of field survey.
Table: 21. Temporal variations in Gross Income (Rs. Crore) of pilgrimage tourism- Katra
S.No Years Gross Income
(Rs. in crore)
1 2005 1642.98
2 2006 1527.73
3 2007 1697.94
4 2008 1659.74
5 2009 2012.30
International Journal of Scientific and Research Publications, Volume 4, Issue 7, July 2014 15
ISSN 2250-3153
www.ijsrp.org
Source: Compiled from tables Number: 18.
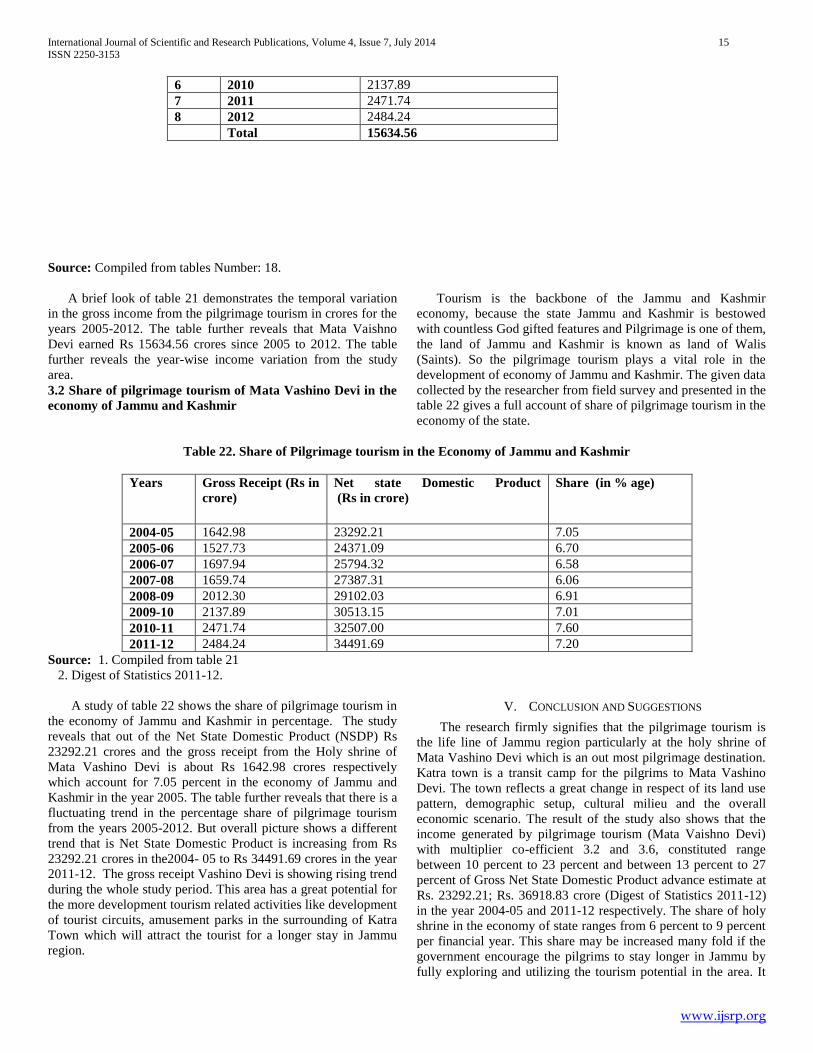
A brief look of table 21 demonstrates the temporal variation
in the gross income from the pilgrimage tourism in crores for the
years 2005-2012. The table further reveals that Mata Vaishno
Devi earned Rs 15634.56 crores since 2005 to 2012. The table
further reveals the year-wise income variation from the study
area.
3.2 Share of pilgrimage tourism of Mata Vashino Devi in the
economy of Jammu and Kashmir
Tourism is the backbone of the Jammu and Kashmir
economy, because the state Jammu and Kashmir is bestowed
with countless God gifted features and Pilgrimage is one of them,
the land of Jammu and Kashmir is known as land of Walis
(Saints). So the pilgrimage tourism plays a vital role in the
development of economy of Jammu and Kashmir. The given data
collected by the researcher from field survey and presented in the
table 22 gives a full account of share of pilgrimage tourism in the
economy of the state.
Table 22. Share of Pilgrimage tourism in the Economy of Jammu and Kashmir
Years Gross Receipt (Rs in
crore)
Net state Domestic Product
(Rs in crore)
Share (in % age)
2004-05 1642.98 23292.21 7.05
2005-06 1527.73 24371.09 6.70
2006-07 1697.94 25794.32 6.58
2007-08 1659.74 27387.31 6.06
2008-09 2012.30 29102.03 6.91
2009-10 2137.89 30513.15 7.01
2010-11 2471.74 32507.00 7.60
2011-12 2484.24 34491.69 7.20
Source: 1. Compiled from table 21
2. Digest of Statistics 2011-12.
A study of table 22 shows the share of pilgrimage tourism in
the economy of Jammu and Kashmir in percentage. The study
reveals that out of the Net State Domestic Product (NSDP) Rs
23292.21 crores and the gross receipt from the Holy shrine of
Mata Vashino Devi is about Rs 1642.98 crores respectively
which account for 7.05 percent in the economy of Jammu and
Kashmir in the year 2005. The table further reveals that there is a
fluctuating trend in the percentage share of pilgrimage tourism
from the years 2005-2012. But overall picture shows a different
trend that is Net State Domestic Product is increasing from Rs
23292.21 crores in the2004- 05 to Rs 34491.69 crores in the year
2011-12. The gross receipt Vashino Devi is showing rising trend
during the whole study period. This area has a great potential for
the more development tourism related activities like development
of tourist circuits, amusement parks in the surrounding of Katra
Town which will attract the tourist for a longer stay in Jammu
region.
V. CONCLUSION AND SUGGESTIONS
The research firmly signifies that the pilgrimage tourism is
the life line of Jammu region particularly at the holy shrine of
Mata Vashino Devi which is an out most pilgrimage destination.
Katra town is a transit camp for the pilgrims to Mata Vashino
Devi. The town reflects a great change in respect of its land use
pattern, demographic setup, cultural milieu and the overall
economic scenario. The result of the study also shows that the
income generated by pilgrimage tourism (Mata Vaishno Devi)
with multiplier co-efficient 3.2 and 3.6, constituted range
between 10 percent to 23 percent and between 13 percent to 27
percent of Gross Net State Domestic Product advance estimate at
Rs. 23292.21; Rs. 36918.83 crore (Digest of Statistics 2011-12)
in the year 2004-05 and 2011-12 respectively. The share of holy
shrine in the economy of state ranges from 6 percent to 9 percent
per financial year. This share may be increased many fold if the
government encourage the pilgrims to stay longer in Jammu by
fully exploring and utilizing the tourism potential in the area. It
6 2010 2137.89
7 2011 2471.74
8 2012 2484.24
Total 15634.56
International Journal of Scientific and Research Publications, Volume 4, Issue 7, July 2014 16
ISSN 2250-3153
www.ijsrp.org
can be achieved by developing alternative religious tourist
circuits like Shiv Khori- Machail; Kailash Parvat in Bhaderwah
and Pingla Devi in Ramnagar; Agar Jatu, Sarthal Baba. Also
some extra recreational activities like to start the Cable Car
facility, development of parks, improving the condition of the
roads, regular state transport buses, better helicopter services and
budget hotel would be useful interventions.
REFERENCES
[1] Ahlawat, P. and Kundu, S.C. (2006): “Challenges of Tourism Industry: Facing through information Technology.” International Tourism issues and Challenges: (ed. Bhardwaj D.S., Choudhary, M., Boora, S.S. Kamra, K.K., Kumar, R.B., Chand, M., and Taxak. R.H., Kanishka Publishers, Distributors, New Delhi. PP. 164-173.
[2] Aima, A., Gupta, D.R. and Sharma, S. (2006): “Sustainable Tourism: A case study.” International Tourism issues and Challenges: (ed. Bhardwaj D.S., Choudhary, M., Boora, S.S. Kamra, K.K., Kumar, R.B., Chand, M., and Taxak. R.H. Kanishka Publishers, Distributors, New Delhi.PP. 210-213.
[3] Badan, B.S. and Bhatt, H. (2007): “Regional Tourism.” Commonwealth Publishers, New Delhi. PP. 28-29.
[4] Bates, C.E. (2005): “A Gazetteer of Kashmir.” Gulshan Publications, Srinagar. PP. 121.
[5] Bansal, S.P. (2004): Socio-Cultural and Economic Impacts of Tourism on Himalayan
[6] Tourist Destinations of J&K and Himanchal Pradesh, Journal of Tourism, VI (1&2):81-84.
[7] Bandhu, D. (1983): “Income and employment effect of tourism. A case study of J&K state.” The Journal of Tourism Studies. PP 121
[8] Bharadwaj S.M. (1973): “Hindu place of Pilgrimage in India.” Thompson press Ltd., New Delhi. PP. 203-212
[9] Chand, R. (2002): “Geographical prospects of Tourism Industry in Himachal Pradesh and its Impact on Environment: An overview.” The Geographer Vol. 48(1) PP. 74-80.
[10] Chattopadhyay, K. (1995):Economic Impacts of tourism-An Indian Experience, Kanishka, New Delhi.
[11] Chaturvadi, Pt. J.P., Ram Pt. Veni Ram Sharma and Kaushik Pt. R.S. (2007): “The complete story of Mata Vaishno Devi.” Pustak Sansaar, 167, Exhibition Ground, Jammu
[12] Chauhan, V. and Khanna, S. (2006): “Terrorism and Tourism in J&K: An Empirical study.” International Tourism issues and Challenges: (ed. Bhardwaj D.S., Choudhary, M., Boora, S.S. Kamra, K.K., Kumar, R.B., Chand, M., and Taxak. R.H. Kanishka Publishers, Distributors, New Delhi. PP. 97-310.
[13] Dept. of Tourism J&K (2002): Annual Report of Dept. of Tourism, Jammu and Kashmir, Srinagar.
[14] Digest of Statistics (2011-12): “Directorate of Economics and Statistics, Government of Jammu and Kashmir.” PP 596-597
[15] Greenwood, D.J. (1972): Tourism as an Agent of Change: A Spanish Basque Case, Ethnology, 11(1): 80-91.
[16] Goswami, A. (2001): “Vaishno Devi, The Shrine.” published by Ved Pushpa, Gandhinagar (J&K). PP. 25-34.
[17] Gupta, B. (2006): “Safety and Security perception of pilgrims visiting Jammu.” International Tourism issues and Challenges: (ed. Bhardwaj D.S., Choudhary, M., Boora, S.S. Kamra, K.K., Kumar, R.B., Chand, M., and Taxak. R.H. Kanishka Publishers, Distributors, New Delhi. PP. 360.
[18] Gupta, S. and Bansal, S.P. (1998): “Impacts of Tourism on Hilly Environment- Problems and Prospects”, Tourism towards 21st Century, Deep and Deep Publication, New Delhi.
[19] Gupta, R. (2004): “Impact of Tourism in changing cultural landscape of Katra with special reference to Mata Vaishno Devi Shrine.” University of Jammu. PP. 19.
[20] Gupta, S.K. (2002):Tourism and Heritage Resources In Garhwal Himalaya, Kaveri Books, New Delhi.
[21] Hussain, M. (2000): “Systematic Geography of J&K.” Rawat Publications, New Delhi.
[22] Incirlioglu, E.O. and Culcuoglu, G. (2004): “Complexity of Socio-Spatial Transformations through Tourism: A Mediterranean village, Kalekoy.” Journal of Tourism and Cultural Change. Vol. 2. (1), PP. 24-45.
[23] Master plan of Katra (2021). “Town Planning Organization.” Jammu PP. 4.
[24] Mawa, S. (2004): “Pilgrimage Tourism Marketing Strategy with special reference to Shri Mata Vaishno Devi Shrine.” Kaveri Books – New Delhi. PP. 4, 23
[25] Nabi, G. (2000): Socio-economic Impacts of Tourism, Pointer Publishers, Jaipur. NCAER, (1975): Cost Benefit Study of Tourism, N.Delhi.
[26] Parashad. Pt. J. (2007): “The complete story of Mata Vaishno Devi.” Pustak Sansar, Jammu PP. 30-32.
[27] Pillai, R.N. (1985): “Tour and Pilgrimage in India.” Gitanjali Publishing House, New Delhi. PP. 29-41
[28] Qazi, S. (2005): “Systematic geography of Jammu and Kashmir”. APH Publications, New Delhi.
[29] Shafi, M. (1994): “Tourism dynamics in a developing Economy.” Gulshan Publishers, Srinagar. PP 45-49
[30] Shafi, M. (1994): “Tourism Dynamic a developing Economy.” Gulshan Publishers, Srinagar. PP. 47-48. 95
[31] Singh, J. (2004): “The Economy of Jammu and Kashmir.” Radha Krishan Anand and Co., Jammu. PP. 223.
[32] Singh, S. (1994): “Cultural Tourism and Heritage Management.” Rawat Publications, Jaipur, India. PP. 15.
[33] Singh, T.V. (1996): The problem of developing sustainable tourism in Himalayas: The case study of Kullu Valley in Himachal Pradesh. In Shalini Singh (ed.). Profiles of Indian Tourism, APH Publication, Delhi, pp.76-86.
[34] Tourism Deptt. of J&K. (2007): “A Tourist Director”.
AUTHORS
First Author – Dr Mohammad Ashfaq, Department of
Geography University of Jammu, Email:
Second Author – Mrs Shazia Parveen, Department of
Geography University of Jammu