Embed Size (px)
Citation preview

Journal of Agricultural Science; Vol. 12, No. 4; 2020 ISSN 1916-9752 E-ISSN 1916-9760
Published by Canadian Center of Science and Education
26
Socio-economic Impact of Chinese Agribusiness Entrepreneurs in Russian Far East on Local Farmers
Fujin Yi1,2, Richard T. Gudaj2, Valeria Arefieva3, Renata Yanbykh3, Svetlana Mishchuk4, Tatiana A. Potenko5, Jiayi Zhou6, Ivan Zuenko7 & Diana Kenina8
1 China Center for Food Security Studies, Nanjing Agricultural University, Nanjing, China 2 College of Economics and Management, Nanjing Agricultural University, Nanjing, China 3 Institute for Agrarian Studies, National Research University Higher School of Economics, Moscow, Russia 4 Institute for Complex Analysis of Regional Problems, Far Eastern Branch, Russian Academy of Sciences, Birobidzhan, Russia 5 Department of Economics and Organization of Agri-industrial Complex, Federal Research Center of Agricultural Biotechnology of the Far East named after A.K.Chaiki, Ussuriysk, Russia 6 Stockholm International Peace Research Institute, Solna, Sweden 7 Chinese Studies Department, Institute of History, Archaeology and Ethnography of the Peoples of Far East, Far Eastern Branch, Russian Academy of Sciences, Vladivostok, Russia 8 Department of Management and Management Technologies, Stavropol State Agrarian University, Stavropol, Russia
Correspondence: Fujin Yi, College of Economics and Management, Nanjing Agricultural University, No. 1 Weigang, Nanjing 210095, China. Tel: 86-25-8439-9060. E-mail: [email protected]
Received: January 16, 2020 Accepted: February 17, 2020 Online Published: March 15, 2020
doi:10.5539/jas.v12n4p26 URL: https://doi.org/10.5539/jas.v12n4p26
This research is self-funded and partially financed by the College of Economics and Management, Nanjing Agricultural University, China.
Abstract
Since the liberalization of the Sino-Soviet border in 1990’s, Chinese farmers have been actively engaged in the economy of Russian Far East. Literature suggests that Chinese workers fill a labour shortage, contribute positively to local food security, with negative impacts being more socially normative and political, than economic. So far no economic empirical research exists about Chinese farmers’ presence in Russian Far East. On the basis of a panel data, an econometric model was used to analyse socio-economic impact of Chinese agribusiness entrepreneurs in Russian Far East on local households. Regression models show that presence of Chinese farmers in Russian Far East increases the probability of higher well-being, farm income, food costs and share of Chinese food purchased among Russian Far East households. These results suggest that benefits of cooperation with Chinese farmers and retailers should not be ignored when designing policies towards sustainable development of rural areas in Russian Far East. Possible environmental, social and economic externalities of further soybean production in Russian Far East are also discussed.
Keywords: farm income, economic well-being, food spending, Chinese migrant workers, Russian Far East
1. Introduction
1.1 Introduce the Problem
Chinese companies are increasing their investments in foreign agricultural and food assets. Their broad aims are to gain profits for Chinese investors while achieving national food security and projecting China’s influence abroad (Jiang et al., 2018). China’s agricultural foreign direct investment (FDI) is concentrated in developed countries such as Singapore, New Zealand, the United States, Australia (Raymond et al., 2018) and Asian developing countries, one of these places is Russian Far East (RFE) (Buckley, 2019).

jas.ccsenet.org Journal of Agricultural Science Vol. 12, No. 4; 2020
27
Since the liberalization of the Sino-Soviet border in 1990’s, Chinese farmers have been actively engaged in the economy of Russian Far East (RFE). Chinese agricultural labourers, first hired by Soviet state and collective farms to compensate for the diminishing pool of local urban labour, began to lease their own plots of farmland on Russian soil to grow crops. Traders from China took advantage of this market demand, shuttling vegetables across the border into the RFE and Siberia. Chinese farms and greenhouses, spotted along the countryside and near urban centres, cultivated vegetables and sold the production into the RFE’s market. As profits were made, word-of-mouth and active corporate recruitment began to occur, setting off a chain of migration and a farming rush (Huang, 2010). Over the last decade, Chinese presence on Russian rural land has expanded to include small-scale, medium-scale family farms and large-scale (often Russian, Chinese or both countries cooperation) investment projects. Vassilieva and Akaha (2005) show that there is a widespread fear among communities in the RFE about negative consequences of Chinese immigration for their economic well-being. Deterioration of the socio-economic development of rural areas in RFE is thought to be a negative effect of attracting Chinese migrants to agriculture in the Far East (Mishchuk, 2016). Chinese farmers in the RFE produce vegetables and after Chinese-US trade war started intensively cultivate soybean what made local arable land rental prices to increase what by some Russian household is used as speculation tool for increasing their income. Sometimes Russian farmers receive state support to their farm production and additionally rent out part of their land to Chinese. This way they can reach Russian soybean producers’ incomes.
There is no agreement between local scientists about environmental harmfulness of Chinese farmer’s cultivation methods. The Rosselkhoznadzor (Federal Service for Veterinary and Phytosanitary Surveillance/Россельхознадзор/Федеральная служба по ветеринарному и фитосанитарному надзору) could answer the questions whether foreigners or Russians really pollute the fields. However, since 2011, the department has been deprived of the authority to monitor compliance with the storage and use of pesticides and agrochemicals. They no longer carry out checks (Koreneva, 2019). There is also no agreement between Chinese and Russian scientists and journalists about the impact of Chinese presence in the RFE on local communities. Media reports describe particular cases and focus on positive or negative aspects only, carefully narrating stories to match the article’s aims, but miss a big picture of the socio-economic complex relationships in of Chinese-Russian agricultural cooperation (Solovchenkov et al., 2019; Ji, 2017). There are only two authors who analyzed in many publications Chinese presence in the RFE in details covering, demographic, ethnographic and cross-border aspects (Mishchuk, 2016; Zuenko, 2018). There is a low number of scientific publications, there is no reliable statistical data and no economical empirical studies about Chinese-Russian agricultural cooperation in the RFE. Some scientific publications do not show a real situation, lack in-depth knowledge about the background and are misleading (Zhu, 2019). Scientists rarely go personally to the RFE to study this topic.
The role of Chinese migrants in the agriculture sector is a neglected area (French, 2014). The current research follows future research objectives presented by Zhou (2015) who described evolution and current situation of Chinese agrarian capitalism in the RFE. The paper provided basic information that would lay the groundwork for more intensive study of this topic, through fieldwork and primary data collection. Among the range of issues on which the paper was silent included: the impact of Chinese agricultural activities on Russian local population, economy and food security. The author stated that Chinese agricultural activity in Russia has so far been not been examined as its own separate topic in any academic or policy-related studies. The author claims that Chinese workers in the RFE not only fill a labour shortage, but also contribute positively to local food security, with negative impacts being more socially normative and political, than economic. Jiang et al. (2018) suggested that more on-the-spot investigations and investment project evaluations are needed to study the investment cooperation model that suits the interests of both parties in order to achieve a win-win goal. The three RFE’s regions considered in this article are in the top 10 regions producing soybeans in Russia: they accounted for 38.6% of Russia’s soybean production in 2018. The total soybean production in Russia in 2018 was 4.25 mln tons and grew by 9.2% since 2017. National consumption is 1.82 mln tons (AB-centre, 2019).
Our analysis is focused on two broad questions. First, what is the impact of Chinese farms cultivating soybean in RFE on local rural household income, well-being and costs of living (spending)? Second, what farming, legal, entrepreneurship and contextual factors influence the magnitude and relative importance impact? We investigated effects of number of Chinese farm in 20 km range (no.), selling to Chinese (0-1), share of production sold to Chinese (%) and distance to Chinese farm (km) on well-being, farm income, food cost and share of Chinese food purchased among Russian Far East households.
Our hypothesis was that more farms in 20 km range and/or selling to Chinese and/or selling more to Chinese and/or closer distance to the Chinese farm will increase probability of lower well-being, lower farm income, lower food costs and greater share of Chinese food purchased among Russian Far East households. Our findings

jas.ccsenet.org Journal of Agricultural Science Vol. 12, No. 4; 2020
28
improve understanding of rural RFE livelihoods and quantitative estimation of the economic consequences of international Chinese agribusiness entrepreneurs’ activity.
The rest of this paper is organized as follows: Section 1.2 describes Chinese agribusiness entrepreneurs and workers in Russian Far East; Section 2 introduces the data used for the estimations; and Section 3 present the empirical estimation, the empirical results, and Section 4 discusses and concludes the article.
1.2 Chinese Agribusiness Entrepreneurs and Workers in Russian Far East
Global large-scale overseas investment in land could counteract poverty reduction measures and impede the development of global food security (Naylor, 2011; Amanor & Chichava, 2016). The development of the agricultural industry in developing countries creates spillover effects through channels such as increasing employment and taxation, thereby promoting the sustainable development of these countries (Pitcher, 2008; Hall, 2012; Amanor & Chichava, 2016; Chen et al., 2017; Kaarhus, 2018; Nzabuheraheza & Nyiramugwera, 2017; Chichava et al., 2013; Morea & Balzarini, 2018). In order to achieve a win-win goal, from the enterprise perspective, it is necessary to rationally plan the investment layout and balance the development needs of itself and the target country (Malone, 2019). FAO reports that poverty reduction and food safety issues cannot be resolved by relying on domestic investment alone, so overseas investment in agriculture plays an important role (FAO, 2012; Robertson & Andersen, 2010; Campesina, 2019).
RFE comprises eastern territory of Russia, between Lake Baikal in Eastern Siberia and the Pacific Ocean and has land borders with the People’s Republic of China, Mongolia and the Democratic People’s Republic of Korea. The RFE was particularly affected, as a remote region that was always highly dependent on government for subsidies, and on other parts of the country for consumer items—including agricultural products. The RFE had never been particularly food self-sufficient, and fresh produce became an even more valuable commodity in the region after Soviet disintegration. With a short vegetation period and undeveloped supply chain there was always an untapped market for fresh vegetables in RFE that until these days is still not fully exploited by Russians. The cost of agricultural products per unit of the RFE is much higher than the average level in Russia, so that economic benefits are low, or even a loss (Wang & Xu, 2002; Xu et al., 2016). RFE is a lucrative market for Chinese agricultural products like fruit and vegetables that are exported from China to RFE (Luan, 2005). In 2004 years ago fruits and vegetables were 6 times more expensive in Russia than in China what was great incentive for Chinese either to trade or grow crops in RFE (Guo, 2004). Russia imports about 360,000 tons of vegetables from China every year, but the highest tariffs on Chinese vegetables and fruits are as high as 36% (Liu et al., 2018). Chinese control more than 50% of the Russian Far East’s vegetable and fruit agricultural markets (Great Power Survey, 2019). Russian farmers cannot compete with Chinese farmers producing in RFE and with imported Chinese products either. Chinese producers use more effective, not recognised by Russian authorities, environmentally harmful chemicals and fertilizers. Russian law is quite strict and allows for using fertilizers using biological components only. Most of Chinese are not registered as workers or farmers, do not pay local income taxes and due to the corruption at the customs, smuggle their own fertilizers, thus lowering their costs of production.
Previous studies have provided empirical knowledge of large-scale land acquisitions, as well as their socioeconomic and environmental impacts at the global, regional and local level (Anseeuw et al., 2012; Borras et al., 2011; Deininger et al., 2010; Chichava et al., 2013; Grain et al., 2014; Nolte, 2014; Suhardiman et al., 2015; Thondhlana, 2015; Zoomers, 2010). Most of the studies base their information on cases reported in the press or other unverified sources (typically websites). Very few of them collected data from households (e.g., Hamenoo et al., 2018; Porsani et al., 2019). They do not focus on the impact of Chinese farmers, but on international companies engaged in agricultural production in the study region. None of the studies cover Russia or Chinese entrepreneurs only.
Due to changes in macroeconomic conditions and the widening of the gap between industrial and agricultural products, the living standards of residents in agricultural areas have fallen sharply. Not developing agriculture will lead to an increase in population outflow and affect the socio-economic development of the entire RFE. The birth rate in rural areas has fallen, the aging population has worse living conditions than the one in cities, and the outflow of agricultural labour has increased dramatically. In recent years, living standards in RFE have fallen a lot, and people regard the Chinese who have brought in daily necessities and food as their saviors. The low-priced goods provided by the Chinese have enabled residents to have food and clothing in a short period of time. The Chinese in Russia supply local residents with goods, provide various services, engage in construction and decoration, provide jobs for Russians, and meet the urgent needs of local residents. To a certain extent, they
jas.ccsenet.
are helpinproblems,
Chinese Nwhich hascooperatioachieved gRussian faboth groupRussian fa
2. Method
Chinese agleasing thebut this ca5th year ofrom Chinlocal land case of soyby Chineshouseholdhouseholdvegetablesconsumersnational ag
Figure
org
ng RFE residethe instability
Northeast has ms created goodon between thegood incomes.armers (Cui, 2ps of farmers. Tarmers, thus in
d
gribusiness ene land there is an be related tof sanctions. Ru
nese farmers. Cowners willinybean, it can bse farmers. Wd farmers comd farmers depes compensate ss (peasant andgricultural prod
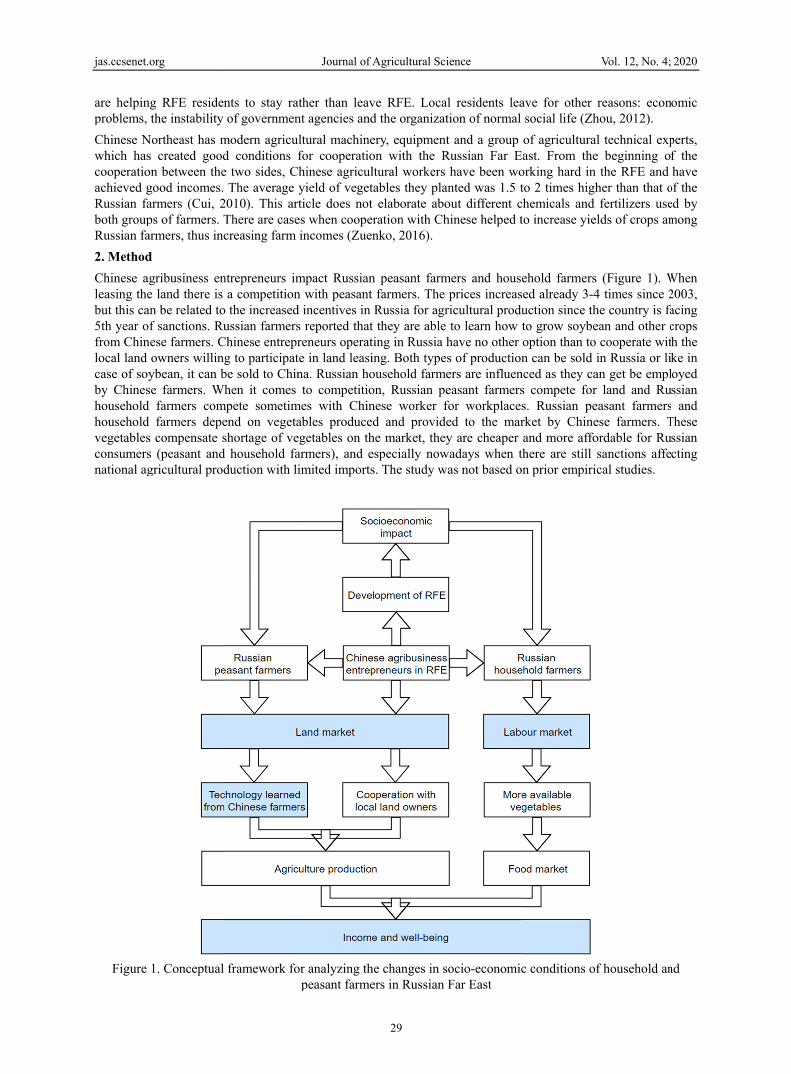
1. Conceptual
nts to stay raof governmen
modern agricud conditions fe two sides, C The average
2010). This arThere are casecreasing farm
ntrepreneurs ima competition
o the increasedussian farmers
Chinese entreprng to participatbe sold to Chin
When it comes mpete sometimend on vegetashortage of ve
d household faduction with li
l framework fo
Journal of A
ather than leavnt agencies and
ltural machinefor cooperatiohinese agriculyield of veget
rticle does not es when coopeincomes (Zuen
mpact Russiann with peasant d incentives in s reported thatreneurs operatte in land leasina. Russian hoto competitio
mes with Chinables produceegetables on tharmers), and eimited imports
or analyzing thpeasant farme
Agricultural Sci
29
ve RFE. Locad the organizat
ery, equipmenton with the Rltural workers tables they pla
elaborate aboration with Chnko, 2016).
n peasant farmfarmers. The Russia for agr
t they are able ting in Russia hing. Both typesousehold farmeon, Russian penese worker fd and provide
he market, theyespecially nows. The study w
he changes in sers in Russian
ience
l residents leation of normal
t and a group Russian Far E
have been woanted was 1.5 tout different chinese helped t
mers and housprices increas
ricultural produto learn how
have no other s of productioners are influeneasant farmersfor workplacesed to the mary are cheaper
wadays when twas not based o
socio-economicFar East
ave for other social life (Zh
of agriculturaEast. From theorking hard in to 2 times highchemicals and to increase yie
ehold farmerssed already 3-4uction since thto grow soybeoption than ton can be sold
nced as they cas compete fors. Russian perket by Chineand more affo
there are still on prior empiri
c conditions of
Vol. 12, No. 4;
reasons: econhou, 2012).
l technical expe beginning o
the RFE and her than that ofertilizers uselds of crops am
s (Figure 1). W4 times since 2he country is faean and other c cooperate witin Russia or lian get be emplr land and Rueasant farmersese farmers. Tordable for Rusanctions affecal studies.
f household an
2020
nomic
perts, f the have
of the ed by mong
When 2003, acing crops th the ke in loyed ssian
s and These ssian cting
nd

jas.ccsenet.
RFE has amore thanworld. 25%amounted
Figure 2.
There are one that ishow Chinpages (A4The local visits to thfocused onin Chinesehighest nu2018 (curryear.
A total of border reghouseholdKrai. The sample cobetween Rdataset coareas were
org
a population on one person p% of the poputo approximat
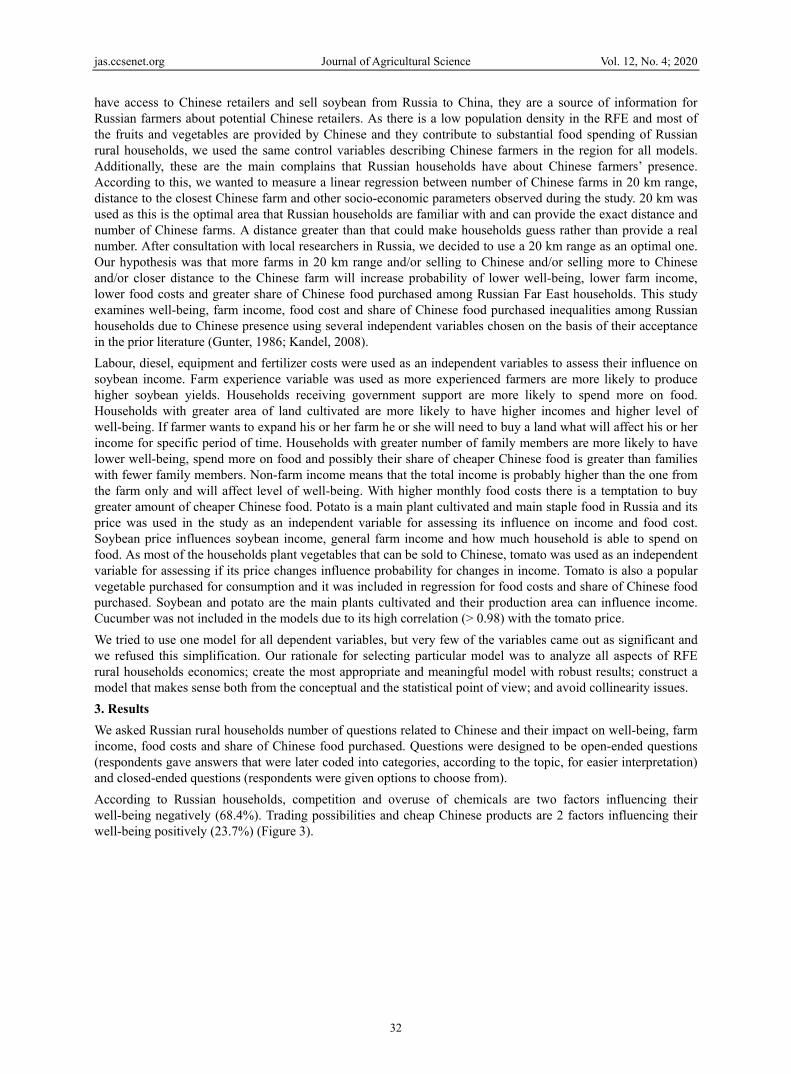
Study area of i
official statists available-doeese workers a) questionnairadministration
he administratin three particule-Russian agr
umber of Chinerent) status of
327 Russian hgions, proportds from 4 raion
locations for ollection (FebrRussians and Cvers three thee also mention
f 6.29 million per square kiloulation is livintely RUB 39 2
interview datafarmer
tics about Chines not match tand entreprenee was preparedn workers inteion offices. Dalar years: 2003icultural coopese farms in opf the farms. Th
households weionally to Chns in The Jew
research werruary and AugChinese), estime most importaned by other s
Journal of A
with an area ometre, makinng in rural area23 (ROSSTAT
a collection frors in Russian F
nese farmers’ the real situati
eurs influence d. Data was co
erviewed houseata collection w3, 2013 and 20peration in RFperation in RFEhis resulted in
ere randomly shinese farms rish Autonomore chosen basegust 2018) abmated numberant regions wscientists (Ryz
Agricultural Sci
30
of 6.21 milliong the RFE onas. As of 2019
T, 2019) (Figur
m local farmerFar East (Goog
activities in Rion (Mishchuksocio-econom
ollected througeholds’ heads was undertake018. The choicFE. Data colleE), 2013 (one a final sample
selected from reported: 8 hoous Oblast anded on respons
bout soya prodr of Chinese
where Chinese-zhova, 2014; Z
ience
on square kilomne of the most9, average more 2).
rs about impacgle Maps, 2019
RFE, but the dak, 2018; Zuen
mic status of Rgh network of during Russia
en from Novemce of the periodected includedyear before 20e consisting of
18 raions (admouseholds fromd 302 househoses from localduction (the mfarms and Ch-Russian coopZhou, 2015; M
metres what trt sparsely poponthly income
ct of Chinese f9)
ata is not publnko, 2016). ToRussian house18 raions’ adm
an workers’ anmber 2018 to Fd of analysis isd historical da014 sanctions af 981 observat
ministrative unm 2 raions inolds from 12 ral rural commumost popular hinese labour peration takes Mishchuk, 201
Vol. 12, No. 4;
ranslates to slipulated areas in
per capita in
farmers on Rus
licly available collect data a
eholds in RFEministrative offnd farmers’ ranFebruary 2019s due to importata from 2003against Russiations, 327 for
nits in Russia)n Amur Oblasaions in Primounities duringcommodity trin the region.place. These
16; Zuenko, 2
2020
ghtly n the RFE
ssian
. The about , a 4 fices. ndom 9. We tance
(the ) and each
) in 3 t, 17 orsky
trial raded Our three 016).

jas.ccsenet.org Journal of Agricultural Science Vol. 12, No. 4; 2020
31
According to literature review this is the first scientific, empirical and economic data collected so far. Collecting sensitive economic data in highly untrustworthy environment of post-soviet country in its Far Eastern frontiers was found to be a challenge. For this reason, a comprehensive type of a questionnaire was used to cover as much socio-economic aspects of Russian rural household as possible. We did not want to make the interviewing process troublesome and require sensitive information that was very likely not to be shared either due to black market being a common way of employment and making business in RFE’s agriculture. An advantage of the survey data set is that it includes information on both the Russian farm workers and the Russian farm operations employing the workers. Admittedly, the method employed relies on farm operators to provide information about their Chinese and Russian workers’ wages, number of employees and other details. Potential bias associated with the absence of interview details from Chinese workers and farmers, however, is mitigated somewhat by the experiences and knowledge shared by Russian farmers who employed Chinese workers and Russian employees who worked for Chinese famers. We were suggested to use some data available in Russian statistics databases, but data we have found did not cover raions (administrative units in Russia) we included in our study. Our dataset is a unique collection of information and there was no data used in statistical analysis that was not coming from the survey.
To make the questionnaire as universal as possible and cover as many topics as possible it contained the following parts: 1. Farm type, 2. Location, 3. Demography, 4. Land, 5. Agriculture production, 6. Labour, 7. Production costs, 8. Living costs, 9. Market, 10. Income of all family members, 11. Well-being, 12. Health and security, 13. Rural development, 14. Opinions and 15. Estimated prices of agricultural products.
In total, 187 measures (independent variables, dependent variables and opinions) were recorded. Dependent variables chosen in the analysis were: well-being, farm income, food cost and share of Chinese food purchased among Russian Far East households. As we were not able to collect all details of household’s finances, we had the only option to ask about subjective well-being which was measured based on households’ responses about their well-being in 2003, 2018 and 2018 on a scale from 1 to 10. Additionally to explanatory variables, key independent explanatory variables related to Chinese investments were: number of Chinese farms in 20 km range (no.), distance to Chinese farm (km), selling to Chinese (0-1) and share of production sold to Chinese (%). Whenever possible, farm-gate prices were used to value products. Household characteristics and contextual factors are included as independent variables. Quantitative explanatory variables are continuous, whereas dummies are used for qualitative variables.
In panel data where longitudinal observations exist for the same subject, fixed effects represent the subject-specific means. In panel data analysis the term fixed effect model (1) (also known as the within estimator) is used for the coefficient estimates. It is necessary to point out that studies using panel data fixed effects models, like this paper does, suffer from the problem of being forced to exclude time-constant factors such as education (Gerdtham et al., 2012). This study has been able to encompass only time-varying factors like income and employment status.
The model is specified as follows:
Yit = β0 + β1X1it + β2X2it + … + βkXkit + uit, it = 1, … n (1)
where, Yit is a dependent variable; X1it, X2it, … Xkit are explanatory variables for well-being, farm income, food costs and share of Chinese food purchased among Russian Far East households; β0 is the intercept; β1 is the slope coefficient on X1, β2 is the coefficient on X2, and so on; uit are residuals; i and t are indices for farm ID and time index. On the basis of a panel data, the empirical fixed effect multiple linear regression models were used to investigate effects of number of Chinese farm in 20 km range (no.), selling to Chinese (0-1), share of production sold to Chinese (%) and distance to Chinese farm (km) on well-being, farm income, food costs and share of Chinese food purchased among Russian Far East households. Due to limited funds and time for finishing PhD we were not able to contact representative number of Chinese farmers and workers in RFE either. Data about Chinese farms’ locations (number of Chinese farms in 20 km range and distance to the closest farm) and type of cooperation with Chinese (selling to Chinese or not and percent of sales to Chinese) were provided by Russian households and used for analysis as controlled key variables. We decided that these independent key variables would be the best ones to estimate impact of density, distance and dependence on Chinese farmers and retailers on well-being, farm income, food costs and share of Chinese food purchased among Russian Far East households. Empirical studies measuring factors influencing rural households use indicators such as land tenure and distance to the market (Ogeto et al., 2013; Tarawali et al., 2012). In our case land is the factor that Russian and Chinese farmers compete for. Chinese who buy agricultural products from Russian farmers are perceived as a part of the market. Access to information is an essential part of the trading process (Asmah, 2011). As Chinese
jas.ccsenet.org Journal of Agricultural Science Vol. 12, No. 4; 2020
32
have access to Chinese retailers and sell soybean from Russia to China, they are a source of information for Russian farmers about potential Chinese retailers. As there is a low population density in the RFE and most of the fruits and vegetables are provided by Chinese and they contribute to substantial food spending of Russian rural households, we used the same control variables describing Chinese farmers in the region for all models. Additionally, these are the main complains that Russian households have about Chinese farmers’ presence. According to this, we wanted to measure a linear regression between number of Chinese farms in 20 km range, distance to the closest Chinese farm and other socio-economic parameters observed during the study. 20 km was used as this is the optimal area that Russian households are familiar with and can provide the exact distance and number of Chinese farms. A distance greater than that could make households guess rather than provide a real number. After consultation with local researchers in Russia, we decided to use a 20 km range as an optimal one. Our hypothesis was that more farms in 20 km range and/or selling to Chinese and/or selling more to Chinese and/or closer distance to the Chinese farm will increase probability of lower well-being, lower farm income, lower food costs and greater share of Chinese food purchased among Russian Far East households. This study examines well-being, farm income, food cost and share of Chinese food purchased inequalities among Russian households due to Chinese presence using several independent variables chosen on the basis of their acceptance in the prior literature (Gunter, 1986; Kandel, 2008).
Labour, diesel, equipment and fertilizer costs were used as an independent variables to assess their influence on soybean income. Farm experience variable was used as more experienced farmers are more likely to produce higher soybean yields. Households receiving government support are more likely to spend more on food. Households with greater area of land cultivated are more likely to have higher incomes and higher level of well-being. If farmer wants to expand his or her farm he or she will need to buy a land what will affect his or her income for specific period of time. Households with greater number of family members are more likely to have lower well-being, spend more on food and possibly their share of cheaper Chinese food is greater than families with fewer family members. Non-farm income means that the total income is probably higher than the one from the farm only and will affect level of well-being. With higher monthly food costs there is a temptation to buy greater amount of cheaper Chinese food. Potato is a main plant cultivated and main staple food in Russia and its price was used in the study as an independent variable for assessing its influence on income and food cost. Soybean price influences soybean income, general farm income and how much household is able to spend on food. As most of the households plant vegetables that can be sold to Chinese, tomato was used as an independent variable for assessing if its price changes influence probability for changes in income. Tomato is also a popular vegetable purchased for consumption and it was included in regression for food costs and share of Chinese food purchased. Soybean and potato are the main plants cultivated and their production area can influence income. Cucumber was not included in the models due to its high correlation (> 0.98) with the tomato price.
We tried to use one model for all dependent variables, but very few of the variables came out as significant and we refused this simplification. Our rationale for selecting particular model was to analyze all aspects of RFE rural households economics; create the most appropriate and meaningful model with robust results; construct a model that makes sense both from the conceptual and the statistical point of view; and avoid collinearity issues.
3. Results
We asked Russian rural households number of questions related to Chinese and their impact on well-being, farm income, food costs and share of Chinese food purchased. Questions were designed to be open-ended questions (respondents gave answers that were later coded into categories, according to the topic, for easier interpretation) and closed-ended questions (respondents were given options to choose from).
According to Russian households, competition and overuse of chemicals are two factors influencing their well-being negatively (68.4%). Trading possibilities and cheap Chinese products are 2 factors influencing their well-being positively (23.7%) (Figure 3).

jas.ccsenet.org Journal of Agricultural Science Vol. 12, No. 4; 2020
33
Figure 3. Response of Russian Far East rural households’ heads to the question: How are Chinese farmers influencing your well-being?
Soybean is the most popular commodity sold to Chinese (Figure 4).
Figure 4. Response of Russian Far East rural households’ heads to the question: What agricultural products do
you sell to Chinese farmers and retailers?
When asked—Did you change anything in plant production (including soybean) because of Chinese farmers present? —Russian households responded that because of Chinese farmers present in RFE they increased farm land area, improved biosafety, acquired new technologies and increased forage volume (Figure 5).
Figure 5. Response of Russian Far East rural households’ heads to the question: Did you change anything on your farm or in plant production because of Chinese farmers present?
0
5
10
15
20
25
30
35
40
Competition Overuse of chemicals Trade Comfortable life(cheap products)
% o
f re
spon
ses
Influence positivelyNo influenceInfluence negatively
0
5
10
15
20
25
30
35
40
Soybean Vegetables Fertilizer Rice Seeds Livestock Barley
% o
f re
spon
ses
0
5
10
15
20
25
30
35
40
Increased land area Biosafetyenhancement
New technologies Increased foragevolume
Reduced cultivation
% o
f re
spon
ses
Influence positively
No influence
Influence negatively

jas.ccsenet.org Journal of Agricultural Science Vol. 12, No. 4; 2020
34
Russian households reported that in general Chinese farmers have a negative impact on their incomes (60%) in contrast to 37.8% respondents thinking that there is a positive impacts (Figure 6).
Figure 6. Response of Russian Far East rural households’ heads to the question: How are Chinese farmers influencing your income?
62% of Russian households believed that Chinese farmers in RFE influence their living (food) costs negatively in comparison to 28% that thought that there is a positive impact and 10% that there is no impact (Figure 7).
Figure 7. Response of Russian Far East rural households’ heads to the question: How are Chinese farmers influencing your living (food) costs?
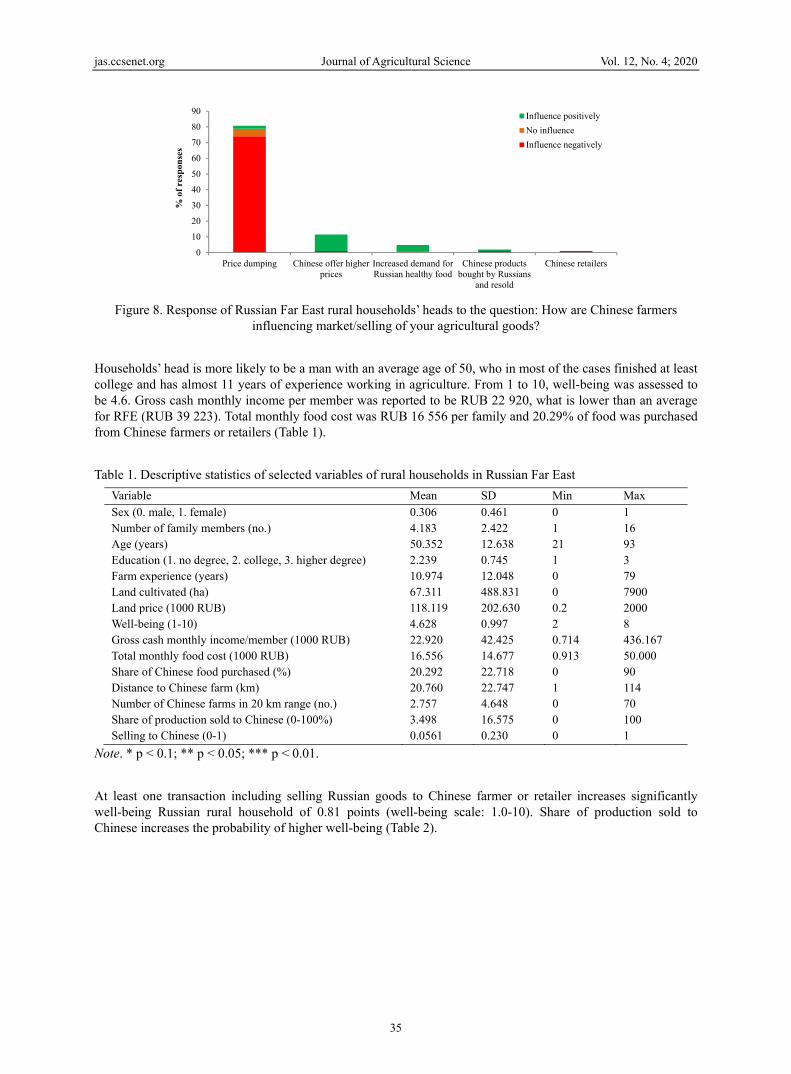
76.9% of Russian rural households thought that Chinese farmers influence market and selling of their agricultural products negatively. 5.8% believed there was no influence and 17.3% believed that there is a positive influence. Although selling to Chinese increases probability of higher well-being, higher soybean income and Chinese customers and retailers are perceived as a positive impact on income, there is low response about positive Chinese influence on selling agricultural goods. Although more Chinese farms in 20 km range increase probability of higher income and there is a an opinion about positive influence of trading with Chinese on well-being—there are many responses about negative Chinese influence on selling agricultural goods by price dumping (Figure 8).
0
10
20
30
40
50
60
Lower demand forRussian products
Chinese customersand retailers
Greater demand formy/Russian goods
Chinese technologyincreased my yields
Competition forworkplaces
% o
f re
spon
ses
Influence positively
No influence
Influence negatively
0
5
10
15
20
25
30
35
Lower living costs Higher living costs Low quality Chineseproducts
Lower income Higher income
% o
f re
spon
ses
Influence positively
No influence
Influence negatively
jas.ccsenet.org Journal of Agricultural Science Vol. 12, No. 4; 2020
35
Figure 8. Response of Russian Far East rural households’ heads to the question: How are Chinese farmers influencing market/selling of your agricultural goods?
Households’ head is more likely to be a man with an average age of 50, who in most of the cases finished at least college and has almost 11 years of experience working in agriculture. From 1 to 10, well-being was assessed to be 4.6. Gross cash monthly income per member was reported to be RUB 22 920, what is lower than an average for RFE (RUB 39 223). Total monthly food cost was RUB 16 556 per family and 20.29% of food was purchased from Chinese farmers or retailers (Table 1).
Table 1. Descriptive statistics of selected variables of rural households in Russian Far East
Variable Mean SD Min Max
Sex (0. male, 1. female) 0.306 0.461 0 1 Number of family members (no.) 4.183 2.422 1 16 Age (years) 50.352 12.638 21 93 Education (1. no degree, 2. college, 3. higher degree) 2.239 0.745 1 3 Farm experience (years) 10.974 12.048 0 79 Land cultivated (ha) 67.311 488.831 0 7900 Land price (1000 RUB) 118.119 202.630 0.2 2000 Well-being (1-10) 4.628 0.997 2 8 Gross cash monthly income/member (1000 RUB) 22.920 42.425 0.714 436.167 Total monthly food cost (1000 RUB) 16.556 14.677 0.913 50.000 Share of Chinese food purchased (%) 20.292 22.718 0 90 Distance to Chinese farm (km) 20.760 22.747 1 114 Number of Chinese farms in 20 km range (no.) 2.757 4.648 0 70 Share of production sold to Chinese (0-100%) 3.498 16.575 0 100 Selling to Chinese (0-1) 0.0561 0.230 0 1
Note. * p < 0.1; ** p < 0.05; *** p < 0.01.
At least one transaction including selling Russian goods to Chinese farmer or retailer increases significantly well-being Russian rural household of 0.81 points (well-being scale: 1.0-10). Share of production sold to Chinese increases the probability of higher well-being (Table 2).
0
10
20
30
40
50
60
70
80
90
Price dumping Chinese offer higherprices
Increased demand forRussian healthy food
Chinese productsbought by Russians
and resold
Chinese retailers
% o
f re
spon
ses
Influence positively
No influence
Influence negatively

jas.ccsenet.org Journal of Agricultural Science Vol. 12, No. 4; 2020
36
Table 2. Fixed effect multiple regressions of well-being against household characteristics in Russian Far East, 2003-2018
Variables Well-being
(1) (2) (3) (4)
Land cultivated (ha) 0.000 0.000 0.000 -0.000 (0.000) (0.000) (0.000) (0.000)
Number of family members (no.) 0.038** 0.038** 0.037** 0.040** (0.016) (0.016) (0.016) (0.018)
Non-farm income (1000 RUB) -0.001 -0.001 -0.001 -0.000 (0.001) (0.001) (0.001) (0.001)
Number of Chinese farms (no.) 0.014 (0.009)
Share of production sold to Chinese (%) 0.008** (0.004)
Selling to Chinese (0-no, 1-yes) 0.810*** (0.244)
Distance to Chinese farm (km) 0.002 (0.004)
Constant 4.443*** 4.451*** 4.435*** 4.521*** (0.080) (0.078) (0.078) (0.119)
Observations 981 981 981 736 R-squared 0.016 0.019 0.029 0.012 Number of farms 327 327 327 270
Note. * p < 0.1; ** p < 0.05; *** p < 0.01.
Soybean is the most popular commodity sold to Chinese. Regression for soybean income revealed that selling to Chinese tends to increase the probability of RUB 4.382 mln ($68 967) higher soybean income than not selling. However, after reaching 33% of total production sold to Chinese (RUB -132.429 for each percent sold more) soybean income decreases (Table 3).

jas.ccsenet.org Journal of Agricultural Science Vol. 12, No. 4; 2020
37
Table 3. Fixed effect multiple regressions of soybean income against household characteristics in Russian Far East, 2003-2018.
Variables Soybean income
(1) (2) (3) (4) (5) (6)
Annual diesel cost (1000 RUB) 0.024*** 0.024*** 0.024*** 0.024*** 0.024*** 0.024***
(0.002) (0.002) (0.001) (0.002) (0.001) (0.001)
Annual equipment cost (1000 RUB) -0.697*** -0.702*** -0.526** -0.653*** -0.565** -0.530**
(0.078) (0.082) (0.240) (0.081) (0.231) (0.240)
Annual fertiliser cost (1000 RUB) 0.120 0.120 0.086 0.109 0.098 0.087
(0.095) (0.097) (0.089) (0.095) (0.085) (0.089)
Farm experience (years) 15.402 7.939 -30.401 12.255 -16.521 -28.605
(34.969) (35.590) (30.746) (34.553) (29.610) (30.797)
Annual labour cost (1000 RUB) -0.000 -0.000 -0.000 0.000 -0.000 -0.000
(0.001) (0.001) (0.000) (0.001) (0.000) (0.000)
Soybean price (RUB-kg) 17.913 17.391 18.414 16.746 19.478* 18.648*
(13.944) (14.202) (11.232) (13.885) (10.812) (11.238)
Number of Chinese farms (no.) -7.211 -5.961 7.589
(52.391) (53.314) (45.012)
Share of production sold to Chinese (%) -89.596*** -132.429*** -88.878***
(23.058) (31.494) (18.148)
Selling to Chinese (0-no, 1-yes) -1,975.570 4,382.653** -595.969
(1,644.159) (2,206.792) (1,450.908)
Distance to Chinese farm (km) -8.568 -9.345 -8.650
(14.894) (14.330) (14.883)
Constant -33.519 -189.358 -230.303 -171.942 116.614 -169.310
(491.785) (504.359) (548.835) (480.897) (515.766) (539.223)
Observations 611 611 504 611 504 504
R-squared 0.436 0.416 0.589 0.442 0.619 0.589
Number of farms 221 221 194 221 194 194
Note. * p < 0.1; ** p < 0.05; *** p < 0.01.
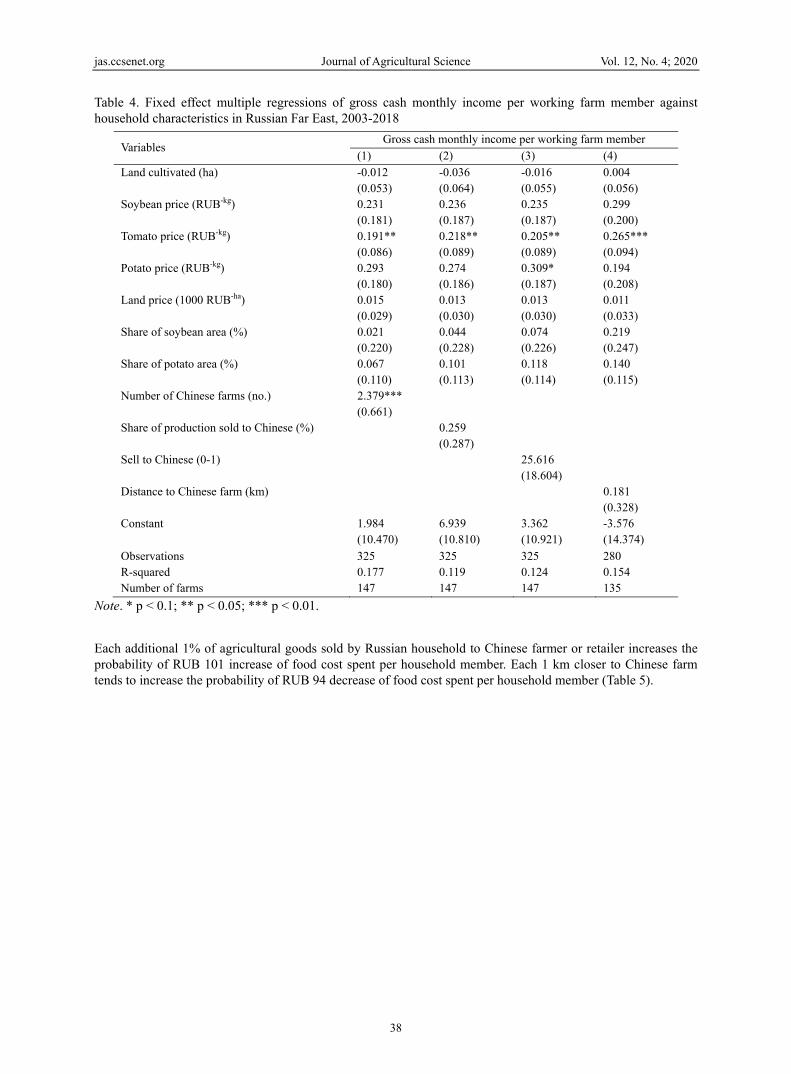
One Chinese farm more in 20 km range makes probability of RUB 2 379 ($37.51) higher gross cash monthly income per working farm member (mean income RUB 22 920/$445.69) (Table 4).
jas.ccsenet.org Journal of Agricultural Science Vol. 12, No. 4; 2020
38
Table 4. Fixed effect multiple regressions of gross cash monthly income per working farm member against household characteristics in Russian Far East, 2003-2018
Variables Gross cash monthly income per working farm member
(1) (2) (3) (4)
Land cultivated (ha) -0.012 -0.036 -0.016 0.004 (0.053) (0.064) (0.055) (0.056)
Soybean price (RUB-kg) 0.231 0.236 0.235 0.299 (0.181) (0.187) (0.187) (0.200)
Tomato price (RUB-kg) 0.191** 0.218** 0.205** 0.265*** (0.086) (0.089) (0.089) (0.094)
Potato price (RUB-kg) 0.293 0.274 0.309* 0.194 (0.180) (0.186) (0.187) (0.208)
Land price (1000 RUB-ha) 0.015 0.013 0.013 0.011 (0.029) (0.030) (0.030) (0.033)
Share of soybean area (%) 0.021 0.044 0.074 0.219 (0.220) (0.228) (0.226) (0.247)
Share of potato area (%) 0.067 0.101 0.118 0.140 (0.110) (0.113) (0.114) (0.115)
Number of Chinese farms (no.) 2.379*** (0.661)
Share of production sold to Chinese (%) 0.259 (0.287)
Sell to Chinese (0-1) 25.616 (18.604)
Distance to Chinese farm (km) 0.181 (0.328)
Constant 1.984 6.939 3.362 -3.576 (10.470) (10.810) (10.921) (14.374)
Observations 325 325 325 280 R-squared 0.177 0.119 0.124 0.154 Number of farms 147 147 147 135
Note. * p < 0.1; ** p < 0.05; *** p < 0.01.
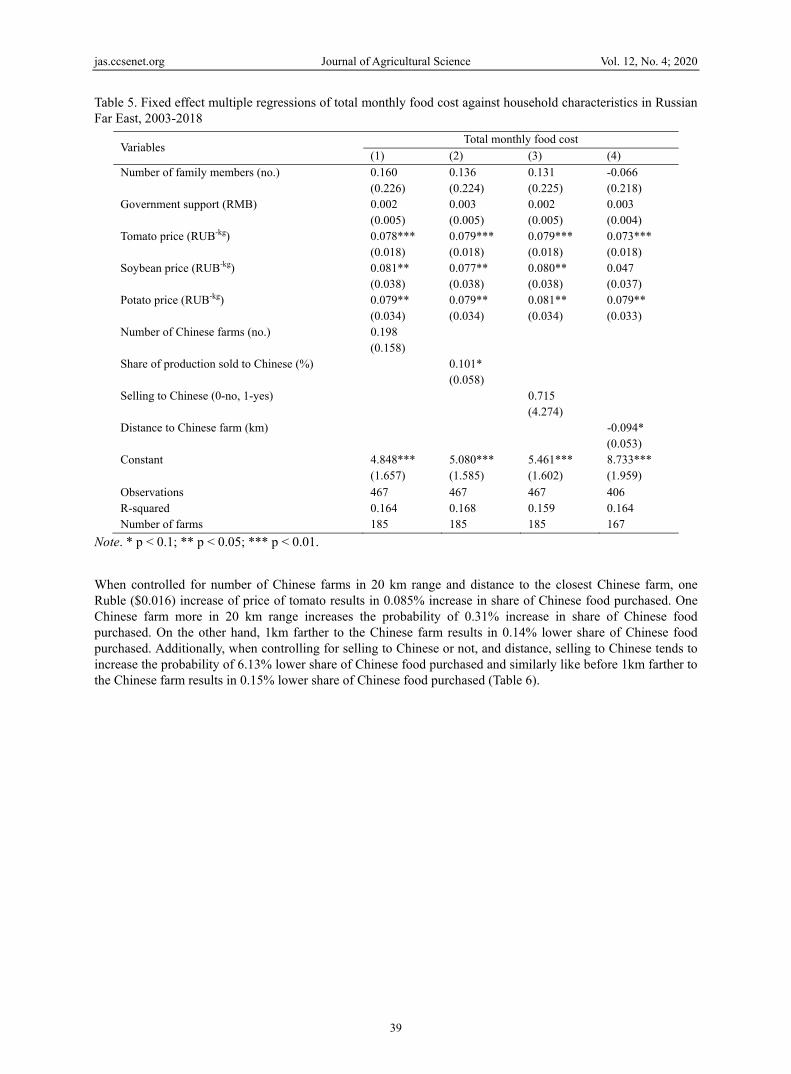
Each additional 1% of agricultural goods sold by Russian household to Chinese farmer or retailer increases the probability of RUB 101 increase of food cost spent per household member. Each 1 km closer to Chinese farm tends to increase the probability of RUB 94 decrease of food cost spent per household member (Table 5).
jas.ccsenet.org Journal of Agricultural Science Vol. 12, No. 4; 2020
39
Table 5. Fixed effect multiple regressions of total monthly food cost against household characteristics in Russian Far East, 2003-2018
Variables Total monthly food cost
(1) (2) (3) (4)
Number of family members (no.) 0.160 0.136 0.131 -0.066 (0.226) (0.224) (0.225) (0.218)
Government support (RMB) 0.002 0.003 0.002 0.003 (0.005) (0.005) (0.005) (0.004)
Tomato price (RUB-kg) 0.078*** 0.079*** 0.079*** 0.073*** (0.018) (0.018) (0.018) (0.018)
Soybean price (RUB-kg) 0.081** 0.077** 0.080** 0.047 (0.038) (0.038) (0.038) (0.037)
Potato price (RUB-kg) 0.079** 0.079** 0.081** 0.079** (0.034) (0.034) (0.034) (0.033)
Number of Chinese farms (no.) 0.198 (0.158)
Share of production sold to Chinese (%) 0.101* (0.058)
Selling to Chinese (0-no, 1-yes) 0.715 (4.274)
Distance to Chinese farm (km) -0.094* (0.053)
Constant 4.848*** 5.080*** 5.461*** 8.733*** (1.657) (1.585) (1.602) (1.959)
Observations 467 467 467 406 R-squared 0.164 0.168 0.159 0.164 Number of farms 185 185 185 167
Note. * p < 0.1; ** p < 0.05; *** p < 0.01.
When controlled for number of Chinese farms in 20 km range and distance to the closest Chinese farm, one Ruble ($0.016) increase of price of tomato results in 0.085% increase in share of Chinese food purchased. One Chinese farm more in 20 km range increases the probability of 0.31% increase in share of Chinese food purchased. On the other hand, 1km farther to the Chinese farm results in 0.14% lower share of Chinese food purchased. Additionally, when controlling for selling to Chinese or not, and distance, selling to Chinese tends to increase the probability of 6.13% lower share of Chinese food purchased and similarly like before 1km farther to the Chinese farm results in 0.15% lower share of Chinese food purchased (Table 6).

jas.ccsenet.org Journal of Agricultural Science Vol. 12, No. 4; 2020
40
Table 6. Fixed effect multiple regressions of share of Chinese food purchased against household characteristics in Russian Far East, 2003-2018
Variables Share of Chinese food purchased
(1) (2) (3) (4) (5) (6)
Number of family members (No.) 0.324* 0.319* 0.329* 0.253 0.276 0.273 (0.188) (0.188) (0.190) (0.189) (0.190) (0.189)
Total monthly food cost (RMB) 0.057 0.058 0.027 0.066* 0.037 0.041 (0.037) (0.037) (0.051) (0.037) (0.051) (0.051)
Tomato price (RUB-kg) 0.075*** 0.076*** 0.085*** 0.082*** 0.089*** 0.092*** (0.014) (0.014) (0.014) (0.014) (0.015) (0.015)
No. of Chinese farms (no.) 0.413*** 0.413*** 0.309** (0.134) (0.134) (0.131)
Share of production sold to Chinese (%) -0.003 0.044 -0.024 (0.046) (0.067) (0.048)
Sell to Chinese (0-1) -2.430 -4.648 -6.132* (3.169) (4.558) (3.403)
Distance to Chinese farm (km) -0.137*** -0.149*** -0.154***(0.041) (0.041) (0.041)
Constant 14.220*** 14.314*** 17.599*** 15.514*** 18.979*** 19.232***(1.148) (1.148) (1.594) (1.090) (1.517) (1.513)
Observations 630 630 553 630 553 553 R-squared 0.142 0.143 0.189 0.123 0.175 0.183 Number of farms 242 242 224 242 224 224
Note. * p < 0.1; ** p < 0.05; *** p < 0.01.
There is no significant difference in soybean and well-being if talking to Chinese or not. There is however, significantly higher gross cash monthly income per working farm member, significantly lower total monthly food cost and significantly lower share of Chinese food purchased when talking to Chinese than not talking to Chinese farmers (Table 7).
Table 7. T-test results for differences in gross cash monthly income per working farm member, total monthly food cost and share of Chinese food purchased by Russian Far East rural households when talking to Chinese farmers or not
Talking to Chinese (0-no; 1-yes)
Obs. Mean SD t-valueWelch’s degrees of freedom
P-value
Well-being (0-10) 0 579 4.601 0.954 -0.995 806.255 0.320
1 402 4.667 1.057
Soybean income (1000 RUB) 0 579 706.272 11520.47 -0.690 938.046 0.490
1 402 1102.344 6356.729
Gross cash monthly income per working farm member (1000 RUB)
0 579 13.434 16.789 -7.459 444.183 0.001 ***
1 402 36.582 60.624
Total monthly food cost (1000 RUB) 0 544 17.609 16.192 2.755 921.656 0.006 **
1 381 15.050 12.053
Share of Chinese food (%) 0 579 22.321 23.157 3.415 895.232 0.001 ***
1 401 17.363 21.764
Note. * p < 0.1; ** p < 0.05; *** p < 0.01.
Well-being of RFE’s households improves through higher incomes and prices when selling to Chinese farmers or retailers in RFE. Chinese farmers and retailers, through their extended networking, are more familiar with exporting agricultural commodities to China and customs procedures than their Russian counterparts and sometimes can offer higher prices than Russian customers.
Russian rural households claim that when selling their products to general public, competition is the greatest negative aspect of Chinese farmers’ presence in RFE, when buying-overuse of chemicals in Chinese products.

jas.ccsenet.org Journal of Agricultural Science Vol. 12, No. 4; 2020
41
Trading with Chinese and cheap products Chinese sell are however, positive influences of Chinese farmers on Russian rural households’ well-being (Figure 3). This relation is in agreement with fixed effect linear regression where ‘Selling to Chinese’ independent variable is increases probability of higher well-being score. Higher number of family members tends to increase probability of higher well-being (Table 2). Families with higher number of family members are more likely to buy cheaper vegetables or other agricultural goods from Chinese to cut spending costs (comfortable life—cheap products—7.9% in (Figure 3). Thus they state that there is a positive Chinese contribution to their spending and improved well-being.
Similarly to African countries, in Russia the balance of trade favours China as local farmers have been hit hard by the flood of cheap Chinese food and retail shops used to establish networks to sell goods (Adisu et al., 2010). Chinese outward investments, especially in agricultural sectors, may target the domestic markets of host countries, and may thus pose competition to local industries (Kubny & Voss, 2019). Survey of five host governments of Chinese investments in Africa (Liberia, Ethiopia, Rwanda, Nigeria and Zambia) also discovered that “increased competition hurting local industries” is a concern shared by four out of five host country governments (Shen, 2019).
When demand for soybean increases in China, Chinese retailers are able to offer higher prices for Russian farmers. Households trading soybean to Chinese sell in average 69.6% of their total production to Chinese retailers. Bargaining power of Chinese buyers is greater when considerable quantities of soybean are purchased from Russian farmers. Although selling more than 33% of their total soybean production to Chinese and getting lower soybean income there is no change in well-being observed. This suggests that selling to Chinese itself stimulates significant well-being improvement and (when larger quantities are sold) significantly lowers income. Another explanation is that Russian retailers are not able to offer such a high prices or there is no demand for soybean on Russian market. Although Chinese retailers offer lower prices (when high quantities are bought) they are still chosen as trustworthy trading partners. The reason might be that Chinese provide instant payments (transaction security) and stable (year to year) demand (predictability, planning) in unstable economy (Russian financial crisis, frauds), as some farmers responded in questionnaires. Through increased farm land area, improved biosafety, new technologies acquisition from Chinese, selling soybean to Chinese and higher incomes there is an improved well-being of Russian rural households. Russian farmers prefer to sell their products to Chinese as there no need to pay a VAT. We wondered why 33% is the threshold for soybean production sold to Chinese and getting lower soybean income. In our study an average soybean yield was 1.157, what is significantly lower than 1.6t/ha what was reported in official statistics in RFE (AB-centre, 2019). The difference is roughly 30%. We calculated income based on area planted and an average yield. We have reason to believe that Russian households underestimated their yields roughly for 30% and this 30% was sold to Chinese without recording it in accounting documents, thus avoiding paying VAT.
Chinese agriculture enterprises in the host country contribute to macro-economic development and growing trade with China (Gray, 2019; Nonfodji, 2019; Onphanhdala et al., 2019; Wang et al., 2014). The same is happening between Russia and China when trading soybean. In Benin, for instance, China’s investment in the farmland for the production of fuel crops is believed by the Benin government to “present a double advantage: that it generates affordable energy while creating an opportunity of development” Nonfodji (2019). A similar observation is made in Asia. The Lao People’s Democratic Republic, for instance, hosts a large amount of Chinese investments in rubber plantations; the direct economic impact is the increase of Lao agricultural exports to China, which contributes to GDP growth and improved government revenues (Onphanhdala et al., 2019). The Lao government believes that rubber will “help lift the country from the ranks of the world’s poorest nations,” considering China’s strong demand for rubber by 2020 (Gray, 2019). For local residents in Laos, Onphanhdala et al. (2019) identified that Chinese investments contributed greatly to income generation (consumption smoothing) and poverty reduction in the short term.
Higher number of Chinese farms in 20 km range gives RFE households chance for communicating more and selling to Chinese farmers and retailers for higher prices, thus increasing income. The fact that the Russian farmer spoke with the Chinese, is doubtfully to be associated with profitability, since here we can talk not about the economy, but about the cognitive-behavioural or social-cognitive theory of entrepreneurship. Intentions serve as a catalyst for identifying opportunities, start-ups and creating the conditions for planned and intentional action. Russian farmers seek to improve their business in cooperation with the other people, speaking not only with Chinese farmers, but they are also engaged in searching for information from other sources. They thereby develop their competence. It is also possible that more farms in 20 km range give opportunity for Russians to adopt some plant growing techniques from Chinese farmers, thus increasing income. In the agricultural sector, Buckley’s (2019) empirical research on Chinese agricultural interventions in Senegal also pinpoints that Chinese

jas.ccsenet.org Journal of Agricultural Science Vol. 12, No. 4; 2020
42
technical, methodical approaches to farming techniques help smallholder farmers improve productivity and reduce chemical and water inputs. According to Onphanhdala et al. (2019), Chinese agricultural investments in Laos engage in technology transfer on diversified crops and are risk averse against disequilibrium; they promote agricultural modernization (e.g., tractors, fertilizer) and raise quality awareness for higher price. Rubinstein (2009) points that the research conducted by Chinese agronomists in Mozambique might improve local food security. However, Shen’s (2019) research based on surveys of the government officials of five African host countries (Liberia, Ethiopia, Rwanda, Nigeria, and Zambia) does not find substantial technology transfers from Chinese investments. Reasons given are that investment is currently resource-seeking and domestic-oriented—which is to say, aimed at strengthening domestic production in China—and thus technology transfers to host countries are quite limited. Skill mismatches and language barriers are also cited (Wang et al., 2014). What is more, sharing information about development, labour-intensive farming practices and production technologies (like soybean in RFE) were also demonstrated by Robertson and Andersen (2010) and benefitting smallholders by collaboration with Chinese by Buckley (2019).
Farms in RFE are usually located in remote areas far from the buyers what makes transaction costs higher. More (Chinese and Russian) farms in 20 km range make logistics more efficient. RFE’s households can choose between Russian and Chinese buyers. The widespread cooperation is when the Chinese buyers outbid the price (for example soybean and wheat) and collect commodities using their own transport. Russian farmers save on transportation and storage costs.
Opinions about positive impact of trading with Chinese customers and retailers (Figure 3) and acquiring technology that increases crop yields (Figure 6) are in agreement with reasoning that higher soybean yields that lead to higher soybean incomes finally lead to higher well-being. However, although incomes of Russian households are higher when they communicate and trade with Chinese, there are still 60% of households claiming that Chinese farmers influence their incomes negatively (Figure 6). This can be true to small vegetable and producers of other goods, but not necessarily soybean producers. There are the same Chinese presence-well-being and Chinese presence-income relations. Competing with Chinese and low quality products are seen as a negative impact of their presence, on the other hand, trading and technology acquisition as a positive ones. When it comes to competition with Chinese for example, the Soweto market in Lusaka, Zambia, has imposed measures to protect local venders. Guo and Chu (2019) found that, in Soweto, Chinese chicken farmers are only allowed to trade from 2:00 am to 8:00 am in the morning to clear the premises to local farmers sell their chicken; in the Tuesday market, Chinese producers have been prohibited from selling local fruit and vegetables such as tomatoes, onions and potatoes, and are restricted to only trading goods that Zambians do not produce, such as Chinese cabbage, spinach, mushrooms and tofu.
We were particularly interested how increased land area was related to positive influence of Chinese when asked if there was any change on Russian farm or in plant production because of Chinese farmers present (Figure 5). We were advised by local Chinese farmers who rented in land from Russian households that Russian households rent out land to Chinese farmers and rent in and cultivate even more land from local authorities, at the same time. We were curious why there are neutral or negative responses to increasing land area. After conversation with number of Russian farmers they admitted that with increasing production costs and competition from Chinese farmers who offer higher renting prices, with no improvement in cultivation technology, they have no choice than to increase their cultivation area to keep their income at the same level as before. Without increasing efficiency (higher yields), they can only use more extensive cultivation methods, by increasing land area.
Chinese poultry farmers in Zambia face the concerns of local Zambian producers (the same like Russian farmers), who claim that they may lose their market share due to “unfair” competition which is seen as a threat to local farmers’ livelihoods (Sayila, 2019). The Zambian farmers suspect the Chinese of using unconventional and artificial growth promoters that may be harmful to human health; however, the Zambian Poultry Authority have yet to find any evidence to support this claim (Rowlatt, 2019). The same situation takes place in RFE where local Rosselkhoznadzor (Federal Service for Veterinary and Phytosanitary Surveillance) controls Chinese farms. In some cases they find banned chemical additives, fungicides, insecticides and other toxic chemicals or simply the ones that are impossible to be traced as they are not present in the range of particles investigated by Russian authorities (Mishchuk, 2016).
The same like in Russia, in Africa too there are socio-economic and environmental issues of the communities bordering with the agro-industrial sites when Chinese agricultural enterprises started their businesses (Oyono, 2005). In Russia there is a common belief that Chinese farmers overuse chemicals and negatively impact incomes of local farmers by providing unhealthy, but cheaper meat and vegetables. The theoretical field of business ethics leads to the important question of the conduct of multinationals working abroad, when the

jas.ccsenet.org Journal of Agricultural Science Vol. 12, No. 4; 2020
43
socio-environmental standards of the host country are lower than those of the country supplying the capital. The same like in RFE, Friis and Nielsen (2016) also reported consequent land use changes including the destruction of field structures as well as erosion and heavy chemical input. In RFE in unstable legislative environment with leasing agreements that can change any time, Chinese and Russian farmers have an incentive to exploit the soil to the maximum. Soybean is the most profitable commodity to be planted and farmers produce this plant over and over again at the same filed plots, thus compromising crop rotation, overusing the soil and making their future yields lower. With low use of commercial fertilizers and low number of livestock production units that can provide natural fertilizers production efficiency is worsen further.
Although general and soybean incomes are higher the perceptions of Chinese farmers’ impacts on well-being and income are negative. The Chinese government and enterprises tend to focus on increasing the level of yield and ignore the environmental costs, land use, governance and the distribution of food production. The latter is one of the major challenges faced by global food security, and is the source of more caution from civil society groups (Samy, 2010). As a result, overseas investment from China is both an opportunity and a challenge for host countries, and specific performance is affected by host countries’ management (Anyu & Ifedi, 2008). Similarly like in Africa, while the impacts of Chinese presence on local development are modest overall, these impacts do appear to be positive in the sense that they are creating economic opportunities, both for themselves and for local people (Cook et al., 2016).
China’s domestic policy favours economic development over environmental protection (Bosshard, 2019). Researchers worry that China risks exporting its domestic environmental track record to other parts of the world through its foreign investment strategy. China has put forward several environmental policies but none has been effective domestically (Economy, 2007). Chinese companies overly concentrate on market and resource seeking and do not want to generate corporate social responsibility (CRS) costs (Xu et al., 2016). Through her empirical research on Chinese privately owned enterprises (POEs), Gu and Carty (2014) identifies that private investment was emphatically market-driven. Consequently, POEs’ investment motives reflect the intensive competition being experienced in the Chinese marketplace today. Chinese infrastructure and agricultural projects overseas also receive criticism about negative environmental impacts (International Rivers, 2019). A particular issue is the lack of firm guidelines governing environmental impact assessments and providing for them to be verified and reviewed for accuracy and completeness (Munson & Zheng, 2012). Several examples of problematic environmental impact assessments (EIAs) have been documented, in Argentina (Rivera Ballesteros, 2019), Australia (Validakis, 2019) and Cambodia (Grimsditch, 2019). Onphanhdala et al. (2019) found that Chinese’s inappropriate use of chemical fertilizer can cause environmental pollution and conflicts among households (e.g., death of livestock) in the host community. Gallagher (2010) also discovered that increased demand for soy among the Chinese has been linked to the deforestation of more than 528,000 square kilometres in the Brazilian Amazon; such deforestation has threatened the livelihoods of many indigenous Brazilians and contributed to accentuating global climate change. Admittedly, Chinese companies could operate in an environmentally responsible manner while operating in these areas, yet China imposes lower environmental benchmarks on its aid and investment projects than multilateral institutions or Western companies (Munson & Zheng, 2012). The World Bank, the International Monetary Fund, the European Investment Bank, the United States and several EU governments, for instance, complain that Chinese banks and (local and national) state authorities apply lower ethical and environmental standards in their loans, giving Chinese firms a competitive advantage over Western counterparts (Mol, 2011).
4. Discussion
With higher income households seem to spend more, probably by buying other better quality food. Another explanation is that as Russian farmers sell more they are more likely to learn what kind of production methods Chinese use (overuse of chemicals) and that is why after selling to Chinese they are more likely to buy safer Russian food. This actually can be Chinese food, sold by Russian citizens for a higher price. Selling greater share of production to Chinese means that that market demand and prices for products are higher in general what explains increase of food expenses.
Although Russian households believe that Chinese products are affordable (Figure 2) and buying them can lower living costs (Figure 7) they still claim that there is a negative impact of Chinese on their living costs. It is presumably because Russians believe that Chinese overuse chemicals and that is why they have no other choice than to buy more expensive Russian products. Because Russian farmers compete with Chinese farmers their incomes are lower and they have no other option than to buy lower quality Chinese products.
jas.ccsenet.org Journal of Agricultural Science Vol. 12, No. 4; 2020
44
More Chinese farms in 20 km range and closer distances to them make vegetables’ distribution for Chinese and purchasing for Russian households easier. With increasing prices for vegetables in RFE, Russian households are increasing purchase of Chinese origin products (produced in RFE by Chinese or imported from China). Volumes of Chinese goods purchased increase probably because of greater varieties of them imported from China. There are various fruits and vegetables not produced in RFE. If such goods are brought from other countries like Armenia, Azerbaijan (premium tomatoes), Kazakhstan, Tajikistan, Uzbekistan (melons, watermelons, plums, peaches, etc.), although they are considered tastier and safer than Chinese (food safety issue), they are more expensive than Chinese. Thus, this is a confirmation for a positive role of Chinese farmers in ensuring food security in RFE by product differentiation and more choices for RFE’s households. Improved well-being and income of Russian farmers and improved food security by producing foods for the local market in this study are in agreement with Yan and Sautman (2010). Kubny and Voss (2014) found that of the surveyed Chinese firms in Vietnam, 72 per cent serve the Vietnamese market only and do not export any of their products, while nearly 90 per cent of the firms sell at least some of their products to local firms, and that Chinese firms sell 23 per cent of their products locally, which is slightly higher than the shares given for Japanese, European or American firms. Finally, at least 1 selling to Chinese increases probability of lower share of Chinese food purchased. This can be true in case of Russian households selling vegetables, fertilizer or livestock, as Russians do not need in that situation buy vegetables or livestock from Chinese. For this reason regression shows lower share of Chinese food purchased from Chinese.
We wanted to understand why communicating with Chinese makes Russian households spend less on food and buy less (lower share of food purchased). We were suggested by Chinese shop keepers that when talking to Chinese, Russian households make a social connection with the seller and can be offered discount. The other reason is that when buying without conversation with Chinese seller, Russian customers can be offered other products available in the shop that were not intended to be purchased in the first place. Better communication with Chinese seller makes Russian receive discounts and not to be persuaded to purchase more.
We believe that the paper should be of interest to policy makers and extension agents in both China and Russia. Data on RFE’s households and the further development of research in this area will make a significant contribution to the concept of subjective well-being in rural areas. Russia combines the characteristics of Eastern and Western cultures, and can act as an intermediary in understanding differences in life satisfaction in general and its individual areas. When selling to general public-competition, when buying-overuse of chemicals in Chinese products are negative influences of Chinese on RFE rural households’ well-being. Trading with Chinese and cheap products Chinese offer are positive influences of Chinese farmers on Russian rural households’ well-being. Thanks to Chinese farmers’ presence RFE’ plant producers improve their production by introducing new technologies. Selling to Chinese increases probability of improved well-being by higher incomes in soybean production and higher total farm incomes. Increased number of Chinese farms in 20 km range increases probability of higher gross cash monthly income per working farm member. Selling greater share of production to Chinese increases probability of higher total monthly food costs. Increase in food prices, more farms in 20 km range and closer distance to the closest Chinese farm increase probability of greater share of Chinese food purchased. Russian farmers talking to Chinese had higher incomes, spent less on food and share of Chinese food they purchased was lower. Cheaper Chinese food, although perceived as less healthy (food security issue) provides local Russian rural households with all-year-round food supply of variety of products (food safety). Fruits and vegetables otherwise would be not available or would be more expensive if imported from other countries or transported from warmer parts of Russia. The investigation proved that Chinese farmers and workers in RFE contribute positively to local food security, with negative impacts being more socially normative and political, than economic.
Selling transaction itself and selling greater share of agricultural production to Chinese farmers and retailers increases income of Russian rural household. Increase in income takes place due to selling soybean to Chinese retailers. Income increases also when more Chinese farms are located around Russian household. With greater share of production sold and shorter distance to Chinese farms, Russian households spend more on food. Finally, share of Chinese found purchased increases with higher number of Chinese farms in 20 km range and shorter distance to the closest Chinese farm. Thanks to soybean production (and other types of production in the future) and cooperation with Chinese there is hope for a sustainable development and improving well-being and incomes of rural households in RFE.
Due to limited funding, challenging interviewing and project’s time scope, we did not collect equal number of questionnaires from three federal subjects (oblast/krai). In our study there were 327 Russian households, of which 8 and 17 were from two regions, respectively, while 302 were from the third region. This could be
jas.ccsenet.org Journal of Agricultural Science Vol. 12, No. 4; 2020
45
unbalanced and affect all results. We are concerned that the empirical identification of Chinese agricultural entrepreneurs-Russian households relationships in this paper do not seem to be very well identified (e.g., the R2 are generally very low), which may reflect the reliability of the recall responses to our questionnaires. We are also not at all clear if the responses for the earlier years were treated in our empirical investigation properly.
Future research can consider collecting similar data from Chinese households who’s members work or run farms in RFE and compare it with Russian households.
Acknowledgements
We thank 327 Russian Far East rural households who shared their data and opinions with us. We thank Ekaterina Novopashina, Ivanna Kostrykina and Tatiana Laguta for English-Russian translations.
References
AB-centre. (2019). Sown areas, gross harvests and soybean productivity in Russia, 2018 results. Retrieved December 30, 2019, from https://ab-centre.ru/news/posevnye-ploschadi-valovye-sbory-i-urozhaynost-soi- v-rossii-itogi-2018-goda
Adisu, K., Sharkey, T., & Okoroafo, S. C. (2010). The Impact of Chinese Investment in Africa. International Journal of Business and Management, 5(9), 3-9. https://doi.org/10.5539/ijbm.v5n9p3
Amanor, K. S., & Chichava, S. (2016). South-South Cooperation, Agribusiness, and African Agricultural Development: Brazil and China in Ghana and Mozambique. World Development, 81, 13-23. https://doi.org/ 10.1016/j.worlddev.2015.11.021
Anseeuw, W., Boche, M., Breu, T., Giger, M., Lay, J., Messerli, P., & Nolte, K. (2012). Transnational land deals for agriculture in the Global South. Analytical resport based on the Land Matrix Database. CDE/CIRAD/GIGA, Bern/Montpellier/Hamburg. Retrieved December 30, 2019, from https://www. landcoalition.org/sites/default/files/documents/resources/Analytical%20Report%20Web.pdf
Anyu, J. N., & Ifedi, J. P. A. (2008). China’s ventures in Africa: Patterns, prospects, and implications for Africa’s development. Mediterranean Quarterly, 19(4), 91-110. https://doi.org/10.1215/10474552-2008-027
Borras, S. M., Hall, R., Scoones, I., White, B., & Wolford, W. (2011). Towards a better understanding of global land grabbing: An editorial introduction. Journal of Peasant Studies, 38, 209-216, https://doi.org/10.1080/ 03066150.2011.559005
Bosshard, P. (2019). China’s environmental footprint in Africa. Retrieved September 10, 2019, from http://www.pambazuka.net/en/category/comment/48442
Brautigam, D., & Ekman, S. S. (2012). Briefing rumours and realities of Chinese agricultural engagement in Mozambique. African Affairs, 111(444), 483-492. https://doi.org/10.1093/afraf/ads030
Buckley, L. (2019). Eating bitter to taste sweet: An ethnographic sketch of a Chinese agriculture project in Senegal (pp. 6-8). International Conference on Global Land Grabbing. Retrieved September 9, 2019, from http://www.iss.nl/fileadmin/ASSETS/iss/Documents/Conference_papers/LDPI/39_Lila_Buckley.pdf
Campesina. (2011). It’s Time to Outlaw Land Grabbing, Not to Make It ‘responsible’. Retrieved from https://www.grain.org/article/entries/4227-it-s-time-to-outlawland-grabbing-not-to-make-it-responsible
Campesina. (2019). It’s Time to Outlaw Land Grabbing, Not to Make It ‘responsible’. Retrieved September 5, 2019, from https://www.grain.org/article/entries/4227-it-s-time-to-outlawland-grabbing-not-to-make- it-responsible
Chen, Y. F., Li, X. D., Wang, L. J., & Wang, S. H. (2017). Is China different from other investors in global land acquisition? Some observations from existing deals in China’s Going Global Strategy. Land Use Policy, 60, 362-372. https://doi.org/10.1016/j.landusepol.2016.10.045
Chichava, S., Duran, J., Cabral, L., Shankland, A., Buckley, L., Lixia, T., & Yue, Z. (2013). Brazil and China in Mozambican agriculture: Emerging insights from the field. Institute of Development Studies Bulletin, 44(4), 101-115. https://doi.org/10.1111/1759-5436.12046
Cook, S., Lu, J., Tugendhat, H., & Alemu, D. (2016). Chinese Migrants in Africa: Facts and Fictions from the Agri-Food Sector in Ethiopia and Ghana. World Development, 81, 61-70. https://doi.org/10.1016/j.worlddev. 2015.11.011
Cui, X. (2010). Expanding agricultural cooperation between Jilin Province and Russia. Economic Aspects, 7, 73-75.

jas.ccsenet.org Journal of Agricultural Science Vol. 12, No. 4; 2020
46
Deininger, K., Byerlee, D., Lindsay, J., Norton, A., Selod, H., & Stickler, M. (2011). Rising Global Interest in Farmland. Can It Yield Sustainable and Equitable Benefits? (pp. 42-44). World Bank, Washington, DC. https://doi.org/10.1596/978-0-8213-8591-3
FAO. (2012). The State of Food and Agriculture: Investing in Agriculture for a Better Future. FAO Bulletin (pp. 25-26).
French, H. W. (2014). China’s second continent: How a million migrants are building a new empire in Africa (p. 24). New York: Knopf.
Friis, C., & Nielsen, J. Ø. (2016). Small-scale land acquisitions, large-scale implications: exploring the case of Chinese banana investments in northern Laos. Land Use Policy, 57, 117-129. https://doi.org/10.1016/ j.landusepol.2016.05.028
Gallagher, K. (2010). China and the future of Latin American industrialization. Issues in Brief, 18, 3-4.
Gerdtham, U. G., Lundborg, P., Lyttkens, C. H., & Nystedt, P. (2012). Do Socioeconomic Factors Really Explain Inequalities in Health? Applying a Twin Design to Standard Decomposition Analysis (Vol. 1, p. 21). Department of Economics, Lund University.
Grain, M.-A. J., Temper, L., Munguti, S., Matiku, P., Ferreira, H., Soares, W., … Mayer, A. (2014). The many faces of land grabbing. EJOLT Report No. 10 (p. 93).
Gray, D. (2019). China appropriates foreign and domestic land to build its rubber empire. Retrieved September 8, 2019, from http://ki-media.blogspot.ca/2009/01/china-appropriates-foreign-anddomestic.html
Great Power Survey. (2019). Why is it that 100,000 people from the Northeast own more than half of the agricultural market in the Russian Far East? Retrieved December 29, 2019, from https://mp.weixin.qq. com/s/-Febc-w3JmRAKCeo8KM8ag
Grimsditch, M. (2019). China’s investments in hydropower in the Mekong region: The Kamchay hydropower dam, Kampot, Cambodia. Washington D.C.: Bank Information Center. Retrieved September 10, 2019, from http://www.bicusa.org/en/Document.102893.pdf
Gu, J., & Carty, A. (2014). China and African development: Partnership not mentoring. Institute of Development Studies Bulletin, 45(4), 57-69. https://doi.org/10.1111/1759-5436.12093
Gunter, L. F. (1986). Wage Determination for Regular Hired Farm Workers: An Empirical Analysis for Georgia. Southern Journal of Agricultural Economics, 12, 197-206. https://doi.org/10.1017/S0081305200006245
Guo, S., & Chu, J. (2019). Chinese agricultural engagements in Zambia: A grassroots analysis. SAIS China Africa Research Initiative, No. 04/2015. Retrieved September 10, 2019, from https://saiscari.files.wordpress. com/2014/10/sais-cari-brief-4-january-2015.pdf
Hall, R. (2012). The next Great Trek? South African commercial farmers move north. The Journal of Peasant Studies, 39(3-4), 823-843. https://doi.org/10.1080/03066150.2012.677037
Hamenoo, S. V. Q., Adjei, P. O., & Obodai, J. (2018). Households’ Coping Dynamics in Response to Large-Scale Land Acquisition for Jatropha Plantations: Evidence from Asante Akim North District of Ghana. Global Social Welfare, 5, 225-241. https://doi.org/10.1007/s40609-017-0101-9
Huang, P. C. (2010). China’s Hidden Agricultural Revolution. Rural China, 8(1), 1-10. https://doi.org/10.1163/ 22136746-12341234
International Rivers. (2019). Benchmarking the policies and practices of international hydropower companies. Retrieved September 10, 2019, from https://www.internationalrivers.org/files/attached-files/benchmarking_ report_english_part_a.pdf
Ji, Y. (2017). Research on Heilongjiang Province’s Agricultural Cooperation with Russia (Master thesis, Heilongjiang University).
Jiang, X., Chen, Y., & Wang, L. (2018). Can China’s Agricultural FDI in Developing Countries Achieve a Win-Win Goal?—Enlightenment from the Literature. Sustainability, 11(1), 1-22. https://doi.org/10.3390/ su11010041
Kaarhus, R. (2018). Land, investments and public-private partnerships: What happened to the Beira Agricultural Growth Corridor in Mozambique? Journal of Modern African Studies, 56(1), 87-112. https://doi.org/ 10.1017/S0022278X17000489
jas.ccsenet.org Journal of Agricultural Science Vol. 12, No. 4; 2020
47
Kalinina, I. V., & Solovchenkov, S. A. (2017). Non-standard rural employment in Jewish Autonomous Oblast. Regional issues, 20, 46-54.
Kandel, W. (2008). Profile of Hired Farmworkers: A 2008 Update. Economic Research Report (No. 60, p. 24). Washington, DC: USDA.
Koreneva, S. (2019). Chinese experiment field. Retrieved December 23, 2019, from: https://takiedela.ru/2019/ 12/kitayskoe-pole-yeksperimentov
KPMG. (2016). Investment attractiveness of the agricultural sector of the Far East (p. 4).
Kubny, J., & Voss, H. (2014). Benefitting from Chinese FDI? An assessment of vertical linkages with Vietnamese manufacturing firms. International Business Review, 23(4), 731-740. https://doi.org/10.1016/ j.ibusrev.2013.11.002
Kubny, J., & Voss, H. (2019). The impact of Chinese outward investment: Evidence from Cambodia and Vietnam. EU-China Civil Society Portal. Retrieved September 8, 2019, from http://www.eu-china.net/ upload/pdf/materialien/11-0302_Impact%20of%20chinese%20outward%20investment.pdf
Liu, Y., Suhrob, S., & Antonyuk, I. (2018). Prospects for Sino-Russian Agricultural Cooperation under the Background of Western Countries’ Economic Sanctions. Markets and Trade-Agricultural Economy, 1, 135-136.
Luan, S. (2005). Research on Heilongjiang Province’s Agricultural Cooperation with Russian Far East. Siberian Studies, 32, 39-41.
Malone, A. (2019). How China’s Taking over Africa, and Why the West Should Be Very Worried. Daily Mail Online. Retrieved September 5, 2019, from http://www.nikela.org/wp-content/uploads/2011/08/How-China- is-Taking-over-Africa-Why-West-should-be-worried-Andrew-Malone-07-08.pdf
Mishchuk, S. (2016). Russian-Chinese Agricultural Cooperation in the Russian Far East. Regional Research in Russia, 6, 59-69. https://doi.org/ 10.1134/S2079970516010093
Mishchuk, S. (2017). The use of Chinese workers in the Far East becomes less effective. Retrieved November 25, 2019, from http://febras.ru/kontakty/64-uncategorised/2017/3801-01-02-2017-ispolzovanie-kitajskikh-rabot nikov-na-dv-stanovitsya-menee-effektivnym-podrobnee.html
Mishchuk, S. (2018). Interestingly, at least someone imagines what will happen to the Far East in 20 years? Retrieved from https://fedpress.ru/personal-view/2027857
Mol, A. P. (2011). China’s ascent and Africa’s environment. Global Environmental Change, 21(3), 785-794. https://doi.org/10.1016/j.gloenvcha.2011.03
Morea, D., & Balzarini, M. (2018). Financial sustainability of a public-private partnership for an agricultural development project in Sub-Saharan Africa. Agricultural Economics-Czech, 64(9), 389-398. https://doi.org/ 10.17221/161/2017-AGRICECON
Motrich, E. L., & Naiden, S. N. (2015). Migration processes in the socioeconomic development of the Far East. Studies on Russian Economic Development, 26(5), 491-498. https://doi.org/10.1134/S1075700715050093
Munson, P., & Zheng, R. (2012). Feeding the dragon: Managing Chinese resource acquisition in Africa (p. 15). USAID Asia, Vermont Law School, US-China Partnership for Environmental Law.
Naylor, R. (2011). Expanding the boundaries of agricultural development. Food Security, 3(2), 233-251. https://doi.org/10.1007/s12571-011-0123-6
Nolte, K. (2014). Large-scale agricultural investments under poor land governance in Zambia. Land Use Policy, 38, 698-706, https://doi.org/10.1016/j.landusepol.2014.01.014
Nonfodji, P. (2019). China’s farmland rush in Benin: Toward a win-win economic model of cooperation (Vol. 8). Presented at the International Conference on Global Land Grabbing. Retrieved September 8, 2019, from http://www.iss.nl/fileadmin/ASSETS/iss/Documents/Conference_papers/LDPI/27_PAULETTE_NONFODJI.pdf
Nzabuheraheza, F. D., & Nyiramugwera, A. N. (2017). Food security status in developing countries: A case study of Burera and Musanze Districts of Rwanda. African Journal of Food, Agriculture, Nutrition and Development, 17(3), 12413-12426. https://doi.org/10.18697/ajfand.79.15460
jas.ccsenet.org Journal of Agricultural Science Vol. 12, No. 4; 2020
48
Ogeto, R. M., Cheruiyot, E., Mshenga, P., & Onyari, C. N. (2013). Sorghum production for food security: A socioeconomic analysis of sorghum production in Nakuru County, Kenya. African Journal of Agricultural Research, 8(47), 6055-6067.
Onphanhdala, P., Suruga, T., Daigaku, K., & Kenkyūka, K. K. (2019). Chinese outward FDI in agriculture and rural development: Evidence from Northern Laos. GSICS Working Paper Series 25. Retrieved September 9, 2019, from http://www.research. kobe-u.ac.jp/gsics-publication/gwps/2013-25.pdf
Oyono, P. R. (2005). The foundations of the Conflit de Langage over land and forests in Southern Cameroon. African Study Monographs, 26(3), 115-144.
Pitcher, M. A. (2008). Transforming Mozambique: The Politics of Privatization, 1975-2000 (pp. 1-320). Cambridge University Press: Cambridge, UK.
Porsani, J., Caretta, M. A., & Lehtilä, K. (2019). Large-scale land acquisitions aggravate the feminization of poverty: Findings from a case study in Mozambique. Geo Journal, 84, 215-236. https://doi.org/10.1007/ s10708-017-9836-1
Raymond, J., Kassim, N., Rose, J. W., & Morris, A. (2018). Context-specific food-based approach for ensuring nutrition security in developing countries: A review. International Journal of Food Sciences and Nutrition, 69(4), 410-416. https://doi.org/10.1080/09637486.2017.1373751
Rivera Ballesteros, A. (2019). Desarrollo de infraestructura en transporte en México a partir de la inversión China. In E. D. Peters (Eds.), América Latina y El Caribe-China. Economía, Comercio e Inversiones (pp. 273-292). México: RED ALC-CHINA, UDUAL, UNAM, Cechimex. Retrieved September 10, 2019, from http://www.dusselpeters.com/63.pdf
Robertson, B., & Andersen, P. (2010). Global land acquisition: neo-colonialism or development opportunity? Food Security, 2(10), 271-283. https://doi.org/10.1007/s12571-010-0068-1
ROSSTAT. (2019). Federal State Statistics Service: Per capita income in the regions of the Russian Federation 2013-2017. Retrieved August 14, 2019, from http://www.gks.ru/free_doc/new_site/population/urov/ urov_11sub.htm
Rowlatt, J. (2019). Chinese chicken farmers ruffle Zambian feathers. BBC News. Retrieved September 10, 2019, from http://news.bbc.co.uk/2/hi/programmes/from_our_own_ correspondent/9386678.stm
Rubinstein, C. (2009). China’s eye on African agriculture. Asia Times. Retrieved September 9, 2019, from http://www.atimes.com/atimes/China_Business/KJ02Cb01.html
Rulli, M., Saviori, A., & D’Odorico, P. (2013). Global land and water grabbing. Proceedings of the National Academy of Sciences of the United States of America, 110(3), 892-897. https://doi.org/10.1073/pnas. 1213163110
Ryzhova, N. (2014). National border, administrative rent and informality: Market entrance for Chinese traders and farmers. Eurasia Border Review, 5, 77-94.
Samy, Y. (2010). China’s Aid Policies in Africa: Opportunities and Challenges. The Commonwealth Journal of International Affairs, 99(406), 75-90. https://doi.org/10.1080/00358530903513756
Sayila, A. (2019). Chinese blamed for problems in Zambian poultry industry. World Poultry, 22. Retrieved September 10, 2019, from http://www.worldpoultry.net/PageFiles/32063/001_boerderij-downloadWP6486 D01.pdf
Shen, X. (2019). Private Chinese investment in Africa: Myths and realities. Diplomatic Policy Review, 33(1), 83-103. Retrieved September 8, 2019, from http://onlinelibrary.wiley.com/store/10.1111/dpr.12093/asset/ dpr12093.pdf?v=1andt=ijjhp7qeands=3732100 660f5906bd4db5328b48e52bcdc49c914
Solovchenkov, S. A., Kalinina, I. V., & Mishchuk, S. N. (2019). Migrant Perception by the Host Community Jewish Autonomous Region Countryside. Power and Management in the East of Russia, 3, 81-91. https://doi.org/10.22394/1818-4049-2019-88-3-81-91
Suhardiman, D., Giordano, M., Keovilignavong, O., & Sotoukee, T. (2015). Revealing the hidden effects of land grabbing through better understanding of farmers’ strategies in dealing with land loss. Land Use Policy, 49, 195-202. https://doi.org/10.1016/j.landusepol.2015.08.014
The Economist. (2009). Outsourcing’s third wave: Buying farmland abroad. The Economist, 5, 4-6.

jas.ccsenet.org Journal of Agricultural Science Vol. 12, No. 4; 2020
49
Thondhlana, G. (2015). Land acquisition for and local livelihood implications of biofuel development in Zimbabwe. Land Use Policy, 49, 11-19, https://doi.org/10.1016/j.landusepol.2015.06.025
Validakis, V. (2019). 400 people march in protest against Shenhua’s Watermark Coal project. Mining Australia. Retrieved September 10, 2019, from http://www.miningaustralia.com.au/news/400-peoplemarch-in-protest- against-shenhua-s-water
Vassilieva, A., & Akaha, T. (2005). Crossing National Borders: Human Migration Issues in Northeast Asia (pp. 68-71). United Nations University Press, Hong Kong.
Wan, W. (2019). The role of Chinese migrants in Russia in Sino-Russian technological and cultural exchanges. Global Scientific Potential-World Economics, 4, 221-223.
Wang, B., Mao, R., & Gou, Q. (2014). Overseas impacts of China’s outward direct investment: China’s outward direct investment. Asian Economic Policy Review, 9(2), 227-249. https://doi.org/10.1111/aepr.12065
Xu, X. L., Li, X. Y., Qi, G. B., Tang, L. X., & Mukwerezab, L. (2016). Science, Technology, and the Politics of Knowledge: The Case of China’s Agricultural Technology Demonstration Centers in Africa. World Development, 81, 82-91. https://doi.org/10.1016/j.worlddev.2016.01.003
Yan, H., & Sautman, B. (2010). Chinese farms in Zambia: From socialist to agro-imperialist engagement? African and Asian studies, 9(3), 307-333. https://doi.org/10.1163/156921010X515987
Zhou, J. (2012). Analysis of Russian immigration policy and its impact on Chinese immigrants. Siberian Studies, 39, 27-31.
Zhou, J. (2015). Chinese Agrarian Capitalism in the Russian Far East, BRICS Initiative for Critical Agrarian Studies (BICAS). BICAS Working Paper Series, 13, 23-30.
Zhu, D. (2019). Analysis and forecast of the situation of Russian-Chinese cooperation in agriculture. Problems of Russian Trade and Economic Cooperation Far East and Northeast China, Moscow.
Zoomers, A. (2010). Globalisation and the foreignisation of space: Seven processes driving the current global land grab. Journal of Peasant Studies, 37, 429-447. https://doi.org/10.1080/03066151003595325
Zuenko, I. (2016). Chinese presence in agriculture of the Far East: some aspects of the problem. Proceedings of the Oriental Institute 2015/2 (p. 26).
Appendix A
Questionnaire used during the study
(The questionnaire used in the study is available online at: https://drive.google.com/open?id=1BzL_5L0_MALu M7OW7cinSSHbW2BRsZ6b)
1. Farm type
Peasant type-farm
Household plot
Agricultural private limited company
2. Location
Krai:
Oblast:
Raion:
Distance to the closest Chinese farm (km) 2003: 2013: 2018:
Number of Chinese farms in 20 km distance from your farm in your region. (No.) 2003: 2013: 2018:
Number of Russian farms with Chinese workers employed in your region. (No.) 2003: 2013: 2018:
When did Chinese small individual farmers appear for the first time in your area? (Year)
When did Chinese big agricultural companies appear for the first time in your area? (Year)
3. Demography
Age of household head (years)
Sex (1. Male, 2. Female)
Does the head of household have professional agricultural degree? If yes, what degree is it? 1. Higher/2. High school/3. No degree).
Farming experience (years)
Household head’s working experience not in agriculture (years).
Total number of family members living on the farm (No.) 2003: 2013: 2018:

jas.ccsenet.org Journal of Agricultural Science Vol. 12, No. 4; 2020
50
Number of household members actively working on the farm (No.) 2003: 2013: 2018:
Number of household members not working at all (except head of household, students and pensioners (No.)
2003: 2013: 2018:
Family members who left the farm during the last 10 years (No.)
4. Land
Land owned (ha) 2003: 2013: 2018:
Land rented (ha) 2003: 2013: 2018:
Area cultivated (ha) 2003: 2013: 2018:
Land availability in 2018 (1.more available/2.less available than in 2003)
Market price of 1 ha of land used for agricultural production (RUB) 2003: 2013: 2018:
Renting/leasing price of 1ha of land for agricultural production paid by Russian farmers (RUB) 2003: 2013: 2018:
Amount of money paid by Chinese for renting 1ha of land in your area in RFE? (RUB) 2003: 2013: 2018:
Do you compete with Chinese when it comes to land leasing/renting? (1.Yes/2.No) 2003: 2013: 2018:
Have you ever heard about any places where soil is/was degraded by Chinese? (1.Yes/2.No)
If yes, how exactly (chemicals, foli residuals, crop rotation, others)
5. Agriculture production
Production type (You can chose more than 1 option: 1. arable farm, 2. livestock, 3. vegetables (green house), 4. others). All activities = 1, 2, 3, 4.
2003: 2013: 2018:
Approximate number of heads of milking cows 2003: 2013: 2018:
Approximate number of heads of beef 2003: 2013: 2018:
Approximate number of heads of pigs 2003: 2013: 2018:
Approximate number of heads of sheep and goats 2003: 2013: 2018:
Approximate number of heads of poultry 2003: 2013: 2018:
Approximate cultivated area of wheat (ha): 2003: 2013: 2018:
Approximate cultivated area of rye (hа): 2003: 2013: 2018:
Approximate cultivated area of oat (ha): 2003: 2013: 2018:
Approximate cultivated area of corn (ha): 2003: 2013: 2018:
Approximate cultivated soybean area (ha): 2003: 2013: 2018:
Are you interested in increasing soybean production? (1. Yes (in what percentage?), 2. No).
If not, what factors are limiting you?
What are your estimated soybean production costs? 2003: 2013: 2018:
Approximate cultivated rice area (ha): 2003: 2013: 2018:
Approximate cultivated potato area (ha): 2003: 2013: 2018:
Approximate annual milk production (l): 2003: 2013: 2018:
Approximate annual beef cattle production (t): 2003: 2013: 2018:
Approximate annual pigs production (t): 2003: 2013: 2018:
Approximate annual sheep and goats production (t): 2003: 2013: 2018:
Approximate annual poultry production (t): 2003: 2013: 2018:
Approximate annual wheat production (t): 2003: 2013: 2018:
Approximate annual rye production (t): 2003: 2013: 2018:
Approximate annual oat production (t): 2003: 2013: 2018:
Approximate annual corn production (t): 2003: 2013: 2018:
Approximate annual soybean production (t): 2003: 2013: 2018:
Approximate annual rice production (t): 2003: 2013: 2018:
Approximate annual potato production (t): 2003: 2013: 2018:
Approximate annual cucumber production (t): 2003: 2013: 2018:
Approximate annual tomato production (t): 2003: 2013: 2018:
Did you change anything on your farm or in animal/plant production because of Chinese present? (1.Yes (what and when exactly?)/2.No)
Are Chinese influencing your production? (1. Influence positively/2. Influence negatively/3. There is no influence).
If 1. Influence positively or 2. Influence negatively-what impact is it? Give an example.
6. Labour
Full-time employees (working min 20 days/month and/or 10 months/year) (no.). If you are a household plot owner or you are not employing full-time workers, write down-0, please.
2003: 2013: 2018:
Part-time (seasonal) employees (no.). If you are a household plot owner or you are not employing full-time workers, write down-0, please.
2003: 2013: 2018:
Wage per hour per day for Chinese workers (RUB) (on your farm or in general in agriculture in RFE) 2003: 2013: 2018:
Wage per hour per day for Russian workers (RUB) (on your farm or in general in agriculture in RFE) 2003: 2013: 2018:

jas.ccsenet.org Journal of Agricultural Science Vol. 12, No. 4; 2020
51
Max no. of Chinese workers employed for at least 1 month/year (no.) If you are a household plot owner or you are not employing full-time Chinese workers, write down-0, please.
2003: 2013: 2018:
Max no. of Russian workers employed for at least 1 month/year (no.) If you are a household plot owner or you are not employing full-time Russian workers, write down-0, please.
2003: 2013: 2018:
Chinese workers availability in RFE’s agriculture (1. easily available/2. hardly available). 2003: 2013: 2018:
Russian workers availability in RFE’s agriculture (1. easily available/2. hardly available). 2003: 2013: 2018:
Who do you prefer to employ? (1. Russian/2. Chinese/3. No difference/ 4. I am household plot owner, the question does not refer to me).
2003: 2013: 2018:
Do you compete with Chinese farmers when seeking for employees? (1. Yes/2. No/3. I am household plot owner, the question does not refer to me).
2003: 2013: 2018:
Are Chinese influencing agricultural labour resources in RFE? (1. Influence positively/2. Influence negatively/3. There is no influence)
If 1. Influence positively or 2. Influence negatively-what impact is it? Give an example.
7. Production costs
Annual Diesel usage (l) 2003: 2013: 2018:
Annual production taxes (property, transport, land tax) total per year (RUB) 2003: 2013: 2018:
Annual equipment and maintenance expenses (RUB) 2003: 2013: 2018:
Annual fertilizers and chemicals expenses (RUB) 2003: 2013: 2018:
Annual land leasing expenses (RUB) 2003: 2013: 2018:
Investments (2003 = between 2003 and 2007, 2013 = 2009-2013/2018 = between 2014 and 2018) (RUB)
2003: 2013: 2018:
Are Chinese influencing agricultural production costs? (1. Influence positively/2. Influence negatively/3. There is no influence)
If 1. Influence positively or 2. Influence negatively-what impact is it? Give an example.
8. Living costs
Monthly food expenses (RUB) 2003: 2013: 2018:
How many family members are included in this amount of money? (No.) 2003: 2013: 2018:
Living costs other than food (water, electricity, gas, other household spending) -average per month (RUB)
2003: 2013: 2018:
What percent of food products do you buy that probably come from Chinese farms located in RFE or were imported from China? (%):
2003: 2013: 2018:
Are Chinese influencing your living costs? (1. Influence positively/2. Influence negatively/3. There is no influence)
If 1. Influence positively or 2. Influence negatively-what impact is it? Give an example.
9. Market
Did you or do you sell your products to Chinese retailers? (1. Yes, 2. No) 2003: 2013: 2018:
If yes, what kind of production did/do you sell to Chinese retailers? (If the question does not refer to you, please, write down-0).
2003: 2013: 2018:
If yes, what percentage is it of your production (0-100%)? (If the question does not refer to you, please, write down-0).
2003: 2013: 2018:
If yes, what percentage is it of your income (0-100%)? (If the question does not refer to you, please, write down-0).
2003: 2013: 2018:
Is the quality of food products on the market in 2018 better or worse than in 2003?
Are Chinese influencing market/selling of your agricultural goods? (1. Influence positively/2. Influence negatively/3. There is no influence)
If 1. Influence positively or 2. Influence negatively-what impact is it? Give an example.
Did you experience any problems when selling your products that are not related to Chinese farmers present in RFE?
10. Income of all family members
10. Monthly income of all family members living on the farm (RUB): 2003>>>up to RUB 40 000/from RUB 40 000 to RUB 60 000/ from RUB 60 000 to RUB 80 000/from RUB 80 000 to RUB 100 000/ from RUB 100 000 to RUB 250 000/from RUB 250 000 to RUB 500 000/ from RUB 500 000 to RUB 1 000 000/more than RUB 1 000 000
2003: 2013: 2018:
What is the percentage of your total income that comes from your farm? 2003: 2013: 2018:
Annual government support to the farm (RUB) 2003: 2013: 2018:
Bank loans, (1. Yes/2. No), if yes how much to be paid on Jan 1st 2003 and on Jan 1st 2018? 2003: 2013: 2018:
Were there any economic shocks in the last 10 years that probably influenced your farming business? (1. Yes/2. No). If yes, what kind of shocks were they?
Are Chinese influencing your income? (1. Influence positively/2. Influence negatively/3. There is no influence)
If 1. Influence positively or 2. Influence negatively-what impact is it? Give an example.
11. Well-being
Your life quality in 2018 in comparison to 2003: (1. Got better/2. Got worst/3. Did not change)

jas.ccsenet.org Journal of Agricultural Science Vol. 12, No. 4; 2020
52
Are Chinese influencing your well-being? (1. Influence positively/2. Influence negatively/3. There is no influence)
If 1. Influence positively or 2. Influence negatively-what impact is it? Give an example.
12. Health and security
Water quality (from 1-very low quality to 10-very high quality) 2003: 2013: 2018:
Are Chinese influencing your health and security? (1. Influence positively/2. Influence negatively/3. There is no influence)
If 1. Influence positively or 2. Influence negatively-what impact is it? Give an example.
13. Rural development
What is the impact of Chinese farmers on Russian agriculture in general? (from-10 (very bad impact) to + 10 (very good impact)).
2003: 2013: 2018:
Will Chinese help in developing rural areas in RFE?
14. Opinions
Have you ever talked to Chinese farmers? (1. Yes, 2. No)
What are advantages of Chinese present in RFE? (Chose 3 answers: land is used more effectively/they use new cultivation techniques/they use new husbandry techniques/cheaper and more available vegetables/there are no advantages, other advantages: )
What are disadvantages of Chinese present in RFE? (Chose 3 answers: Low production costs/overuse of chemicals/unhealthy production methods/unhealthy competition/land grabbing/there are no disadvantages, other disadvantages: )
Except land, labour, production costs and market share/access in what other areas are Russian farmers competing with Chinese farmers?
Are you prepared/do you feel confident to compete with Chinese small agricultural entrepreneurs and big companies? (1. Yes/2. No)
What kind of support would you need from the government to be able to compete with Chinese farmers operating in RFE? (Choose 3 options only: 1. stricter law/2. more inspections of Chinese farms/3. financial support from the government/4. low interest rates/5. tariffs on Chinese food/6. Others: ).
15. Estimated prices of agricultural products
Approximate price of 1l of milk (RUB) 2003: 2013: 2018:
Approximate price of 1 kg of beef cattle (RUB) 2003: 2013: 2018:
Approximate price of 1 kg of pigs (RUB) 2003: 2013: 2018:
Approximate price of 1 kg of sheep and goats (RUB) 2003: 2013: 2018:
Approximate price of 1 kg of poultry (RUB) 2003: 2013: 2018:
Approximate price of 1 kg of wheat (RUB) 2003: 2013: 2018:
Approximate price of 1 kg of rye (RUB) 2003: 2013: 2018:
Approximate price of 1 kg of oats (RUB) 2003: 2013: 2018:
Approximate price of 1 kg of corn (RUB) 2003: 2013: 2018:
Approximate price of 1 kg of soy (RUB) 2003: 2013: 2018:
Approximate price of 1 kg of rapeseed (RUB) 2003: 2013: 2018:
Approximate price of 1 kg of rice (RUB) 2003: 2013: 2018:
Approximate price of 1 kg of potatoes (RUB) 2003: 2013: 2018:
Approximate price of 1 kg cucumbers (RUB) 2003: 2013: 2018:
Approximate price of 1 kg tomatoes (RUB) 2003: 2013: 2018:
Questions to household plot farm owners only!
Household plot farm only-Did/do you work in agriculture? (1. Yes/2. No) 2003: 2013: 2018:
Household plot farm only-Did you work for Chinese before 2003? (1. Yes/2. No)
Household plot farm only-Did/do you work for Chinese between 2003 and 2018? (1. Yes/2. No)
Household plot farm only-Household head employed or unemployed (1. Yes/2. No) 2003: 2013: 2018:
Household plot farm only-Who do you prefer to work for? (1. For Russian farmer/2. For Chinese farmer/3. No difference)
2003: 2013: 2018:
Household plot farm only-Did/do you need to compete with Chinese when looking for a job? (1. Yes/2. No)
2003: 2013: 2018:
Household plot farm only-How presence of Chinese farms influence your employment? (Chose max. 3 options: they are cheaper, they steal jobs, they work harder, they work longer, they live in much worst conditions, they work illegally, Chinese do not have any influence my employment whatsoever, others: )
Thank you for your answers!
Copyrights
Copyright for this article is retained by the author(s), with first publication rights granted to the journal.
This is an open-access article distributed under the terms and conditions of the Creative Commons Attribution license (http://creativecommons.org/licenses/by/4.0/).